

A Novel Grouting Diffusion Monitoring System Based on ZigBee Wireless Sensor Network

Abstract
1. Introduction
2. Related Work
2.1. Current Research on Grouting Effectiveness Evaluation Methods
2.2. Current Status of Wireless Sensor Network Communication
3. Methodology
4. Hardware Design
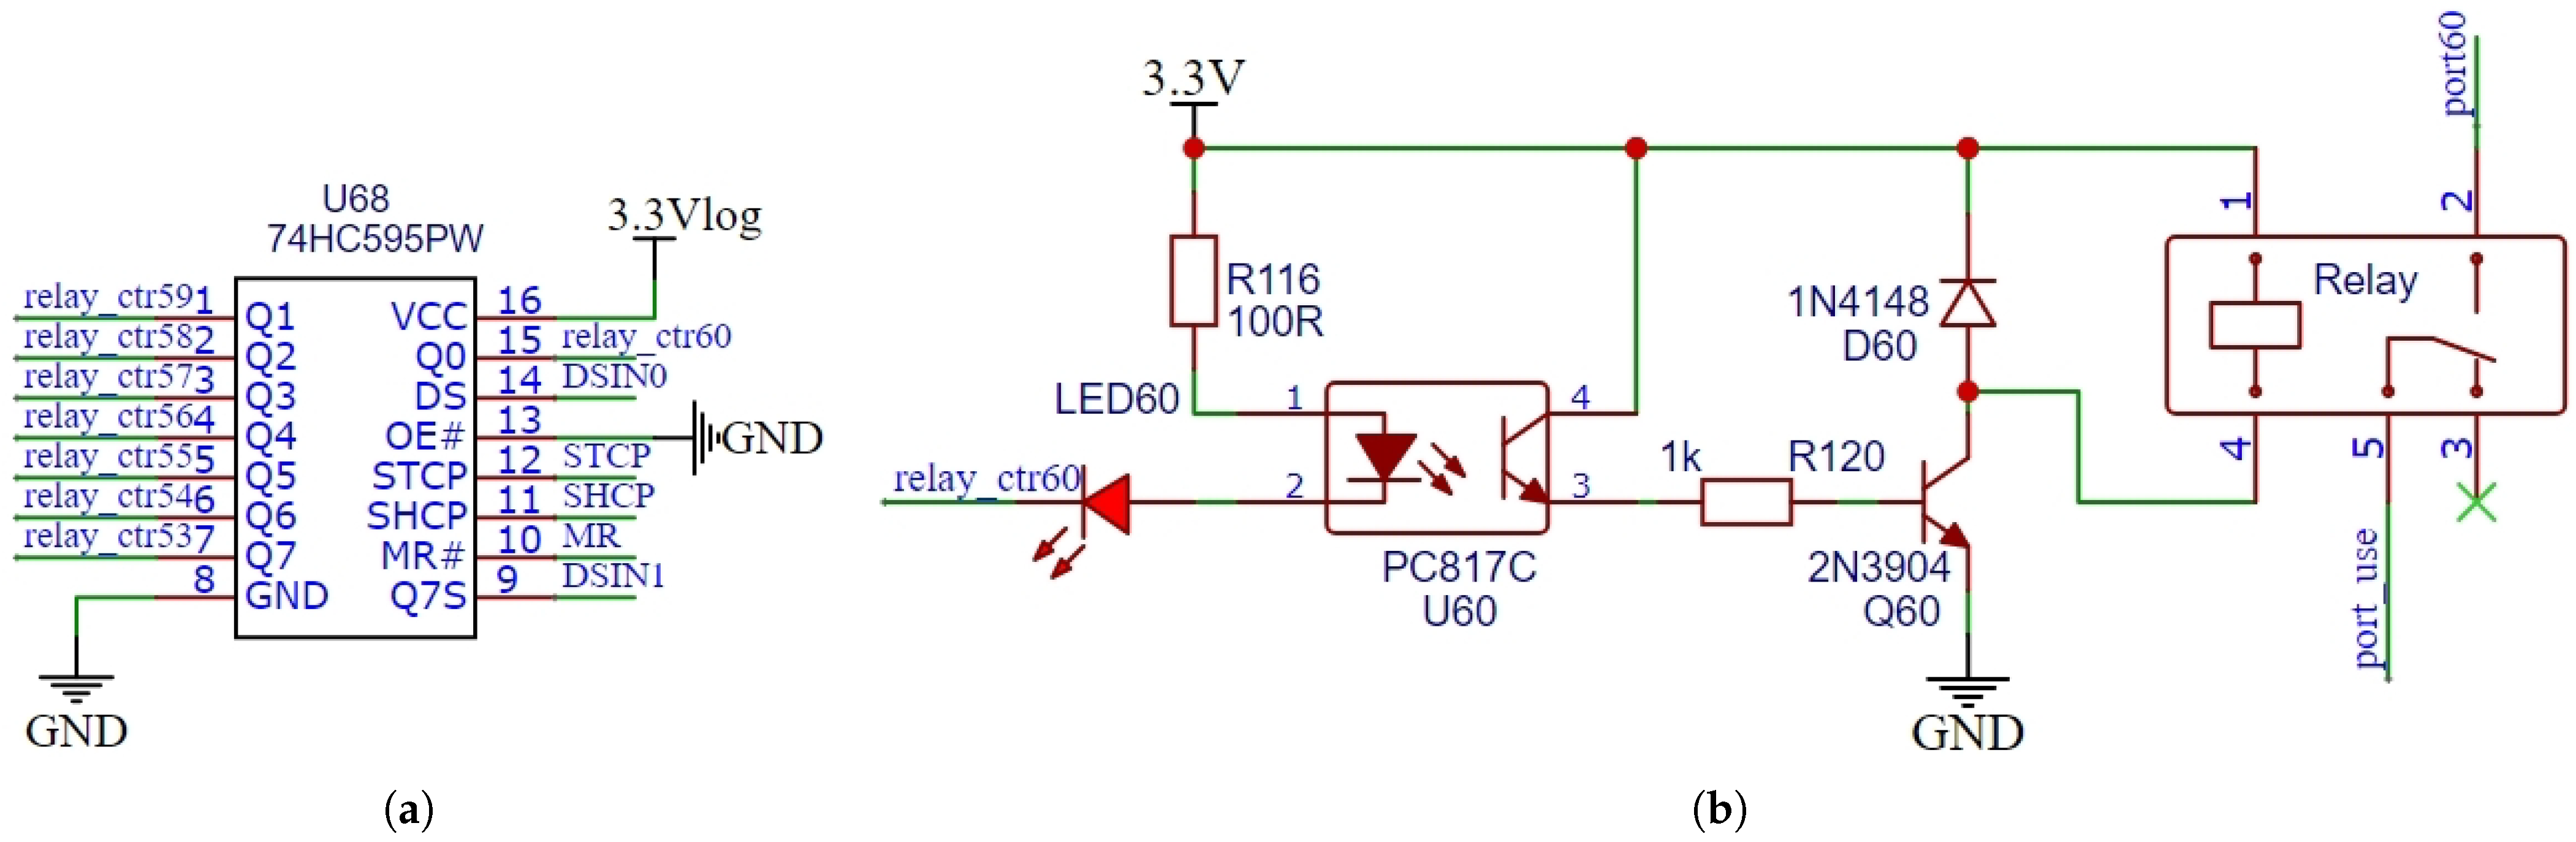
4.1. Relay Control Circuit
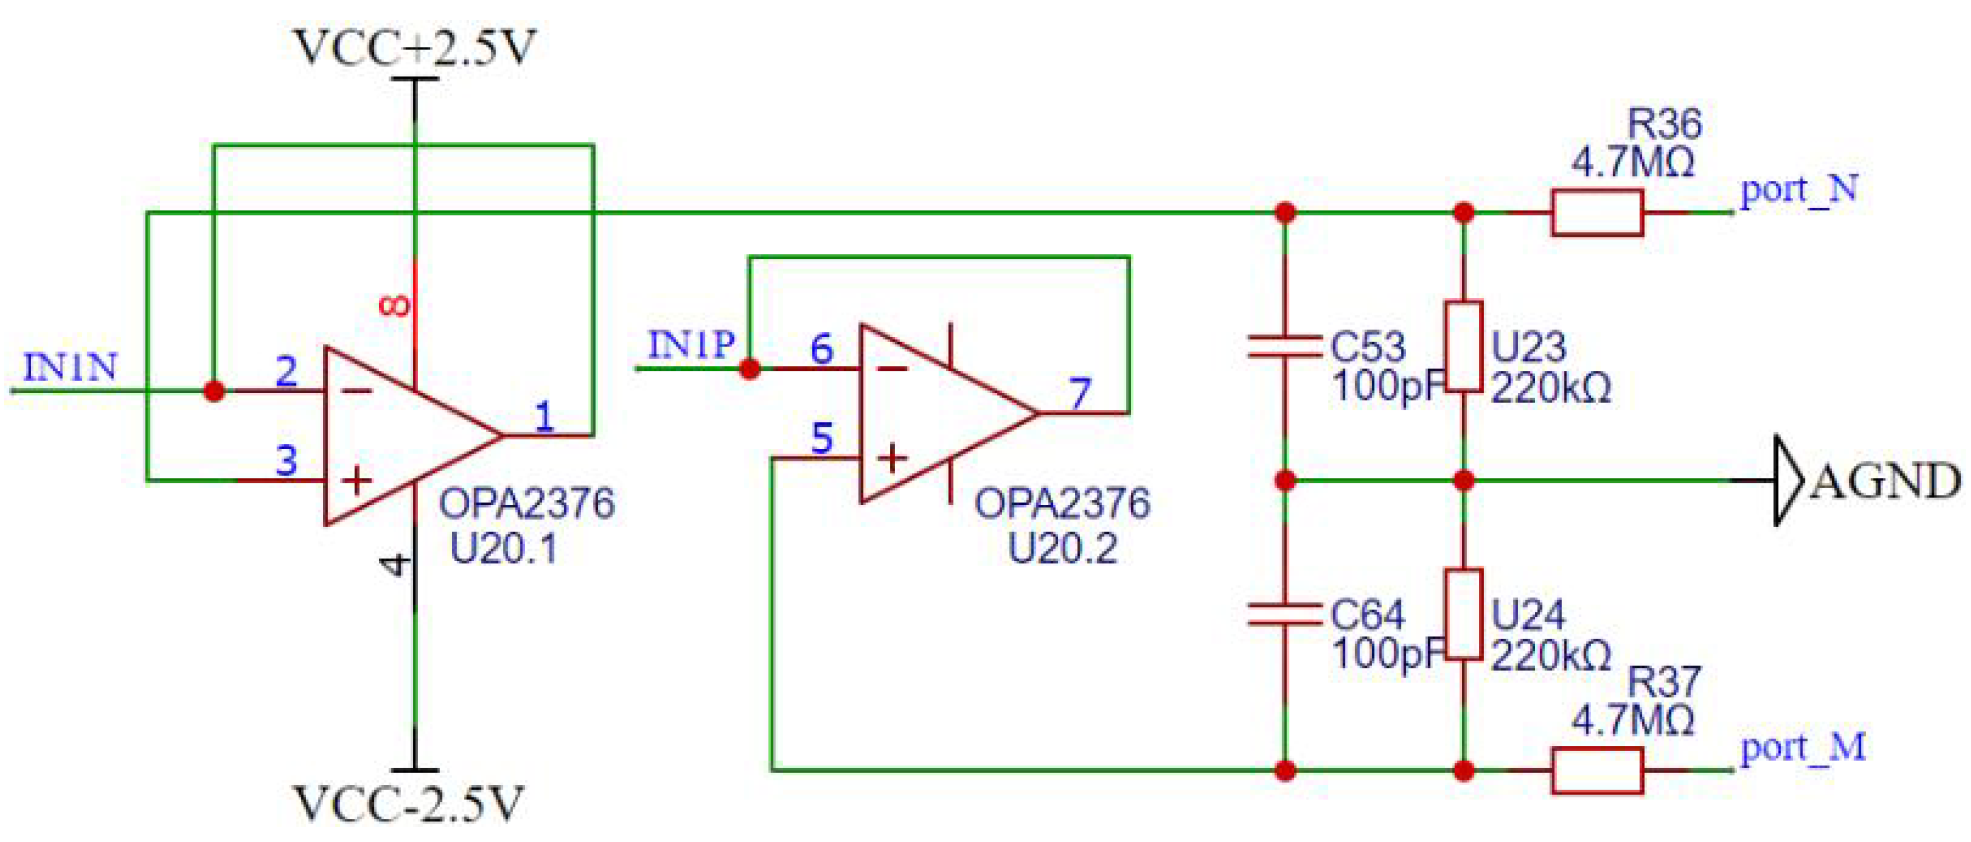
4.2. Analog-to-Digital Conversion Circuit
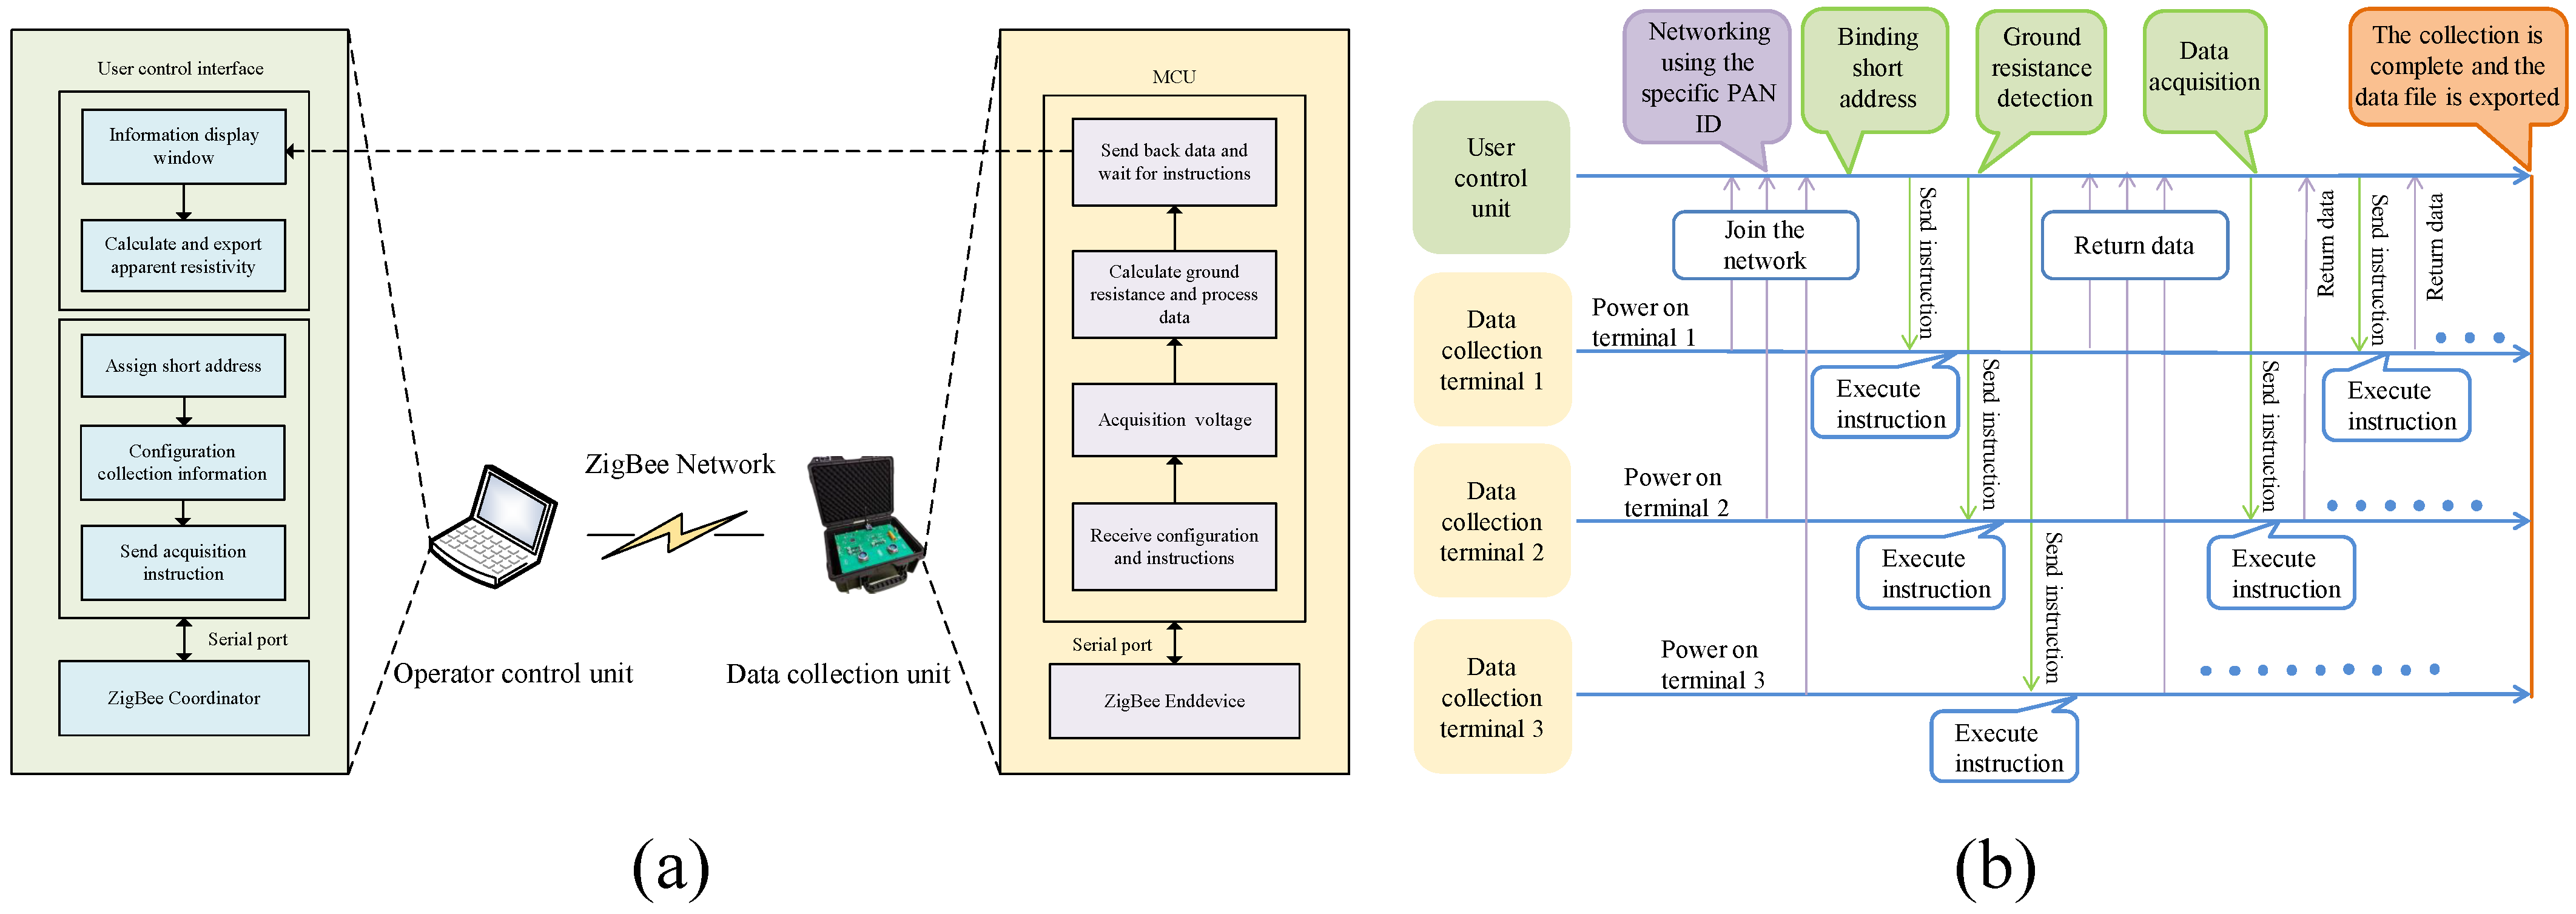
5. Software Design
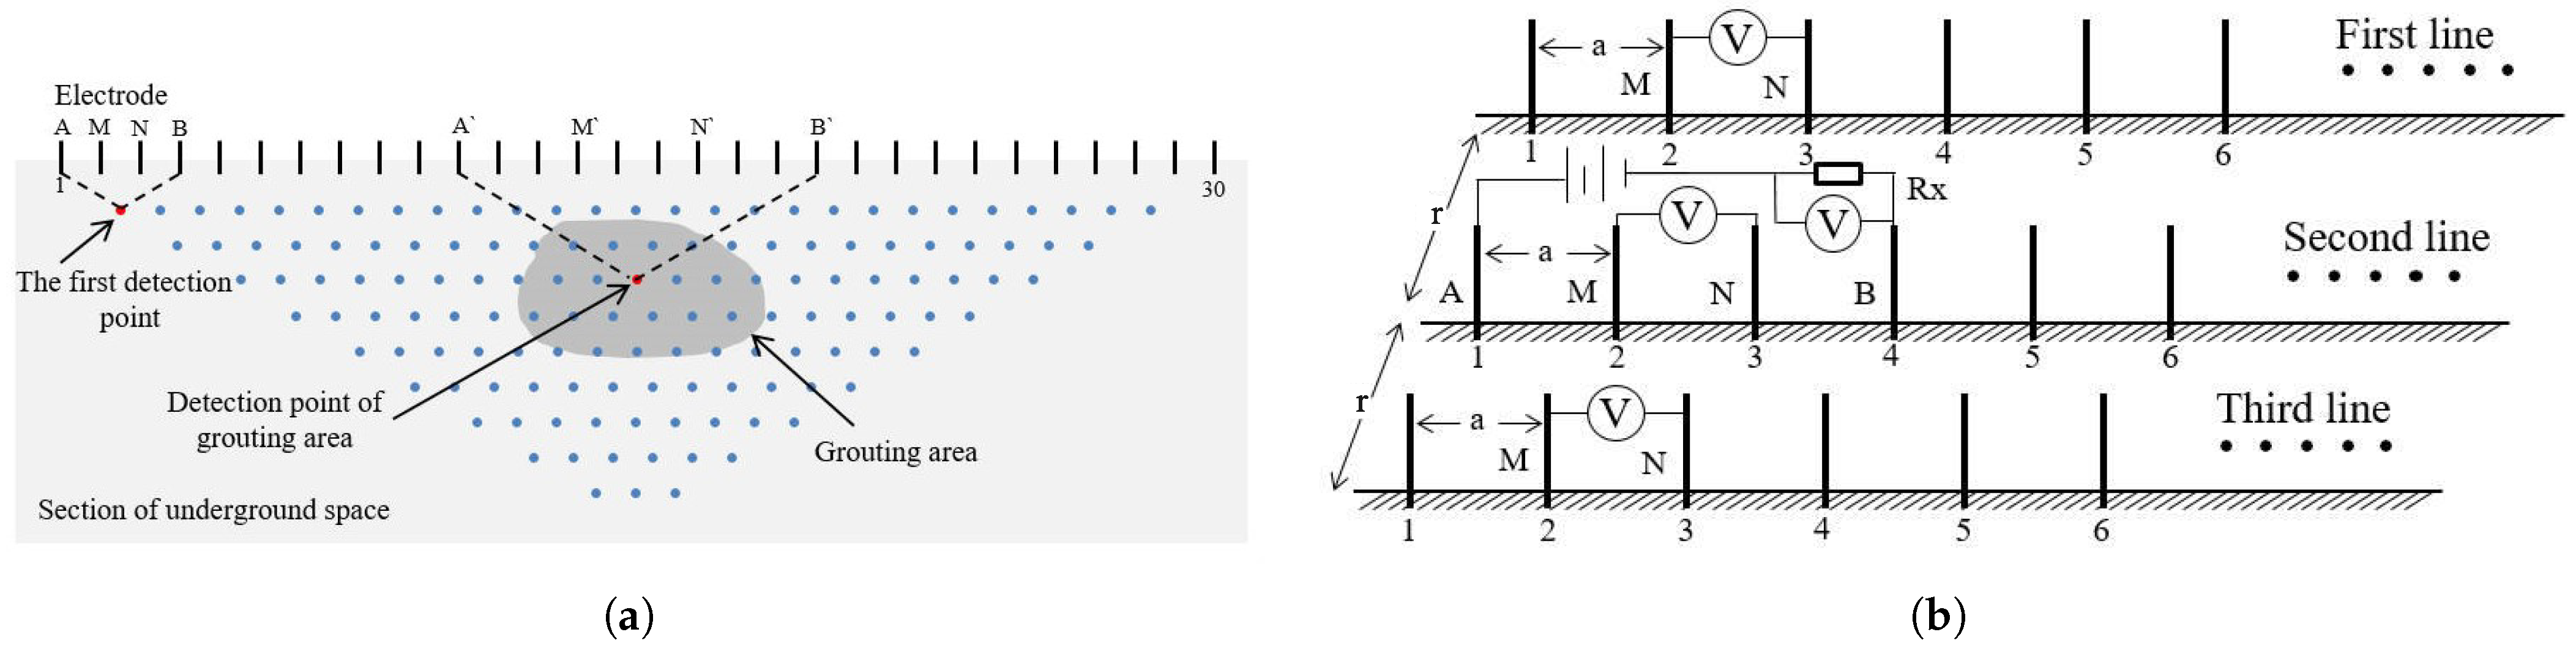
- The user controls the unit to send instructions A, M, N, and B of 1, 2, 3, 4 to the Data Acquisition Unit 2.
- Data Collection Unit 2 carries out commands to manage the relay assigning electrodes A, M, N and B to Positions 1 through 4. It collects voltage between the power supply voltage and and samples the resistance voltage before sending it to the operator control unit.
- The user control unit sends instructions with A, M, N, and B values of 0, 2, 3, and 0 to Data Collection Units 1 and 3 in sequence.
- Data Acquisition Units 1 and 3 execute instructions to control the relay to select M, with N electrodes being Electrodes 2 and 3, and collect voltage and between before sending it to the operator control unit.
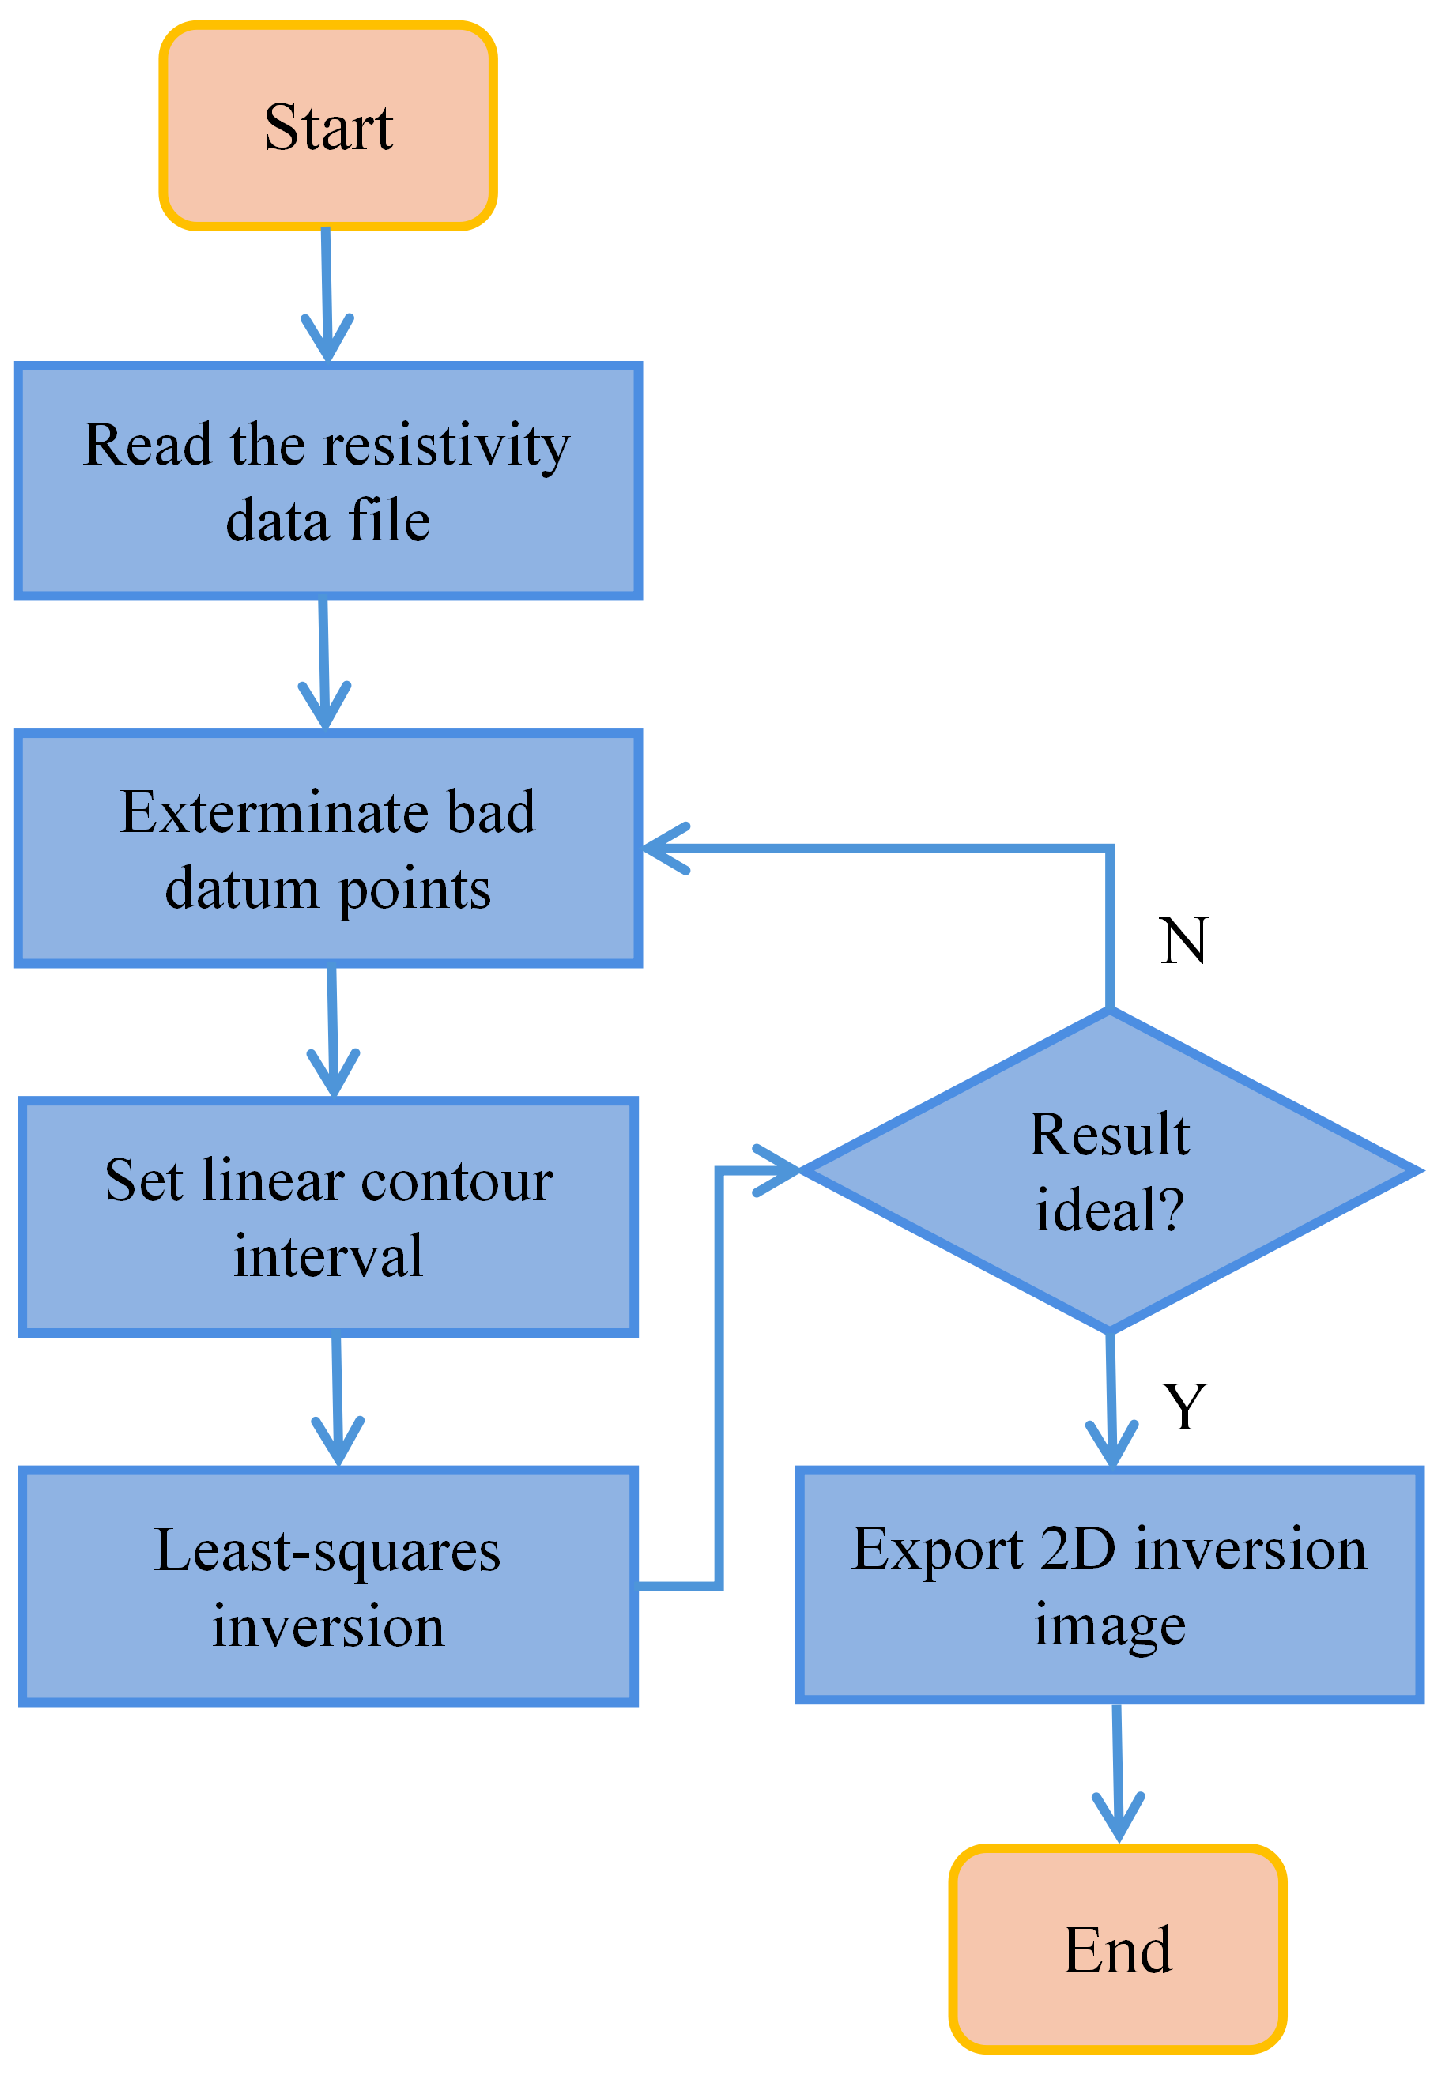
- After receiving , the user operates the unit in to obtain the output current I from the power supply. Then, the apparent resistivity collected by Data Acquisition Unit 2 is calculated using Equation (1), and the apparent resistivity collected by Data Acquisition Units 1 and 3 is calculated using Equation (2).
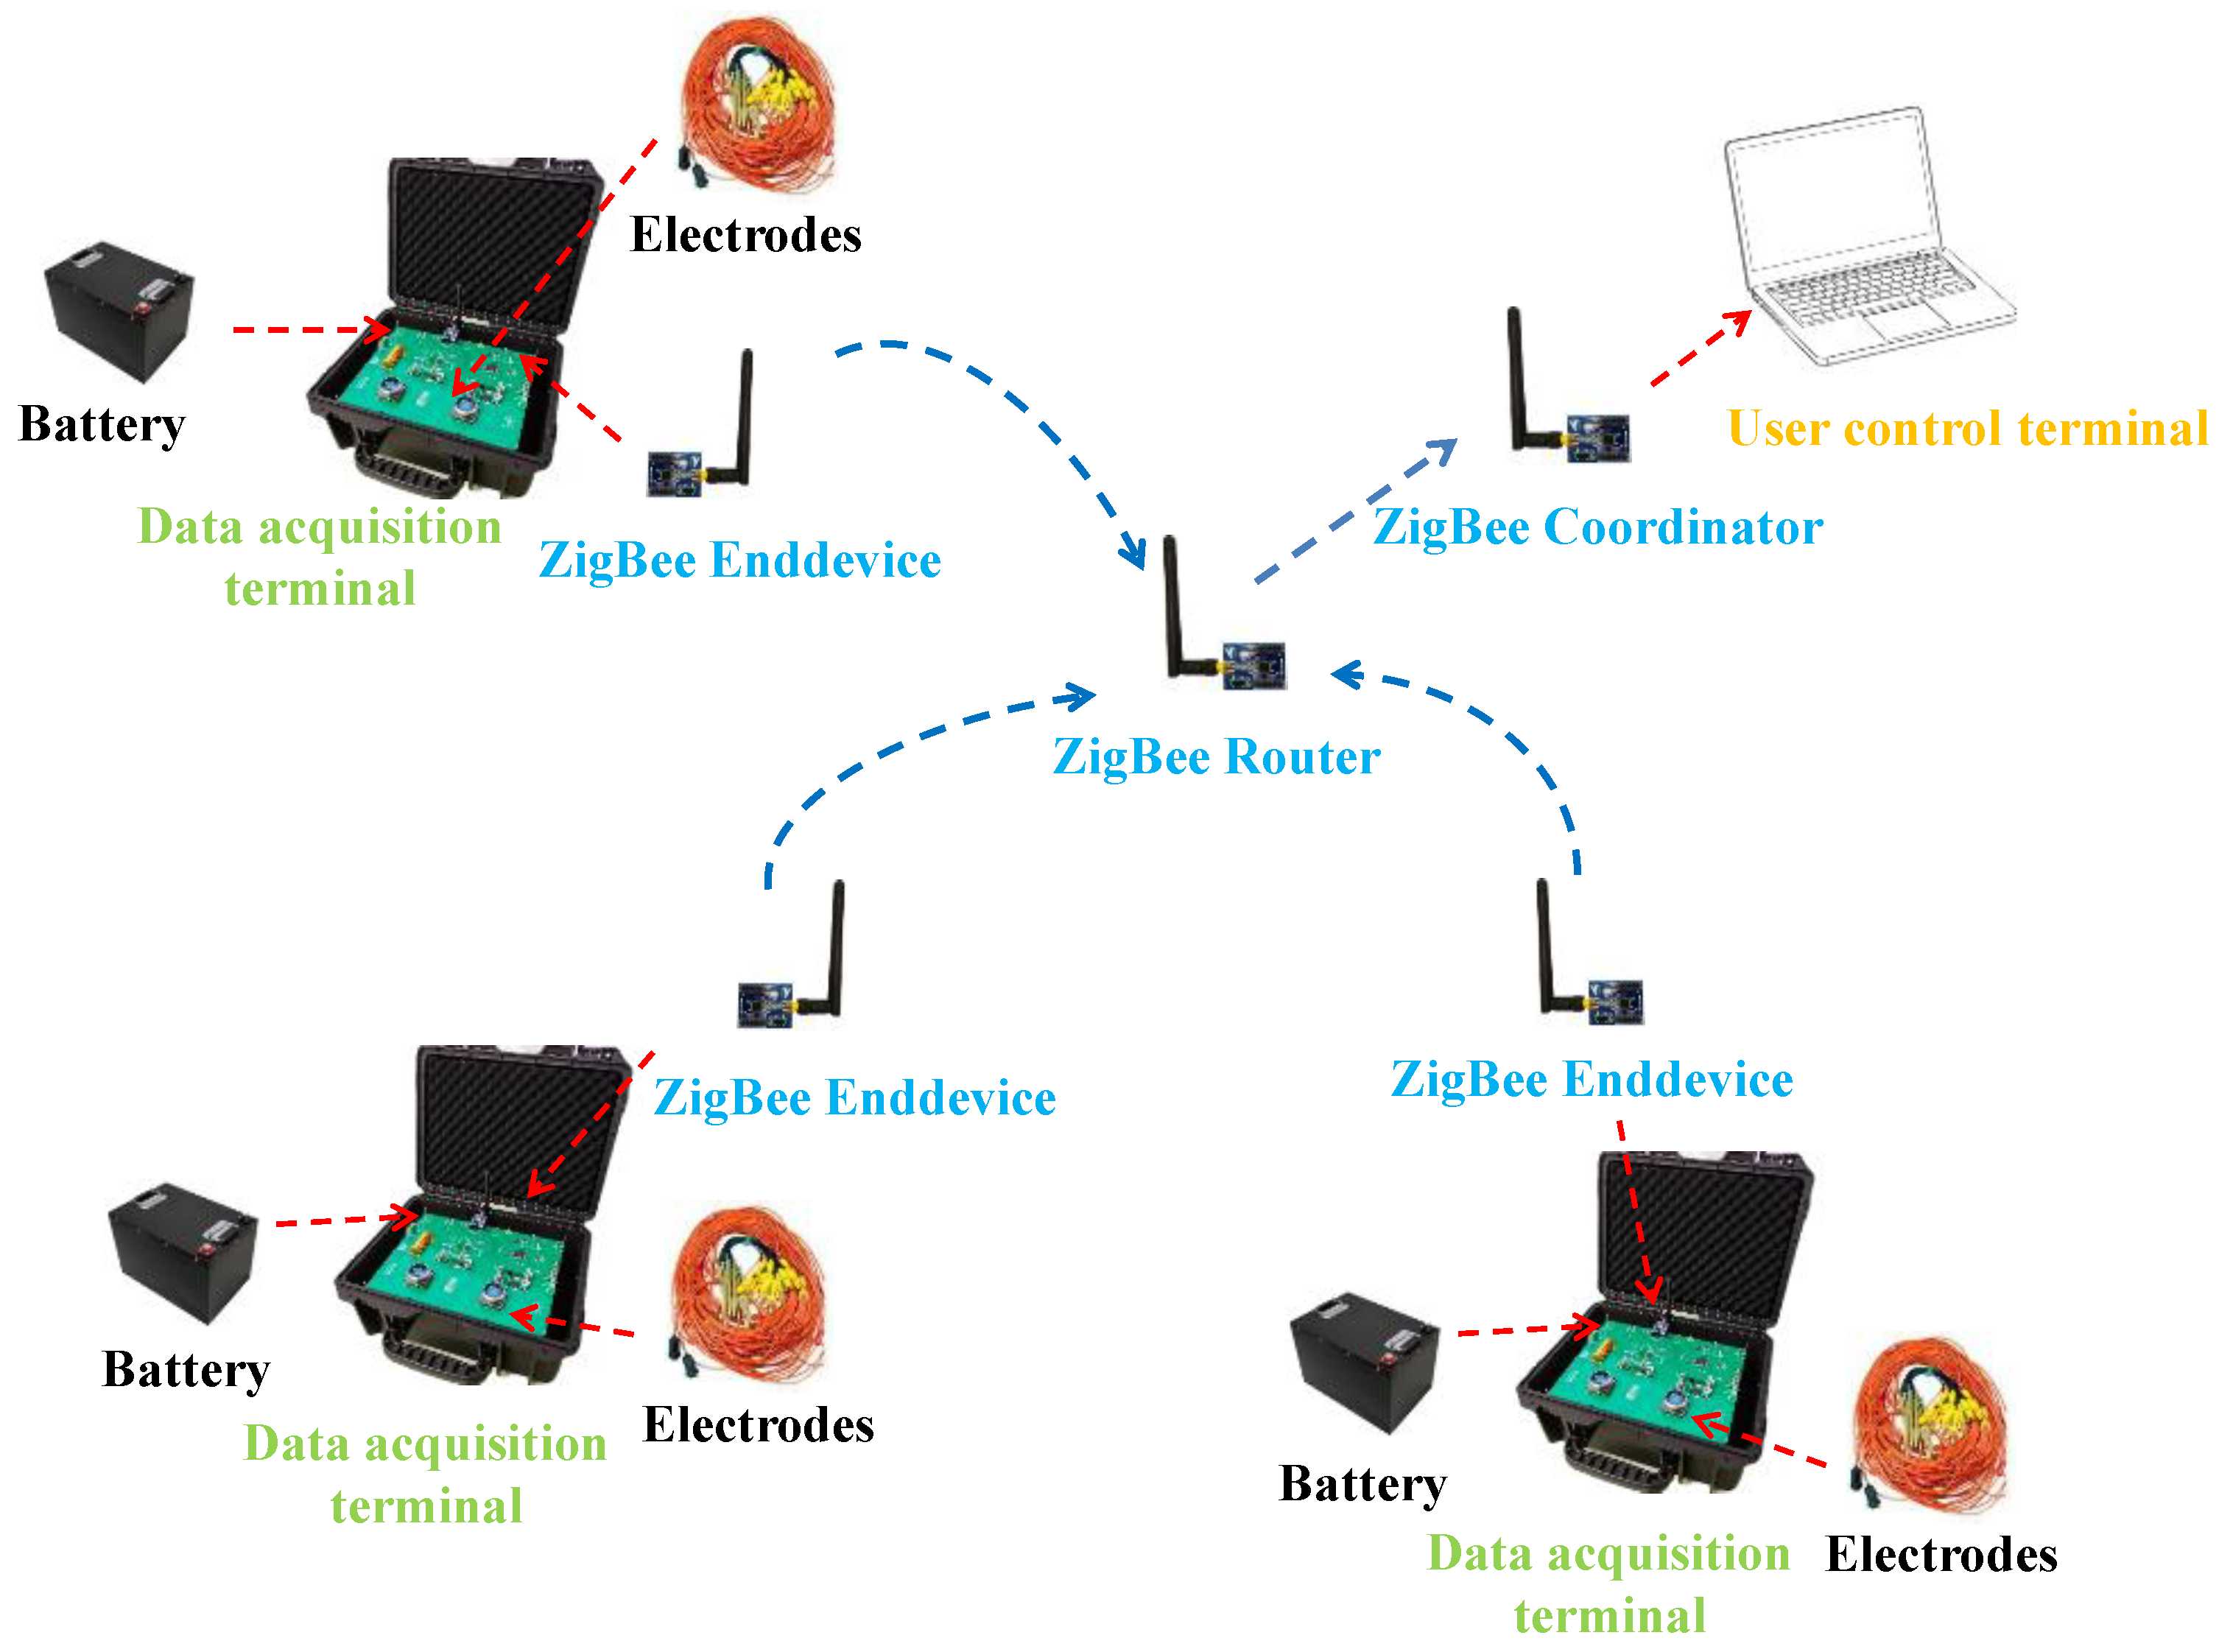
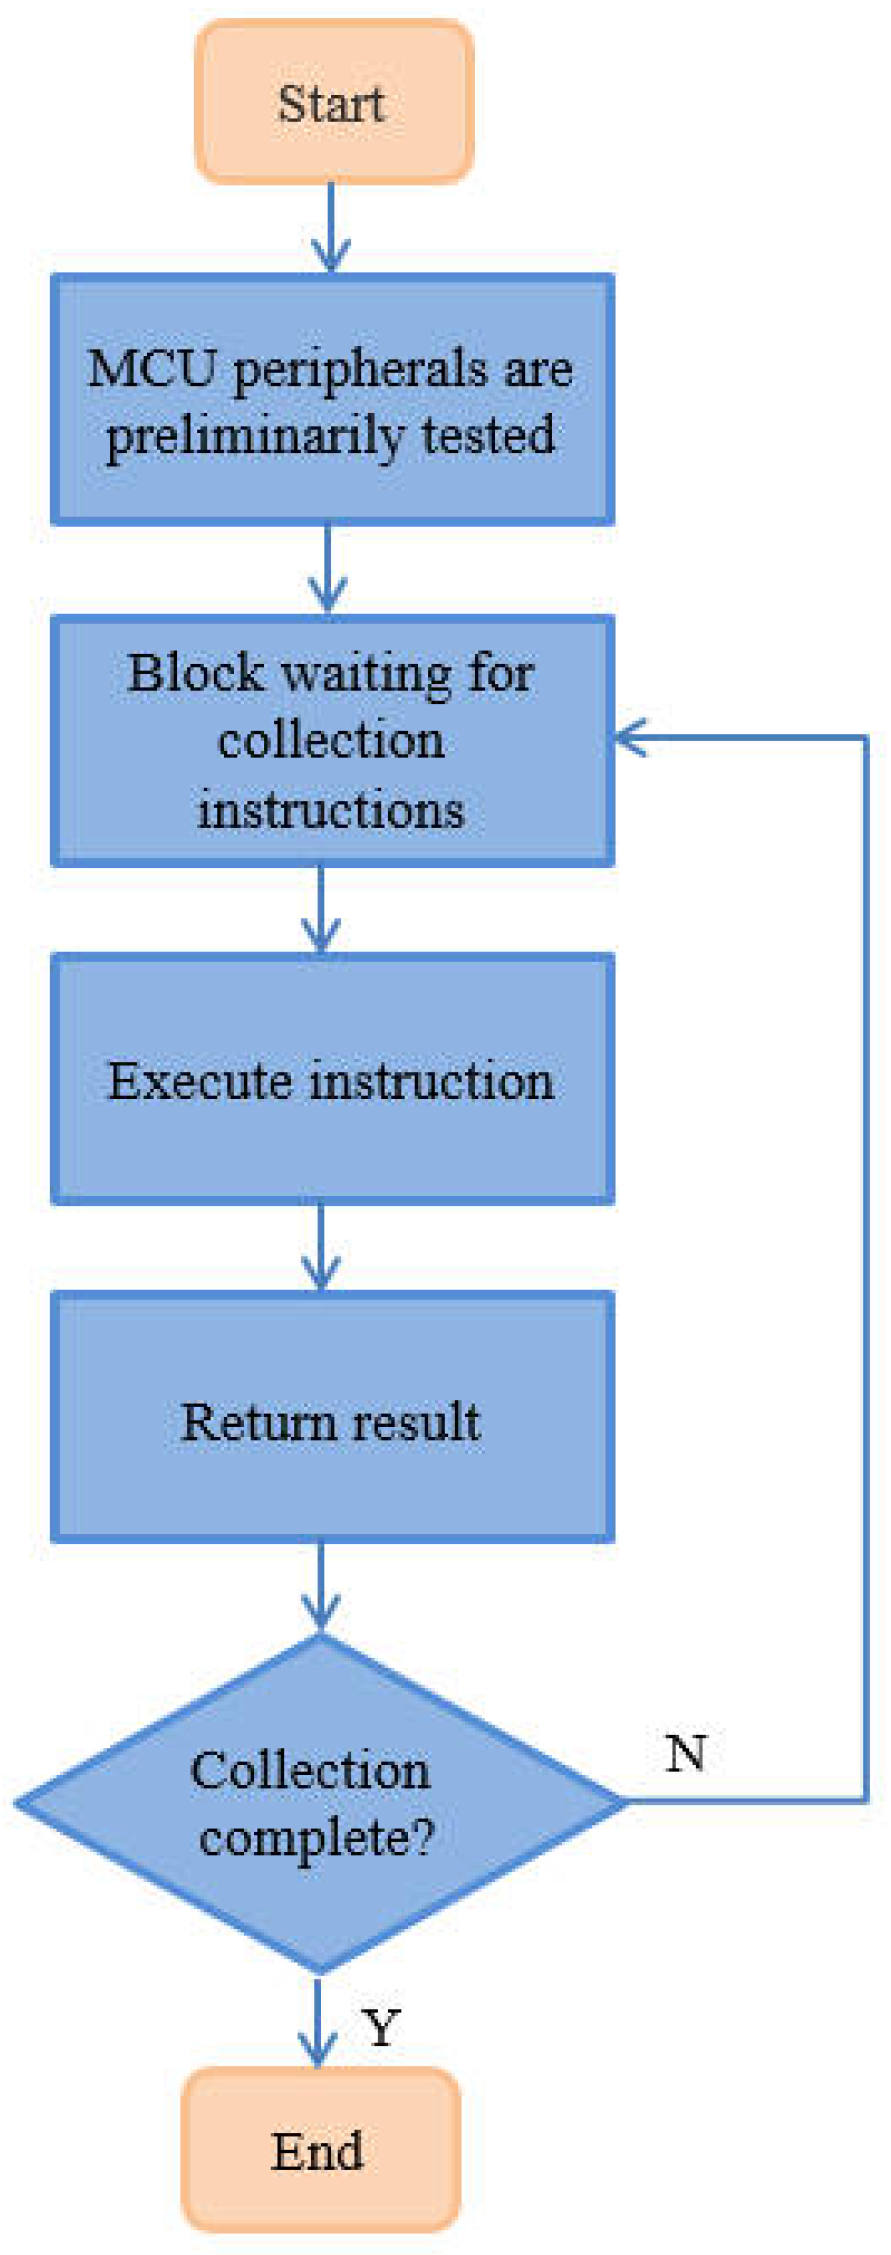
- Following the provided electrode number, the MCU calculates a 60-bit binary code for the 60 relays and sends the control signal to the 74HC595 via IO, enabling the relays associated with electrodes A, M, N, and B for acquisition purposes.
- The MCU reads the voltage values collected by the IN1, IN2, and IN3 channels of ADS131E08 through SPI communication. These three channels are for the electrode voltage , sampling resistor voltage , and discharge power supply voltage .
- and the output current I are measured from the battery pack using the voltage divider, then the data are transferred via the serial port to the ZigBee module, which forwards it to the operator control unit.
6. Test and Result
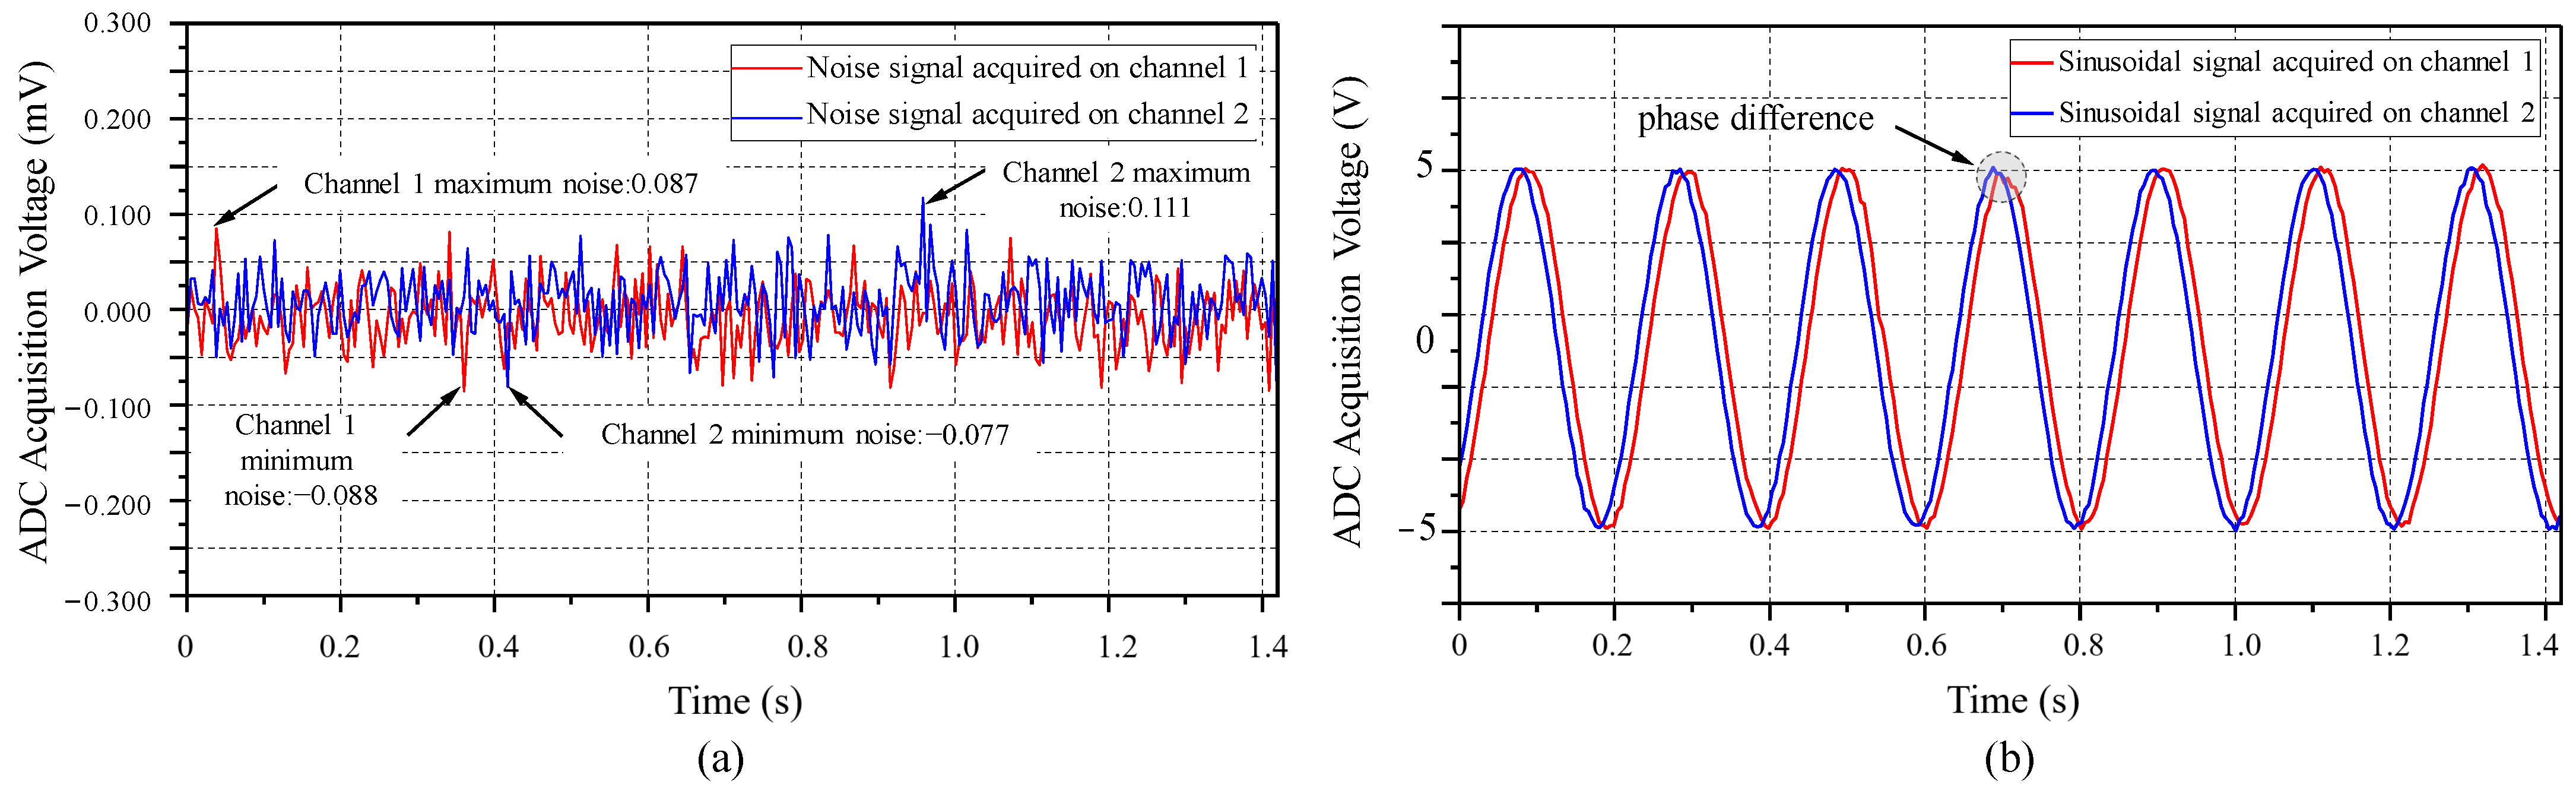
6.1. System Acquisition Performance Test
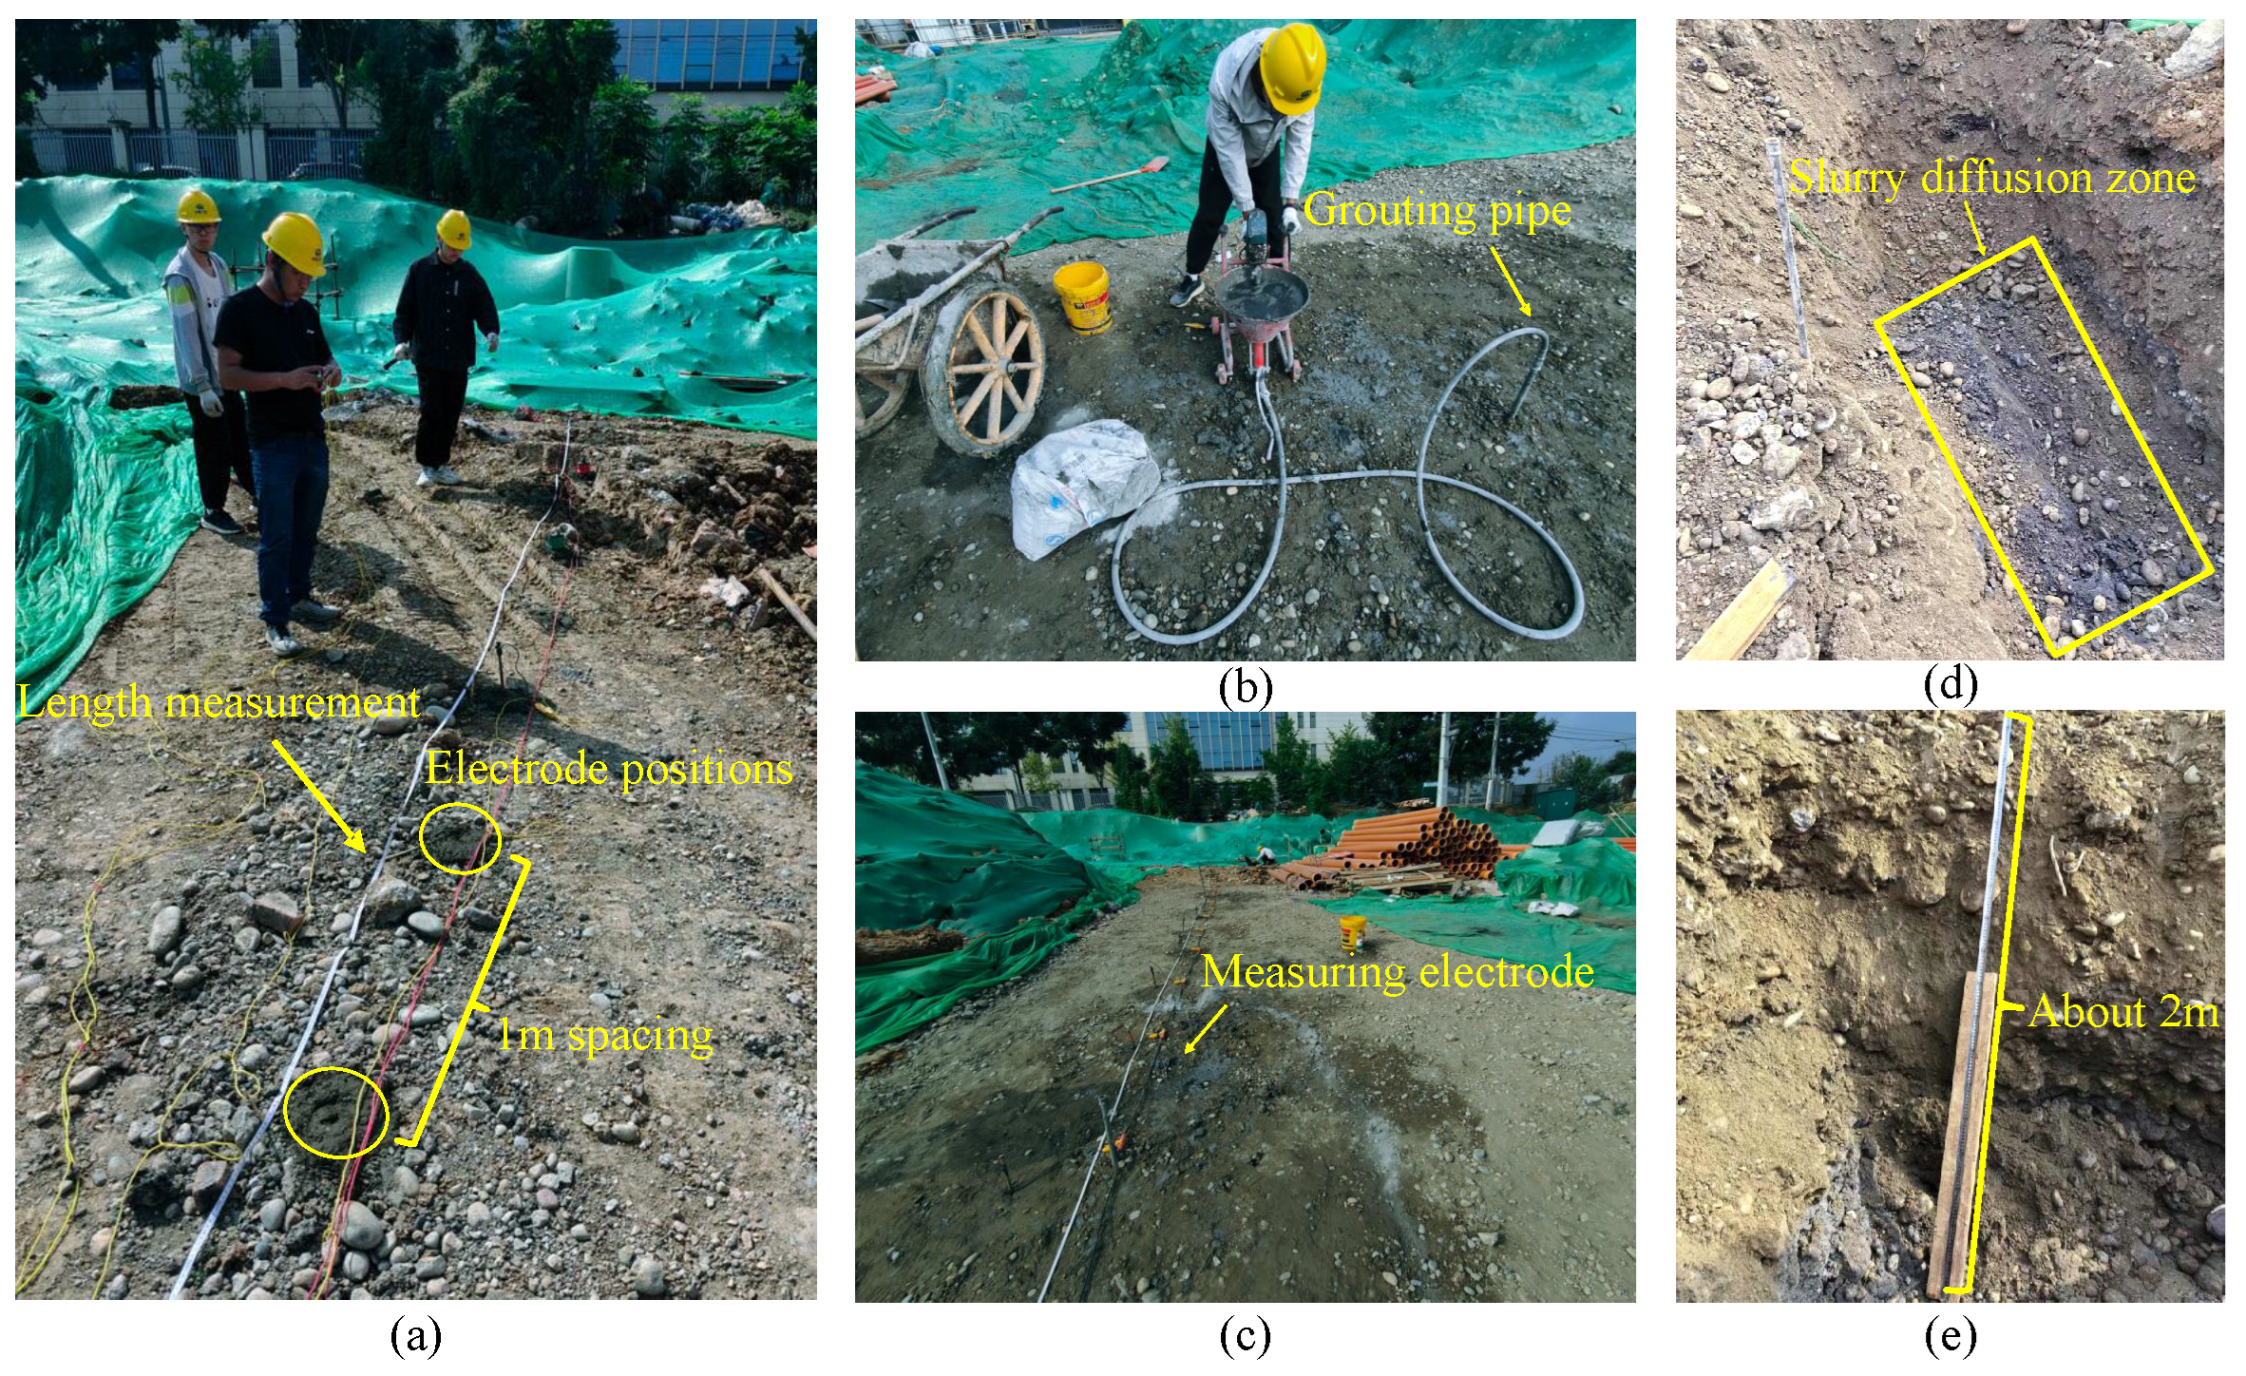
6.2. Actual Measurement Experiment
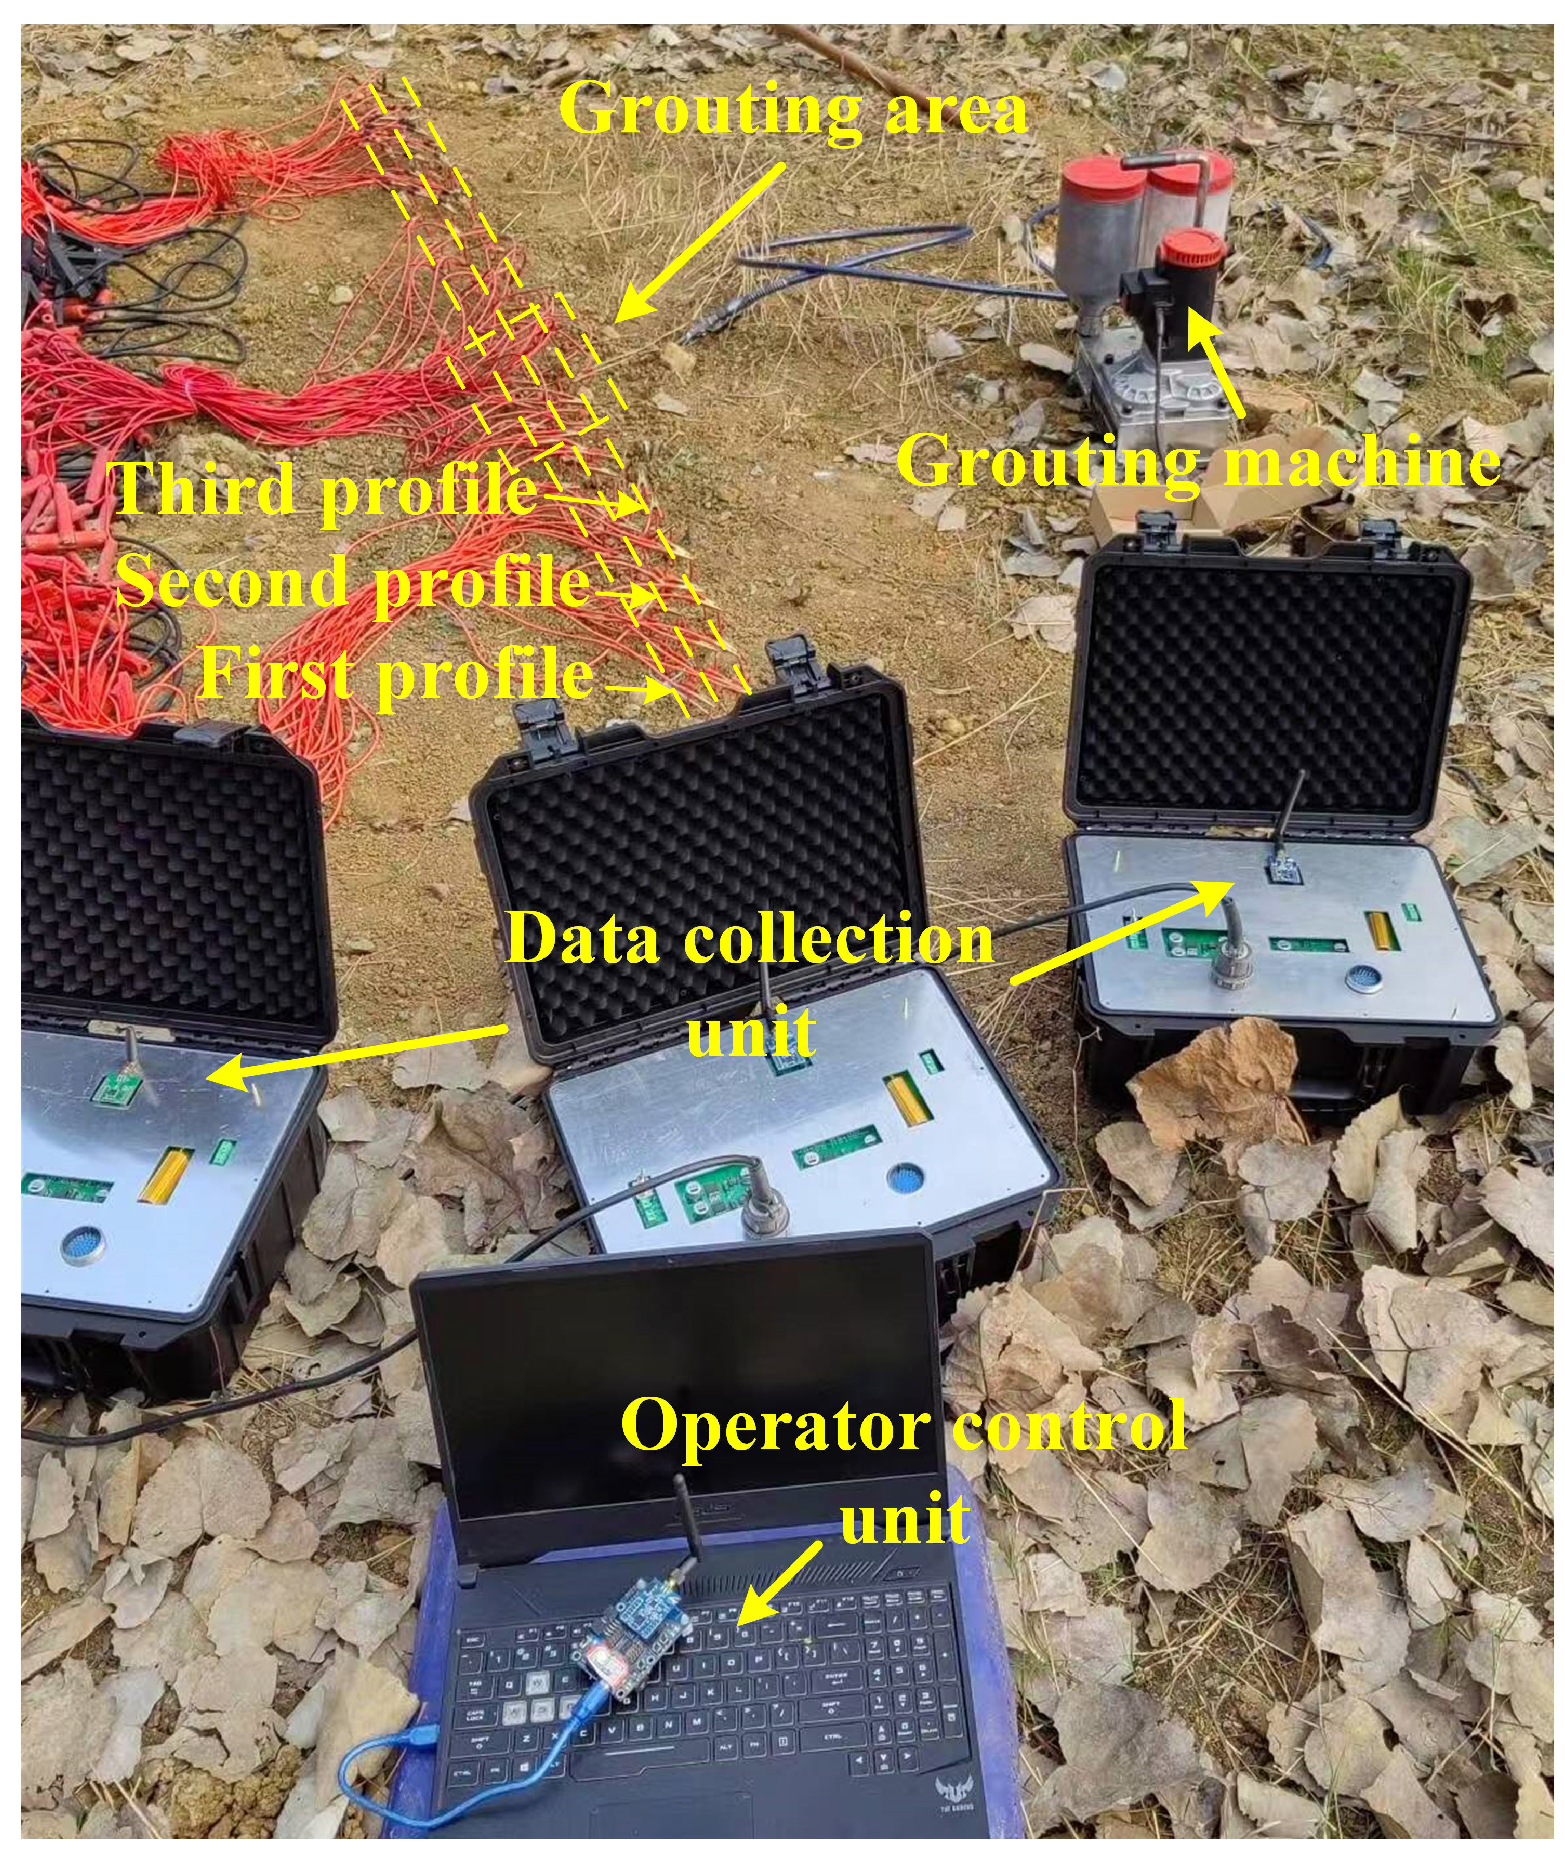
6.3. Construction Field Testing
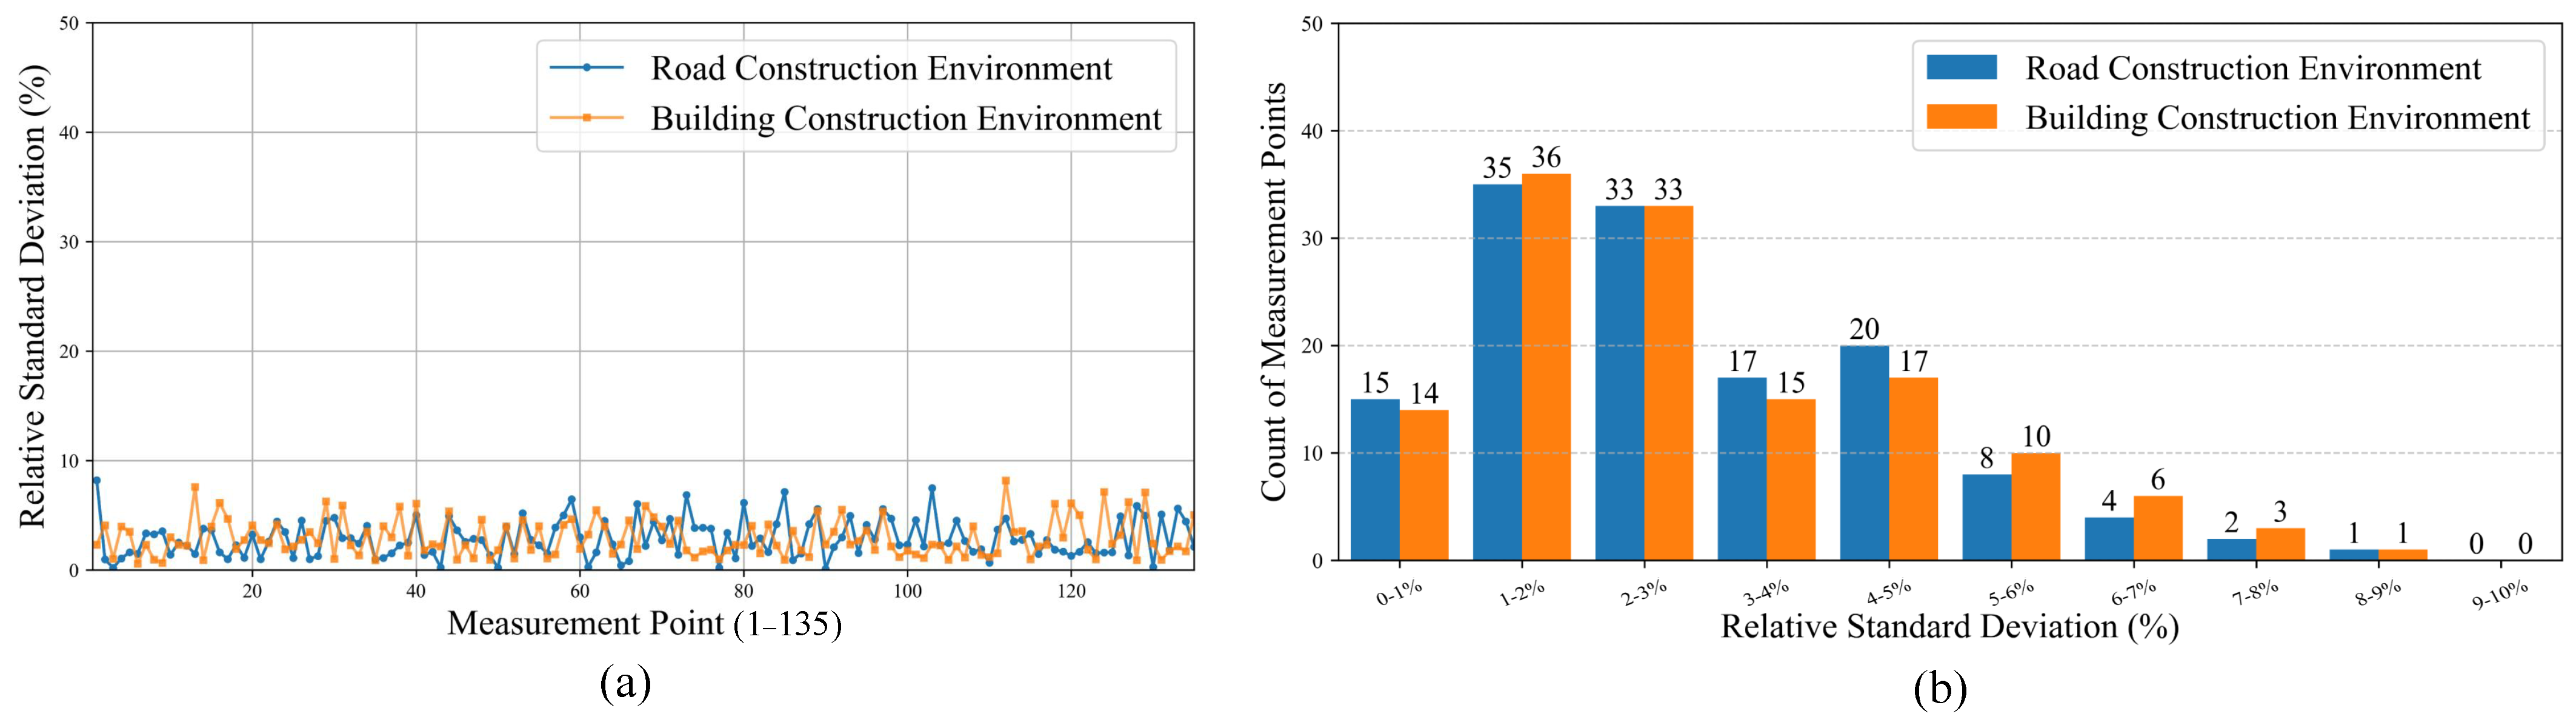
6.4. System Stability and Adaptability Testing
6.5. Network Performance Measurement
7. Discussion
- A new 60-channel integrated system is developed. This highly integrated design eliminates the labor cost of manually switching electrodes, significantly reduces operating time and improves measurement efficiency. Moreover, the method prearranges the electrodes in the measurement area, removing the need for repeated insertion and removal, thereby eliminating measurement errors associated with electrode reinsertion. The system employs multi-channel synchronized measurement to ensure the independence of data acquisition for each profile, which effectively mitigates the cumulative error and discharge effect, ensuring the accuracy and reliability of the measurement.
- The system’s acquisition unit can sense discharge voltage and perform data acquisition for three profiles simultaneously to conduct a three-dimensional inversion, providing a more detailed and intuitive way to monitor the diffusion of the slurry. Compared with previous measurement methods, the system not only improves the efficiency of data collection but also updates the inversion results in real time to reflect the time-varying characteristics of the slurry, which helps to provide quick feedback on the grout performance and slurry diffusion results during construction.
- The new system is equipped with a ZigBee module for wireless data transmission, allowing the control unit to receive and process the collected data in real time. This ensures efficient monitoring of the grouting process. In addition, the design supports the addition of more acquisition units to form an extensive network, expanding the measurement range, and enhancing scalability.
8. Conclusions
Author Contributions
Funding
Institutional Review Board Statement
Informed Consent Statement
Data Availability Statement
Conflicts of Interest
References
- Li, B.; Guo, L.; Liu, S.; Zhan, C.; Jia, B. Network Monitoring and Alarming System for Grouting Pressure Based on SPC Theory. J. Yangtze River Sci. Res. Inst. 2020, 37, 174–178. [Google Scholar]
- Sakhno, I.; Sakhno, S. Numerical studies of floor heave mechanism and the effectiveness of grouting reinforcement of roadway in soft rock containing the mine water. Int. J. Rock Mech. Min. Sci. 2023, 170, 105484. [Google Scholar] [CrossRef]
- Bazaluk, O.; Petlovanyi, M.; Lozynskyi, V.; Zubko, S.; Sai, K.; Saik, P. Sustainable Underground Iron Ore Mining in Ukraine with Backfilling Worked-Out Area. Sustainability 2021, 13, 834. [Google Scholar] [CrossRef]
- Mariani, E.; Ingrassia, L.P.; Spadoni, S.; Canestrari, F. Laboratory Investigation on the Use of Geocomposites as Waterproofing Systems for Concrete Bridge Decks. J. Mater. Civ. Eng. 2024, 36, 04023544. [Google Scholar] [CrossRef]
- Wang, M.; Yang, X.; Zheng, K.; Chen, R. Properties and microstructure of a cement-based capillary crystalline waterproofing grouting material. Buildings 2024, 14, 1439. [Google Scholar] [CrossRef]
- Qin, Z.; Shi, Q.; Qin, D.; Wang, H.; Luo, Y.; Wang, W. Performance comparison of geopolymer and clay-cement grouting pastes and goaf effect evaluation of grouting backfilling method. Front. Mater. 2023, 10, 1301504. [Google Scholar] [CrossRef]
- Wang, M.; Guo, C.; Dong, Y.; Wang, F.; Fu, Z.; Jin, L.; Zhang, Q.; Tong, M. Preparation and permeation-diffusion performance of one-component high-strength polyurethane grouting materials. Constr. Build. Mater. 2025, 474, 141121. [Google Scholar] [CrossRef]
- Zhang, L.; Yu, R.; Zhang, Q.; Liu, R.; Feng, H.; Chu, Y. Permeation grouting diffusion mechanism of quick setting grout. Tunn. Undergr. Space Technol. 2022, 124, 104449. [Google Scholar] [CrossRef]
- Niu, J.; Li, Z.; Gu, W.; Chen, K. Experimental study of split grouting reinforcement mechanism in filling medium and effect evaluation. Sensors 2020, 20, 3088. [Google Scholar] [CrossRef]
- Zhai, M.; Bai, H. Precise application of grouting technology in underground coal mining: Water inrush risk of floor elimination. Environ. Sci. Pollut. Res. 2023, 30, 24361–24376. [Google Scholar] [CrossRef]
- Cui, Y.; Tan, Z.; Han, D.; Song, J. Investigation and application of a high performance grouting material in water-rich silty fine sand stratum. Constr. Build. Mater. 2022, 329, 127100. [Google Scholar] [CrossRef]
- Oreste, P.; Sebastiani, D.; Spagnoli, G.; de Lillis, A. Analysis of the behavior of the two-component grout around a tunnel segmental lining on the basis of experimental results and analytical approaches. Transp. Geotech. 2021, 29, 100570. [Google Scholar] [CrossRef]
- Wang, Q.; Gao, H.; Yu, H.; Jiang, B.; Liu, B. Method for measuring rock mass characteristics and evaluating the grouting-reinforced effect based on digital drilling. Rock Mech. Rock Eng. 2019, 52, 841–851. [Google Scholar] [CrossRef]
- Lin, C.; Wang, X.; Li, Y.; Zhang, F.; Xu, Z.; Du, Y. Forward modelling and GPR imaging in leakage detection and grouting evaluation in tunnel lining. KSCE J. Civ. Eng. 2020, 24, 278–294. [Google Scholar] [CrossRef]
- Miltiadou-Fezans, A.; Tassios, T.P. Practical Recommendations for the Execution of Grouting. In Mix-Design and Application of Hydraulic Grouts for Masonry Strengthening; Springer: Berlin/Heidelberg, Germany, 2022; pp. 221–283. [Google Scholar]
- Bai, J.; Li, S.; Jiang, Y.; Liu, R.; Li, Z.; Li, W. An extension theoretical model for grouting effect evaluation in sand stratum of metro construction. KSCE J. Civ. Eng. 2019, 23, 2349–2358. [Google Scholar] [CrossRef]
- Wang, Q.; Gao, H.; Jiang, B.; Li, S.; He, M.; Qin, Q. In-situ test and bolt-grouting design evaluation method of underground engineering based on digital drilling. Int. J. Rock Mech. Min. Sci. 2021, 138, 104575. [Google Scholar] [CrossRef]
- van Eldert, J.; Funehag, J.; Schunnesson, H.; Saiang, D. Drill monitoring for rock mass grouting: Case study at the stockholm bypass. Rock Mech. Rock Eng. 2021, 54, 501–511. [Google Scholar] [CrossRef]
- Kang, H.; Li, W.; Gao, F.; Yang, J. Grouting theories and technologies for the reinforcement of fractured rocks surrounding deep roadways. Deep Undergr. Sci. Eng. 2023, 2, 2–19. [Google Scholar] [CrossRef]
- Chen, Q.; Zheng, X.; Shang, X.; Lv, G.; Yang, K.; Qi, J.; Xue, R.; Cheng, W. Detection of grouting effect in defective areas of metro concealed tunnels in loess areas. Proc. IOP Conf. Ser. Earth Environ. Sci. 2021, 783, 012163. [Google Scholar] [CrossRef]
- Pang, C.; Gao, W.; Wu, P.; Wang, L. Grouting Effect Detection within the Floor of a Coal Seam Using 3D Electric Resistivity Tomography (ERT) with Arbitrary Electrode Positions. Appl. Sci. 2022, 12, 5625. [Google Scholar] [CrossRef]
- Ma, X.; Su, M.; Xue, Y.; Wang, P.; Qiu, D.; Han, M.; Ju, Z.; Liao, Z. Comprehensive Geophysical Evaluation of Grouting in the Goaf of an Urban Underground Coal Mine. Mine Water Environ. 2023, 42, 513–526. [Google Scholar] [CrossRef]
- Xie, X.; Zhai, J.; Zhou, B. Back-fill grouting quality evaluation of the shield tunnel using ground penetrating radar with bi-frequency back projection method. Autom. Constr. 2021, 121, 103435. [Google Scholar] [CrossRef]
- Li, J.; Ma, X.; Jiang, Z.; Wang, L.; Pang, B.; Yang, C. Detecting Active Faults in Quaternary Basalt Areas by the High - Density Electrical Method: An Example of the West Branch of the Fusong Section of Yalujiang Fault Zone in Northeast China. Geol. Explor. 2022, 58, 118–128. [Google Scholar]
- Zeng, L.; Zhang, X.; Xie, X.; Zhou, B.; Xu, C.; Lambot, S. Measuring annular thickness of backfill grouting behind shield tunnel lining based on GPR monitoring and data mining. Autom. Constr. 2023, 150, 104811. [Google Scholar] [CrossRef]
- Balasubramani, D.P.; Gopalakrishnan, V. Subsurface object detection and characterization using Ground Penetrating Radar. Innov. Infrastruct. Solut. 2020, 5, 101. [Google Scholar] [CrossRef]
- Solla, M.; Pérez-Gracia, V.; Fontul, S. A review of GPR application on transport infrastructures: Troubleshooting and best practices. Remote Sens. 2021, 13, 672. [Google Scholar] [CrossRef]
- Dong, J.; Wang, F. Application of GPR and high density electrical method to detect water content of floor. Coal Sci. Technol. 2022, 50. [Google Scholar] [CrossRef]
- Effah, E.; Ghartey, G.; Aidoo, J.K.; Thiare, O. Hardware Development and Evaluation of Multihop Cluster-Based Agricultural IoT Based on Bluetooth Low-Energy and LoRa Communication Technologies. Sensors 2024, 24, 6113. [Google Scholar] [CrossRef]
- Ferretti, D.; Lanci, P.; Torun, B.; Amato, D.; Verdone, R. LoRa-based railway signalling system for secondary lines. In Proceedings of the 2022 61st FITCE International Congress Future Telecommunications: Infrastructure and Sustainability (FITCE), Rome, Italy, 29–30 September 2022; pp. 1–6. [Google Scholar]
- Lindquist, T.; Chambers, K.; Benish, N.; Berg, D.R.; Turkmen, A. LoRa Wireless Mesh Network for Lake Biology Study. In Proceedings of the 2024 Systems and Information Engineering Design Symposium (SIEDS), Charlottesville, VA, USA, 3 May 2024; pp. 47–50. [Google Scholar]
- Rustanto; Arifianto, M. LDPC Over Multihop LoRa Nodes with Peeling Decoder. In Proceedings of the 2023 9th International Conference on Wireless and Telematics (ICWT), Solo, Indonesia, 6–7 July 2023; pp. 1–6. [Google Scholar]
- Wang, Y.; Wu, Y.; Zhang, H. Design of smart key chain based on Bluetooth fingerprint localization. Transducer Microsyst. Technol. 2022, 41, 120–230. [Google Scholar]
- Basili, F.; Parrino, S.; Peruzzi, G.; Pozzebon, A. Iot multi-hop facilities via lora modulation and lora wanprotocol within thin linear networks. In Proceedings of the 2021 IEEE Sensors Applications Symposium (SAS), Sundsvall, Sweden, 23–25 August 2021; pp. 1–6. [Google Scholar]
- Ranasinghe, V.; Udara, N.; Mathotaarachchi, M.; Thenuwara, T.; Dias, D.; Prasanna, R.; Edirisinghe, S.; Gayan, S.; Holden, C.; Punchihewa, A.; et al. Rapid and Resilient LoRa Leap: A Novel Multi-Hop Architecture for Decentralised Earthquake Early Warning Systems. Sensors 2024, 24, 5960. [Google Scholar] [CrossRef]
- Zhang, X.; Feng, X. Gesture recognition based on CGRU-ELM hybrid model in WiFi environment. Comput. Eng. Sci. 2022, 44, 298–305. [Google Scholar]
- Sikimić, M.; Amović, M.; Vujović, V.; Suknović, B.; Manjak, D. An Overview of Wireless Technologies for IoT Network. In Proceedings of the 2020 19th International Symposium INFOTEH-JAHORINA (INFOTEH), East Sarajevo, Bosnia and Herzegovina, 18–20 March 2020; pp. 1–6. [Google Scholar] [CrossRef]
- Chilamkurthy, N.S.; Pandey, O.J.; Ghosh, A.; Cenkeramaddi, L.R.; Dai, H.N. Low-power wide-area networks: A broad overview of its different aspects. IEEE Access 2022, 10, 81926–81959. [Google Scholar] [CrossRef]
- Cotrim, J.R.; Margi, C.B.; Kleinschmidt, J.H. Design of a Gateway-based relay node for LoRaWAN multihop networks. In Proceedings of the 2022 Symposium on Internet of Things (SIoT), São Paulo, Brazil, 24–28 October 2022; pp. 1–4. [Google Scholar]
- Marini, R.; Mikhaylov, K.; Pasolini, G.; Buratti, C. Low-Power Wide-Area Networks: Comparison of LoRaWAN and NB-IoT Performance. IEEE Internet Things J. 2022, 9, 21051–21063. [Google Scholar] [CrossRef]
- Reddy, S.K.; Naik, A.S.; Mandela, G.R. Development of a reliable wireless communication system to monitor environmental parameters from various positions of underground mines to the surface using ZigBee modules. J. Inst. Eng. Ser. D 2024, 105, 359–383. [Google Scholar] [CrossRef]
- Danbatta, S.J.; Varol, A. Comparison of Zigbee, Z-Wave, Wi-Fi, and Bluetooth Wireless Technologies Used in Home Automation. In Proceedings of the 2019 7th International Symposium on Digital Forensics and Security (ISDFS), Barcelos, Portugal, 10–12 June 2019; pp. 1–5. [Google Scholar] [CrossRef]
- Gavra, V.D.; Pop, O.A. Usage of ZigBee and LoRa wireless technologies in IoT systems. In Proceedings of the 2020 IEEE 26th International Symposium for Design and Technology in Electronic Packaging (SIITME), Pitesti, Romania, 21–24 October 2020; pp. 221–224. [Google Scholar]
- Abderrahmane, T.; Nourredine, A.; Mohammed, T. Experimental analysis for comparison of wireless transmission technologies: Wi-Fi, Bluetooth, ZigBee and LoRa for mobile multi-robot in hostile sites. Int. J. Electr. Comput. Eng. 2024, 14, 2753. [Google Scholar] [CrossRef]
- Inthasuth, T.; Uarchoojitt, P.; Boonsong, W.; Kaewthong, N. Time-based performance analysis of narrowband internet of things (NB-IoT) for particulate matter monitoring system. In Proceedings of the 2023 International Conference on Electronics, Information, and Communication (ICEIC), Singapore, 5–8 February 2023; pp. 1–4. [Google Scholar]
- Komilov, D. Application of zigbee technology in IOT. Int. J. Adv. Sci. Res. 2023, 3, 343–349. [Google Scholar]
- Cao, X.; Zhang, F.; Shi, K. Design of Mining Equipment Data Acquisition Substation Based on ZigBee Protocol. Instrum. Tech. Sens. 2023, 65–70. [Google Scholar] [CrossRef]
- Wu, J.; Dai, F.; Liu, P.; Huang, Z.; Meng, L. Application of the electrical resistivity tomography in groundwater detection on loess plateau. Sci. Rep. 2023, 13, 4821. [Google Scholar] [CrossRef]
- Zohourian, A.; Dadkhah, S.; Neto, E.C.P.; Mahdikhani, H.; Danso, P.K.; Molyneaux, H.; Ghorbani, A.A. IoT Zigbee device security: A comprehensive review. Internet Things 2023, 22, 100791. [Google Scholar] [CrossRef]
- Gavra, V.; Pop, O.A.; Dobra, I. A Comprehensive Analysis: Evaluating Security Characteristics of Xbee Devices against Zigbee Protocol. Sensors 2023, 23, 8736. [Google Scholar] [CrossRef]
- Tan, X.; Poorghasem, S.; Huang, Y.; Feng, X.; Bao, Y. Monitoring of pipelines subjected to interactive bending and dent using distributed fiber optic sensors. Autom. Constr. 2024, 160, 105306. [Google Scholar] [CrossRef]
- Zhu, L.; Gu, W.; Qiu, F.; Ouyang, Y. Grouting slurry diffusion range based on active heating fiber optics monitoring. Sci. Rep. 2022, 12, 19162. [Google Scholar] [CrossRef] [PubMed]
- Wijaya, H.; Rajeev, P.; Gad, E. Distributed optical fibre sensor for infrastructure monitoring: Field applications. Opt. Fiber Technol. 2021, 64, 102577. [Google Scholar] [CrossRef]


| Standard | Bluetooth | ZigBee | Wi-Fi | LoRa | NB-IoT |
|---|---|---|---|---|---|
| Frequency band | 2.4 GHz | 868/915 MHz; 2.4 GHz | 2.4 GHz; 5 GHz | 433, 780, 868, 915 MHz | 400, 900, 2700 MHz |
| Max signal rate | 1 Mb/s | 250 Kb/s | 54 Mb/s | 50 Kb/s | 253.6 Kb/s |
| Nominal range | 10 m | 10–150 m | 100 m | 5 km (urban), 18 km (rural) | 10 km (rural) |
| Nominal TX power | 0–10 dBm | (−28)–4.5 dBm | 15–20 dBm | 10–20 dBm | 23 dBm |
| Scenario | ZigBee Node Spacing | ||||
|---|---|---|---|---|---|
| 10 m | 20 m | 30 m | 40 m | 50 m | |
| Corridor | 0.00% | 0.02% | 0.10% | 0.22% | 0.76% |
| Open Area | 0.00% | 0.06% | 0.38% | 0.80% | 1.36% |
| Complex Area | 0.00% | 0.24% | 0.66% | 1.96% | 1.62% |
| Construction site | 0.00% | 0.08% | 0.42% | 1.24% | 1.84% |
Disclaimer/Publisher’s Note: The statements, opinions and data contained in all publications are solely those of the individual author(s) and contributor(s) and not of MDPI and/or the editor(s). MDPI and/or the editor(s) disclaim responsibility for any injury to people or property resulting from any ideas, methods, instructions or products referred to in the content. |
© 2025 by the authors. Licensee MDPI, Basel, Switzerland. This article is an open access article distributed under the terms and conditions of the Creative Commons Attribution (CC BY) license (https://creativecommons.org/licenses/by/4.0/).
Share and Cite
Wang, X.; Wang, T.; Gao, J.; Yang, M.; Lin, F.; Jia, Y. A Novel Grouting Diffusion Monitoring System Based on ZigBee Wireless Sensor Network. Sensors 2025, 25, 2693. https://doi.org/10.3390/s25092693
Wang X, Wang T, Gao J, Yang M, Lin F, Jia Y. A Novel Grouting Diffusion Monitoring System Based on ZigBee Wireless Sensor Network. Sensors. 2025; 25(9):2693. https://doi.org/10.3390/s25092693
Chicago/Turabian StyleWang, Xiangpeng, Tingkai Wang, Jinyu Gao, Meng Yang, Fanqiang Lin, and Yong Jia. 2025. "A Novel Grouting Diffusion Monitoring System Based on ZigBee Wireless Sensor Network" Sensors 25, no. 9: 2693. https://doi.org/10.3390/s25092693
APA StyleWang, X., Wang, T., Gao, J., Yang, M., Lin, F., & Jia, Y. (2025). A Novel Grouting Diffusion Monitoring System Based on ZigBee Wireless Sensor Network. Sensors, 25(9), 2693. https://doi.org/10.3390/s25092693