2.2. Cytotoxic Activity
The in vitro cytotoxic activity of each compound isolated from
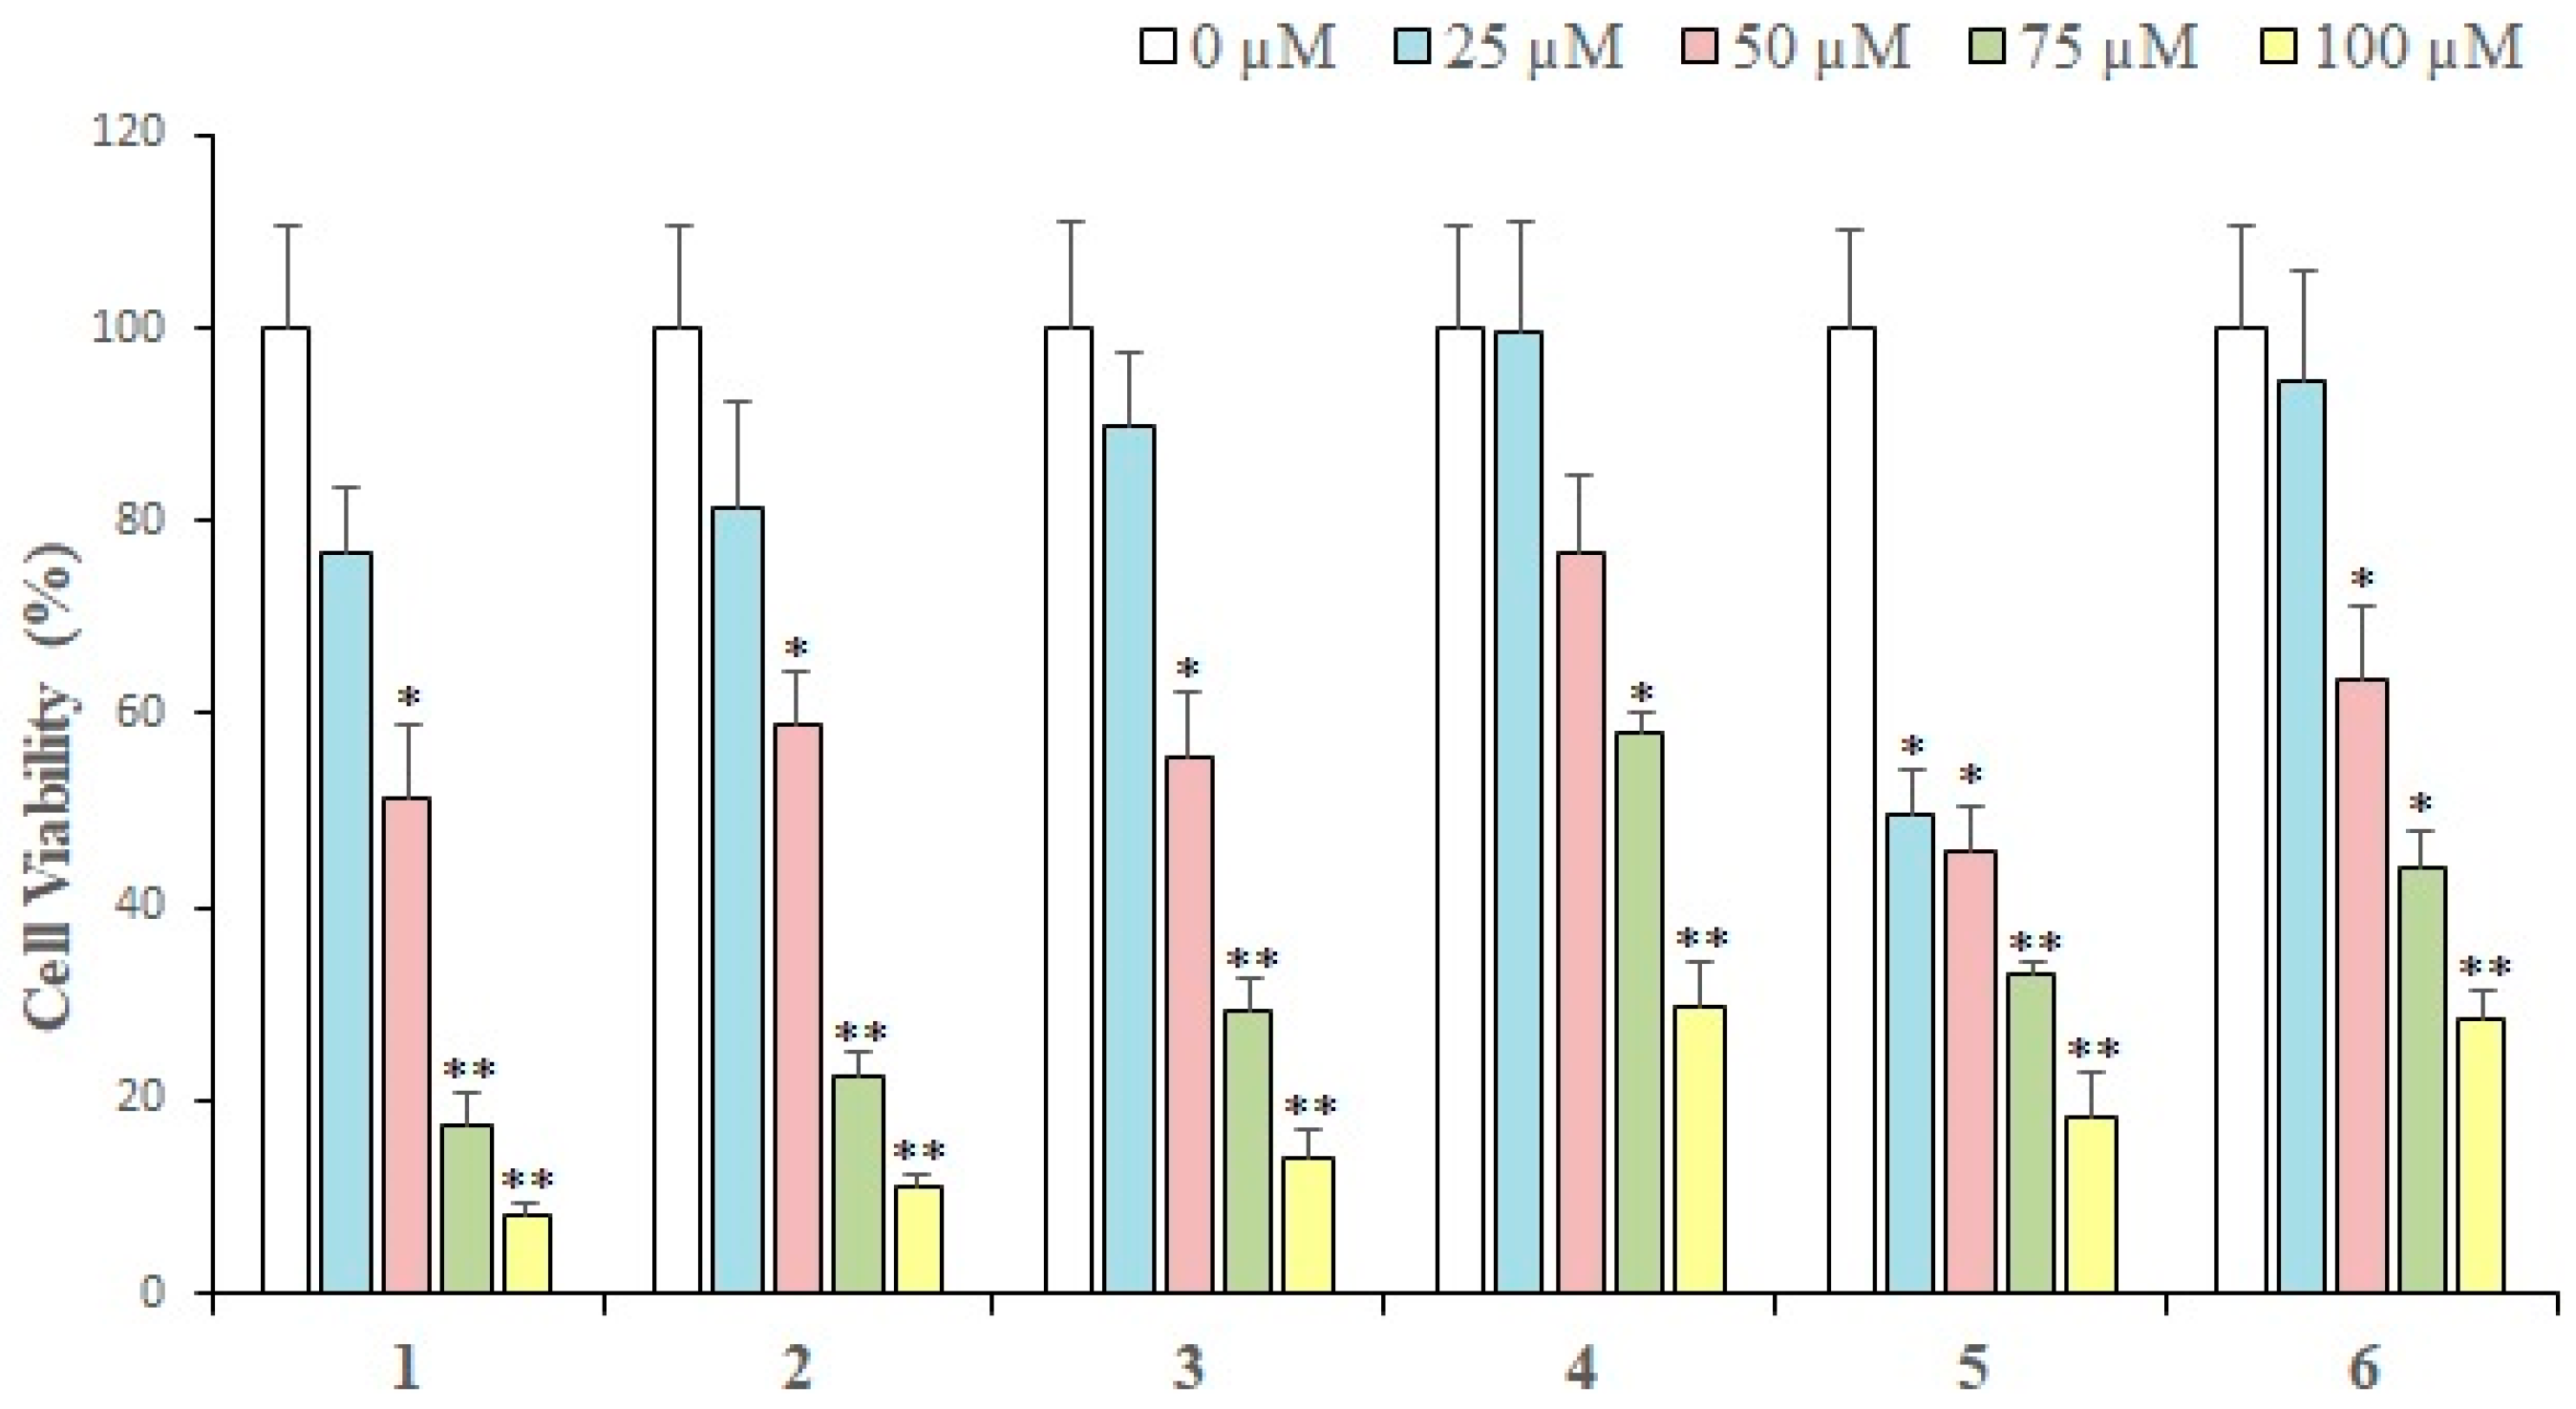
L. shawii was examined against breast cancer cells. Results of an MTT assay showed that almost all the compounds exhibited a concentration-dependent growth inhibition of MDA-MB-231 breast cancer cells. At 25 µM (the lowest concentration tested), compound
5 showed maximum (50.53%) loss of cell viability as compared to the rest of the compounds. While
1 exhibited 76% cell viability,
2,
7,
9,
8, and
3 demonstrated 81–89% cell viability, respectively. Thus, at 25 µM, compound
5 showed a significant cytotoxic effect, while the rest of the compounds did not produce substantial antiproliferative activities. However, at 100 µM (the maximum concentration used to treat cancer cells), compound
1 exhibited maximal inhibition (92.1%) of cell proliferation, followed by compounds
7,
2,
3,
5,
6,
4,
9, and
8. Therefore, it is evident that at low concentrations (25 µM and 50 µM), compound
5 is the most active cytotoxic agent [
47,
48], while at concentrations of 75 µM and above, compound
1 is the most effective cytotoxic compound. Gaweesh et al. (2015) studied the cytotoxic activity of different fractions of
L. shawii against HepG2, MCF7, and HCT116 cancer cells and reported that the CH
2Cl
2 fraction exhibits potent inhibition of the cell growth of MCF7 (breast cancer line) with IC
50 value of 11 ± 0.195 μg/mL [
49]. These active compounds might be potential sources of the anticancer activity of the extracts. Compound
9 was previously isolated by our group [
35] which inhibited the cell proliferation in MDA-MB-231 breast cancer cells in a dose-dependent manner. At 25 µM, compound
9 did not inhibit cell growth significantly; however, at concentrations above 50 µM,
9 exhibited over 50% cell growth inhibition in MDA-MB-231 cells. At 100 µM, compound
9 showed approximately 70% loss of cell viability, which is considerable. The results are demonstrated in
Figure 2 and
Figure 3.
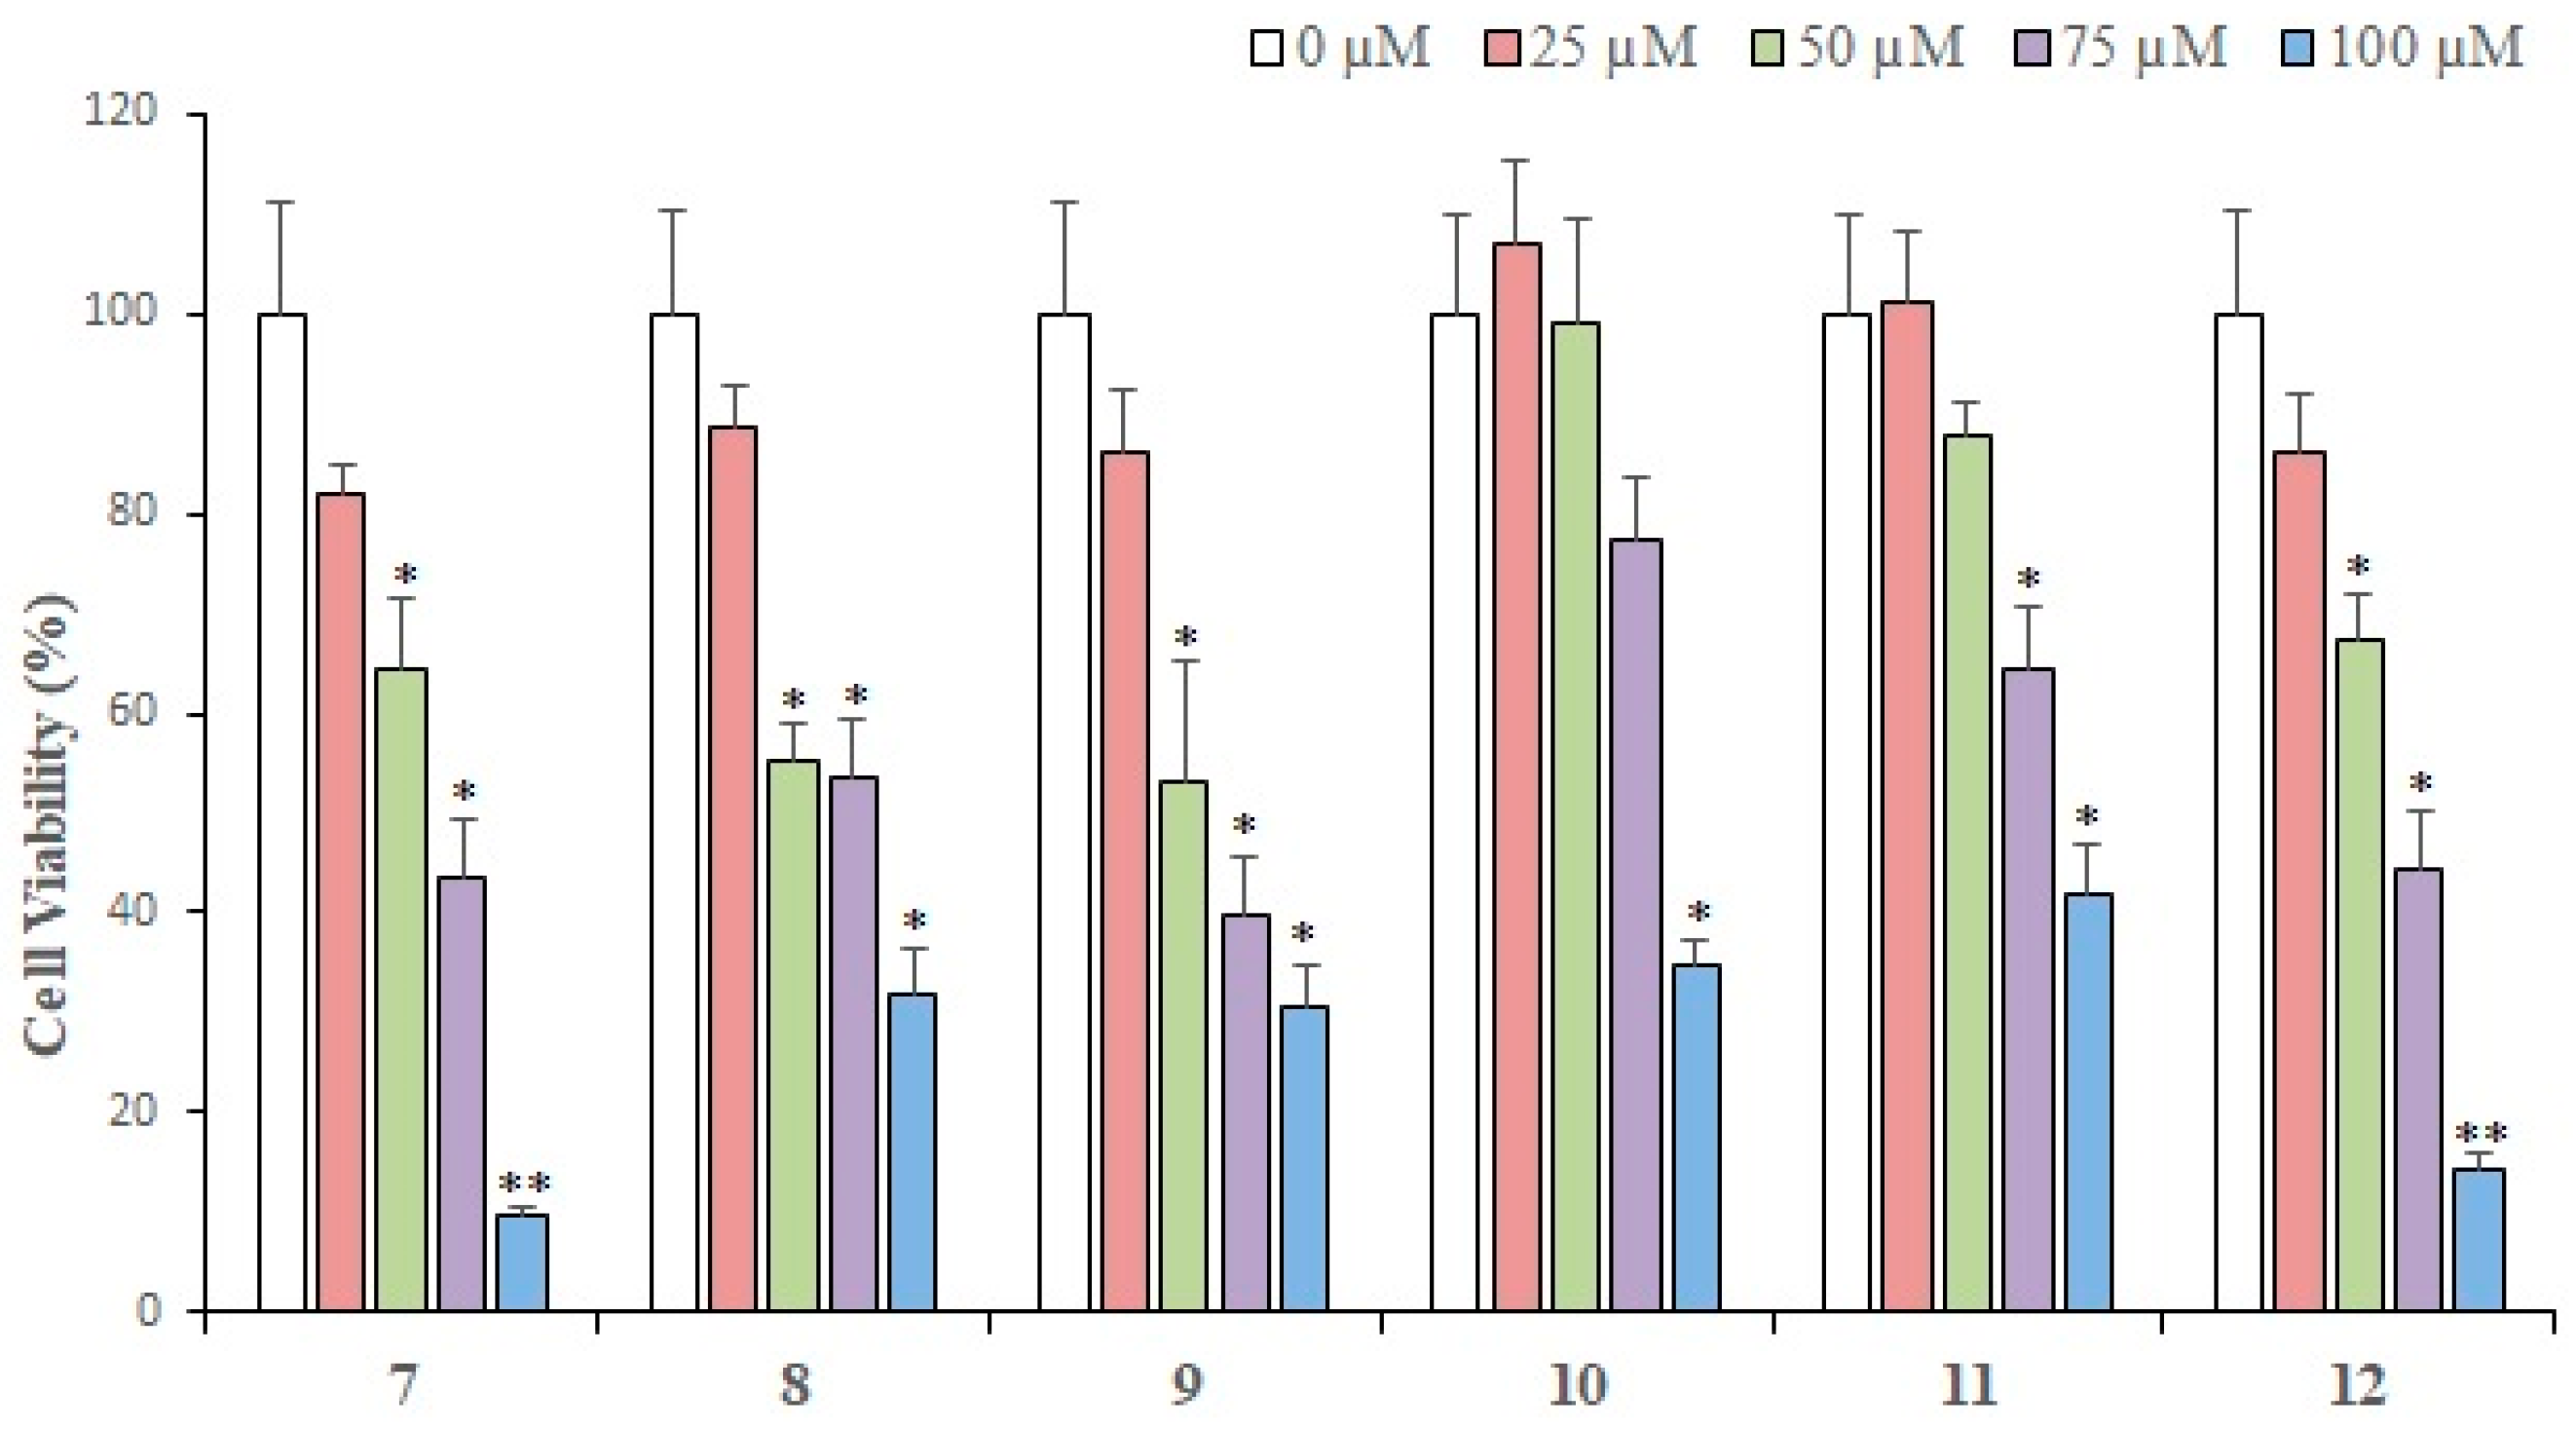
Compounds
10–
12 were isolated from
Aloe vera resin and tested for their growth inhibitory potential against MDA-MB-231 cancer cells;
12 demonstrated the highest cytotoxic activities at three different concentrations (
Figure 3). At 25 µM,
12 showed ~14.0% of cytotoxic effect,
11 exhibited no cell growth inhibition, while compound
10 depicted a growth-promoting effect on MDA-MB-231 cells. At 50 µM, compounds
10–
12 exhibited cytotoxic activity in the range of 67–99%, while at 75 µM,
12 showed 44%, while
11 and
10 depicted 64% and 77% cell viability, respectively, indicating that compound
12 is potent at this concentration. At 100 µM,
12 exhibited the highest activity, followed by
10 and
11. Based on the results, we can say that
1,
7,
2,
3,
12, and
5 were the most potential hits. The calculated IC
50 values revealed that
5,
1–
3,
7, and
12 are potent cytotoxic compounds with IC
50 values ranging from 31 to 60 μM, while the IC
50 values of
8,
6, and
9 were 72, 73, and 76 µM, respectively. The IC
50 values of
1–
12 are shown in
Table 1.
2.3. Antioxidant Activity
The antioxidant activity of crude extracts/fractions and isolated compounds was tested using DPPH radical scavengers. The tests were performed at different concentrations to calculate the IC
50 value. The ethyl acetate, BuOH, and CH
2Cl
2 fractions of
L. shawii showed promising inhibitory potential of 76%, 72%, and 60%, respectively. The IC
50 values for ethyl acetate, BuOH, and CH
2Cl
2 fractions of
L. shawii were 378 ± 1.50, 650 ± 1.50, and 735 ± 2.00 μg/mL, respectively, indicating that the ethyl acetate fraction is most potent as compared to standard ascorbic acid (53 ± 1.32 μg/mL). The crude MeOH extract of
L. shawii demonstrated mild activity (50 ± 1.50%), while aqueous and n-hexane fractions were inactive. According to Gaweesh et al. (2015) [
49], the EtOAc fraction of aerial parts of
L. shawii exhibited antioxidant activity with an IC
50 value of 55.4 ± 3.48 μg/mL. The difference in activity may be due to the composition of the EtOAc fraction using only the stem instead of a mixture (leaves and stem). In the case of
A. vera, only the ethyl acetate fraction exhibited moderate activity of 51%, while other fractions of this plant did not show promising results. The results are summarized in
Table 2.
All the isolated compounds were screened in a DPPH radical scavenging assay in order to test their antioxidant potential. The results demonstrated that compound
4 exhibited potent antioxidant activity with an IC
50 value of 55 ± 2.00 µM, followed by
14 (IC
50 = 241 ± 1.50 µM),
6 (IC
50 = 645 ± 1.50), and
13 (IC
50 = 762 ± 2.00 µM) as compared to standard ascorbic acid. Compound
4 showed higher activity than
9 (IC
50 = 30 µg/mL) reported by our group [
35]. The results are tabulated in
Table 3. It is a well-accepted notion that the presence and position of –OH groups in a molecule can increase or decrease the antioxidant activity [
50]. Among diterpenes, compound
1 showed moderate activity which may be due to the presence of three exocyclic double bonds. Comparing anthraquinones,
6 possesses two –OH groups at the
meta position of the right hand benzene ring, and one –OH at the C-8 position
meta to methyl group at C-6. Compounds
5,
7, and
8 have similar basic skeletons with the absence of the
meta –OH group which showed that the meta –OH groups play an important role in the antioxidant activity of anthraquinones. Comparing
4 and
14,
4 bears two –OH groups at the
meta position of ring A, two –OH at
ortho in ring B, one –OH at C-3 in ring C. Compound
14 has two –OH groups at the
meta position of the benzene ring and one –OH at the C-3 position at cyclohexane. Due to the presence of two additional
ortho (ring B)–OH groups, compounds showed higher DPPH radical scavenging activity. It is thus suggested that the chelating ability of the
ortho and
meta –OH groups in
4 played a greater role in the antioxidation property.
All the isolated compounds were screened in a DPPH radical scavenging assay in order to test their antioxidant potential. The results demonstrated that compound
4 exhibited potent antioxidant activity with an IC
50 value of 55 ± 2.00 µM, followed by
14 (IC
50 = 241 ± 1.50 µM),
6 (IC
50 = 645 ± 1.50), and
13 (IC
50 = 762 ± 2.00 µM) as compared to standard ascorbic acid. Compound
4 showed higher activity than
9 (IC
50 = 30 µg/mL) reported by our group [
35]. The results are tabulated in
Table 3. It is a well-accepted notion that the presence and position of –OH groups in a molecule can increase or decrease the antioxidant activity [
50]. Among diterpenes, compound
1 showed moderate activity which may be due to the presence of three exocyclic double bonds. Comparing anthraquinones,
6 possesses two –OH groups at the
meta position of the right hand benzene ring, and one –OH at the C-8 position
meta to methyl group at C-6. Compounds
5,
7, and
8 have similar basic skeletons with the absence of the
meta –OH group which showed that the meta –OH groups play an important role in the antioxidant activity of anthraquinones. Comparing
4 and
14,
4 bears two –OH groups at the
meta position of ring A, two –OH at
ortho in ring B, one –OH at C-3 in ring C. Compound
14 has two –OH groups at the
meta position of the benzene ring and one –OH at the C-3 position at cyclohexane. Due to the presence of two additional
ortho (ring B) –OH groups, compounds showed higher DPPH radical scavenging activity. It is thus suggested that the chelating ability of the
ortho and
meta –OH groups in
4 played a greater role in the antioxidation property.
2.4. Human Intracellular Drug Targets
Compounds
1–
3,
5,
7, and
12 were identified as the most potentially cytotoxic agents. We utilized cheminformatics techniques [
51,
52,
53,
54] to predict the most probable drug targets of these compounds. The kyoto encyclopedia of genes and genome (KEGG) database showed that seven major cancer drug targets are associated with triple-negative breast cancer including epidermal growth factor receptor (EGFR), proto-oncogene tyrosine-protein kinase Kit (c-KIT), insulin-like growth factor receptor 1 (IGFR1), notch receptor 1 (notch 1), phosphatidylinositol-3,4,5-trisphosphate-3-phosphatase (PTEN), phosphatidylinositol-4,5-bisphosphate 3-kinase (PI3K), and cyclin-dependent kinase 4 (CDK4).
The results of the Swiss Target Prediction server are summarized in
Table S1 (supporting information) which revealed that compound
1 may target Cyp19A1 with 0.11 probability, which is not an anticancer drug target, while compound
2 depicted 0.09 to <0.05 probabilities for its predicted drug targets. Thus, the results for compound
2 were considered insignificant. Compounds
3 and
5 showed ≥0.10 and ~0.10 probabilities, respectively, for their predicted targets. Among the suggested targets, poly [ADP-ribose] polymerase (PARP)-1 is a potential drug target in TNBC, and carbonic anhydrase II (CA-II), CA-I, CA-XII, CA-IX, and estrogen receptor (ER) α and β are potential anticancer drug targets. However, ER is not expressed in TNBC, thus it was excluded from our study. Compound
7 showed 0.11 probability for its probable targets. Among the suggested targets, CA-II is a target of interest in cancer treatment. Compound
12 showed probabilities in the range of 0.09–0.04 for its suggested targets, in which CA-II was also included, however its probability was lower than 0.05. Based on these results and an extensive literature survey, PARP and CA-II were also included in our docking experiments.
2.5. Pharmacophore Modeling
The Swiss Target Prediction (STP) server applies 2D-similarity searching to predict the target of the query compound. A number of compounds are present in this server with their actual biological activities and binding mechanism. In STP, 2D structures of the query compounds are matched with the 2D structures of the compounds present in its database and their probabilities are calculated and based on the calculated probabilities, and the target for the query compound is predicted. We also applied pharmacophore modeling to select the drug targets of our compounds with cytotoxic potential. It was hypothesized that the biological targets of those drugs that matched with the pharmacophore model can act as a target of our compounds. Two pharmacophore models, namely, M1 and M2, were generated by using compounds
1–
3,
5,
7, and
12. M1 was generated by aligning the 3D structures of compounds
1–
3, while M2 was created by aligning the 3D structures of compounds
5,
7, and
12. M1 possessed three hydrophobic (Hyd) and one H-Bond acceptor (AccP) feature while M2 contained three Hyd and two AccP features. The pharmacophore models are displayed in
Figure 4.
A set of 62 drug molecules were screened from all the pharmacophore models. M1 retrieved five EGFR inhibitors (afatinib, dacomitinib, nazartinib, neratinib, pelitinib), three PI3K inhibitors (apitolisib, leniolisib, samotolisib), and one CDK4 inhibitor (Omacetaxine mepesuccinate). M2 identified six inhibitors of c-KIT (dovitinib lactate, midostaurin, ripretinib, semaxanib, toceranib, and sunitinib), one Notch 1 (crenigacestat), and two PI3K (dactolisib, samotolisib) inhibitors. This pharmacophore-based searching reflects that compounds 1–3 may target EGFR, PI3K, and CDK4 while compounds 5, 7, and 12 may bind with c-KIT, Notch 1, and PI3K. Subsequently, compounds 1–3, 5, 7, and 12 were subjected to structure-based inverse docking to further confirm the results of pharmacophore modeling.
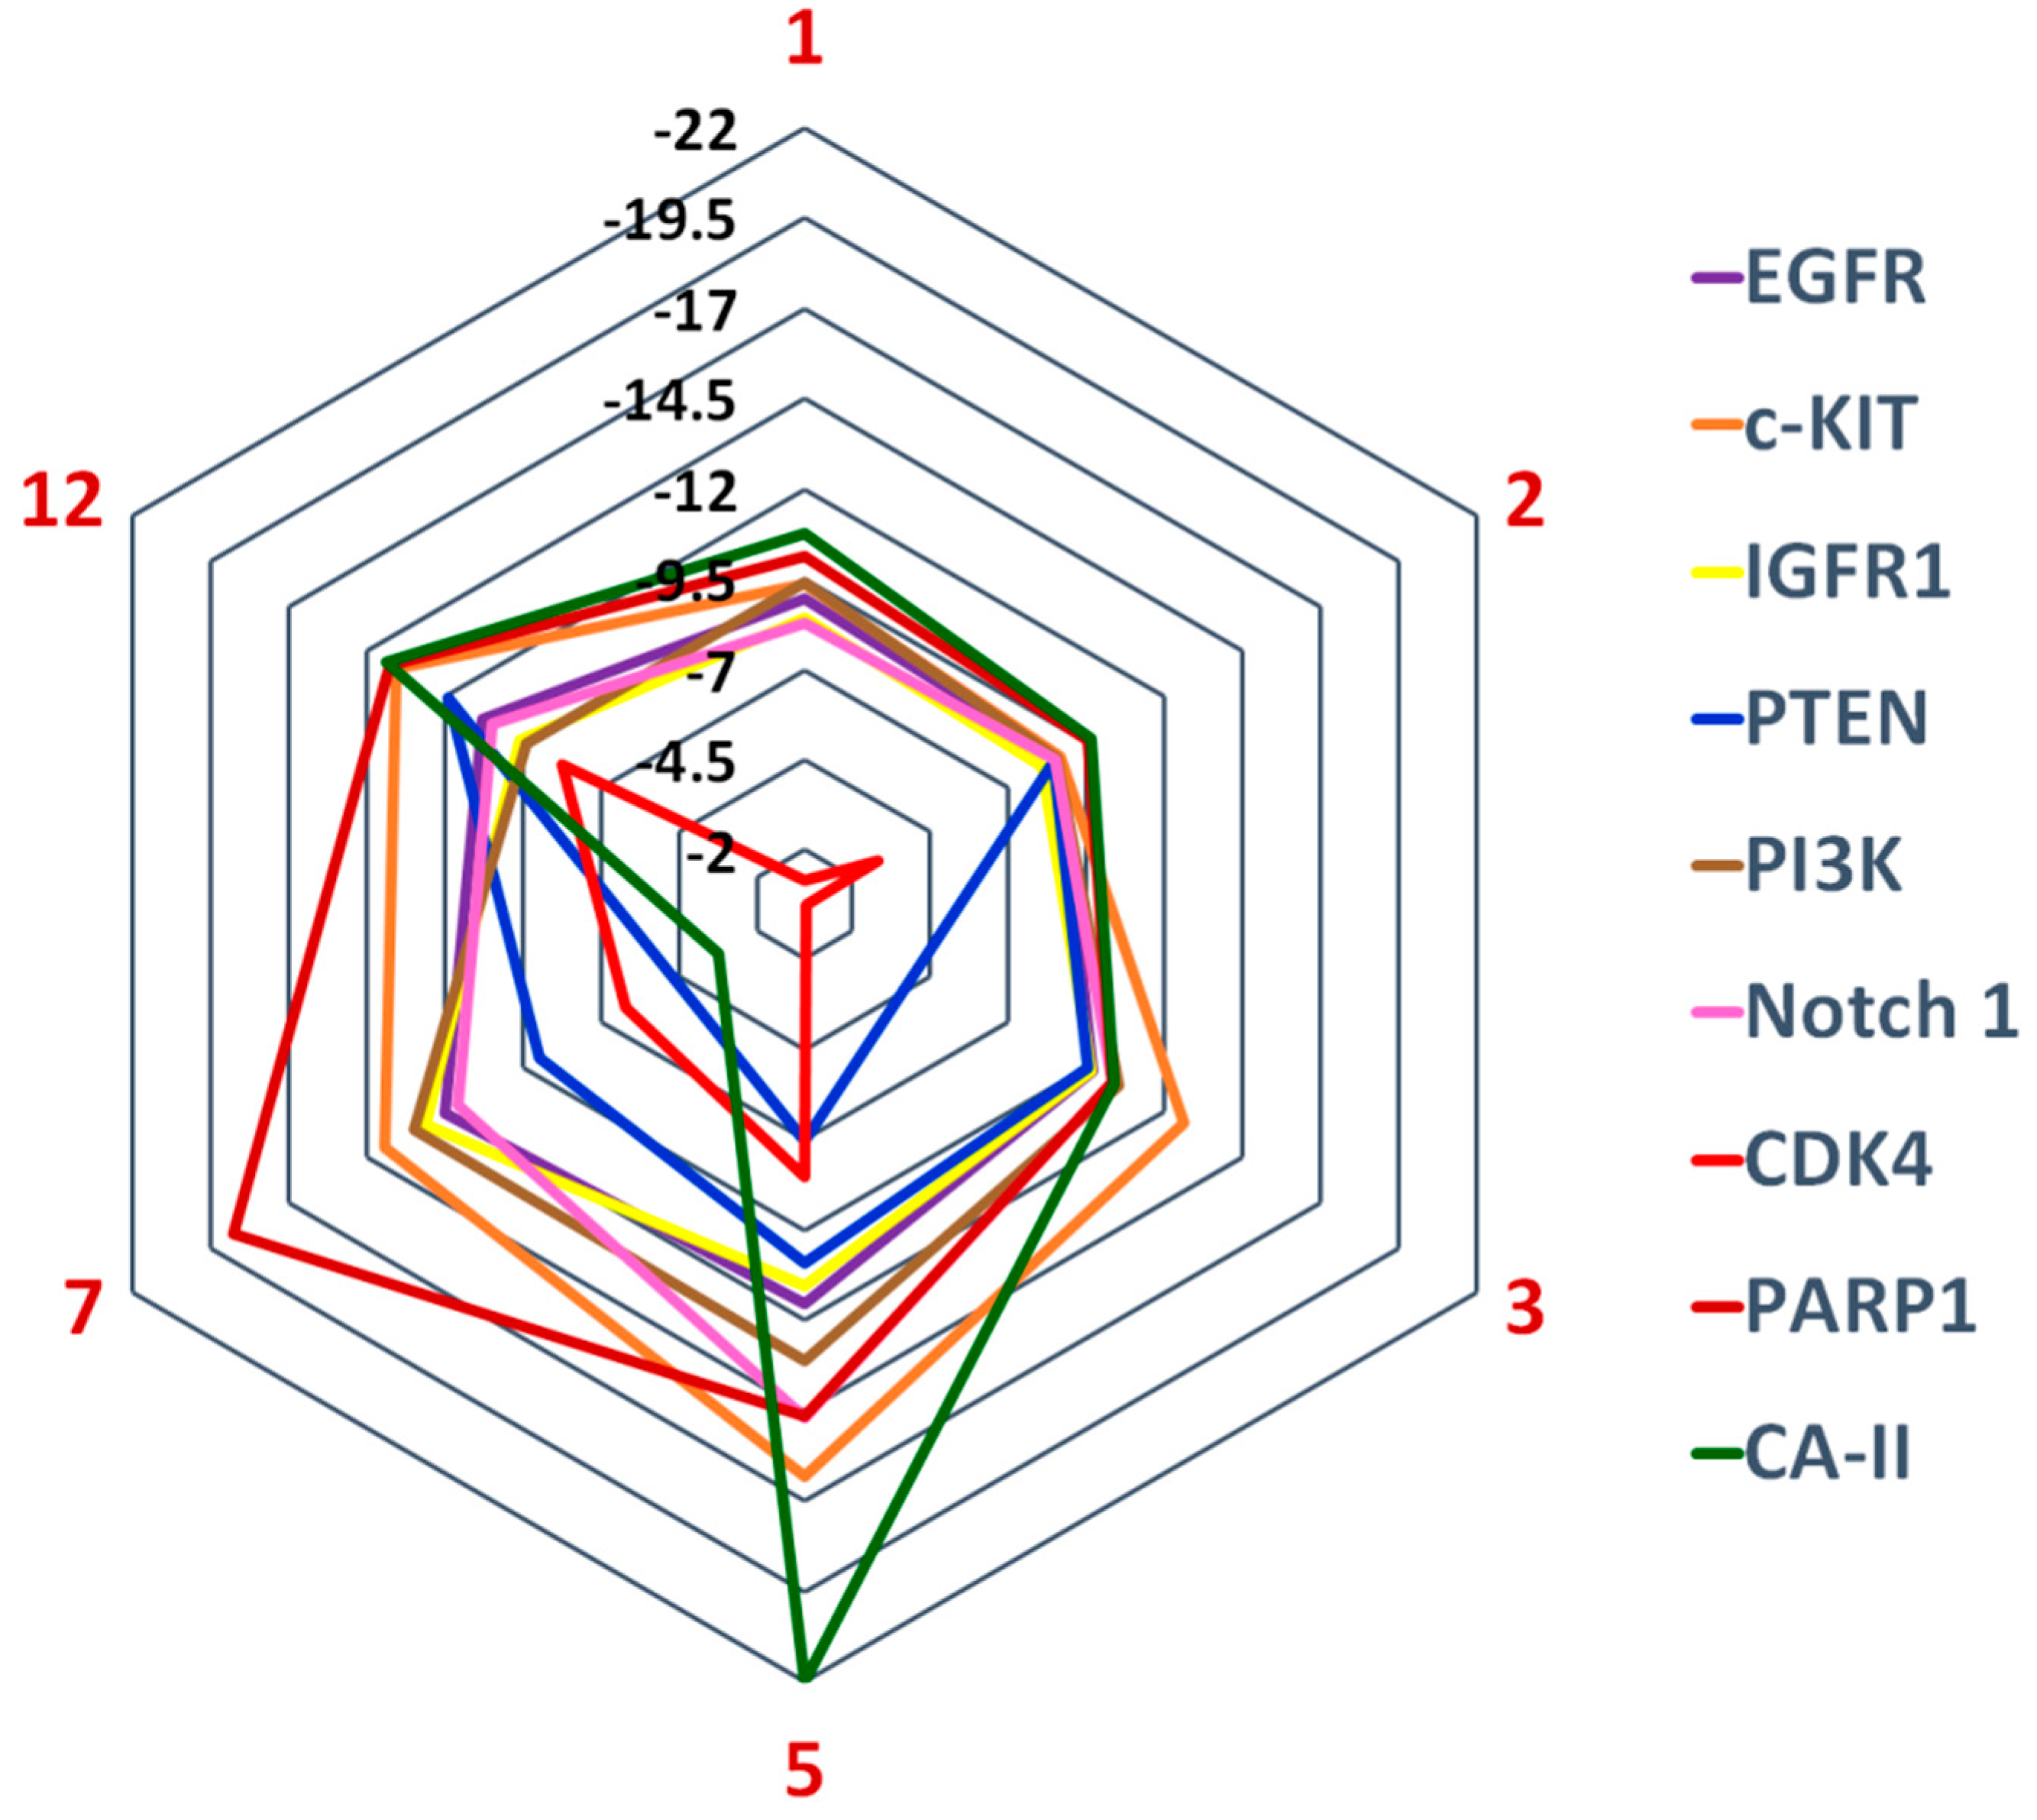
2.6. Molecular Docking Studies
Compounds
1–
3,
5,
7, and
12 were potential hits in our cell-based anticancer assay. Structure-based inverse docking analysis was carried out to predict their binding mechanism. Compounds were docked at the active site or ligand binding sites of the selected drug targets. The docking scores of the compounds suggests that CA-II is the most potential target for compounds
1 (−10.75),
2 (−9.64),
5 (−21.98), and
12 (−13.88), while c-KIT is the best target for compound
3 (−12.62). After CA-II, PARP-1 is an excellent candidate for
1,
2,
7, and
12, while PI3K and c-KIT are probable drug targets for compounds
3 and
5, respectively. Moreover, c-KIT is a good drug target for compounds
2,
7, and
12, while PARP1 is the fourth good target for compounds
3 and
5. PI3K was identified as the second most probable drug target for compound
3, while moderate for
1,
7,
2, and
5, and least for
12. The docking score suggests that the receptors EGFR, Notch 1, and IGFR have variable potency with these compounds, however, binding interactions suggest that compound
7 possesses good binding interactions with Notch 1, while compound
5 has higher binding interactions with EGFR. As per the docking scores, PTEN was the least favorable target for compounds
1–
3,
5, and
7, while CDK4 was ranked as the worst target for all the compounds (
Figure 5). The docking results are presented in
Table S2.
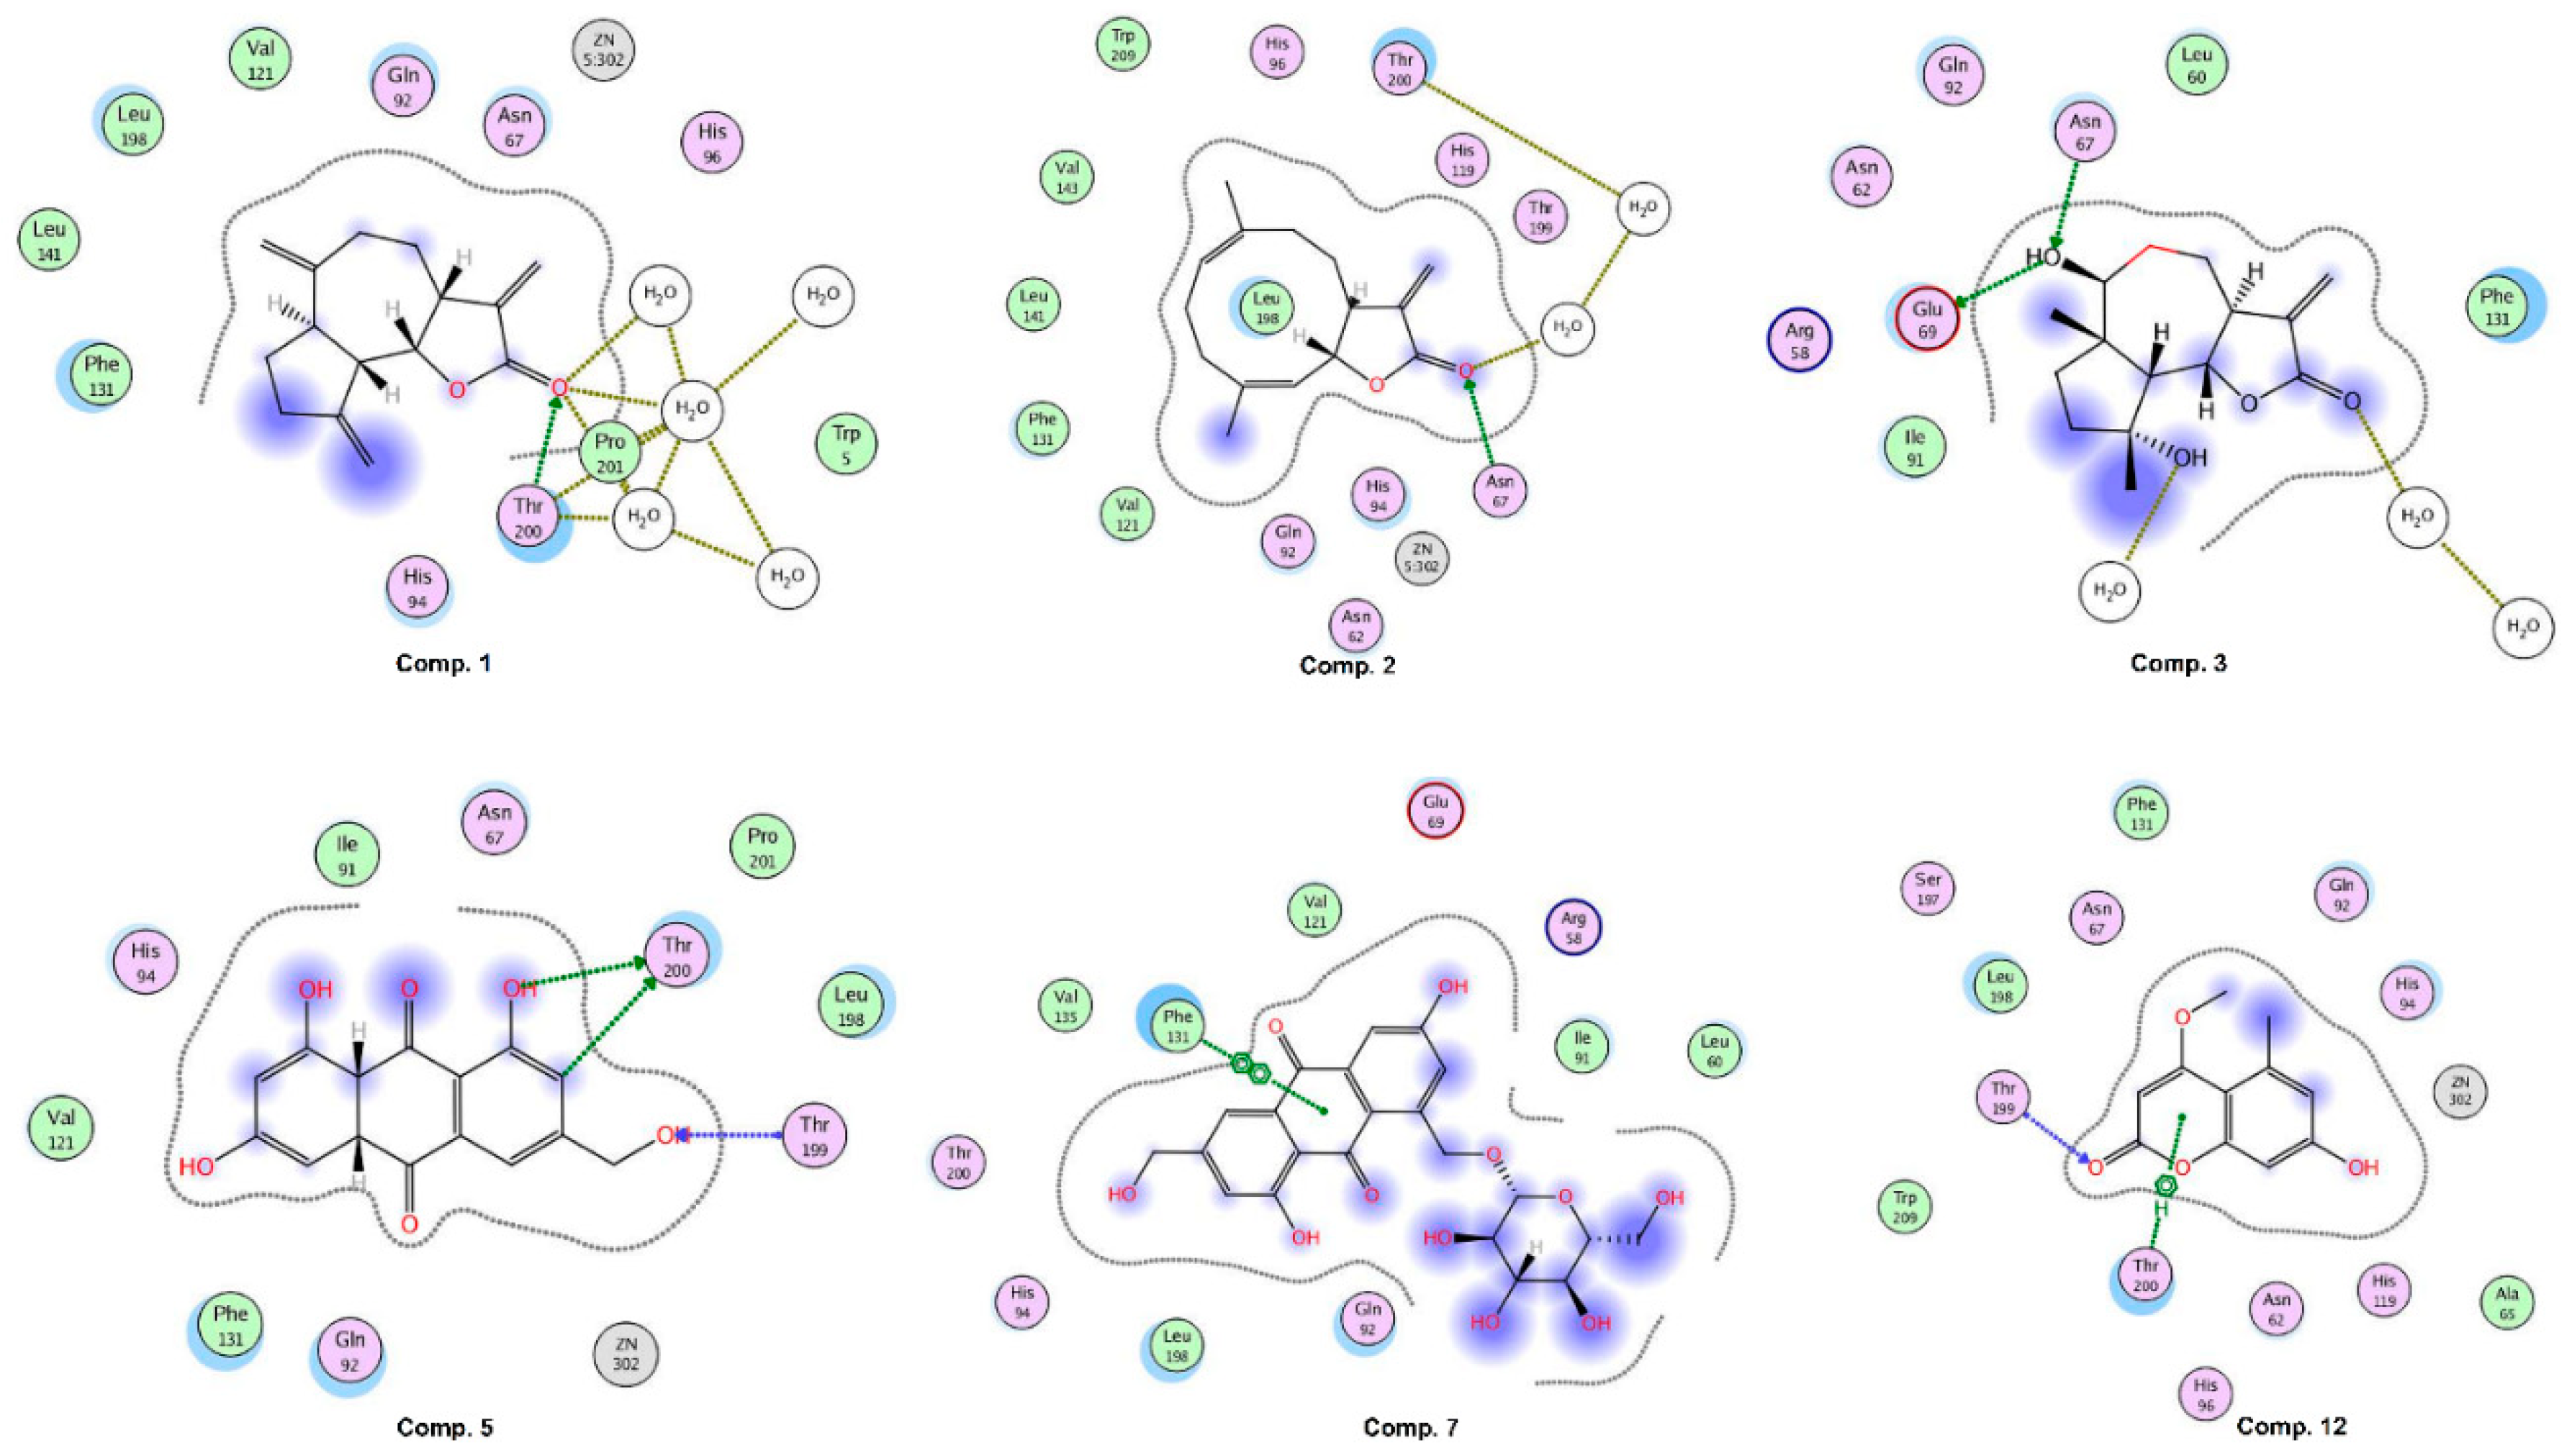
CA-II was exposed as the best target for compounds
1,
2,
5, and
7. Compound
1 binds with the docking score −10.75 and interacts with three water molecules and the side chain of Thr200 by H-bonding. Compound
2 interacts with the side chain of Asn67 and one water molecule via H-bonding. The –OH groups of compound
3 accept and donate H-bonds to the side chains of Asn67 and Glu69, respectively. Moreover, two water molecules provide H-bonding to the compound. The docked view of compound
5 depicts that its –OH groups donate H-bonds to the side chain of Thr200 and accepts H-bonds from the amino group of Thr199, while its ring mediates hydrophobic interactions with the side chain of Leu198. The docking score (−21.98) of
5 suggests that this compound possesses the highest binding potential for CA-II in silico. The side chain of Phe131 provides π-π interactions to the ring of compound
7. The docking score of
7 (−3.26) and its binding interactions suggest that this compound is the least active as compared to the rest of the compounds. The carbonyl moiety of compound
12 mediates bidentate interactions with the side/main chain amino groups of Thr199. Moreover, hydrophobic interaction was observed between the ring of the compound and the side chain of Thr199. The docking score of
12 (−13.88) is less than the docking score of compound
5, while higher than the docking scores of compounds
1–
3 and
7. Some of the docked conformations of
12 showed that the compound may bind with the Zn atom present in the active site. The reference known drug, acetazolamide, interacts with ZN via metal–ligand interaction, and its carbonyl group also accepts H-bonds from the side chain of Thr199. The sulphate oxygen and ring nitrogen also mediate several water-mediated interactions. The active site of human CA-II is presented in
Figure 6. The ligand (1GO), an acetazolamide derivative, complexed in the X-ray structure of CA-II, is also displayed, which interacts with ZN, His94, His96, His119, Gln92, Phe131, Thr199, Thr200, and two water molecules. Our compounds, except
12, do not bind with the zinc (ZN) present in the active site; however, they interact within the vicinity. The binding interactions of compounds are shown in
Figure 7. The docking results are tabulated in
supporting information Table S2.
After CA-II, PARP-1 was the second most probable target for compounds 1, 2, 7, and 12, while fourth for compounds 3 and 5. Among all the compounds, 7 (−18.74), 5 (−14.64), and 12 (−13.74) demonstrated higher binding scores than the niraparib (standard drug or positive control for PARP1, −13.18), while compounds 3 (−10.32), 1 (−10.14), 2 (−9.56) displayed lower scores than 7, 5, 12, and niraparib. At the active site of PARP-1, Glu988 and Ser904 provided H-bonds to compound 5, while Glu988 and a water molecule stabilized compound 7 via H-bonding. At the active site of c-KIT, compound 5 displayed the highest binding potential with docking score −16.31 as compared to the rest of the compounds, while compounds 7 (−13.91) and 12 (−13.56) displayed comparable docking scores. The binding modes also demonstrated the reason for higher binding scores. Compounds 5 and 7 had higher numbers of H-bonding and hydrophobic interactions as compared to 1–3 and 12. Moreover, compounds 5, 7, 12, and 3 depicted higher docking scores than the reference compound sunitinib, which is a drug complexed in the X-ray crystal structure of c-KIT (used in docking studies). Thr670, CYS673, LEU595, VAL603, and a water molecule (HOH289) played important roles in the stabilization of compounds 5, 7, and 12 in the active site. These residues provided hydrogen bonding and π–H interactions to the compounds.
Compounds
7 and
5 displayed higher binding scores than the positive control of EGFR (afatinib) and IGFR (ibutamoren mesylate). While compounds
5,
7,
12, and
3 scored better than crenigacestat (inhibitor of Notch 1), compounds
12,
5, and
7 were better than inhibitors of CDK4 (omacetaxine mepesuccinate), CA-II (acetazolamide) and PARP1 (niraparib). The docking results are tabulated in
Table S1.

 ,
, 


