
Characterization of Pharmaceutical Tablets by X-ray Tomography
 ,
,  , and
, and 
Abstract
:1. Introduction
- X-ray microtomography. This increasingly popular technique can be carried out in lab-based as well as at synchrotron-based X-ray sources [63,64,65,66,67,68,69,70], and sub m resolution can be achieved in both instruments. X-ray microtomography requires minimal to no additional sample preparation making it a simple and convenient technique for tablet characterization as well as for the in situ imaging. Standard modalities include the measurement of the absorption or phase contrast of the sample. However, local diffraction contrast or refractive indices can also be characterized by diffraction contrast tomography and holotomography, respectively. Chemical resolution is minimal, however can vary with the elemental contents of the pharmaceutical ingredients. Sub-10 nm resolution can be achieved by ptycho-tomography on smaller samples. X-ray microtomography, being the main topic of this manuscript, will be elaborated in the later sections.
- Magnetic resonance imaging/Nuclear magnetic resonance. The origin of magnetism in the atomic nucleus is the uneven number of protons and neutrons resulting in a net magnetic moment in the nucleus. NMR measures the interaction between the oscillating external magnetic field and the Larmor frequency of the nuclei (or atom in case of a magnetic material such as Fe, Ni or Co). Therefore, not all the elements can be detected using magnetic resonance imaging and may require contrast agents [45]. In the MRI setup the magnetic field is applied in different directions in a particular slice and the response is measured by the receiving coils. The responses from different orientations are combined to produce a 3D image, and a spatial resolution of 20–1000 m can be achieved [20]. Spatially resolved NMR is usually termed as MRI. Porosity [71], density distribution [20,45,72], and dissolution of the tablet [44,73] can be characterized by MRI imaging. Furthermore, in situ studies on the drug release and absorption in human or animal subjects can also be carried out by MRI [45].
- Neutron tomography. While X-ray photons interact with electrons, neutrons interact with the atomic nucleus. Neutron tomography can be carried out by characterizing the neutron absorption [74], scattering cross-section [75,76], local diffraction [77] as well as by the phase change [78]. Neutrons are highly sensitive to light elements such as H, N, C, O and are attenuated very efficiently by proton-rich compounds such as water [79], and can be suitable to characterize in situ dissolution/disintegration of tablets. Spatial resolution below 5 m can be achieved with chemical resolution [80,81]. Until now, neutron tomography has not been used in characterizing pharmaceutical dosage forms, as they become radioactive after the characterization [62].
- THz tomography/imaging. THz imaging or THz pulse imaging can be carried out in transmission or reflection mode depending on the type of material. The transmission is characterized by the frequency dependent absorption or phase shifts associated with the transmitted wave, and can be used as a tomography technique to produce a 3D image. The reflection mode is typically used as a 3D imaging tool, where the change in the THz pulse after reflection is spatially resolved across the reflecting surface. The interaction of a THz pulse with the material can be used to determine the local refractive index and interamolecular vibration modes/lattice dynamics. Hence, THz pulse imaging/spectroscopy can provide both physical and chemical information from the sample through spectroscopy measurements. The possibility to obtain both spatial and chemical information makes THz pulse imaging a suitable tool for non-destructive characterization of pharmaceutical tablets [20]. THz radiation have wavelength from 1 mm to 10 m whose transmission and reflection depends on the thickness and dielectric constant of the material. A THz pulse can have a typical power in the order of a few W and can probe a depth of 2 mm depending on the material composition. The technique can have a spatial resolution between 50–100 m. Therefore, a non-destructive analysis similar to X-ray tomography is not yet possible [82]. Nevertheless, it has been demonstrated that on selected tablets, the porosity [83,84] and coating layer thickness can be effectively characterized by this approach [85].
- Optical coherence tomography. This is an interferometry imaging technique where the interference between the output laser beam from the source and the interacted laser beam from the sample is measured. The laser interaction depends on the refractive index of the material and the penetration depth, which alters the interference pattern due to the change in the coherence length. The changes measured from the interference pattern is mapped across the sample. The interacted light beam is typically acquired by measuring the light reflection. Typically, near infrared wavelength is used which can provide a spatial resolution in m range and imaging depth in mm range is possible. Due to the low penetration depth of the infrared light, its application in pharmaceutical tablets is typically limited to the coating layer [86,87]. The suitability for other applications in pharmaceutical science is yet to be explored, however, with the existing tools the applicability is similar to that of THz imaging [20].
- Confocal Raman microscopy. In general, confocal microscopy measures the fluorescence or the reflectance from the sample. For better chemical resolution it can be combined with Raman spectrometry, where the phonon vibration mode of the molecules is measured. A lateral resolution of 100–200 nm and an axial resolution of 500 nm can be obtained [88]. Probing depth of around 100 m can be reached using visible light however higher probing depth in the order of mm can be achieved by using an infrared wavelength and can vary with the optical properties of the sample. 2D Raman microscopy combined with microtome cutting capability can be used to obtain a chemically resolved 3D image, however, this process is destructive. While Raman spectroscopy or microscopy is largely used in the pharmaceutical industry, non-destructive 3D Raman microscopy to measure the entire tablet is not yet possible.
2. X-ray Microtomography
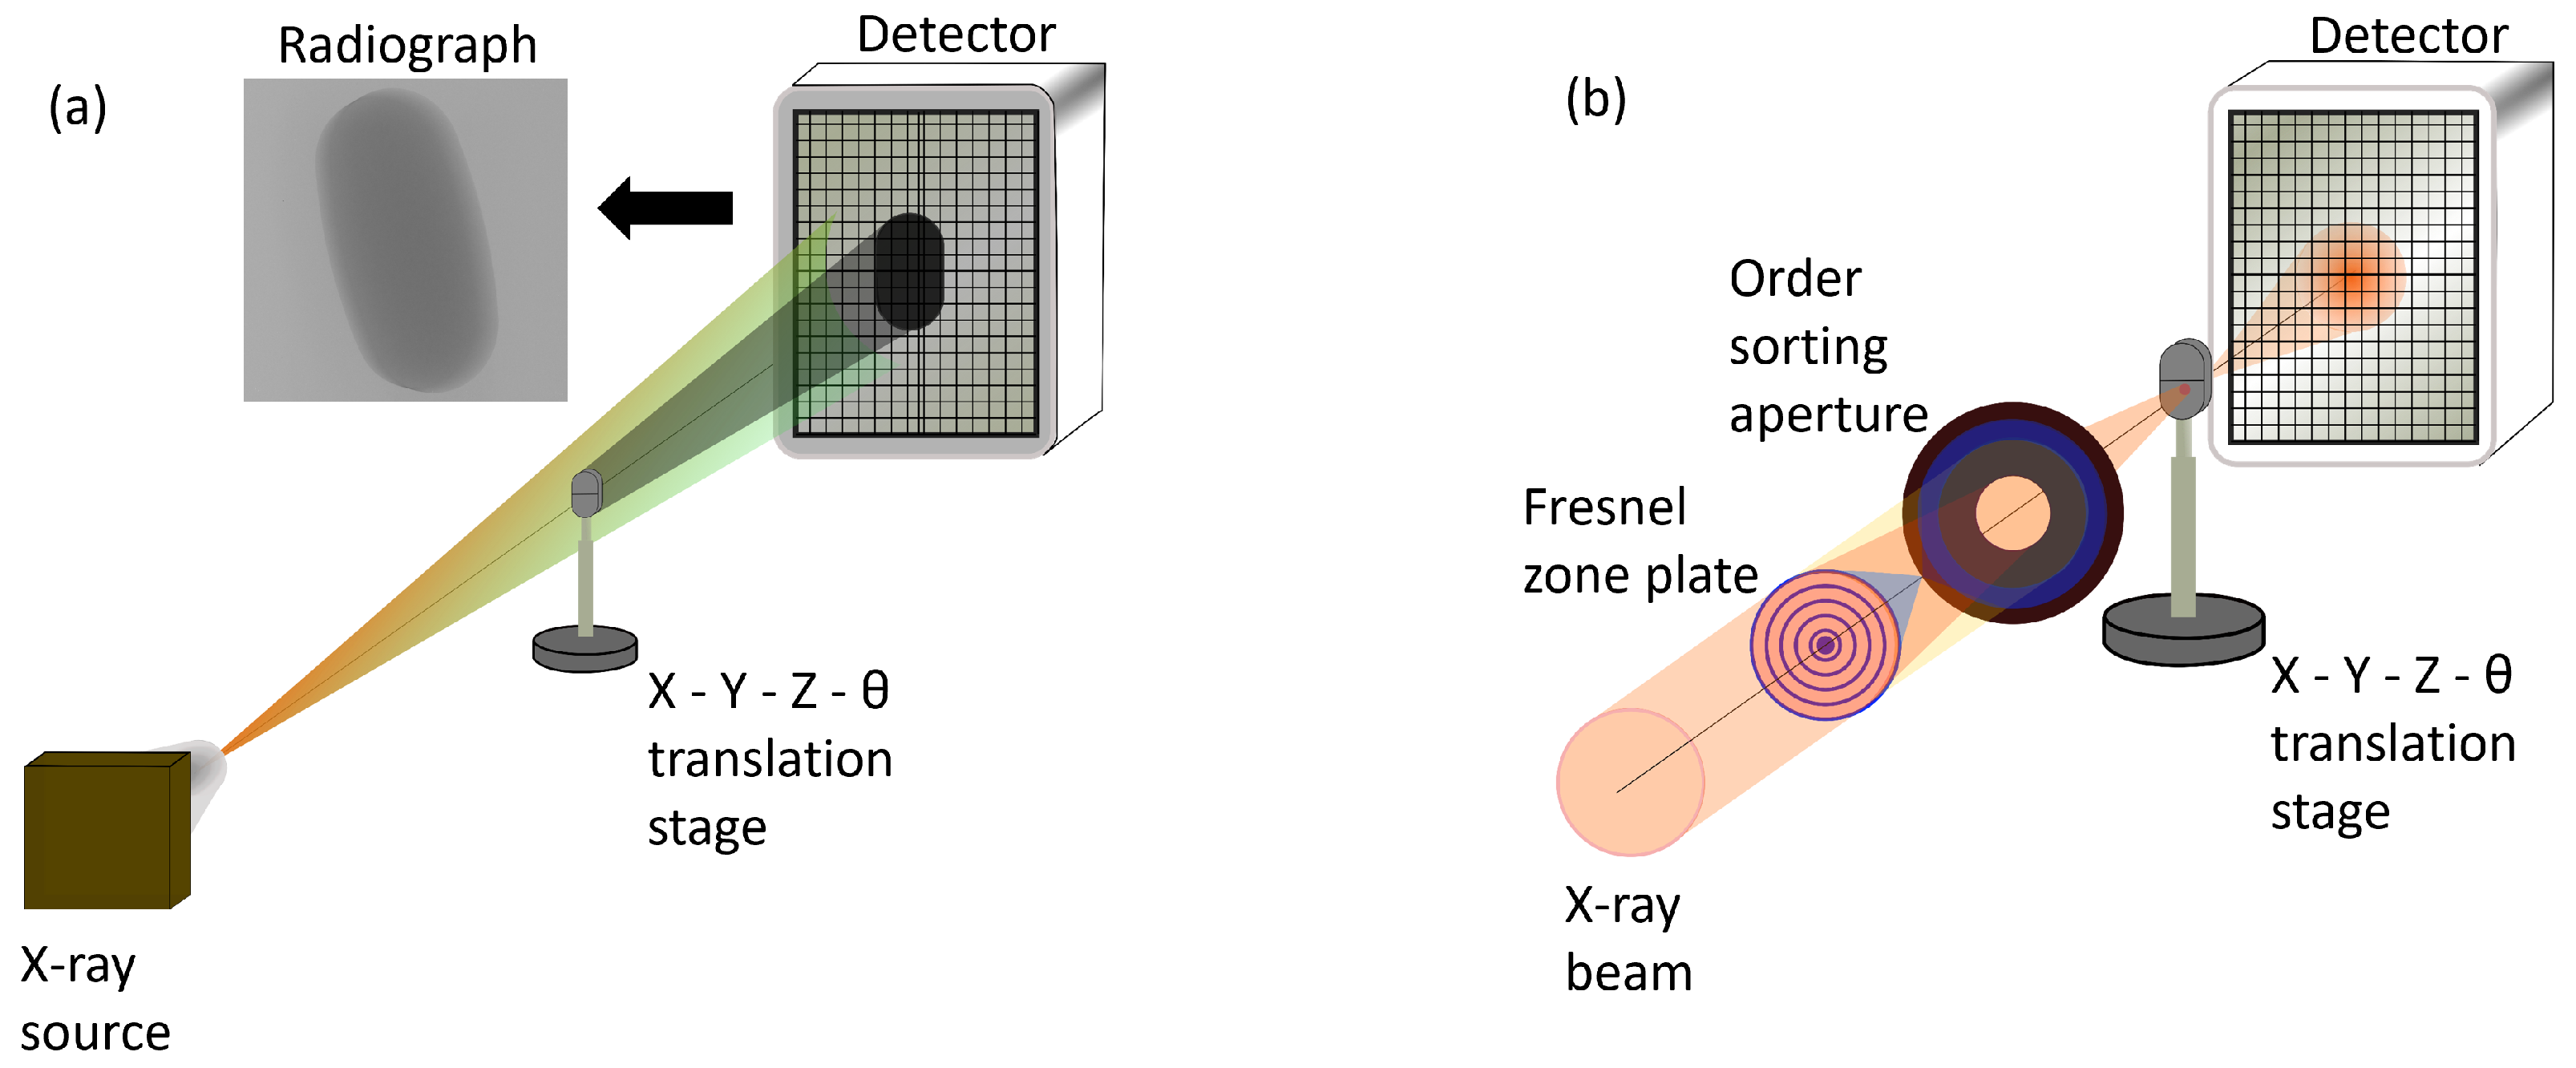
- Lab-based X-ray microtomography setup. The X-ray beam is generated by focusing a narrow electron beam on an anode material (such as W or Mo) with a high acceleration voltage. The resultant X-ray beam has a white spectrum, covering the full energy range up to the energy of the electrons, which is in the range of 30 to 200 keV. The X-ray beam produced in lab-based sources is typically isotropic, due to which the imaging geometry can be considered conical, allowing for the possibility of geometrical magnification of the sample by adjusting the source-sample and sample-detector distances. The resolution of the image is determined by the size of the X-ray beam spot probing the sample and the magnification [93,94]. Figure 1a shows the lab-based set up with cone beam geometry. A 2D array pixel detector, either based on indirect detection (i.e., using a scintillator screen to convert X-rays to visible light) or direct detection (i.e., directly converting the X-rays to electron-hole pairs in the semiconductor sensor), is used to acquire the radiography images.
- Synchrotron-based X-ray microtomography setup. The X-ray beam is generated by accelerating electrons close to the speed of light. The accelerated electrons emit collimated and polychromatic radiation in the forward direction of the electron motion. The photons produced as a result of acceleration of electrons are separated from the electrons by insertion devices such as a bending magnet which deflect the electrons from their path. The separated photons are then directed towards the sample for characterization. The X-ray beam in a synchrotron source is generated as a parallel beam with low divergence and high flux (hence high brilliance) [as shown in Figure 1b] and spatial coherence [89]. The X-ray beam is commonly monochromatized by a monochromator and is further aligned by using X-ray optics. The low divergence enables long propagation distances with both high spatial and high longitudinal (or temporal) coherence from the insertion device to the sample. Such high degree of coherence made other modalities of X-ray imaging such as phase contrast imaging possible. The X-ray beam size typically ranges between sub 100 m to cm in diameter, and at X-ray microtomography beamlines, the diameter of the X-ray beam can range from a few mm to cm. With a parallel beam geometry, the resolution is determined by the detector resolution, i.e., the number of pixels and its area. A thin scintillator screen combined with optical magnification is typically used in synchrotron X-ray microtomography set-ups and the acquisition time is faster than lab-based set-ups with a better signal to noise ratio due to the high flux. The detection efficiency of a scintillating detector is typically low, however, due to the high flux of the synchrotron X-rays, a higher overall efficiency is achieved [95,96,97]. The combination of scintillator and an optical microscope is not only an effective way to magnify, but also overcomes the need to have a detector with very small pixel resolution. If the size of the object is larger than the X-ray spot, smaller radiography images are acquired and are later stitched together to form a full radiography image of the sample.
- Nanotomography—It is an extension of microtomography achieved through technical enhancements in the detector and X-ray sources. High resolution tomography is needed to characterize smaller features such as pores or small pharmaceutical particles present in the solid dosage forms. X-ray tomography with nm-scale resolution is classified as nanotomography.
- (a)
- Lab-based nanotomography. In lab-based set-ups, making the focal spot smaller enables to increase the geometrical magnification while keeping image sharpness, hence increasing the resolution. However, smaller focus spot result in lower flux making it difficult to measure thick/low dense samples. Sub-micron resolution (300 nm–1 m) can still be achieved with such configuration (without additional X-ray optics) [65,101,102]. With appropriate X-ray optics (such as zone plates) and sources, even smaller spatial resolution down to 50 nm with a small field of view in the range of 10–20 m is possible [103]. However, in both cases (geometrical magnification or by using additional X-ray optics), higher exposure time (due to low flux) and/or limited field of view are few associated drawbacks.
- (b)
- Synchrotron-based nanotomography. In synchrotron X-ray sources, the resolution can be enhanced at the detector level, for example by using a combination of thin scintillator detector with high magnification. With such set-ups about 200 nm pixel resolution can be achieved [104,105,106]. In addition, the size of the synchrotron X-ray beam can be further reduced by using X-ray optics such as a Fresnel zone plate, where the beam can be focused to a size as small as 50–60 nm diameter depending on the X-ray photon energy. Upon positioning the detector at a larger distance, higher spatial resolution as low as 30 nm can be achieved [105,107]. With the availability of coherent and high flux light sources at the 3rd generation synchrotrons the resolution of the radiography images can be further enhanced by coherent diffraction imaging (CDI)/ptychography [108,109,110].
- (c)
- Ptycho-tomography. Coherent X-ray beams have a constant phase shift i.e., waves are in-phase with each other. The transmission of the coherent beam through a material can be measured by placing the detector close to the sample. However, by placing the detector far away from the sample (e.g., >1 m), the transmitted wave interferes and produces a diffraction pattern image on the detector known as far field coherent diffraction. Such diffraction patterns can be used to retrieve the phase change of the propagated wave by an iterative phase retrieval algorithm [111]. When the diffraction pattern is measured across the entire sample, a spatially resolved change in amplitude and phase of the transmitted wave through the object can be reconstructed, and it is known as ptychography. An important feature of the ptychography technique is the ability to reconstruct computationally the phase and amplitude of the imaged object as well as the probe (i.e., the illumination of X-ray beam on the sample). The image reconstruction is carried out by different reconstruction algorithms [110,112,113,114,115,116,117], some of which have been implemented as open-source toolkits [118,119]. Since there are no optical elements involved in the image formation, the ptychography technique is theoretically diffraction-limited, and resolutions as good as 10 nm have been proven, also in 3D (as ptycho-tomography) [120]. However, measuring objects at such resolution is challenging and the field of view is limited, requiring special sample preparation in many cases. Due to the requirement of a coherent light source, ptychography is carried out using laser sources or at synchrotrons, however, Batey et al. [121] demonstrated the possibility of carrying out ptychography using lab-based X-ray sources. To the best of our knowledge, ptycho-tomography has not been used to characterize pharmaceutical solid dosage forms.
- Phase contrast tomography—Unlike conventional transmission radiography/imaging, where the reduction of the amplitude of the X-ray wave (intensity) is used to generate image contrast, in phase contrast imaging the phase shift induced by the object is retrieved. Pharmaceutical dosage forms are often made of organic compounds, therefore, different pharmaceutical compounds with similar elements can have a comparable attenuation coefficient making it difficult to identify individual ingredients (from absorption contrast) and can result in the need to add contrast agents or stains. To overcome this issue, phase contrast imaging can be an alternative [122,123]. At the X-ray energies (in the keV range) needed to image a full pharmaceutical tablet, the absorption component () is typically smaller than the refractive index decrement (). The latter makes the refractive index value different from unity, which results in the transmitted intensity to undergo a significant phase shift along with absorption [110,124,125]. While the amplitude of the transmitted image is a direct measurement of the intensity, the phase component is measured by modifying the measurement or by introducing additional optical elements on the X-ray path. The phase contrast can be measured by using interferometry methods [126], analyzer [122,127], and propagation based imaging, all with specific advantages and limitations [100,128,129]. An extension of the interferometry method is the grating-based differential phase contrast imaging achieved by using two different gratings in the optical path [130], and can be used for both non-coherent and polychromatic X-rays [131,132,133]. Zernike phase contrast imaging is another technique employed to measure phase contrast and can be implemented in lab-based tomography setups [103] as well as at synchrotrons [134,135]. Phase contrast can also be achieved at the detector level by edge illumination approach, where the X-ray passing around the edge of the sample is measured at the edge pixels of the detector [136]. By using this technique, the refracted beam is separated from the non-refracted beam, and the phase shift is analyzed. Holotomography is also an extension of phase contrast tomography, which can be carried out by exploiting the propagation-based phase contrast effect [124]. The reconstructed tomography images consist of spatially resolved refractive indices.
- Dark field imaging—The contrast in a standard radiography image represents the degree of absorption by the object. In a dark field image the contrast represents the degree of scattering from the object by filtering the non-scattered light, making it possible to identify sub-voxel resolution features. To achieve this, the light source is passed through certain optical elements (such as a dark field condenser lens, which is typically used for dark field imaging in optical microscopes), such that the non interacted beam can be filtered and only the interacted beam is measured. In X-ray microscopy, it is achieved by using a bright field stopper before the detector or grating interferometry [123,137,138,139]. The latter can also be used in lab-based polychromatic X-ray sources. Dark-field imaging is very complementary to attenuation and phase contrast, highlighting strongly scattering regions. As such, sub-voxel features can be visualized. Using tunable setups, specific feature sizes can be targeted [140]. To the best of our knowledge, dark field imaging/tomography has not been used for characterizing pharmaceutical drug products.
- Small angle X-ray scattering tensor tomography—Absorption based X-ray tomography is based on reconstructing radiography images with individual pixels representing the local absorption as a scalar quantity distributed across the sample. However, a tensor tomography consists of tensor field in each pixel, i.e., each point (voxel) in the sample is a multidimensional array (such as a 3 × 3 × 3 matrix) [141] which are then analyzed to obtain a 3D image with each voxel representing a unique vector quantity. In SAXS tensor tomography, the tensor field is the measure of local X-ray scattering determined by different rotation angles with respect to the X-ray propagation vector [142]. The measured scattering functions are then used to reconstruct the 3D tomographic image of the local reciprocal space and the structural orientation [143]. SAXS tensor field tomography is a relatively new technique and is suitable for samples which scatter less and the spatial resolution is dependent on the size of the X-ray beam used. Disadvantages of this technique include a long acquisition period and computationally intensive post processing time. The potential for pharmaceutical applications is yet to be explored, and it is particularly suitable to analyze the local crystallinity or the shape orientation of the individual particles in the solid dosage forms.
- Diffraction contrast tomography—The absorption or phase contrast tomographic images do not provide information on the crystallographic orientation. To measure the local crystalline structure, X-ray diffraction tomography or diffraction contrast tomography can be used, where the latter is similar to 3D X-ray diffraction microscopy [144]. Both techniques offer high sensitivity and spatial resolution upto 0.5 m (at a synchrotron source), and can be achieved by using an appropriate detector such as a thin scintillator detector in combination with a charge-coupled device to obtain a magnified radiography image. The resolution is typically dependent on the beam size, type of detector, and the angular resolution (i.e., the rotation step size) [104,145,146,147,148] Pharmaceutical ingredients are often crystalline materials and the crystallinity can influence tablet characteristics such as solubility [56]. X-ray diffraction tomography measures the radial diffraction signal as a function of rotation angle and position on the sample. A global diffraction pattern of the sample can be obtained by integrating the entire stack of diffraction patterns, from which the necessary peaks are selected to produce the sinogram of a particular crystalline phase and carry out tomographic reconstruction. Similarly, other diffraction peaks can be selected and individual crystalline phases can be extracted. For diffraction contrast tomography, the radiography image consists of the absorption map as well as the diffraction spots upon satisfying Bragg’s law condition. The diffraction spots are separated from the radiography image, for example, by grey value thresholding and are analyzed based on the spatial and crystallographic criterion. Once the diffraction spots are analyzed, the local crystallographic orientation is calculated. In this approach along with the reconstruction, the data analysis is composed of many computational algorithms used to subtract the absorption component, analyse the scattering pattern and extract the different crystallographic phases [149,150,151]. Commercial systems to carry out laboratory based X-ray diffraction or diffraction contrast X-ray tomography are also available, where grain sizes down to 40 m can be resolved [152,153].
- Spectral imaging—It combines spectroscopy and imaging techniques, such that one can spatially resolve the degree of absorption as a function of X-ray energy thereby identifying the local chemical states [154]. Such spatially resolved spectral/absorption images can be obtained in synchrotron sources by tuning the X-ray photon energies to the signature absorption edges of the material [155]. However, lab-based X-ray sources are polychromatic in nature with energy typically ranging from 1 keV–160 keV. As typical X-ray detectors only measure the total dose deposited on the scintillator material, the spectral information, i.e., absorbance signal of the different X-ray energies are mixed up, hence the chemical information is lost. To overcome these issues, spectral imaging can be applied by (1) using different source spectra or (2) by using spectral or photon-counting X-ray detectors. In the former, different (yet often overlapping) spectra are used, i.e., different energy ranges as in the case of lab-based dual microtomography setup, such that the ratio in the absorbance signal is different for different chemical components [156]. However, such methods typically have limited efficiency, and require good calibration. The same can also be achieved at the detector level. Spectral imaging detectors can be divided into multispectral and hyperspectral detectors. Multispectral detectors can measure photons with different energy ranges (or energy bins). They usually have relatively poor energy resolution and suffer from the charge sharing effect, yet promising results have been achieved to identify specific materials. Alternatively, hyperspectral detectors can be used, where the number of energy bins are higher, and can provide higher energy resolution than a multispectral detector. Nevertheless, the energy resolution achievable using a hyperspectral detector is still lower than what is achievable at synchrotrons where the photon energy is tuned by the monochromator, allowing for extremely high spectral resolutions (down to eV level at hard X-ray range). Implementing a hyperspectral detector system can have numerous challenges, and typically require large upgrades at the detector, such as with the electronics and data acquisition software [157,158,159,160,161]. Different (hyper)spectral detectors are being developed, and can be a suitable imaging tool for pharmaceutical compounds at high X-ray energies.
- Qualitative analysis—the datasets can be rendered in 3D for visual analysis, assessing, for example, the surface topology or the internal structure. The virtual volume can be manipulated using, for example, virtual cut-throughs, and the 3D spatial nature of the volume makes interpretation very intuitive. However, this interpretation is also the major limitation of such types of analysis.
- Quantitative analysis—the 3D volume can be analyzed by dedicated software, retrieving information such as pore/particle size distributions, density measurements, etc. Though such analysis methods can yield very interesting numerical results, they imply a data reduction, i.e., loss in information. An example hereof is the pore or particle size distribution, discarding the spatial information, hence neglecting areas with deviating pore sizes. Combining 3D analysis with 3D rendering can be a good way to overcome such limitations as shown in Figure 2.
- Modelling and simulation—Finally, the 3D dataset can be used as an input model for simulations, such as fluid flow simulations or finite element analysis. Such analysis based on real 3D data can be extremely powerful, but care must be taken in the extraction of the input model, and the researcher must be aware of the limitations of the input data.
- Grey value thresholding-which uses the grey scale of an image/histogram with either 1 or 2 boundaries to determine the voxels of interest.
- Object based segmentation-where segmentation is carried out by identifying groups of pixels by their shape or size (it is typically carried out by machine learning approaches such as training a convolutional neural network).
- Clustering based segmentation-where the pixel intensities are clustered by the algorithm into a number of groups based on input conditions.
- Iterative based segmentation-where the pixels are sorted based on mathematical models.

| Modality | Resolution | Measurement Time | Applications |
|---|---|---|---|
| Lab-based microtomography | 3–20 m (F) | Minutes to tens of minutes (e.g., [186]). Faster acquisition possible, typically for 4D imaging (e.g., [187]) | Determine density/content distribution, pores characterization, coating layer characterization, study of dynamic process |
| Lab-based nanotomography | 0.3 m–1 m (PF) | Few hours to as high as 24 h, depending on the exposure time, resolution | Determine density/content distribution, pores characterization, coating layer characterization |
| Synchrotron-based microtomography | ≥0.3 m (F) | Seconds to minutes, depending on the field-of-view and resolution (e.g., [188]) | For high resolution images, monochromatic X-ray can be tuned to characteristic absorption edge where applicable for chemical characterization, study of dynamic process (with higher time resolution but is limited by sample rotation) |
| Synchrotron-based nanotomography | ≥30 nm (PF) | Tens of minutes to hours (e.g., [189]) | For high resolution images, monochromatic X-ray can be tuned to characteristic absorption edge where applicable for chemical characterization |
| Ptycho-tomography | ≥10 nm (PF) | Few hours (e.g., [190]) | Imaging nanosize pores/particles, obtain pore network information, obtain simultaneous phase and amplitude information |
| Phase contrast microtomography (synchrotrons) | ≥1 m (F) | Measurement time similar to microtomography (e.g., [191]) (requires additional time for determining the appropriate position of the detector) | Enhance contrast for samples with similar attenuation coefficients |
| Dark field imaging (synchrotrons) | ≥1 m (F) | Tens of minutes to hours, depends on the source used, and desired quality and resolution, (e.g., [192]) | Identify sub-voxel features below the resolution of the system and not visible in phase or absorption contrast imaging, enhanced contrast for samples with similar attenuation coefficients |
| Small angle X-ray scattering tensor tomography (synchrotrons) | ≥50 nm (F) | Tens of hours (about 35 h for 25 m voxel size [142]) | Identify local orientation of the particles, crystallographic orientation, anisotropy |
| Synchrotron-based diffraction contrast tomography | ≥0.5 m (F) | Few hours (for diffraction contrast tomography [149]) | Identify local crystal structure |
3. Tablet Characterization
3.1. Mechanical Testing
3.2. Content Distribution
3.3. Intrinsic Properties
3.4. Coating Thickness Analysis
3.5. Dissolution Analysis
4. Conclusions and Future Outlook
Author Contributions
Funding
Institutional Review Board Statement
Informed Consent Statement
Data Availability Statement
Acknowledgments
Conflicts of Interest
References
- Taylor, K.M.G.; Aulton, M.E. Aulton’s Pharmaceutics E-Book: The Design and Manufacture of Medicines; Elsevier Health Sciences: Amsterdam, The Netherlands, 2017. [Google Scholar]
- Amigo, J.M. Practical issues of hyperspectral imaging analysis of solid dosage forms. Anal. Bioanal. Chem. 2010, 398, 93–109. [Google Scholar] [CrossRef] [PubMed]
- Sacher, S.; Khinast, J.G. An Overview of Pharmaceutical Manufacturing for Solid Dosage Forms. In Process Simulation and Data Modeling in Solid Oral Drug Development and Manufacture. Methods in Pharmacology and Toxicology; Ierapetritou, M.G., Ramachandran, R., Eds.; Humana: New York, NY, USA, 2016; pp. 311–383. [Google Scholar]
- Lieberman, H.A.; Lachman, L.; Schwartz, J.B. (Eds.) Pharmaceutical Dosage Forms: Tablets; Marcel Dekker Inc.: New York, NY, USA, 1980; Volume 1. [Google Scholar]
- Wadke, D.A.; Serajuddin, A.T.M.; Jacobson, H. Preformulation Testing. In Pharmaceutical Dosage Forms: Tablets; Lieberman, H.A., Lachman, L., Schwartz, J.B., Eds.; Marcel Dekker Inc.: New York, NY, USA, 1989; Volume 1, Chapter 1; pp. 1–73. [Google Scholar]
- Kawakami, K. Current status of amorphous formulation and other special dosage forms as formulations for early clinical phases. J. Pharm. Sci. 2009, 98, 2875–2885. [Google Scholar] [CrossRef] [PubMed]
- U.S. Department of Health and Human Services Food and Drug Administration Center for Drug Evaluation and Research (CDER). Dissolution Testing and Acceptance Criteria for Immediate-Release Solid Oral Dosage Form Drug Products Containing High Solubility Drug Substances Guidance for Industry; Food and Drug Administration Agency: Silver Spring, MD, USA, 2018. Available online: https://www.fda.gov/files/drugs/published/Dissolution-Testing-and-Acceptance-Criteria-for-Immediate-Release-Solid-Oral-Dosage-Form-Drug-Products-Containing-High-Solubility-Drug-Substances-Guidance-for-Industry.pdf (accessed on 1 April 2023).
- Amidon, G.L.; Lennernas, H.; Shah, V.P.; Crison, J.R. A Theoretical Basis for a Biopharmaceutic Drug Classification: The Correlation of In Vitro Drug Product Dissolution and In Vivo Bioavailability. Pharm. Res. 1995, 12, 413–420. [Google Scholar] [CrossRef] [PubMed]
- Shah, V.P.; Amidon, G.L.; Lennernas, H.; Crison, J.R. A Theoretical Basis for a Biopharmaceutic Drug Classification: The Correlation of In Vitro Drug Product Dissolution and In Vivo Bioavailability, Pharm Res 12, 413–420, 1995–Backstory of BCS. AAPS J. 2014, 16, 894–898. [Google Scholar] [CrossRef] [PubMed]
- Ahuja, S.; Scypinski, S. Handbook of Modern Pharmaceutical Analysis; Academic Press: San Diego, CA, USA, 2001; Volume 3. [Google Scholar]
- Guo, Y.; Shalaev, E.; Smith, S. Physical stability of pharmaceutical formulations: Solid-state characterization of amorphous dispersions. TrAC Trends Anal. Chem. 2013, 49, 137–144. [Google Scholar] [CrossRef]
- Hancock, B.C.; Mullarney, M.P. X-ray Microtomography of Solid Dosage Forms. Data Rev. 2005, 29, 92–100. [Google Scholar]
- U.S. Department of Health and Human Services Food and Drug Administration Center for Drug Evaluation and Research (CDER). Guidance for Industry SUPAC-MR: Modified Release Solid Oral Dosage Forms; Food and Drug Administration Agency: Silver Spring, MD, USA, 1997. Available online: https://www.fda.gov/regulatory-information/search-fda-guidance-documents/supac-mr-modified-release-solid-oral-dosage-forms-scale-and-postapproval-changes-chemistry (accessed on 1 April 2023).
- U.S. Department of Health and Human Services Food and Drug Administration Center for Drug Evaluation and Research (CDER). Guidance for Industry Dissolution Testing of Immediate Release Solid Oral Dosage Forms; Food and Drug Administration Agency: Silver Spring, MD, USA, 1997. Available online: https://www.fda.gov/regulatory-information/search-fda-guidance-documents/dissolution-testing-immediate-release-solid-oral-dosage-forms (accessed on 1 April 2023).
- U.S. Department of Health and Human Services Food and Drug Administration Center for Drug Evaluation and Research (CDER). Guidance for Industry Extended Release Oral Dosage Forms: Development, Evaluation, and Application of In Vitro/In Vivo Correlations; Food and Drug Administration Agency: Silver Spring, MD, USA, 1997. Available online: https://www.fda.gov/regulatory-information/search-fda-guidance-documents/extended-release-oral-dosage-forms-development-evaluation-and-application-vitroin-in-vivo-correlations (accessed on 1 April 2023).
- U.S. Department of Health and Human Services Food and Drug Administration Center for Drug Evaluation and Research (CDER). Guidance for Industry Immediate Release Solid Oral Dosage Forms Scale-Up and Post Approval Changes: Chemistry, Manufacturing, and Controls, In Vitro Dissolution Testing, and In Vivo Bioequivalence Documentation; Food and Drug Administration Agency: Silver Spring, MD, USA, 1997. Available online: https://www.fda.gov/regulatory-information/search-fda-guidance-documents/supac-ir-immediate-release-solid-oral-dosage-forms-scale-and-post-approval-changes-chemistry (accessed on 1 April 2023).
- Committee for Human Medicinal Products (CHMP). Guideline on Manufacture of the Finished Dosage Form; European Medical Agency: Amsterdam, The Netherlands, 2017; Available online: https://www.ema.europa.eu/en/manufacture-finished-dosage-form-human-scientific-guideline (accessed on 1 April 2023).
- Committee for Medicinal Products for Human use (CHMP); Committee for Medicinal Products for Veterinary use (CVMP); Quality Working Party (QWP). Reflection Paper on the Dissolution Specification for Generic Solid Oral Immediate Release Products with Systemic Action; European Medical Agency: Amsterdam, The Netherlands, 2017; Available online: https://www.ema.europa.eu/en/dissolution-specification-generic-oral-immediate-release-products-scientific-guideline (accessed on 1 April 2023).
- Allen, L.; Ansel, H.C. Ansel’s Pharmaceutical Dosage Forms and Drug Delivery Systems; Lippincott Williams & Wilkins: Philadelphia, PA, USA, 2013. [Google Scholar]
- Axel Zeitler, J.; Gladden, L.F. In-vitro tomography and non-destructive imaging at depth of pharmaceutical solid dosage forms. Eur. J. Pharm. Biopharm. 2009, 71, 2–22. [Google Scholar] [CrossRef]
- Østergaard, J. UV imaging in pharmaceutical analysis. J. Pharm. Biomed. Anal. 2018, 147, 140–148. [Google Scholar] [CrossRef]
- Bostijn, N.; Hellings, M.; Van Der Veen, M.; Vervaet, C.; De Beer, T. In-line UV spectroscopy for the quantification of low-dose active ingredients during the manufacturing of pharmaceutical semi-solid and liquid formulations. Anal. Chim. Acta 2018, 1013, 54–62. [Google Scholar] [CrossRef]
- Atole, D.M.; Rajput, H.H. Ultraviolet spectroscopy and its pharmaceutical applications-a brief review. Asian J. Pharm. Clin. Res. 2018, 11, 59–66. [Google Scholar] [CrossRef]
- Wartewig, S.; Neubert, R.H.H. Pharmaceutical applications of Mid-IR and Raman spectroscopy. Adv. Drug Deliv. Rev. 2005, 57, 1144–1170. [Google Scholar] [CrossRef] [PubMed]
- Eerdenbrugh, B.V.; Taylor, L.S. Application of mid-IR spectroscopy for the characterization of pharmaceutical systems. Int. J. Pharm. 2011, 417, 3–16. [Google Scholar] [CrossRef] [PubMed]
- Wargo, D.J.; Drennen, J.K. Near-infrared spectroscopic characterization of pharmaceutical powder blends. J. Pharm. Biomed. Anal. 1996, 14, 1415–1423. [Google Scholar] [CrossRef] [PubMed]
- Luypaert, J.; Massart, D.L.; Vander Heyden, Y. Near-infrared spectroscopy applications in pharmaceutical analysis. Talanta 2007, 72, 865–883. [Google Scholar] [CrossRef] [PubMed]
- Räsänen, E.; Sandler, N. Near infrared spectroscopy in the development of solid dosage forms. J. Pharm. Pharmacol. 2007, 59, 147–159. [Google Scholar] [CrossRef]
- Ciurczak, E. Uses of Near-Infrared Spectroscopy in Pharmaceutical Analysis. Appl. Spectrosc. Rev. 1987, 23, 147–163. [Google Scholar] [CrossRef]
- Reich, G. Near-infrared spectroscopy and imaging: Basic principles and pharmaceutical applications. Adv. Drug Deliv. Rev. 2005, 57, 1109–1143. [Google Scholar] [CrossRef]
- Rantanen, J. Process analytical applications of Raman spectroscopy. J. Pharm. Pharmacol. 2007, 59, 171–177. [Google Scholar] [CrossRef]
- Saerens, L.; Dierickx, L.; Lenain, B.; Vervaet, C.; Remon, J.P.; Beer, T.D. Raman spectroscopy for the in-line polymer–drug quantification and solid state characterization during a pharmaceutical hot-melt extrusion process. Eur. J. Pharm. Biopharm. 2011, 77, 158–163. [Google Scholar] [CrossRef]
- Paudel, A.; Raijada, D.; Rantanen, J. Raman spectroscopy in pharmaceutical product design. Adv. Drug Deliv. Rev. 2015, 89, 3–20. [Google Scholar] [CrossRef]
- Johansson, J.; Sparén, A.; Svensson, O.; Folestad, S.; Claybourn, M. Quantitative Transmission Raman Spectroscopy of Pharmaceutical Tablets and Capsules. Appl. Spectrosc. 2007, 61, 1211–1218. [Google Scholar] [CrossRef] [PubMed]
- Buckley, K.; Matousek, P. Recent advances in the application of transmission Raman spectroscopy to pharmaceutical analysis. J. Pharm. Biomed. Anal. 2011, 55, 645–652. [Google Scholar] [CrossRef]
- Emanuele, A.D.; Gilpin, C. Applications of the environmental scanning electron microscope to the analysis of pharmaceutical formulations. Scanning 1996, 18, 522–527. [Google Scholar] [CrossRef]
- Liang, J.Q.; Lin, A.; Dulin, W.; Tesconi, M.; Ku, M.S. Contributions of SEM in pharmaceutical QbD for Formulation Development and Manufacture Process Control. Microsc. Microanal. 2008, 14, 1606–1607. [Google Scholar] [CrossRef]
- Šimek, M.; Grünwaldová, V.; Kratochvíl, B. A new way of solid dosage form samples preparation for SEM and FTIR using microtome. Pharm. Dev. Technol. 2014, 19, 411–416. [Google Scholar] [CrossRef] [PubMed]
- Klang, V.; Valenta, C.; Matsko, N.B. Electron microscopy of pharmaceutical systems. Micron 2013, 44, 45–74. [Google Scholar] [CrossRef]
- Sarecka-Hujar, B.; Balwierz, R.; Ostrozka-Cieslik, A.; Dyja, R.; Lukowiec, D.; Jankowski, A. Scanning electron microscopy and X-ray energy dispersive spectroscopy—Useful tools in the analysis of pharmaceutical products. J. Phys. Conf. Ser. 2017, 931, 012008. [Google Scholar] [CrossRef]
- Eddleston, M.D.; Bithell, E.G.; Jones, W. Transmission Electron Microscopy of Pharmaceutical Materials. J. Pharm. Sci. 2010, 99, 4072–4083. [Google Scholar] [CrossRef]
- Holzgrabe, U. NMR Spectroscopy in Pharmaceutical Analysis; Elsevier: Amsterdam, The Netherlands, 2017. [Google Scholar]
- Holzgrabe, U. Quantitative NMR spectroscopy in pharmaceutical applications. Prog. Nucl. Magn. Reson. Spectrosc. 2010, 57, 229–240. [Google Scholar] [CrossRef]
- Melia, C.D.; Rajabi-Siahboomi, R.A.; Bowtell, R.W. Magnetic resonance imaging of controlled release pharmaceutical dosage forms. Pharm. Sci. Technol. Today 1998, 1, 32–39. [Google Scholar] [CrossRef]
- Richardson, J.C.; Bowtell, R.W.; Mäder, K.; Melia, C.D. Pharmaceutical applications of magnetic resonance imaging (MRI). Adv. Drug Deliv. Rev. 2005, 57, 1191–1209. [Google Scholar] [CrossRef] [PubMed]
- Axel Zeitler, J.; Taday, P.F.; Newnham, D.A.; David, A.; Pepper, M.; Gordon, K.C.; Rades, T. Terahertz pulsed spectroscopy and imaging in the pharmaceutical setting—A review. J. Pharm. Pharmacol. 2007, 59, 209–223. [Google Scholar] [CrossRef] [PubMed]
- Laity, P.R.; Han, L.; Elliott, J.; Cameron, R.E. Variations in Compaction Behaviour for Tablets of Different Size and Shape, Revealed by Small-Angle X-ray Scattering. J. Pharm. Sci. 2010, 99, 4380–4389. [Google Scholar] [CrossRef] [PubMed]
- Yamada, H.; Masuda, K.; Ishige, T.; Fujii, K.; Uekusa, H.; Miura, K.; Yonemochi, E.; Terada, K. Potential of synchrotron X-ray powder diffractometry for detection and quantification of small amounts of crystalline drug substances in pharmaceutical tablets. J. Pharm. Biomed. Anal. 2011, 56, 448–453. [Google Scholar] [CrossRef]
- Yamada, H.; Suryanarayanan, R. X-ray Powder Diffractometry of Intact Film Coated Tablets—An Approach to Monitor the Physical Form of the Active Pharmaceutical Ingredient During Processing and Storage. J. Pharm. Sci. 2007, 96, 2029–2036. [Google Scholar] [CrossRef]
- Yamada, H.; Terada, K.; Suryanarayanan, R. Non-destructive determination of the coating film thickness by X-ray powder diffractometry and correlation with the dissolution behavior of film-coated tablets. J. Pharm. Biomed. Anal. 2010, 51, 952–957. [Google Scholar] [CrossRef]
- Sinka, I.C.; Motazedian, F.; Cocks, A.; Pitt, K.G. The effect of processing parameters on pharmaceutical tablet properties. Powder Technol. 2009, 189, 276–284. [Google Scholar] [CrossRef]
- Stranzinger, S.; Markl, D.; Khinast, J.; Paudel, A. Review of sensing technologies for measuring powder density variations during pharmaceutical solid dosage form manufacturing. TrAC Trends Anal. Chem. 2021, 135, 116147. [Google Scholar] [CrossRef]
- Mazivila, S.J.; Olivieri, A.C. Chemometrics coupled to vibrational spectroscopy and spectroscopic imaging for the analysis of solid-phase pharmaceutical products: A brief review on non-destructive analytical methods. TrAC Trends Anal. Chem. 2018, 108, 74–87. [Google Scholar] [CrossRef]
- Liu, L.; Qu, H. Recent advancement of chemical imaging in pharmaceutical quality control: From final product testing to industrial utilization. J. Innov. Opt. Health Sci. 2020, 13, 1930014. [Google Scholar] [CrossRef]
- Asachi, M.; Nourafkan, E.; Hassanpour, A. A review of current techniques for the evaluation of powder mixing. Adv. Powder Technol. 2018, 29, 1525–1549. [Google Scholar] [CrossRef]
- York, P. Solid-state properties of powders in the formulation and processing of solid dosage forms. Int. J. Pharm. 1983, 14, 1–28. [Google Scholar] [CrossRef]
- Datta, S.; Grant, D.J.W. Crystal structures of drugs: Advances in determination, prediction and engineering. Nat. Rev. Drug Discov. 2004, 3, 42–57. [Google Scholar] [CrossRef]
- Uddin, R.; Saffoon, N.; Sutradhar, K.B. Dissolution and dissolution apparatus: A review. Int. J. Curr. Biomed. Pharm. Res. 2011, 1, 201–207. [Google Scholar]
- Gordon, K.C.; McGoverin, C.M. Raman mapping of pharmaceuticals. Int. J. Pharm. 2011, 417, 151–162. [Google Scholar] [CrossRef]
- Dieing, T. Resolution and Performance of 3D Confocal Raman Imaging Systems. In Confocal Raman Microscopy; Toporski, J., Dieing, T., Hollricher, O., Eds.; Springer International Publishing: Cham, Switzerland, 2018; pp. 121–153. [Google Scholar]
- Lamberts, L.E.; Williams, S.P.; van Scheltinga, A.G.T.T.; de Hooge, M.N.L.; Schroder, C.P.; Gietema, J.A.; Brouwers, A.H.; de Vries, E.G.E. Antibody Positron Emission Tomography Imaging in Anticancer Drug Development. J. Clin. Oncol. 2015, 33, 1491–1504. [Google Scholar] [CrossRef] [PubMed]
- Treimer, W.; Hilger, A.; Kardjilov, N.; Strobl, M. Review about old and new imaging signals for neutron computerized tomography. Nucl. Instruments Methods Phys. Res. Sect. A Accel. Spectrometers Detect. Assoc. Equip. 2005, 542, 367–375. [Google Scholar] [CrossRef]
- Withers, P.J.; Bouman, C.; Carmignato, S.; Cnudde, V.; Grimaldi, D.; Hagen, C.K.; Maire, E.; Manley, M.; Plessis, A.D.; Stock, S.R. X-ray computed tomography. Nat. Rev. Methods Prim. 2021, 1, 18. [Google Scholar] [CrossRef]
- Vásárhelyi, L.; Kónya, Z.; Kukovecz, Á.; Vajtai, R. Microcomputed tomography–based characterization of advanced materials: A review. Mater. Today Adv. 2020, 8, 100084. [Google Scholar] [CrossRef]
- Masschaele, B.C.; Cnudde, V.; Dierick, M.; Jacobs, P.; Hoorebeke, L.V.; Vlassenbroeck, J. UGCT: New X-ray radiography and tomography facility. Nucl. Instrum. Methods Phys. Res. Sect. A Accel. Spectrometers Detect. Assoc. Equip. 2007, 580, 266–269. [Google Scholar] [CrossRef]
- Maire, E.; Withers, P.J. Quantitative X-ray tomography. Int. Mater. Rev. 2014, 59, 1–43. [Google Scholar] [CrossRef]
- Buffiére, J.Y.; Maire, E.; Adrien, J.; Masse, J.P.; Boller, E. In situ experiments with X-ray tomography: An attractive tool for experimental mechanics. Exp. Mech. 2010, 50, 289–305. [Google Scholar] [CrossRef]
- Salvo, L.; Cloetens, P.; Maire, E.; Zabler, S.; Blandin, J.J.; Buffiére, J.Y.; Ludwig, W.; Boller, E.; Bellet, D.; Josserond, C. X-ray micro-tomography an attractive characterisation technique in materials science. Nucl. Instrum. Methods Phys. Res. Sect. B Beam Interact. Mater. Atoms 2003, 200, 273–286. [Google Scholar] [CrossRef]
- Cnudde, V.; Boone, M. High-resolution X-ray computed tomography in geosciences: A review of the current technology and applications. Earth-Sci. Rev. 2013, 123, 1–17. [Google Scholar] [CrossRef]
- Carmignato, S.; Dewulf, W.; Leach, R. Industrial X-ray Computed Tomography; Springer: Berlin/Heidelberg, Germany, 2018. [Google Scholar]
- Nebgen, G.; Gross, D.; Lehmann, V.; Müller, F. 1H-NMR Microscopy of Tablets. J. Pharm. Sci. 1995, 84, 283–291. [Google Scholar] [CrossRef]
- Djemai, A.; Sinka, I.C. NMR imaging of density distributions in tablets. Int. J. Pharm. 2006, 319, 55–62. [Google Scholar] [CrossRef] [PubMed]
- Kwieciński, S.; Weychert, M.; Jasiński, A.; Kulinowski, P.P.; Wawer, I.; Sieradzki, E. Tablet disintegration monitored by magnetic resonance Imaging. Appl. Magnet. Reson. 2002, 22, 23–29. [Google Scholar] [CrossRef]
- Vontobel, P.; Lehmann, E.H.; Hassanein, R.; Frei, G. Neutron tomography: Method and applications. Phys. B Condens. Matter 2006, 385–386, 475–480. [Google Scholar] [CrossRef]
- Strobl, M.; Treimer, W.; Hilger, A. Small angle scattering signals for (neutron) computerized tomography. Appl. Phys. Lett. 2004, 85, 488–490. [Google Scholar] [CrossRef]
- Heacock, B.; Sarenac, D.; Cory, D.G.; Huber, M.G.; MacLean, J.P.W.; Miao, H.; Wen, H.; Pushin, D.A. Neutron sub-micrometre tomography from scattering data. IUCrJ 2020, 7, 893–900. [Google Scholar] [CrossRef]
- Samothrakitis, S.; Raventós, M.; Čapek, J.; Larsen, C.B.; Grünzweig, C.; Tovar, M.; Garcia-Gonzalez, M.; Kopeček, J.; Schmidt, S.; Strobl, M. Grain morphology reconstruction of crystalline materials from Laue three-dimensional neutron diffraction tomography. Sci. Rep. 2020, 10, 3724. [Google Scholar] [CrossRef] [PubMed]
- Pfeiffer, F.; Grünzweig, C.; Bunk, O.; Frei, G.; Lehmann, E.; David, C. Neutron Phase Imaging and Tomography. Phys. Rev. Lett. 2006, 96, 215505. [Google Scholar] [CrossRef] [PubMed]
- Tengattini, A.; Lenoir, N.; Andó, E.; Viggiani, G. Neutron imaging for geomechanics: A review. Geomech. Energy Environ. 2020, 27, 100206. [Google Scholar] [CrossRef]
- Trtik, P.; Meyer, M.; Wehmann, T.; Tengattini, A.; Atkins, D.; Lehmann, E.H.; Strobl, M. PSI ‘neutron microscope’at ILL-D50 beamline—First results. Mater. Res. Proc. 2020, 15, 23–28. [Google Scholar]
- Tengattini, A.; Lenoir, N.; Andò, E.; Giroud, B.; Atkins, D.; Beaucour, J.; Viggiani, G. NeXT-Grenoble, the Neutron and X-ray tomograph in Grenoble. Nucl. Instrum. Methods Phys. Res. Sect. A Accel. Spectrometers Detect. Assoc. Equip. 2020, 968, 163939. [Google Scholar] [CrossRef]
- Markl, D.; Axel Zeitler, J.; Rasch, C.; Michaelsen, M.H.; Müllertz, A.; Rantanen, J.; Rades, T.; Bøtker, J. Analysis of 3D prints by X-ray computed microtomography and terahertz pulsed imaging. Pharm. Res. 2017, 34, 1037–1052. [Google Scholar] [CrossRef]
- Peiponen, K.E.; Silfsten, P.; Pajander, J.; Ketolainen, J. Broadening of a THz pulse as a measure of the porosity of pharmaceutical tablets. Int. J. Pharm. 2013, 447, 7–11. [Google Scholar] [CrossRef]
- Dong, R.; Zeitler, J.A. Visualising liquid transport through coated pharmaceutical tablets using Terahertz pulsed imaging. Int. J. Pharm. 2022, 619, 121703. [Google Scholar] [CrossRef] [PubMed]
- Axel Zeitler, J.; Shen, Y.; Baker, C.; Taday, P.F.; Pepper, M.; Rades, T. Analysis of coating structures and interfaces in solid oral dosage forms by three dimensional terahertz pulsed imaging. J. Pharm. Sci. 2007, 96, 330–340. [Google Scholar] [CrossRef]
- Li, C.; Axel Zeitler, J.; Dong, Y.; Shen, Y.C. Non-Destructive Evaluation of Polymer Coating Structures on Pharmaceutical Pellets Using Full-Field Optical Coherence Tomography. J. Pharm. Sci. 2014, 103, 161–166. [Google Scholar] [CrossRef]
- Markl, D.; Hannesschläger, G.; Sacher, S.; Leitner, M.; Khinast, J.G.; Buchsbaum, A. Automated pharmaceutical tablet coating layer evaluation of optical coherence tomography images. Meas. Sci. Technol. 2015, 26, 035701. [Google Scholar] [CrossRef]
- Schermelleh, L.; Heintzmann, R.; Leonhardt, H. A guide to super-resolution fluorescence microscopy. J. Cell Biol. 2010, 190, 165–175. [Google Scholar] [CrossRef] [PubMed]
- Willmott, P. An Introduction to Synchrotron Radiation: Techniques and Applications; Jhon Wiley and Sons Ltd.: Chichester, UK, 2011. [Google Scholar]
- Henke, B.L.; Gullikson, E.M.; Davis, J.C. X-Ray Interactions: Photoabsorption, Scattering, Transmission, and Reflection at E = 50–30,000 eV, Z = 1–92. At. Data Nucl. Data Tables 1993, 54, 181–342. [Google Scholar] [CrossRef]
- Groot, F.D. High-resolution X-ray emission and X-ray absorption spectroscopy. Chem. Rev. 2001, 101, 1779–1808. [Google Scholar] [CrossRef]
- Penner-Hahn, J.E. X-ray absorption spectroscopy. Compr. Coord. Chem. II 2003, 2, 159–186. [Google Scholar]
- Feldkamp, L.A.; Davis, L.C.; Kress, J.W. Practical cone-beam algorithm. J. Opt. Soc. Am. A 1984, 1, 612–619. [Google Scholar] [CrossRef]
- Turbell, H. Cone-Beam Reconstruction Using Filtered Backprojection. Ph.D. Thesis, Linköping Universitet, Linköping, Sweden, 2001. [Google Scholar]
- Feser, M.; Gelb, J.; Chang, H.; Cui, H.; Duewer, F.; Lau, S.H.; Tkachuk, A.; Yun, W. Sub-micron resolution CT for failure analysis and process development. Meas. Sci. Technol. 2008, 19, 094001. [Google Scholar] [CrossRef]
- Gelb, J.; Feser, M.; Tkachuk, A.; Hsu, G.; Chen, S.; Chang, H.; Fong, T.; Hunter, L.; Goldberger, I.; Lau, S.H.; et al. Sub-micron X-ray Computed Tomography for Non-Destructive 3D Visualization and Analysis. Microsc. Microanal. 2009, 15, 618–619. [Google Scholar] [CrossRef]
- Koch, A.; Raven, C.; Spanne, P.; Snigirev, A. X-ray imaging with submicrometer resolution employing transparent luminescent screens. J. Opt. Soc. Am. A 1998, 15, 1940–1951. [Google Scholar] [CrossRef]
- Landis, E.N.; Keane, D.T. X-ray microtomography. Mater. Charact. 2010, 61, 1305–1316. [Google Scholar] [CrossRef]
- Kak, A.C.; Slaney, M.; Wang, G. Principles of Computerized Tomographic Imaging. Med. Phys. 2002, 29, 107. [Google Scholar] [CrossRef]
- Boone, M.N.; Witte, Y.D.; Dierick, M.; Almeida, A.; Hoorebeke, L.V. Improved Signal-to-Noise Ratio in Laboratory-Based Phase Contrast Tomography. Microsc. Microanal. 2012, 18, 399–405. [Google Scholar] [CrossRef] [PubMed]
- Haneca, K.; Deforce, K.; Boone, M.N.; Loo, D.V.; Dierick, M.; Acker, J.V.; Bulcke, J.V.D. X-ray Sub-Micron Tomography as a Tool for the Study of Archaeological Wood Preserved through the Corrosion of Metal Objects. Archaeometry 2012, 54, 893–905. [Google Scholar] [CrossRef]
- Den Bulcke, J.V.; Boone, M.; Acker, J.V.; Stevens, M.; Hoorebeke, L.V. X-ray tomography as a tool for detailed anatomical analysis. Ann. For. Sci. 2009, 66, 508. [Google Scholar] [CrossRef]
- Wong, J.; D’Sa, D.; Foley, M.; Chan, J.G.Y.; Chan, H.K. NanoXCT: A novel technique to probe the internal architecture of pharmaceutical particles. Pharm. Res. 2014, 31, 3085–3094. [Google Scholar] [CrossRef] [PubMed]
- Martin, T.; Koch, A. Recent developments in X-ray imaging with micrometer spatial resolution. J. Synchrotron Radiat. 2006, 13, 180–194. [Google Scholar] [CrossRef]
- Stampanoni, M.; Marone, F.; Mikuljan, G.; Jefimovs, K.; Trtik, P.; Vila-Comamala, J.; David, C.; Abela, R. Broadband X-ray full field microscopy at a superbend. J. Phys. Conf. Ser. 2009, 186, 012018. [Google Scholar] [CrossRef]
- Weitkamp, T.; Scheel, M.; Giorgetta, J.L.; Joyet, V.; Roux, V.L.; Cauchon, G.; Moreno, T.; Polack, F.; Thompson, A.; Samama, J.P. The tomography beamline ANATOMIX at Synchrotron SOLEIL. J. Phys. Conf. Ser. 2017, 849, 012037. [Google Scholar] [CrossRef]
- Jefimovs, K.; Vila-Comamala, J.; Stampanoni, M.; Kaulich, B.; David, C. Beam-shaping condenser lenses for full-field transmission X-ray microscopy. J. Synchrotron Radiat. 2008, 15, 106–108. [Google Scholar] [CrossRef]
- Pfeiffer, F. X-ray ptychography. Nat. Photonics 2018, 12, 9–17. [Google Scholar] [CrossRef]
- Nugent, K.A. Coherent methods in the X-ray sciences. Adv. Phys. 2010, 59, 1–99. [Google Scholar] [CrossRef]
- Thibault, P.; Dierolf, M.; Menzel, A.; Bunk, O.; David, C.; Pfeiffer, F. High-resolution scanning x-ray diffraction microscopy. Science 2008, 321, 379–382. [Google Scholar] [CrossRef] [PubMed]
- Fienup, J.R. Phase retrieval algorithms: A comparison. Appl. Opt. 1982, 21, 2758–2769. [Google Scholar] [CrossRef] [PubMed]
- Thibault, P.; Dierolf, M.; Bunk, O.; Menzel, A.; Pfeiffer, F. Probe retrieval in ptychographic coherent diffractive imaging. Ultramicroscopy 2009, 109, 338–343. [Google Scholar] [CrossRef]
- Marchesini, S.; Tu, Y.C.; Wu, H.T. Alternating Projection, Ptychographic Imaging and Phase Synchronization. Appl. Comput. Harmon. Anal. 2016, 41, 815–851. [Google Scholar] [CrossRef]
- Faulkner, H.M.L.; Rodenburg, J.M. Movable aperture lensless transmission microscopy: A novel phase retrieval algorithm. Phys. Rev. Lett. 2004, 93, 023903. [Google Scholar] [CrossRef]
- Rodenburg, J.M.; Faulkner, H.M.L. A phase retrieval algorithm for shifting illumination. Appl. Phys. Lett. 2004, 85, 4795–4797. [Google Scholar] [CrossRef]
- Odstrčil, M.; Menzel, A.; Guizar-Sicairos, M. Iterative least-squares solver for generalized maximum-likelihood ptychography. Opt. Express 2018, 26, 3108–3123. [Google Scholar] [CrossRef]
- Thibault, P.; Guizar-Sicairos, M. Maximum-likelihood refinement for coherent diffractive imaging. New J. Phys. 2012, 14, 063004. [Google Scholar] [CrossRef]
- Favre-Nicolin, V.; Girard, G.; Leake, S.; Carnis, J.; Chushkin, Y.; Kieffer, J.; Paleo, P.; Marie-Ingrid, R. PyNX: High-performance computing toolkit for coherent X-ray imaging based on operators. J. Appl. Crystallogr. 2020, 53, 1404–1413. [Google Scholar] [CrossRef]
- Enders, B.; Thibault, P. A computational framework for ptychographic reconstructions. Proc. R. Soc. Math. Phys. Eng. Sci. 2016, 472, 20160640. [Google Scholar] [CrossRef] [PubMed]
- Dierolf, M.; Menzel, A.; Thibault, P.; Schneider, P.; Kewish, C.M.; Wepf, R.; Bunk, O.; Pfeiffer, F. Ptychographic X-ray computed tomography at the nanoscale. Nature 2010, 467, 436–439. [Google Scholar] [CrossRef] [PubMed]
- Batey, D.J.; Assche, F.V.; Vanheule, S.; Boone, M.N.; Parnell, A.J.; Mykhaylyk, O.O.; Rau, C.; Cipiccia, S. X-ray Ptychography with a Laboratory Source. Phys. Rev. Lett. 2021, 126, 193902. [Google Scholar] [CrossRef] [PubMed]
- Davis, T.J.; Gao, D.; Gureyev, T.E.; Stevenson, A.W.; Wilkins, S.W. Phase-contrast imaging of weakly absorbing materials using hard X-rays. Nature 1995, 373, 595–598. [Google Scholar] [CrossRef]
- Pfeiffer, F.; Herzen, J.; Willner, M.; Chabior, M.; Auweter, S.; Reiser, M.; Bamberg, F. Grating-based X-ray phase contrast for biomedical imaging applications. Z. Med. Phys. 2013, 23, 176–185. [Google Scholar] [CrossRef]
- Cloetens, P.; Ludwig, W.; Baruchel, J.; Dyck, D.V.; Landuyt, J.V.; Guigay, J.P.; Schlenker, M. Holotomography: Quantitative phase tomography with micrometer resolution using hard synchrotron radiation X-rays. Appl. Phys. Lett. 1999, 75, 2912–2914. [Google Scholar] [CrossRef]
- Momose, A.; Fukuda, J. Phase-contrast radiographs of nonstained rat cerebellar specimen. Med Phys. 1995, 22, 375–379. [Google Scholar] [CrossRef]
- Bonse, U.; Hart, M. An X-ray interferometer. Appl. Phys. Lett. 1965, 6, 155–156. [Google Scholar] [CrossRef]
- Ingal, V.N.; Beliaevskaya, E.A. X-ray plane-wave topography observation of the phase contrast from a non-crystalline object. J. Phys. D Appl. Phys. 1995, 28, 2314. [Google Scholar] [CrossRef]
- Nugent, K.A.; Gureyev, T.E.; Cookson, D.F.; Paganin, D.; Barnea, Z. Quantitative phase imaging using hard X-rays. Phys. Rev. Lett. 1996, 77, 2961. [Google Scholar] [CrossRef]
- Mayo, S.; Endrizzi, M. X-ray Phase Contrast Methods. In Handbook of Advanced Nondestructive Evaluation; Ida, N., Meyendorf, N., Eds.; Springer International Publishing: Cham, Switzerland, 2019; pp. 1053–1093. [Google Scholar]
- Pfeiffer, F.; Weitkamp, T.; Bunk, O.; David, C. Phase retrieval and differential phase-contrast imaging with low-brilliance X-ray sources. Nat. Phys. 2006, 2, 258–261. [Google Scholar] [CrossRef]
- Weitkamp, T.; Diaz, A.; Nohammer, B.; Pfeiffer, F.; Rohbeck, T.; Cloetens, P.; Stampanoni, M.; David, C. Hard X-ray phase imaging and tomography with a grating interferometer. Int. Soc. Opt. Photonics 2004, 5535, 137–142. [Google Scholar]
- Weitkamp, T.; Diaz, A.; David, C.; Pfeiffer, F.; Stampanoni, M.; Cloetens, P.; Ziegler, E. X-ray phase imaging with a grating interferometer. Opt. Express 2005, 13, 6296–6304. [Google Scholar] [CrossRef] [PubMed]
- McDonald, S.A.; Marone, F.; Hintermüller, C.; Mikuljan, G.; David, C.; Pfeiffer, F.; Stampanoni, M. Advanced phase-contrast imaging using a grating interferometer. J. Synchrotron Radiat. 2009, 16, 562–572. [Google Scholar] [CrossRef]
- Kutsal, M.; Bernard, P.; Berruyer, G.; Cook, P.; Hino, R.; Jakobsen, A.; Ludwig, W.; Ormstrup, J.; Roth, T.; Simons, H.; et al. The ESRF dark-field X-ray microscope at ID06. IOP Conf. Ser. Mater. Sci. Eng. 2019, 580, 012007. [Google Scholar] [CrossRef]
- Stampanoni, M.; Mokso, R.; Marone, F.; Vila-Comamala, J.; Gorelick, S.; Trtik, P.; Jefimovs, K.; David, C. Phase-contrast tomography at the nanoscale using hard X-rays. Phys. Rev. B 2010, 81, 140105. [Google Scholar] [CrossRef]
- Olivo, A. Edge-illumination X-ray phase-contrast imaging. J. Phys. Condens. Matter 2021, 33, 363002. [Google Scholar] [CrossRef]
- Morrison, G.R.; Browne, M.T. Dark-field imaging with the scanning transmission x-ray microscope. Rev. Sci. Instrum. 1992, 63, 611–614. [Google Scholar] [CrossRef]
- Suzuki, Y.; Uchida, F. Dark-field imaging in hard X-ray scanning microscopy. Rev. Sci. Instrum. 1995, 66, 1468–1470. [Google Scholar] [CrossRef]
- Pfeiffer, F.; Bech, M.; Bunk, O.; Kraft, P.; Eikenberry, E.F.; Brönnimann, C.; Grünzweig, C.; David, C. Hard-X-ray dark-field imaging using a grating interferometer. Nat. Mater. 2008, 7, 134–137. [Google Scholar] [CrossRef]
- Kagias, M.; Wang, Z.; Jefimovs, K.; Stampanoni, M. Dual phase grating interferometer for tunable dark-field sensitivity. Appl. Phys. Lett. 2017, 110, 014105. [Google Scholar] [CrossRef]
- Gullberg, G.; Roy, D.; Zeng, G.; Alexander, A.; Parker, D. Tensor Tomography. IEEE Trans. Nucl. Sci. 1999, 46, 991–1000. [Google Scholar] [CrossRef]
- Liebi, M.; Georgiadis, M.; Menzel, A.; Schneider, P.; Kohlbrecher, J.; Bunk, O.; Guizar-Sicairos, M. Nanostructure surveys of macroscopic specimens by small-angle scattering tensor tomography. Nature 2015, 527, 349–352. [Google Scholar] [CrossRef] [PubMed]
- Liebi, M.; Georgiadis, M.; Kohlbrecher, J.; Holler, M.; Raabe, J.; Usov, I.; Menzel, A.; Schneider, P.; Bunk, O.; Guizar-Sicairos, M. Small-angle X-ray scattering tensor tomography: Model of the three-dimensional reciprocal-space map, reconstruction algorithm and angular sampling requirements. Acta Crystallogr. Sect. Found. Adv. 2018, 74, 12–24. [Google Scholar] [CrossRef] [PubMed]
- Poulsen, H.F. Three-Dimensional X-ray Diffraction Microscopy: Mapping Polycrystals and Their Dynamics; Springer Science & Business Media: Berlin/Heidelberg, Germany, 2004; Volume 205. [Google Scholar]
- Ludwig, W.; King, A.; Reischig, P.; Herbig, M.; Lauridsen, E.; Schmidt, S.; Proudhon, H.; Forest, S.; Cloetens, P.; du Roscoat, S.R.; et al. New opportunities for 3D materials science of polycrystalline materials at the micrometre lengthscale by combined use of X-ray diffraction and X-ray imaging. Mater. Sci. Eng. A 2009, 524, 69–76. [Google Scholar] [CrossRef]
- Bleuet, P.; Welcomme, E.; Dooryhée, E.; Susini, J.; Hodeau, J.L.; Walter, P. Probing the structure of heterogeneous diluted materials by diffraction tomography. Nat. Mater. 2008, 7, 468–472. [Google Scholar] [CrossRef]
- Ludwig, W.; Lauridsen, E.M.; Schmidt, S.; Poulsen, H.F.; Baruchel, J. High-resolution three-dimensional mapping of individual grains in polycrystals by topotomography. J. Appl. Crystallogr. 2007, 40, 905–911. [Google Scholar] [CrossRef]
- Reischig, P.; King, A.; Nervo, L.; Viganó, N.; Guilhem, Y.; Palenstijn, W.J.; Batenburg, K.J.; Preuss, M.; Ludwig, W. Advances in X-ray diffraction contrast tomography: Flexibility in the setup geometry and application to multiphase materials. J. Appl. Crystallogr. 2013, 46, 297–311. [Google Scholar] [CrossRef]
- Ludwig, W.; Schmidt, S.; Lauridsen, E.M.; Poulsen, H.F. X-ray diffraction contrast tomography: A novel technique for three-dimensional grain mapping of polycrystals. I. Direct beam case. J. Appl. Crystallogr. 2008, 41, 302–309. [Google Scholar] [CrossRef]
- Johnson, G.; King, A.; Honnicke, M.G.; Marrow, J.; Ludwig, W. X-ray diffraction contrast tomography: A novel technique for three-dimensional grain mapping of polycrystals. II. The combined case. J. Appl. Crystallogr. 2008, 41, 310–318. [Google Scholar] [CrossRef]
- Ludwig, W.; Reischig, P.; King, A.; Herbig, M.; Lauridsen, E.M.; Johnson, G.; Marrow, T.J.; Buffiere, J.Y. Three-dimensional grain mapping by X-ray diffraction contrast tomography and the use of Friedel pairs in diffraction data analysis. Rev. Sci. Instrum. 2009, 80, 033905. [Google Scholar] [CrossRef] [PubMed]
- McDonald, S.A.; Reischig, P.; Holzner, C.; Lauridsen, E.M.; Withers, P.J.; Merkle, A.P.; Feser, M. Non-destructive mapping of grain orientations in 3D by laboratory X-ray microscopy. Sci. Rep. 2015, 5, 14665. [Google Scholar] [CrossRef] [PubMed]
- Lindkvist, A.; Fang, H.; Juul Jensen, D.; Zhang, Y. Optimizing laboratory X-ray diffraction contrast tomography for grain structure characterization of pure iron. J. Appl. Crystallogr. 2021, 54, 99–110. [Google Scholar] [CrossRef]
- Jacques, S.D.M.; Egan, C.K.; Wilson, M.D.; Veale, M.C.; Seller, P.; Cernik, R.J. A laboratory system for element specific hyperspectral X-ray imaging. Analyst 2013, 138, 755–759. [Google Scholar] [CrossRef] [PubMed]
- Hitchcock, A.P. Soft X-ray spectromicroscopy and ptychography. J. Electron Spectrosc. Relat. Phenom. 2015, 200, 49–63. [Google Scholar] [CrossRef]
- Sellerer, T.; Ehn, S.; Mechlem, K.; Duda, M.; Epple, M.; Noël, P.B.; Pfeiffer, F. Quantitative dual-energy micro-CT with a photon-counting detector for material science and non-destructive testing. PLoS ONE 2019, 14, e0219659. [Google Scholar] [CrossRef]
- Boone, M.; Assche, F.V.; Vanheule, S.; Cipiccia, S.; Wang, H.; Vincze, L.; Hoorebeke, L.V. Full-field spectroscopic measurement of the X-ray beam from a multilayer monochromator using a hyperspectral X-ray camera. J. Synchrotron Radiat. 2020, 27, 110–118. [Google Scholar] [CrossRef] [PubMed]
- Boone, M.N.; Garrevoet, J.; Tack, P.; Scharf, O.; Cormode, D.P.; Van Loo, D.; Pauwels, E.; Dierick, M.; Vincze, L.; Van Hoorebeke, L. High spectral and spatial resolution X-ray transmission radiography and tomography using a Color X-ray Camera. Nucl. Instrum. Methods Phys. Res. Sect. A Accel. Spectrometers, Detect. Assoc. Equip. 2014, 735, 644–648. [Google Scholar] [CrossRef] [PubMed]
- ElMasry, G.; Sun, D.W. CHAPTER 1–Principles of Hyperspectral Imaging Technology. In Hyperspectral Imaging for Food Quality Analysis and Control; Sun, D.W., Ed.; Academic Press: San Diego, CA, USA, 2010; pp. 3–43. [Google Scholar]
- Bøtker, J.; Wu, J.X.; Rantanen, J. Hyperspectral imaging as a part of pharmaceutical product design. Data Handl. Sci. Technol. 2020, 32, 567–581. [Google Scholar]
- Van Assche, F.; Vanheule, S.; Van Hoorebeke, L.; Boone, M.N. The Spectral X-ray Imaging Data Acquisition (SpeXIDAQ) Framework. Sensors 2021, 21, 563. [Google Scholar] [CrossRef]
- Rit, S.; Oliva, M.V.; Brousmiche, S.; Labarbe, R.; Sarrut, D.; Sharp, G.C. The Reconstruction Toolkit (RTK), an open-source cone-beam CT reconstruction toolkit based on the Insight Toolkit (ITK). J. Phys. Conf. Ser. 2014, 489, 012079. [Google Scholar] [CrossRef]
- Thielemans, K.; Tsoumpas, C.; Mustafovic, S.; Beisel, T.; Aguiar, P.; Dikaios, N.; Jacobson, M.W. STIR: Software for tomographic image reconstruction release 2. Phys. Med. Biol. 2012, 57, 867–883. [Google Scholar] [CrossRef]
- Van Aarle, W.; Palenstijn, W.J.; Cant, J.; Janssens, E.; Bleichrodt, F.; Dabravolski, A.; Beenhouwer, J.D.; Batenburg, K.J.; Sijbers, J. Fast and flexible X-ray tomography using the ASTRA toolbox. Opt. Express 2016, 24, 25129–25147. [Google Scholar] [CrossRef] [PubMed]
- Gürsoy, D.; Carlo, F.D.; Xiao, X.; Jacobsen, C. TomoPy: A framework for the analysis of synchrotron tomographic data. J. Synchrotron Radiat. 2014, 21, 1188–1193. [Google Scholar] [CrossRef] [PubMed]
- Biguri, A.; Dosanjh, M.; Hancock, S.; Soleimani, M. TIGRE: A MATLAB-GPU toolbox for CBCT image reconstruction. Biomed. Phys. Eng. Express 2016, 2, 055010. [Google Scholar] [CrossRef]
- Faragó, T.; Gasilov, S.; Emslie, I.; Zuber, M.; Helfen, L.; Vogelgesang, M.; Baumbach, T. Tofu: A fast, versatile and user-friendly image processing toolkit for computed tomography. J. Synchrotron Radiat. 2022, 29, 916–927. [Google Scholar] [CrossRef] [PubMed]
- Almeida, A.; Possemiers, S.; Boone, M.; De Beer, T.; Quinten, T.; Van Hoorebeke, L.; Remon, J.; Vervaet, C. Ethylene vinyl acetate as matrix for oral sustained release dosage forms produced via hot-melt extrusion. Eur. J. Pharm. Biopharm. 2011, 77, 297–305. [Google Scholar] [CrossRef] [PubMed]
- Vlassenbroeck, J.; Dierick, M.; Masschaele, B.; Cnudde, V.; Van Hoorebeke, L.; Jacobs, P. Software tools for quantification of X-ray microtomography at the UGCT. Nucl. Instrum. Methods Phys. Res. Sect. A Accel. Spectrometers Detect. Assoc. Equip. 2007, 580, 442–445. [Google Scholar] [CrossRef]
- Wolf, I.; Vetter, M.; Wegner, I.; Nolden, M.; Bottger, T.; Hastenteufel, M.; Schobinger, M.; Kunert, T.; Meinzer, H.P. The medical imaging interaction toolkit (MITK): A toolkit facilitating the creation of interactive software by extending VTK and ITK. In Proceedings of the Medical Imaging 2004: Visualization, Image-Guided Procedures, and Display, San Diego, CA, USA, 15–17 February 2004; Volume 5367, pp. 16–27. [Google Scholar]
- Ahrens, J.; Geveci, B.; Law, C. Paraview: An end-user tool for large data visualization. Vis. Handb. 2005, 717, 50038-1. [Google Scholar]
- Ayachit, U. The Paraview Guide: A Parallel Visualization Application; Kitware, Inc.: Clifton Park, NY, USA, 2015. [Google Scholar]
- Kikinis, R.; Pieper, S.D.; Vosburgh, K.G. 3D Slicer: A platform for subject-specific image analysis, visualization, and clinical support. In Intraoperative Imaging and Image-Guided Therapy; Jolesz, F., Ed.; Springer: New York, NY, USA, 2014; pp. 277–289. [Google Scholar]
- Schindelin, J.; Arganda-Carreras, I.; Frise, E.; Kaynig, V.; Longair, M.; Pietzsch, T.; Preibisch, S.; Rueden, C.; Saalfeld, S.; Schmid, B.; et al. Fiji: An open-source platform for biological-image analysis. Nat. Methods 2012, 9, 676–682. [Google Scholar] [CrossRef]
- Liu, Y.; Kiss, A.M.; Larsson, D.H.; Yang, F.; Pianetta, P. To get the most out of high resolution X-ray tomography: A review of the post-reconstruction analysis. Spectrochim. Acta Part B At. Spectrosc. 2016, 117, 29–41. [Google Scholar] [CrossRef]
- Gostick, J.T.; Khan, Z.A.; Tranter, T.G.; Kok, M.D.; Agnaou, M.; Sadeghi, M.; Jervis, R. PoreSpy: A Python Toolkit for Quantitative Analysis of Porous Media Images. J. Open Source Softw. 2019, 4, 1296. [Google Scholar] [CrossRef]
- Sullivan, C.B.; Kaszynski, A. PyVista: 3D plotting and mesh analysis through a streamlined interface for the Visualization Toolkit (VTK). J. Open Source Softw. 2019, 4, 1450. [Google Scholar] [CrossRef]
- Kaur, D.; Kaur, Y. Various image segmentation techniques: A review. Int. J. Comput. Sci. Mob. Comput. 2014, 3, 809–814. [Google Scholar]
- Pal, N.R.; Pal, S.K. A review on image segmentation techniques. Pattern Recognit. 1993, 26, 1277–1294. [Google Scholar] [CrossRef]
- Doerr, F.J.S.; Florence, A.J. A micro-XRT image analysis and machine learning methodology for the characterisation of multi-particulate capsule formulations. Int. J. Pharm. X 2020, 2, 100041. [Google Scholar] [CrossRef]
- Zhang, S.; Stroud, P.A.; Zhu, A.; Johnson, M.J.; Lomeo, J.; Burcham, C.L.; Hinds, J.; Allen-Francis Blakely, K.; Walworth, M.J. Characterizing the Impact of Spray Dried Particle Morphology on Tablet Dissolution Using Quantitative X-ray Microscopy. Eur. J. Pharm. Sci. 2021, 165, 105921. [Google Scholar] [CrossRef]
- Nagapudi, K.; Zhu, A.; Chang, D.P.; Lomeo, J.; Rajagopal, K.; Hannoush, R.N.; Zhang, S. Microstructure, Quality, and Release Performance Characterization of Long-Acting Polymer Implant Formulations with X-ray Microscopy and Quantitative AI Analytics. J. Pharm. Sci. 2021, 110, 3418–3430. [Google Scholar] [CrossRef]
- Furat, O.; Wang, M.; Neumann, M.; Petrich, L.; Weber, M.; Krill, C.E.; Schmidt, V. Machine Learning Techniques for the Segmentation of Tomographic Image Data of Functional Materials. Front. Mater. 2019, 6, 145. [Google Scholar] [CrossRef]
- Ma, X.; Kittikunakorn, N.; Sorman, B.; Xi, H.; Chen, A.; Marsh, M.; Mongeau, A.; Piché, N.; Williams, R.O.; Skomski, D. Application of Deep Learning Convolutional Neural Networks for Internal Tablet Defect Detection: High Accuracy, Throughput, and Adaptability. J. Pharm. Sci. 2020, 109, 1547–1557. [Google Scholar] [CrossRef]
- Gosselin, R.; Lachance, E.V.; Cournoyer, A.; Clarke, F. Classifying pharmaceutical capsules through X-ray image analysis based on the agglomeration of their contents. J. Pharm. Innov. 2016, 11, 92–101. [Google Scholar] [CrossRef]
- Sinka, I.C.; Burch, S.F.; Tweed, J.H.; Cunningham, J.C. Measurement of density variations in tablets using X-ray computed tomography. J. Pharm. Innov. 2004, 271, 215–224. [Google Scholar] [CrossRef] [PubMed]
- Moazami Goudarzi, N.; Samaro, A.; Vervaet, C.; Boone, M.N. Development of Flow-Through Cell Dissolution Method for In Situ Visualization of Dissolution Processes in Solid Dosage Forms Using X-ray & μCT. Pharmaceutics 2022, 14, 2475. [Google Scholar]
- Wagner-Hattler, L.; Québatte, G.; Keiser, J.; Schoelkopf, J.; Schlepütz, C.M.; Huwyler, J.; Puchkov, M. Study of drug particle distributions within mini-tablets using synchrotron X-ray microtomography and superpixel image clustering. J. Pharm. Innov. 2020, 573, 118827. [Google Scholar] [CrossRef] [PubMed]
- Laurencin, J.; Quey, R.; Delette, G.; Suhonen, H.; Cloetens, P.; Bleuet, P. Characterisation of Solid Oxide Fuel Cell Ni–8YSZ substrate by synchrotron X-ray nano-tomography: From 3D reconstruction to microstructure quantification. J. Power Sources 2012, 198, 182–189. [Google Scholar] [CrossRef]
- Holler, M.; Guizar-Sicairos, M.; Tsai, E.H.R.; Dinapoli, R.; Müller, E.; Bunk, O.; Raabe, J.; Aeppli, G. High-resolution non-destructive three-dimensional imaging of integrated circuits. Nature 2017, 543, 402–406. [Google Scholar] [CrossRef] [PubMed]
- Yin, X.; Li, L.; Gu, X.; Wang, H.; Wu, L.; Qin, W.; Xiao, T.; York, P.; Zhang, J.; Mao, S. Dynamic structure model of polyelectrolyte complex based controlled-release matrix tablets visualized by synchrotron radiation micro-computed tomography. Mater. Sci. Eng. C 2020, 116, 111137. [Google Scholar] [CrossRef]
- Blykers, B.K.; Organista, C.; Boone, M.N.; Kagias, M.; Marone, F.; Stampanoni, M.; Bultreys, T.; Cnudde, V.; Aelterman, J. Tunable X-ray dark-field imaging for sub-resolution feature size quantification in porous media. Sci. Rep. 2021, 11, 18446. [Google Scholar] [CrossRef]
- Goyanes, A.; Wang, J.; Buanz, A.; Martínez-Pacheco, R.; Telford, R.; Gaisford, S.; Basit, A.W. 3D printing of medicines: Engineering novel oral devices with unique design and drug release characteristics. Mol. Pharm. 2015, 12, 4077–4084. [Google Scholar] [CrossRef]
- Deon, M.; Dos Santos, J.; de Andrade, D.F.; Beck, R.C.R. A critical review of traditional and advanced characterisation tools to drive formulators towards the rational development of 3D printed oral dosage forms. J. Pharm. Innov. 2022, 628, 122293. [Google Scholar] [CrossRef]
- Palmkron, S.B.; Bergenstahl, B.; Hakansson, S.; Wahlgren, M.; Fureby, A.M.; Larsson, E. Quantification of structures in freeze-dried materials using X-ray microtomography. Colloids Surfaces A Physicochem. Eng. Asp. 2023, 658, 130726. [Google Scholar] [CrossRef]
- Vanbillemont, B.; Lammens, J.; Goethals, W.; Vervaet, C.; Boone, M.; De Beer, T. 4D micro-computed X-ray tomography as a tool to determine critical process and product information of spin freeze-dried unit doses. Pharmaceutics 2020, 12, 430. [Google Scholar] [CrossRef]
- Ouazzou, A.A.; Harshe, Y.M.; Meunier, V.; Finke, J.H.; Heinrich, S. Influence of process parameters and particle size distribution on mechanical properties of tablets. Chem. Ing. Tech. 2023, 95, 168–177. [Google Scholar] [CrossRef]
- Suzzi, D.; Radl, S.; Khinast, J.G. Local analysis of the tablet coating process: Impact of operation conditions on film quality. Chem. Eng. Sci. 2010, 65, 5699–5715. [Google Scholar] [CrossRef]
- Gendre, C.; Genty, M.; Fayard, B.; Tfayli, A.; Boiret, M.; Lecoq, O.; Baron, M.; Chaminade, P.; Péan, J.M. Comparative static curing versus dynamic curing on tablet coating structures. J. Pharm. Innov. 2013, 453, 448–453. [Google Scholar] [CrossRef]
- Busignies, V.; Leclerc, B.; Porion, P.; Evesque, P.; Couarraze, G.; Tchoreloff, P. Investigation and modelling approach of the mechanical properties of compacts made with binary mixtures of pharmaceutical excipients. Eur. J. Pharm. Biopharm. 2006, 64, 51–65. [Google Scholar] [CrossRef]
- Busignies, V.; Leclerc, B.; Porion, P.; Evesque, P.; Couarraze, G.; Tchoreloff, P. Application of percolation model to the tensile strength and the reduced modulus of elasticity of three compacted pharmaceutical excipients. Eur. J. Pharm. Biopharm. 2007, 67, 507–514. [Google Scholar] [CrossRef] [PubMed]
- Han, L.H.; Laity, P.R.; Cameron, R.E.; Elliott, J.A. Density and plastic strain evaluations using small-angle X-ray scattering and finite element simulations for powder compacts of complex shape. J. Mater. Sci. 2011, 46, 5977–5990. [Google Scholar] [CrossRef]
- Krok, A.; Peciar, M.; Fekete, R. Numerical investigation into the influence of the punch shape on the mechanical behavior of pharmaceutical powders during compaction. Particuology 2014, 16, 116–131. [Google Scholar] [CrossRef]
- Yohannes, B.; Abebe, A. Determination of tensile strength of shaped tablets. Powder Technol. 2021, 383, 11–18. [Google Scholar] [CrossRef]
- Sinka, I.C.; Cunningham, J.C.; Zavaliangos, A. The effect of wall friction in the compaction of pharmaceutical tablets with curved faces: A validation study of the Drucker–Prager Cap model. Powder Technol. 2003, 133, 33–43. [Google Scholar] [CrossRef]
- Costa, N.F.; Paulo, M.G.; Diogo, H.P.; Pinto, J.F. Solving a sticking related tablet problem by multivariate statistics and computational tomographic analysis. Powder Technol. 2020, 367, 456–463. [Google Scholar] [CrossRef]
- Krok, A.; Wu, C.Y. Evolutions of temperature and density during roll compaction of a pharmaceutical excipient. J. Pharm. Innov. 2019, 572, 118822. [Google Scholar] [CrossRef] [PubMed]
- Wu, C.Y.; Hancock, B.; Mills, A.; Bentham, A.; Best, S.; Elliott, J. Numerical and experimental investigation of capping mechanisms during pharmaceutical tablet compaction. Powder Technol. 2008, 181, 121–129. [Google Scholar] [CrossRef]
- Thakral, N.K.; Thakral, S.; Stephenson, G.A.; Sedlock, R.; Suryanarayanan, R. Compression-Induced Polymorphic Transformation in Tablets: Role of Shear Stress and Development of Mitigation Strategies. J. Pharm. Sci. 2019, 108, 476–484. [Google Scholar] [CrossRef]
- Rajkumar, A.D.; Reynolds, G.K.; Wilson, D.; Wren, S.A.; Salman, A.D. The effect of roller compaction and tableting stresses on pharmaceutical tablet performance. Powder Technol. 2019, 341, 23–37. [Google Scholar] [CrossRef]
- Xu, X.; Coskunturk, Y.; Dave, V.S.; Kuriyilel, J.V.; Wright, M.F.; Dave, R.H.; Cetinkaya, C. Effects of compaction pressure, speed and punch head profile on the ultrasonically-extracted physical properties of pharmaceutical compacts. J. Pharm. Innov. 2020, 575, 118993. [Google Scholar] [CrossRef]
- Busignies, V.; Leclerc, B.; Porion, P.; Evesque, P.; Couarraze, G.; Tchoreloff, P. Quantitative measurements of localized density variations in cylindrical tablets using X-ray microtomography. Eur. J. Pharm. Biopharm. 2006, 64, 38–50. [Google Scholar] [CrossRef]
- Hancock, B.C.; Dalton, C.R.; Clas, S.D. Micro-scale measurement of the mechanical properties of compressed pharmaceutical powders. 2: The dynamic moduli of microcrystalline cellulose. J. Pharm. Innov. 2001, 228, 139–145. [Google Scholar] [CrossRef]
- Rees, J.E.; Hersey, J.A.; Cole, E.T. The effect of rate of loading on the strength of tablets. J. Pharm. Pharmacol. 1970, 22, 64S–69S. [Google Scholar] [CrossRef]
- Shang, C.; Sinka, I.; Jayaraman, B.; Pan, J. Break force and tensile strength relationships for curved faced tablets subject to diametrical compression. J. Pharm. Innov. 2013, 442, 57–64. [Google Scholar] [CrossRef] [PubMed]
- Hiestand, H.E.N.; Smith, D.P. Indices of tableting performance. Powder Technol. 1984, 38, 145–159. [Google Scholar] [CrossRef]
- Cabiscol, R.; Finke, J.H.; Zetzener, H.; Kwade, A. Characterization of Mechanical Property Distributions on Tablet Surfaces. Pharmaceutics 2018, 10, 184. [Google Scholar] [CrossRef]
- Al-Sabbagh, M.; Polak, P.; Roberts, R.; Reynolds, G.; Sinka, I. Methodology to estimate the break force of pharmaceutical tablets with curved faces under diametrical compression. J. Pharm. Innov. 2019, 554, 399–419. [Google Scholar] [CrossRef] [PubMed]
- Akseli, I.; Hancock, B.; Cetinkaya, C. Non-destructive determination of anisotropic mechanical properties of pharmaceutical solid dosage forms. J. Pharm. Innov. 2009, 377, 35–44. [Google Scholar] [CrossRef]
- Dave, V.S.; Shahin, H.I.; Youngren-Ortiz, S.R.; Chougule, M.B.; Haware, R.V. Emerging technologies for the non-invasive characterization of physical-mechanical properties of tablets. J. Pharm. Innov. 2017, 532, 299–312. [Google Scholar] [CrossRef]
- Burch, S. Measurement of density variations in compacted parts using X-ray computerised tomography. Met. Powder Rep. 2002, 57, 24–28. [Google Scholar] [CrossRef]
- Farber, L.; Tardos, G.; Michaels, J.N. Use of X-ray tomography to study the porosity and morphology of granules. Powder Technol. 2003, 132, 57–63. [Google Scholar] [CrossRef]
- Yost, E.; Chalus, P.; Zhang, S.; Peter, S.; Narang, A.S. Quantitative X-ray Microcomputed Tomography Assessment of Internal Tablet Defects. J. Pharm. Sci. 2019, 108, 1818–1830. [Google Scholar] [CrossRef]
- Farber, L. Chapter 2-Microstructure and Mechanical Properties of Granules Formed in High Shear Wet Granulation. In Handbook of Pharmaceutical Wet Granulation; Narang, A.S., Badawy, S.I., Eds.; Academic Press: Cambridge, MA, USA, 2019; pp. 37–88. [Google Scholar]
- Hattori, Y.; Aoki, R.; Otsuka, M. Use of partial least-squares analysis and fractionated X-ray computed tomography images in the investigation of density distribution of round tablets. Powder Technol. 2016, 302, 261–264. [Google Scholar] [CrossRef]
- Otsuka, K.; Uchino, T.; Otsuka, M. Non-destructive prediction of the drug content of an acetaminophen suppository by near-infrared spectroscopy and X-ray computed tomography. Drug Dev. Ind. Pharm. 2015, 41, 15–21. [Google Scholar] [CrossRef] [PubMed]
- Nguyen, T.T.; Park, H.R.; Cho, C.H.; Hwang, K.M.; Park, E.S. Investigation of critical factors affecting mechanical characteristics of press-coated tablets using a compaction simulator. J. Pharm. Innov. 2020, 582, 119308. [Google Scholar] [CrossRef] [PubMed]
- Michaut, F.; Busignies, V.; Fouquereau, C.; Huet de Barochez, B.; Leclerc, B.; Tchoreloff, P. Evaluation of a Rotary Tablet Press Simulator as a Tool for the Characterization of Compaction Properties of Pharmaceutical Products. J. Pharm. Sci. 2010, 99, 2874–2885. [Google Scholar] [CrossRef]
- Stappen, J.F.V.; Kock, T.D.; Schutter, G.D.; Cnudde, V. Uniaxial compressive strength measurements of limestone plugs and cores: A size comparison and X-ray CT study. Bull. Eng. Geol. Environ. 2019, 78, 5301–5310. [Google Scholar] [CrossRef]
- Cuesta Cano, A.; Van Stappen, J.F.; Wolterbeek, T.K.T.; Hangx, S.J.T. Uniaxial compaction of sand using 4D X-ray tomography: The effect of mineralogy on grain-scale compaction mechanisms. Mater. Today Commun. 2021, 26, 101881. [Google Scholar] [CrossRef]
- Daelemans, L.; Tomme, B.; Caglar, B.; Michaud, V.; Van Stappen, J.; Cnudde, V.; Boone, M.; Van Paepegem, W. Kinematic and mechanical response of dry woven fabrics in through-thickness compression: Virtual fiber modeling with mesh overlay technique and experimental validation. Compos. Sci. Technol. 2021, 207, 108706. [Google Scholar] [CrossRef]
- Wanzhao, L.; Chaoyi, C.; Jiangtao, S.; Changtong, M.; Pierre, K.; Van Acker, J.; Van den Bulcke, J. Understanding the mechanical performance of OSB in compression tests. Constr. Build. Mater. 2020, 260, 119837. [Google Scholar]
- Akseli, I.; Iyer, S.; Lee, H.P.; Cuitiño, A.M. A quantitative correlation of the effect of density distributions in roller-compacted ribbons on the mechanical properties of tablets using ultrasonics and X-ray tomography. AAPS Pharmscitech 2011, 12, 834–853. [Google Scholar] [CrossRef]
- Macleod, H.M.; Marshall, U. The determination of density distribution in ceramic compacts using autoradiography. Powder Technol. 1977, 16, 107–122. [Google Scholar] [CrossRef]
- Turner, T.D.; Gajjar, P.; Fragkopoulos, I.S.; Carr, J.; Nguyen, T.T.H.; Hooper, D.; Clarke, F.; Dawson, N.; Withers, P.J.; Roberts, K.J. Measuring the Particle Packing of l-Glutamic Acid Crystals through X-ray Computed Tomography for Understanding Powder Flow and Consolidation Behavior. Cryst. Growth Des. 2020, 20, 4252–4263. [Google Scholar] [CrossRef]
- Klinzing, G.R.; Zavaliangos, A.; Cunningham, J.; Mascaro, T.; Winstead, D. Temperature and density evolution during compaction of a capsule shaped tablet. Comput. Chem. Eng. 2010, 34, 1082–1091. [Google Scholar] [CrossRef]
- Miguélez-Morán, A.M.; Wu, C.Y.; Dong, H.; Seville, J.P.K. Characterisation of density distributions in roller-compacted ribbons using micro-indentation and X-ray micro-computed tomography. Eur. J. Pharm. Biopharm. 2009, 72, 173–182. [Google Scholar] [CrossRef] [PubMed]
- Nordström, J.; Alderborn, G. The Granule Porosity Controls the Loss of Compactibility for Both Dry- and Wet-Processed Cellulose Granules but at Different Rate. J. Pharm. Sci. 2015, 104, 2029–2039. [Google Scholar] [CrossRef] [PubMed]
- Nordström, J.; Persson, A.S.; Lazorova, L.; Frenning, G.; Alderborn, G. The degree of compression of spherical granular solids controls the evolution of microstructure and bond probability during compaction. J. Pharm. Innov. 2013, 442, 3–12. [Google Scholar] [CrossRef]
- Croquelois, B.; Girardot, J.; Kopp, J.; Tchoreloff, P.; Mazel, V. Quantification of tablet sensitivity to a stress concentration: Generalization of Hiestand’s approach and link with the microstructure. Powder Technol. 2020, 369, 176–183. [Google Scholar] [CrossRef]
- Gong, X.; Chang, S.Y.; Yeboah, F.O.; Paul, S.; Perumalla, S.R.; Shi, L.; Sun, W.J.; Zhou, Q.; Sun, C.C. Dependence of tablet brittleness on tensile strength and porosity. J. Pharm. Innov. 2015, 493, 208–213. [Google Scholar] [CrossRef]
- Sun, C.C. Microstructure of tablet—Pharmaceutical significance, assessment, and engineering. Pharm. Res. 2017, 34, 918–928. [Google Scholar] [CrossRef]
- Markl, D.; Strobel, A.; Schlossnikl, R.; Bøtker, J.; Bawuah, P.; Ridgway, C.; Rantanen, J.; Rades, T.; Gane, P.; Peiponen, K.E.; et al. Characterisation of pore structures of pharmaceutical tablets: A review. J. Pharm. Innov. 2018, 538, 188–214. [Google Scholar] [CrossRef]
- Yin, X.; Maharjan, A.; Fang, L.; Wu, L.; Zhang, L.; Shakya, S.; Qin, W.; Regmi, B.; York, P.; Sun, H.; et al. Cavities spatial distribution confined by microcrystalline cellulose particles determines tablet disintegration patterns. Powder Technol. 2018, 339, 717–727. [Google Scholar] [CrossRef]
- Riippi, M.; Yliruusi, J.; Niskanen, T.; Kiesvaara, J. Dependence between dissolution rate and porosity of compressed erythromycin acistrate tablets. Eur. J. Pharm. Biopharm. 1998, 46, 169–175. [Google Scholar] [CrossRef]
- Van Der Graaff, H.; De Boer, B.; De Blaey, C. The role of pores in dissolution processes. J. Pharm. Innov. 1979, 3, 293–297. [Google Scholar] [CrossRef]
- Markl, D.; Wahl, P.; Pichler, H.; Sacher, S.; Khinast, J.G. Characterization of the coating and tablet core roughness by means of 3D optical coherence tomography. J. Pharm. Innov. 2018, 536, 459–466. [Google Scholar] [CrossRef] [PubMed]
- Shanmugam, S. Granulation techniques and technologies: Recent progresses. Bioimpacts 2015, 5, 55–63. [Google Scholar] [CrossRef] [PubMed]
- Parikh, D.M. Handbook of Pharmaceutical Granulation Technology; CRC Press: Boca Raton, FL, USA, 2016. [Google Scholar]
- Poutiainen, S.; Honkanen, M.; Becker, J.; Nachtweide, D.; Järvinen, K.; Ketolainen, J. X-ray Microtomography Analysis of Intragranular Drug Migration During Fluidized Bed and Oven Tray Drying. J. Pharm. Sci. 2012, 101, 1587–1598. [Google Scholar] [CrossRef] [PubMed]
- Oka, S.; Smrčka, D.; Kataria, A.; Emady, H.; Muzzio, F.; Štěpánek, F.; Ramachandran, R. Analysis of the origins of content non-uniformity in high-shear wet granulation. J. Pharm. Innov. 2017, 528, 578–585. [Google Scholar] [CrossRef] [PubMed]
- Franch-Lage, F.; Amigo, J.M.; Skibsted, E.; Maspoch, S.; Coello, J. Fast assessment of the surface distribution of API and excipients in tablets using NIR-hyperspectral imaging. J. Pharm. Innov. 2011, 411, 27–35. [Google Scholar] [CrossRef]
- Oka, S.; Emady, H.; Kašpar, O.; Tokárová, V.; Muzzio, F.; Štěpánek, F.; Ramachandran, R. The effects of improper mixing and preferential wetting of active and excipient ingredients on content uniformity in high shear wet granulation. Powder Technol. 2015, 278, 266–277. [Google Scholar] [CrossRef]
- Kašpar, O.; Tokárová, V.; Oka, S.; Sowrirajan, K.; Ramachandran, R.; Štěpánek, F. Combined UV/vis and micro-tomography investigation of acetaminophen dissolution from granules. J. Pharm. Innov. 2013, 458, 272–281. [Google Scholar] [CrossRef]
- Windbergs, M.; Haaser, M.; McGoverin, C.M.; Gordon, K.C.; Kleinebudde, P.; Strachan, C.J. Investigating the relationship between drug distribution in solid lipid matrices and dissolution behaviour using Raman spectroscopy and mapping. J. Pharm. Sci. 2010, 99, 1464–1475. [Google Scholar] [CrossRef]
- Senderak, E.T. Content uniformity acceptance limit for a validation batch—Suppositories, transdermal systems, and inhalations. Drug Dev. Ind. Pharm. 2009, 35, 735–737. [Google Scholar] [CrossRef]
- Berman, J.; Planchard, J.A. Blend Uniformity and Unit Dose Sampling. Drug Dev. Ind. Pharm. 1995, 21, 1257–1283. [Google Scholar] [CrossRef]
- Forghani, R. Advanced Computed Tomography Techniques: Overview of Dual-Energy CT. J. Pediatr. Neurol. 2017, 16, 061–071. [Google Scholar] [CrossRef]
- Ashton, J.R.; Clark, D.P.; Moding, E.J.; Ghaghada, K.; Kirsch, D.G.; West, J.L.; Badea, C.T. Dual-Energy Micro-CT Functional Imaging of Primary Lung Cancer in Mice Using Gold and Iodine Nanoparticle Contrast Agents: A Validation Study. PLoS ONE 2014, 9, e88129. [Google Scholar] [CrossRef] [PubMed]
- Stampanoni, M.; Groso, A.; Isenegger, A.; Mikuljan, G.; Chen, Q.; Meister, D.; Lange, M.; Betemps, R.; Henein, S.; Abela, R. TOMCAT: A beamline for Tomographic Microscopy and Coherent Radiology experiments. AIP Conf. Proc. 2007, 879, 848–851. [Google Scholar]
- King, A.; Guignot, N.; Zerbino, P.; Boulard, E.; Desjardins, K.; Bordessoule, M.; Leclerq, N.; Le, S.; Renaud, G.; Cerato, M.; et al. Tomography and imaging at the PSICHE beam line of the SOLEIL synchrotron. Rev. Sci. Instrum. 2016, 87, 093704. [Google Scholar] [CrossRef]
- Weitkamp, T.; Tafforeau, P.; Boller, E.; Cloetens, P.; Valade, J.P.; Bernard, P.; Peyrin, F.; Ludwig, W.; Helfen, L.; Baruchel, J. Status and evolution of the ESRF beamline ID19. AIP Conf. Proc. 2010, 1221, 33–38. [Google Scholar]
- Rack, A.; Weitkamp, T.; Bauer Trabelsi, S.; Modregger, P.; Cecilia, A.; dos Santos Rolo, T.; Rack, T.; Haas, D.; Simon, R.; Heldele, R.; et al. The micro-imaging station of the TopoTomo beamline at the ANKA synchrotron light source. Nucl. Instrum. Methods Phys. Res. Sect. B Beam Interact. Mater. Atoms 2009, 267, 1978–1988. [Google Scholar] [CrossRef]
- Drakopoulos, M.; Connolley, T.; Reinhard, C.; Atwood, R.; Magdysyuk, O.; Vo, N.; Hart, M.; Connor, L.; Humphreys, B.; Howell, G.; et al. I12: The Joint Engineering, Environment and Processing (JEEP) beamline at Diamond Light Source. J. Synchrotron Radiat. 2015, 22, 828–838. [Google Scholar] [CrossRef]
- Klaus, M.; García-Moreno, F. The 7T-MPW-EDDI beamline at BESSY II. J.-Large-Scale Res. Facil. JLSRF 2016, 2, A40. [Google Scholar] [CrossRef]
- Holler, M.; Diaz, A.; Guizar-Sicairos, M.; Karvinen, P.; Färm, E.; Härköönen, E.; Ritala, M.; Menzel, A.; Raabe, J.; Bunk, O. X-ray ptychographic computed tomography at 16 nm isotropic 3D resolution. Sci. Rep. 2014, 4, 3857. [Google Scholar] [CrossRef]
- Kamp, T.V.D.; Ershov, A.; Rolo, T.S.; Riedel, A.; Baumbach, T. Insect Imaging at the ANKA Synchrotron Radiation Facility. Entomol. Heute 2013, 25, 147–160. [Google Scholar]
- Uesugi, K.; Suzuki, Y.; Yagi, N.; Tsuchiyama, A.; Nakano, T. Development of high spatial resolution X-ray CT system at BL47XU in SPring-8. Nucl. Instrum. Methods Phys. Res. Sect. A Accel. Spectrometers Detect. Assoc. Equip. 2001, 467–468, 853–856. [Google Scholar] [CrossRef]
- Uesugi, K.; Yasuda, H.; Pierscionek, B.; Toyoda, K.; Hoshino, M.; Yagi, N. Large-Field X-ray Imaging at SPring-8 BL20B2. Synchrotron Radiat. News 2015, 28, 30–35. [Google Scholar] [CrossRef]
- Liu, Y.; Andrews, J.C.; Meirer, F.; Mehta, A.; Gil, S.C.; Sciau, P.; Mester, Z.; Pianetta, P. Applications of Hard X-ray Full-Field Transmission X-ray Microscopy at SSRL. AIP Conf. Proc. 2011, 1365, 357–360. [Google Scholar]
- Lee, W.K.; Reininger, R.; Loo, W.; Gambella, R.; O’Hara, S.; Chu, Y.S.; Zhong, Z.; Wang, J. FXI: A full-field imaging beamline at NSLS-II. Proc. SPIE 2015, 9592, 6–12. [Google Scholar]
- Wilde, F.; Ogurreck, M.; Greving, I.; Hammel, J.U.; Beckmann, F.; Hipp, A.; Lottermoser, L.; Khokhriakov, I.; Lytaev, P.; Dose, T.; et al. Micro-CT at the imaging beamline P05 at PETRA III. AIP Conf. Proc. 2016, 1741, 030035. [Google Scholar]
- Noguchi, S.; Kajihara, R.; Iwao, Y.; Fujinami, Y.; Suzuki, Y.; Terada, Y.; Uesugi, K.; Miura, K.; Itai, S. Investigation of internal structure of fine granules by microtomography using synchrotron X-ray radiation. J. Pharm. Innov. 2013, 445, 93–98. [Google Scholar] [CrossRef]
- Swaraj, S.; Belkhou, R.; Stanescu, S.; Rioult, M.; Besson, A.; Hitchcock, A.P. Performance of the HERMES beamline at the carbon K-edge. J. Phys. Conf. Ser. 2017, 849, 012046. [Google Scholar] [CrossRef]
- Mille, N.; Yuan, H.; Vijayakumar, J.; Stanescu, S.; Swaraj, S.; Desjardins, K.; Favre-Nicolin, V.; Belkhou, R.; Hitchcock, A.P. Ptychography at the carbon K-edge. Commun. Mater. 2022, 3, 1–8. [Google Scholar] [CrossRef]
- Rosas, J.G.; Blanco, M. A criterion for assessing homogeneity distribution in hyperspectral images. Part 1: Homogeneity index bases and blending processes. J. Pharm. Biomed. Anal. 2012, 70, 680–690. [Google Scholar] [CrossRef]
- Rosas, J.G.; Blanco, M. A criterion for assessing homogeneity distribution in hyperspectral images. Part 2: Application of homogeneity indices to solid pharmaceutical dosage forms. J. Pharm. Biomed. Anal. 2012, 70, 691–699. [Google Scholar] [CrossRef] [PubMed]
- Rosas, J.; Armenta, S.; Cruz, J.; Blanco, M. A new approach to determine the homogeneity in hyperspectral imaging considering the particle size. Anal. Chim. Acta 2013, 787, 173–180. [Google Scholar] [CrossRef] [PubMed]
- Sacré, P.Y.; Lebrun, P.; Chavez, P.F.; Bleye, C.D.; Netchacovitch, L.; Rozet, E.; Klinkenberg, R.; Streel, B.; Hubert, P.; Ziemons, E. A new criterion to assess distributional homogeneity in hyperspectral images of solid pharmaceutical dosage forms. Anal. Chim. Acta 2014, 818, 7–14. [Google Scholar] [CrossRef]
- Hamad, M.L.; Ellison, C.D.; Khan, M.A.; Lyon, R.C. Drug product characterization by Macropixel Analysis of chemical images. J. Pharm. Sci. 2007, 96, 3390–3401. [Google Scholar] [CrossRef] [PubMed]
- Lacey, P.M.C. Developments in the theory of particle mixing. J. Appl. Chem. 1954, 4, 257–268. [Google Scholar] [CrossRef]
- Fan, L.T.; Chen, S.J.; Watson, C.A. Annual review solids mixing. Ind. Eng. Chem. 1970, 62, 53–69. [Google Scholar] [CrossRef]
- Schomberg, A.K.; Diener, A.; Wünsch, I.; Finke, J.H.; Kwade, A. The use of X-ray microtomography to investigate the microstructure of pharmaceutical tablets: Potentials and comparison to common physical methods. Int. J. Pharm. X 2021, 3, 100090. [Google Scholar] [CrossRef]
- Dale, S.; Wassgren, C.; Litster, J. Measuring granule phase volume distributions using X-ray microtomography. Powder Technol. 2014, 264, 550–560. [Google Scholar] [CrossRef]
- Liu, R.; Yin, X.; Li, H.; Shao, Q.; York, P.; He, Y.; Xiao, T.; Zhang, J. Visualization and quantitative profiling of mixing and segregation of granules using synchrotron radiation X-ray microtomography and three dimensional reconstruction. J. Pharm. Innov. 2013, 445, 125–133. [Google Scholar] [CrossRef]
- Csobán, Z.; Kállai-Szabó, B.; Kállai-Szabó, N.; Takács, T.; Hurtony, T.; Gordon, P.; Zelkó, R.; Antal, I. Assessment of distribution of pellets in tablets by non-destructive microfocus X-ray imaging and image analysis technique. Powder Technol. 2016, 301, 228–233. [Google Scholar] [CrossRef]
- Zhang, L.; Wu, L.; Wang, C.; Zhang, G.; Yu, L.; Li, H.; Maharjan, A.; Tang, Y.; He, D.; York, P.; et al. Synchrotron Radiation Microcomputed Tomography Guided Chromatographic Analysis for Displaying the Material Distribution in Tablets. Anal. Chem. 2018, 90, 3238–3244. [Google Scholar] [CrossRef] [PubMed]
- Legland, D.; Arganda-Carreras, I.; Andrey, P. MorphoLibJ: Integrated library and plugins for mathematical morphology with ImageJ. Bioinformatics 2016, 32, 3532–3534. [Google Scholar] [CrossRef] [PubMed]
- Blott, S.J.; Pye, K. Particle shape: A review and new methods of characterization and classification. Sedimentology 2008, 55, 31–63. [Google Scholar] [CrossRef]
- Wadell, H. Volume, shape, and roundness of quartz particles. J. Geol. 1935, 43, 250–280. [Google Scholar] [CrossRef]
- Claes, S.; Soete, J.; Cnudde, V.; Swennen, R. A three-dimensional classification for mathematical pore shape description in complex carbonate reservoir rocks. Math. Geosci. 2016, 48, 619–639. [Google Scholar] [CrossRef]
- Moreno-Atanasio, R.; Williams, R.A.; Jia, X. Combining X-ray microtomography with computer simulation for analysis of granular and porous materials. Particuology 2010, 8, 81–99. [Google Scholar] [CrossRef]
- Markl, D.; Yassin, S.; Wilson, D.I.; Goodwin, D.J.; Anderson, A.; Axel Zeitler, J. Mathematical modelling of liquid transport in swelling pharmaceutical immediate release tablets. J. Pharm. Innov. 2017, 526, 1–10. [Google Scholar] [CrossRef]
- Zhang, L.; Shakya, S.; Wu, L.; Wang, J.; Jin, G.; Sun, H.; Yin, X.; Sun, L.; Zhang, J. Multi-dimensional visualization for the morphology of lubricant stearic acid particles and their distribution in tablets. Asian J. Pharm. Sci. 2020, 15, 60–68. [Google Scholar] [CrossRef]
- Fang, L.; Yin, X.; Wu, L.; He, Y.; He, Y.; Qin, W.; Meng, F.; York, P.; Xu, X.; Zhang, J. Classification of microcrystalline celluloses via structures of individual particles measured by synchrotron radiation X-ray micro-computed tomography. J. Pharm. Innov. 2017, 531, 658–667. [Google Scholar] [CrossRef]
- Wu, L.; Qin, W.; He, Y.; Zhu, W.; Ren, X.; York, P.; Xiao, T.; Yin, X.; Zhang, J. Material distributions and functional structures in probiotic microcapsules. Eur. J. Pharm. Sci. 2018, 122, 1–8. [Google Scholar] [CrossRef]
- Yin, X.Z.; Xiao, T.Q.; Nangia, A.; Yang, S.; Lu, X.L.; Li, H.Y.; Shao, Q.; He, Y.; York, P.; Zhang, J.W. In situ 3D topographic and shape analysis by synchrotron radiation X-ray microtomography for crystal form identification in polymorphic mixtures. Sci. Rep. 2016, 6, 24763. [Google Scholar] [CrossRef] [PubMed]
- Sun, X.; Wu, L.; Maharjan, A.; Sun, H.; Hu, X.; York, P.; Sun, H.; Zhang, J.; Yin, X. Static and dynamic structural features of single pellets determine the release behaviors of metoprolol succinate sustained-release tablets. Eur. J. Pharm. Sci. 2020, 149, 105324. [Google Scholar] [CrossRef] [PubMed]
- Gajjar, P.; Styliari, I.; Nguyen, T.; Carr, J.; Chen, X.; Elliott, J.; Hammond, R.; Burnett, T.; Roberts, K.; Withers, P.; et al. 3D characterisation of dry powder inhaler formulations: Developing X-ray micro computed tomography approaches. Eur. J. Pharm. Biopharm. 2020, 151, 32–44. [Google Scholar] [CrossRef] [PubMed]
- Zhu, C.; Peng, T.; Huang, D.; Feng, D.; Wang, X.; Pan, X.; Tan, W.; Wu, C. Formation Mechanism, In vitro and In vivo Evaluation of Dimpled Exenatide Loaded PLGA Microparticles Prepared by Ultra-Fine Particle Processing System. AAPS PharmSciTech 2019, 20, 64. [Google Scholar] [CrossRef]
- Wang, Y.; Wertheim, D.F.; Jones, A.S.; Coombes, A.G.A. Micro-CT in drug delivery. Eur. J. Pharm. Biopharm. 2010, 74, 41–49. [Google Scholar] [CrossRef]
- Wang, Y.; Wertheim, D.F.; Jones, A.S.; Chang, H.I.; Coombes, A.G. PHARMACEUTICAL TECHNOLOGY: Micro-CT Analysis of Matrix-Type Drug Delivery Devices and Correlation With Protein Release Behaviour. J. Pharm. Sci. 2010, 99, 2854–2862. [Google Scholar] [CrossRef]
- Zhu, A.; Mao, C.; Luner, P.E.; Lomeo, J.; So, C.; Marchal, S.; Zhang, S. Investigation of Quantitative X-ray Microscopy for Assessment of API and Excipient Microstructure Evolution in Solid Dosage Processing. AAPS PharmSciTech 2022, 23, 117. [Google Scholar] [CrossRef]
- Morris, K.R.; Griesser, U.J.; Eckhardt, C.J.; Stowell, J.G. Theoretical approaches to physical transformations of active pharmaceutical ingredients during manufacturing processes. Adv. Drug Deliv. Rev. 2001, 48, 91–114. [Google Scholar] [CrossRef]
- Morris, K.R.; Nail, S.L.; Peck, G.E.; Byrn, S.R.; Griesser, U.J.; Stowell, J.G.; Hwang, S.J.; Park, K. Advances in pharmaceutical materials and processing. Pharm. Sci. Technol. Today 1998, 1, 235–245. [Google Scholar] [CrossRef]
- Thakral, N.K.; Mohapatra, S.; Stephenson, G.A.; Suryanarayanan, R. Compression-Induced Crystallization of Amorphous Indomethacin in Tablets: Characterization of Spatial Heterogeneity by Two-Dimensional X-ray Diffractometry. Mol. Pharm. 2015, 12, 253–263. [Google Scholar] [CrossRef]
- Joshi, A.B.; Patel, S.; Kaushal, A.M.; Bansal, A.K. Compaction studies of alternate solid forms of celecoxib. Adv. Powder Technol. 2010, 21, 452–460. [Google Scholar] [CrossRef]
- Wu, C.T.; Luo, H.L. Pressure effect on vapor-deposited amorphous materials. J.-Non-Cryst. Solids 1975, 18, 21–28. [Google Scholar] [CrossRef]
- Amano, Y.; Misawa, T.; Miyazaki, T.; Ando, D.; Koide, T.; Izutsu, K.; Kanazawa, H.; Hanaoka, K.; Yamamoto, E. Real-time in situ X-ray micro-computed tomography study of the effect of impurities on the crystallization of amorphous nifedipine. J. Pharm. Biomed. Anal. 2023, 226, 115248. [Google Scholar] [CrossRef] [PubMed]
- Mirza, S.; Miroshnyk, I.; Heinämäki, J.; Antikainen, O.; Rantanen, J.; Vuorela, P.; Vuorela, H.; Yliruusi, J. Crystal morphology engineering of pharmaceutical solids: Tabletting performance enhancement. AAPS PharmSciTech 2009, 10, 113–119. [Google Scholar] [CrossRef]
- Koranne, S.; Govindarajan, R.; Suryanarayanan, R. Investigation of Spatial Heterogeneity of Salt Disproportionation in Tablets by Synchrotron X-ray Diffractometry. Mol. Pharm. 2017, 14, 1133–1144. [Google Scholar] [CrossRef]
- Koradia, V.; Tenho, M.; Diego, H.L.D.; Ringkjøbing-Elema, M.; Møller-Sonnergaard, J.; Salonen, J.; Lehto, V.P.; Rantanen, J. Investigation of solid phase composition on tablet surfaces by grazing incidence X-ray diffraction. Pharm. Res. 2012, 29, 134–144. [Google Scholar] [CrossRef]
- Shinzawa, H.; Awa, K.; Noda, I.; Ozaki, Y. Pressure-induced variation of cellulose tablet studied by two-dimensional (2D) near-infrared (NIR) correlation spectroscopy in conjunction with projection pretreatment. Vib. Spectrosc. 2013, 65, 28–35. [Google Scholar] [CrossRef]
- Inoue, M.; Hisada, H.; Koide, T.; Fukami, T.; Roy, A.; Carriere, J.; Heyler, R. Transmission Low-Frequency Raman Spectroscopy for Quantification of Crystalline Polymorphs in Pharmaceutical Tablets. Anal. Chem. 2019, 91, 1997–2003. [Google Scholar] [CrossRef]
- Ek, R.; Wormald, P.; Östelius, J.; Iversen, T.; Nyström, C. Crystallinity index of microcrystalline cellulose particles compressed into tablets. J. Pharm. Innov. 1995, 125, 257–264. [Google Scholar] [CrossRef]
- Brittain, H.G. 2-Characterization of Pharmaceutical Compounds in the Solid State; Separation Science and Technology; Academic Press: New York, NY, USA, 2011; Volume 10, pp. 11–58. [Google Scholar]
- Rimjhim, A.; Kamal, R.; Meenakshi, B. An Overview on Tablet Coating. Asian J. Pharm. Res. Dev. 2019, 7, 89–92. [Google Scholar]
- Spencer, J.A.; Gao, Z.; Moore, T.; Buhse, L.F.; Taday, P.F.; Newnham, D.A.; Shen, Y.; Portieri, A.; Husain, A. Delayed Release Tablet Dissolution Related to Coating Thickness by Terahertz Pulsed Image Mapping. J. Pharm. Sci. 2008, 97, 1543–1550. [Google Scholar] [CrossRef] [PubMed]
- Mitragotri, S.; Burke, P.A.; Langer, R. Overcoming the challenges in administering biopharmaceuticals: Formulation and delivery strategies. Nat. Rev. Drug Discov. 2014, 13, 655–672. [Google Scholar] [CrossRef] [PubMed]
- Just, S.; Toschkoff, G.; Funke, A.; Djuric, D.; Scharrer, G.; Khinast, J.; Knop, K.; Kleinebudde, P. Optimization of the inter-tablet coating uniformity for an active coating process at lab and pilot scale. J. Pharm. Innov. 2013, 457, 1–8. [Google Scholar] [CrossRef] [PubMed]
- Kajihara, R.; Noguchi, S.; Iwao, Y.; Suzuki, Y.; Terada, Y.; Uesugi, K.; Itai, S. Structural changes of polymer-coated microgranules and excipients on tableting investigated by microtomography using synchrotron X-ray radiation. J. Pharm. Innov. 2015, 481, 132–139. [Google Scholar] [CrossRef] [PubMed]
- Just, S.; Toschkoff, G.; Funke, A.; Djuric, D.; Scharrer, G.; Khinast, J.; Knop, K.; Kleinebudde, P. Experimental analysis of tablet properties for discrete element modeling of an active coating process. AAPS PharmSciTech 2013, 14, 402–411. [Google Scholar] [CrossRef]
- Seo, K.S.; Bajracharya, R.; Lee, S.H.; Han, H.K. Pharmaceutical Application of Tablet Film Coating. Pharmaceutics 2020, 12, 853. [Google Scholar] [CrossRef] [PubMed]
- Puri, V.; Brancazio, D.; Harinath, E.; Martinez, A.R.; Desai, P.M.; Jensen, K.D.; Chun, J.H.; Braatz, R.D.; Myerson, A.S.; Trout, B.L. Demonstration of pharmaceutical tablet coating process by injection molding technology. J. Pharm. Innov. 2018, 535, 106–112. [Google Scholar] [CrossRef]
- Porter, S.C. Chapter 27-Coating of pharmaceutical dosage forms. In Remington, 23rd ed.; Adejare, A., Ed.; Academic Press: Cambridge, MA, USA, 2021; pp. 551–564. [Google Scholar]
- Ho, L.; Müller, R.; Gordon, K.C.; Kleinebudde, P.; Pepper, M.; Rades, T.; Shen, Y.; Taday, P.F.; Zeitler, J.A. Applications of terahertz pulsed imaging to sustained-release tablet film coating quality assessment and dissolution performance. J. Control. Release 2008, 127, 79–87. [Google Scholar] [CrossRef]
- Radtke, J.; Wiedey, R.; Kleinebudde, P. Effect of coating time on inter- and intra-tablet coating uniformity. Eur. J. Pharm. Sci. 2019, 137, 104970. [Google Scholar] [CrossRef]
- Ariyasu, A.; Hattori, Y.; Otsuka, M. Non-destructive prediction of enteric coating layer thickness and drug dissolution rate by near-infrared spectroscopy and X-ray computed tomography. J. Pharm. Innov. 2017, 525, 282–290. [Google Scholar] [CrossRef]
- Romero-Torres, S.; Pérez-Ramos, J.D.; Morris, K.R.; Grant, E.R. Raman spectroscopy for tablet coating thickness quantification and coating characterization in the presence of strong fluorescent interference. J. Pharm. Biomed. Anal. 2006, 41, 811–819. [Google Scholar] [CrossRef] [PubMed]
- Lin, H.; Dong, Y.; Shen, Y.; Axel Zeitler, J. Quantifying Pharmaceutical Film Coating with Optical Coherence Tomography and Terahertz Pulsed Imaging: An Evaluation. J. Pharm. Sci. 2015, 104, 3377–3385. [Google Scholar] [CrossRef]
- Alves-Lima, D.; Song, J.; Li, X.; Portieri, A.; Shen, Y.; Zeitler, J.A.; Lin, H. Review of Terahertz Pulsed Imaging for Pharmaceutical Film Coating Analysis. Sensors 2020, 20, 1441. [Google Scholar] [CrossRef]
- Sondej, F.; Bück, A.; Koslowsky, K.; Bachmann, P.; Jacob, M.; Tsotsas, E. Investigation of coating layer morphology by micro-computed X-ray tomography. Powder Technol. 2015, 273, 165–175. [Google Scholar] [CrossRef]
- Sondej, F.; Bück, A.; Tsotsas, E. Comparative analysis of the coating thickness on single particles using X-ray micro-computed tomography and confocal laser-scanning microscopy. Powder Technol. 2016, 287, 330–340. [Google Scholar] [CrossRef]
- Hildebrand, T.; Rüegsegger, P. A new method for the model-independent assessment of thickness in three-dimensional images. J. Microsc. 1997, 185, 67–75. [Google Scholar] [CrossRef]
- Sinha, B. Efficient Wall Thickness Analysis Methods for Optimal Design of Casting Parts. 2007, pp. 1–4. Available online: https://geomcaliper.geometricglobal.com/files/2009/09/EfficientWallThicknessAnalysis_GeomCaliper.pdf (accessed on 1 April 2023).
- Siepmann, J.; Siegel, R.A.; Rathbone, M.J. (Eds.) Fundamentals and Applications of Controlled Release Drug Delivery; Springer: New York, NY, USA, 2012; Volume 3. [Google Scholar]
- Abdul, S.; Poddar, S. A flexible technology for modified release of drugs: Multi layered tablets. J. Control. Release 2004, 97, 393–405. [Google Scholar] [CrossRef] [PubMed]
- Brown, J.; Hanley, S.L.; Pygall, S.R.; Avalle, P.; Williams, H.D.; Melia, C.D. In Vitro Physical and Imaging Techniques to Evaluate Drug Release Mechanisms from Hydrophilic Matrix Tablets. In Hydrophilic Matrix Tablets for Oral Controlled Release; Timmins, P., Pygall, S., Melia, C., Eds.; Springer: New York, NY, USA, 2014; Volume 16. [Google Scholar]
- Liechty, W.B.; Kryscio, D.R.; Slaughter, B.V.; Peppas, N.A. Polymers for drug delivery systems. Annu. Rev. Chem. Biomol. Eng. 2010, 1, 149–173. [Google Scholar] [CrossRef]
- Fu, Y.; Kao, W.J. Drug release kinetics and transport mechanisms of non-degradable and degradable polymeric delivery systems. Expert Opin. Drug Deliv. 2010, 7, 429–444. [Google Scholar] [CrossRef]
- Yang, S.; Yin, X.; Wang, C.; Li, H.; He, Y.; Xiao, T.; Sun, L.; Li, J.; York, P.; He, J.; et al. Release Behaviour of Single Pellets and Internal Fine 3D Structural Features Co-define the In Vitro Drug Release Profile. AAPS J. 2014, 16, 860–871. [Google Scholar] [CrossRef]
- Park, K. Mechanisms controlling drug release from coated pellets. J. Control. Release 2016, 237, 185. [Google Scholar] [CrossRef]
- Ghosh, T.; Ghosh, A. Drug delivery through osmotic systems—An overview. J. Appl. Pharm. Sci. 2011, 2, 38–49. [Google Scholar]
- Li, X.; Jasti, B.R. Design of Controlled Release Drug Delivery Systems; McGraw-Hill: New York, NY, USA, 2006. [Google Scholar]
- Vaitukaitis, P.; Maggiolo, D.; Remmelgas, J.; Abrahmsén-Alami, S.; Bernin, D.; Siiskonen, M.; Malmqvist, J.; Sasic, S.; Sardina, G. Water transport and absorption in pharmaceutical tablets—A numerical study. Meccanica 2020, 55, 421–433. [Google Scholar] [CrossRef]
- Borjigin, T.; Zhan, X.; Li, J.; Meda, A.; Tran, K.K. Predicting mini-tablet dissolution performance utilizing X-ray computed tomography. Eur. J. Pharm. Sci. 2023, 181, 106346. [Google Scholar] [CrossRef]
- Jange, C.G.; Wassgren, C.R.; Ambrose, K. The Significance of Tablet Internal Structure on Disintegration and Dissolution of Immediate-Release Formulas: A Review. Powders 2023, 2, 99–123. [Google Scholar] [CrossRef]
- Zhang, S.; Wu, D.; Zhou, L. Characterization of Controlled Release Microspheres Using FIB-SEM and Image-Based Release Prediction. AAPS PharmSciTech 2020, 21, 194. [Google Scholar] [CrossRef] [PubMed]
- Bollmann, S.; Fischer, B.; Kleinebudde, P. Evaluation of the transferability of an image analysis approach of X-ray micro-computed tomography images for the application with a new validation concept for in silico tools. J. Drug Deliv. Sci. Technol. 2022, 70, 103163. [Google Scholar] [CrossRef]
- Tomic, I.; Vidis-Millward, A.; Mueller-Zsigmondy, M.; Cardot, J.M. Setting accelerated dissolution test for PLGA microspheres containing peptide, investigation of critical parameters affecting drug release rate and mechanism. J. Pharm. Innov. 2016, 505, 42–51. [Google Scholar] [CrossRef]
- Nott, K.P. Magnetic resonance imaging of tablet dissolution. Eur. J. Pharm. Biopharm. 2010, 74, 78–83. [Google Scholar] [CrossRef]
- Tajarobi, F.; Abrahmsén-Alami, S.; Carlsson, A.S.; Larsson, A. Simultaneous probing of swelling, erosion and dissolution by NMR-microimaging—Effect of solubility of additives on HPMC matrix tablets. Eur. J. Pharm. Sci. 2009, 37, 89–97. [Google Scholar] [CrossRef]
- Tritt-Goc, J.; Kowalczuk, J. In situ, real time observation of the disintegration of paracetamol tablets in aqueous solution by magnetic resonance imaging. Eur. J. Pharm. Sci. 2002, 15, 341–346. [Google Scholar] [CrossRef] [PubMed]
- Quodbach, J.; Moussavi, A.; Tammer, R.; Frahm, J.; Kleinebudde, P. Tablet Disintegration Studied by High-Resolution Real-Time Magnetic Resonance Imaging. J. Pharm. Sci. 2014, 103, 249–255. [Google Scholar] [CrossRef] [PubMed]
- Quodbach, J.; Moussavi, A.; Tammer, R.; Frahm, J.; Kleinebudde, P. Assessment of disintegrant efficacy with fractal dimensions from real-time MRI. J. Pharm. Innov. 2014, 475, 605–612. [Google Scholar] [CrossRef] [PubMed]
- Desai, P.M.; Liew, C.V.; Heng, P.W.S. Understanding Disintegrant Action by Visualization. J. Pharm. Sci. 2012, 101, 2155–2164. [Google Scholar] [CrossRef] [PubMed]
- Boetker, J.P.; Savolainen, M.; Koradia, V.; Tian, F.; Rades, T.; Müllertz, A.; Cornett, C.; Rantanen, J.; Ostergaard, J. Insights into the Early Dissolution Events of Amlodipine Using UV Imaging and Raman Spectroscopy. Mol. Pharm. 2011, 8, 1372–1380. [Google Scholar] [CrossRef]
- Li, Z.; Sun, Y.; Bar-Shalom, D.; Mu, H.; Larsen, S.W.; Jensen, H.; Østergaard, J. Towards functional characterization of excipients for oral solid dosage forms using UV–vis imaging. Liberation, release and dissolution. J. Pharm. Biomed. Anal. 2021, 194, 113789. [Google Scholar] [CrossRef]
- Gaunø, M.H.; Vilhelmsen, T.; Larsen, C.C.; Boetker, J.P.; Wittendorff, J.; Rantanen, J.; Østergaard, J. Real-time in vitro dissolution of 5-aminosalicylic acid from single ethyl cellulose coated extrudates studied by UV imaging. J. Pharm. Biomed. Anal. 2013, 83, 49–56. [Google Scholar] [CrossRef]
- Haaser, M.; Windbergs, M.; McGoverin, C.M.; Kleinebudde, P.; Rades, T.; Gordon, K.C.; Strachan, C.J. Analysis of matrix dosage forms during dissolution testing using Raman microscopy. J. Pharm. Sci. 2011, 100, 4452–4459. [Google Scholar] [CrossRef]
- Fussell, A.; Garbacik, E.; Offerhaus, H.; Kleinebudde, P.; Strachan, C. In situ dissolution analysis using coherent anti-Stokes Raman scattering (CARS) and hyperspectral CARS microscopy. Eur. J. Pharm. Biopharm. 2013, 85, 1141–1147. [Google Scholar] [CrossRef]
- Jurna, M.; Windbergs, M.; Strachan, C.J.; Hartsuiker, L.; Otto, C.; Kleinebudde, P.; Herek, J.L.; Offerhaus, H.L. Coherent Anti-Stokes Raman Scattering Microscopy to Monitor Drug Dissolution in Different Oral Pharmaceutical Tablets. J. Innov. Opt. Health Sci. 2009, 2, 37–43. [Google Scholar] [CrossRef]
- Punčochová, K.; Vukosavljevic, B.; Hanuš, J.; Beráánek, J.; Windbergs, M.; Štěpánek, F. Non-invasive insight into the release mechanisms of a poorly soluble drug from amorphous solid dispersions by confocal Raman microscopy. Eur. J. Pharm. Biopharm. 2016, 101, 119–125. [Google Scholar] [CrossRef]
- Francis, A.T.; Nguyen, T.T.; Lamm, M.S.; Teller, R.; Forster, S.P.; Xu, W.; Rhodes, T.; Smith, R.L.; Kuiper, J.; Su, Y.; et al. In Situ Stimulated Raman Scattering (SRS) Microscopy Study of the Dissolution of Sustained-Release Implant Formulation. Mol. Pharm. 2018, 15, 5793–5801. [Google Scholar] [CrossRef] [PubMed]
- Wray, P.S.; Clarke, G.S.; Kazarian, S.G. Dissolution of tablet-in-tablet formulations studied with ATR-FTIR spectroscopic imaging. Eur. J. Pharm. Sci. 2013, 48, 748–757. [Google Scholar] [CrossRef] [PubMed]
- Yin, X.; Li, H.; Guo, Z.; Wu, L.; Chen, F.; de Matas, M.; Shao, Q.; Xiao, T.; York, P.; He, Y.; et al. Quantification of Swelling and Erosion in the Controlled Release of a Poorly Water-Soluble Drug Using Synchrotron X-ray Computed Microtomography. AAPS J. 2013, 15, 1025–1034. [Google Scholar] [CrossRef] [PubMed]
- Young, P.M.; Nguyen, K.; Jones, A.S.; Traini, D. Microstructural Analysis of Porous Composite Materials: Dynamic Imaging of Drug Dissolution and Diffusion Through Porous Matrices. AAPS J. 2008, 10, 560–564. [Google Scholar] [CrossRef] [PubMed]
- Laity, P.R.; Cameron, R.E. Synchrotron X-ray microtomographic study of tablet swelling. Eur. J. Pharm. Biopharm. 2010, 75, 263–276. [Google Scholar] [CrossRef] [PubMed]
- Guo, Z.; Yin, X.; Liu, C.; Wu, L.; Zhu, W.; Shao, Q.; York, P.; Patterson, L.; Zhang, J. Microstructural investigation using synchrotron radiation X-ray microtomography reveals taste-masking mechanism of acetaminophen microspheres. J. Pharm. Innov. 2016, 499, 47–57. [Google Scholar] [CrossRef]
- Jannin, V.; Leccia, E.; Rosiaux, Y.; Doucet, J. Evolution of the Microstructure of Sustained-release Matrix Tablets during Dissolution and Storage. Indian J. Pharm. Sci. 2018, 80, 1011. [Google Scholar] [CrossRef]
- Fahier, J.; Muschert, S.; Fayard, B.; Velghe, C.; Byrne, G.; Doucet, J.; Siepmann, F.; Siepmann, J. Importance of air bubbles in the core of coated pellets: Synchrotron X-ray microtomography allows for new insights. J. Control. Release 2016, 237, 125–137. [Google Scholar] [CrossRef]
- Kulinowski, P.; Woyna-Orlewicz, K.; Rappen, G.M.; Haznar-Garbacz, D.; Wȩglarz, W.P.; Dorożyński, P.P. An understanding of modified release matrix tablets behavior during drug dissolution as the key for prediction of pharmaceutical product performance–Case study of multimodal characterization of quetiapine fumarate tablets. J. Pharm. Innov. 2015, 484, 235–245. [Google Scholar] [CrossRef]
- Traini, D.; Jones, A.S.; Young, P.M. X-ray computer microtomography for the study of modified release systems. Microsc. Anal. 2008, 20, 13–15. [Google Scholar]
- Li, H.; Yin, X.; Ji, J.; Sun, L.; Shao, Q.; York, P.; Xiao, T.; He, Y.; Zhang, J. Microstructural investigation to the controlled release kinetics of monolith osmotic pump tablets via synchrotron radiation X-ray microtomography. J. Pharm. Innov. 2012, 427, 270–275. [Google Scholar] [CrossRef] [PubMed]
- Quinten, T.; Gonnissen, Y.; Adriaens, E.; Beer, T.D.; Cnudde, V.; Masschaele, B.; Van Hoorebeke, L.; Siepmann, J.; Remon, J.P.; Vervaet, C. Development of injection moulded matrix tablets based on mixtures of ethylcellulose and low-substituted hydroxypropylcellulose. Eur. J. Pharm. Sci. 2009, 37, 207–216. [Google Scholar] [CrossRef]
- Laity, P.R.; Mantle, M.D.; Gladden, L.F.; Cameron, R. Magnetic resonance imaging and X-ray microtomography studies of a gel-forming tablet formulation. Eur. J. Pharm. Biopharm. 2010, 74, 109–119. [Google Scholar] [CrossRef] [PubMed]
- Losi, E.; Peppas, N.A.; Ketcham, R.A.; Colombo, G.; Bettini, R.; Sonvico, F.; Colombo, P. Investigation of the swelling behavior of Dome Matrix drug delivery modules by high-resolution X-ray computed tomography. J. Drug Deliv. Sci. Technol. 2013, 23, 165–170. [Google Scholar] [CrossRef]
- Dierick, M.; Van Loo, D.; Masschaele, B.; Van den Bulcke, J.; Van Acker, J.; Cnudde, V.; Van Hoorebeke, L. Recent micro-CT scanner developments at UGCT. Nucl. Instrum. Methods Phys. Res. Sect. B Beam Interact. Mater. Atoms 2014, 324, 35–40. [Google Scholar] [CrossRef]
- Fei, G.; Pu, X.; Li, G.; Wang, Z.; Xia, H. HIFU induced particles redistribution in polymer matrix via synchrotron radiation X-ray microtomography. Ultrason. Sonochemistry 2018, 49, 97–105. [Google Scholar] [CrossRef]
- Yin, X.; Li, H.; Liu, R.; Chen, J.; Ji, J.; Chen, J.; Shao, Q.; Xiao, T.; York, P.; He, Y.; et al. Fractal structure determines controlled release kinetics of monolithic osmotic pump tablets. J. Pharm. Pharmacol. 2013, 65, 953–959. [Google Scholar] [CrossRef]
- Mönkäre, J.; Pajander, J.; Hakala, R.A.; Savolainen, P.; Järveläinen, M.; Korhonen, H.; Seppälä, J.V.; Järvinen, K. Characterization of internal structure, polymer erosion and drug release mechanisms of biodegradable poly(ester anhydride)s by X-ray microtomography. Eur. J. Pharm. Sci. 2012, 47, 170–178. [Google Scholar] [CrossRef]
- Huanbutta, K.; Terada, K.; Sriamornsak, P.; Nunthanid, J. Advanced technologies for assessment of polymer swelling and erosion behaviors in pharmaceutical aspect. Eur. J. Pharm. Biopharm. 2013, 83, 315–321. [Google Scholar] [CrossRef]
- García-Moreno, F.; Kamm, P.H.; Neu, T.R.; Bülk, F.; Noack, M.A.; Wegener, M.; von der Eltz, N.; Schlepütz, C.M.; Stampanoni, M.; Banhart, J. Tomoscopy: Time-Resolved Tomography for Dynamic Processes in Materials. Adv. Mater. 2021, 33, 2104659. [Google Scholar] [CrossRef] [PubMed]
- Villanova, J.; Daudin, R.; Lhuissier, P.; Jauffres, D.; Lou, S.; Martin, C.L.; Labouré, S.; Tucoulou, R.; Martinez-Criado, G.; Salvo, L. Fast in situ 3D nanoimaging: A new tool for dynamic characterization in materials science. Mater. Today 2017, 20, 354–359. [Google Scholar] [CrossRef]
- Yeoh, T.; Ma, L.; Badruddoza, A.Z.; Shah, J.; Zhang, S. Semisolid Pharmaceutical Product Characterization Using Non-invasive X-ray Microscopy and AI-Based Image Analytics. AAPS J. 2022, 24, 46. [Google Scholar] [CrossRef] [PubMed]

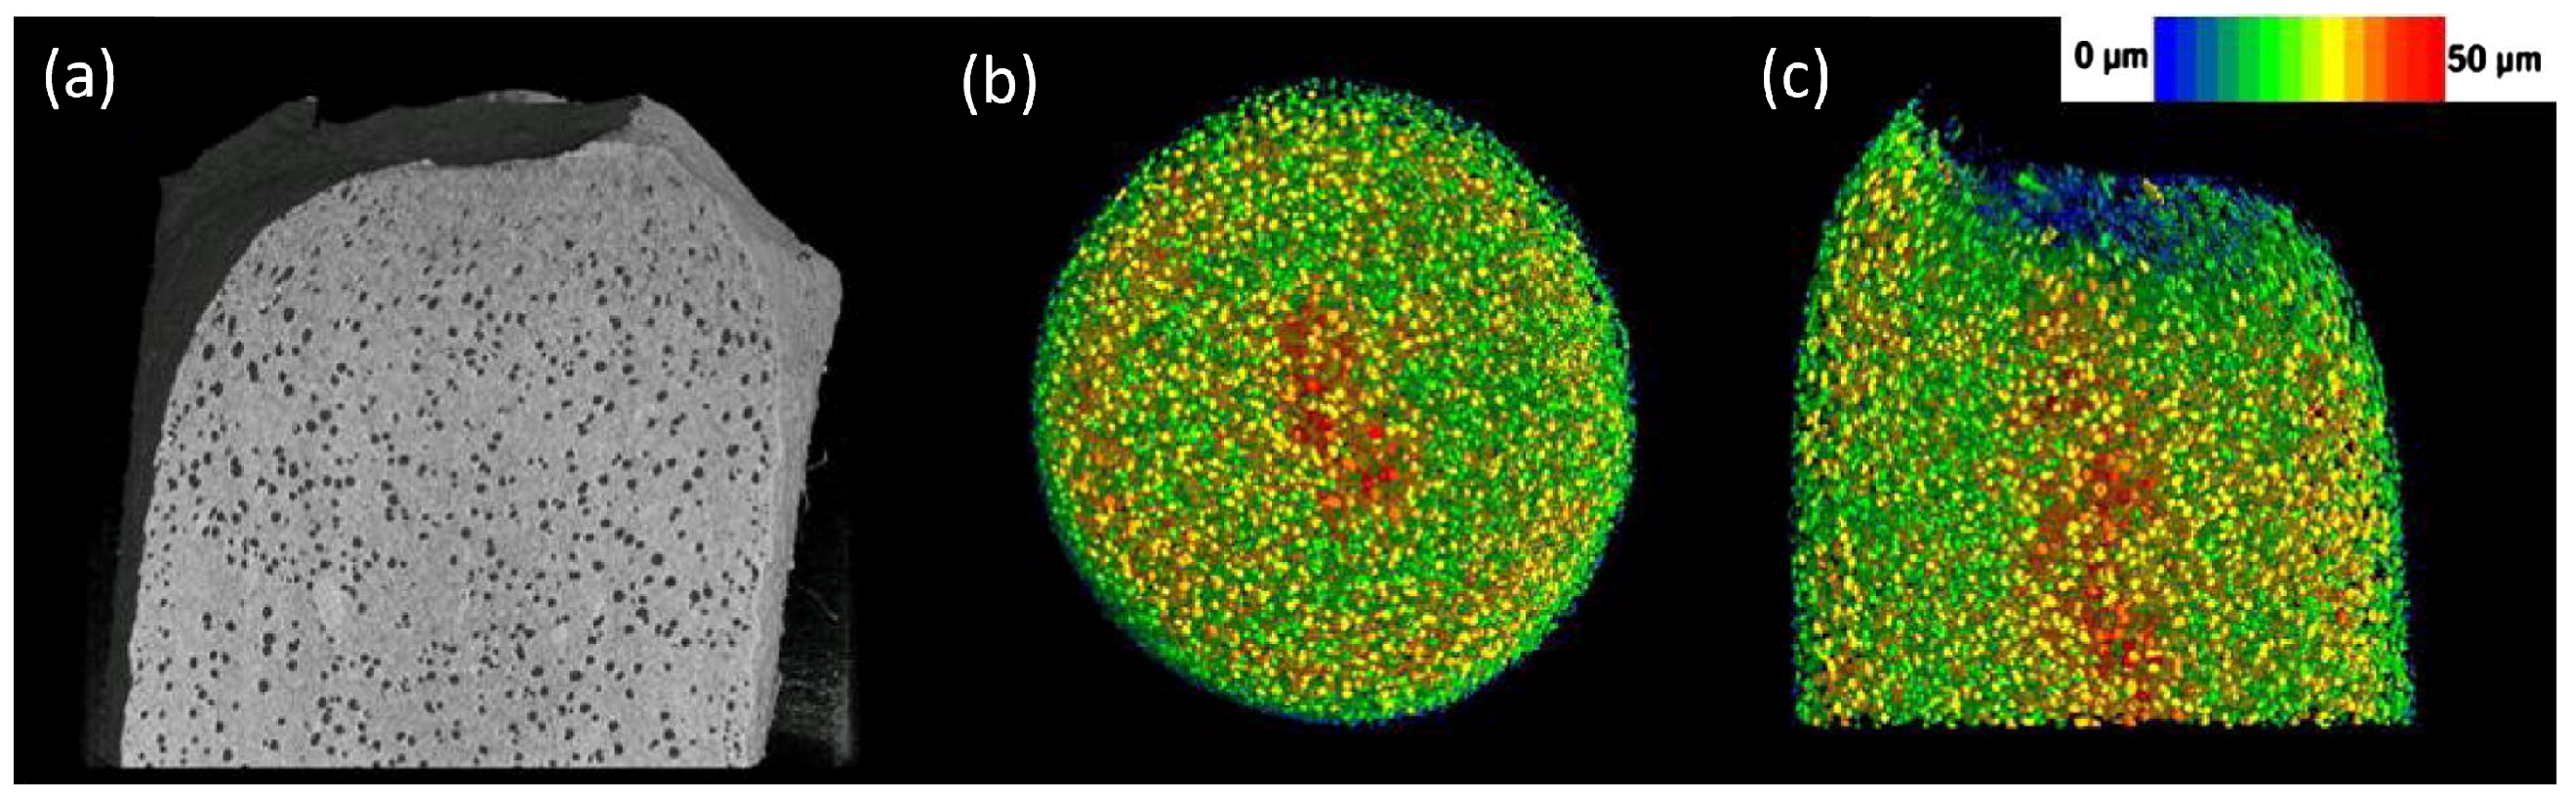
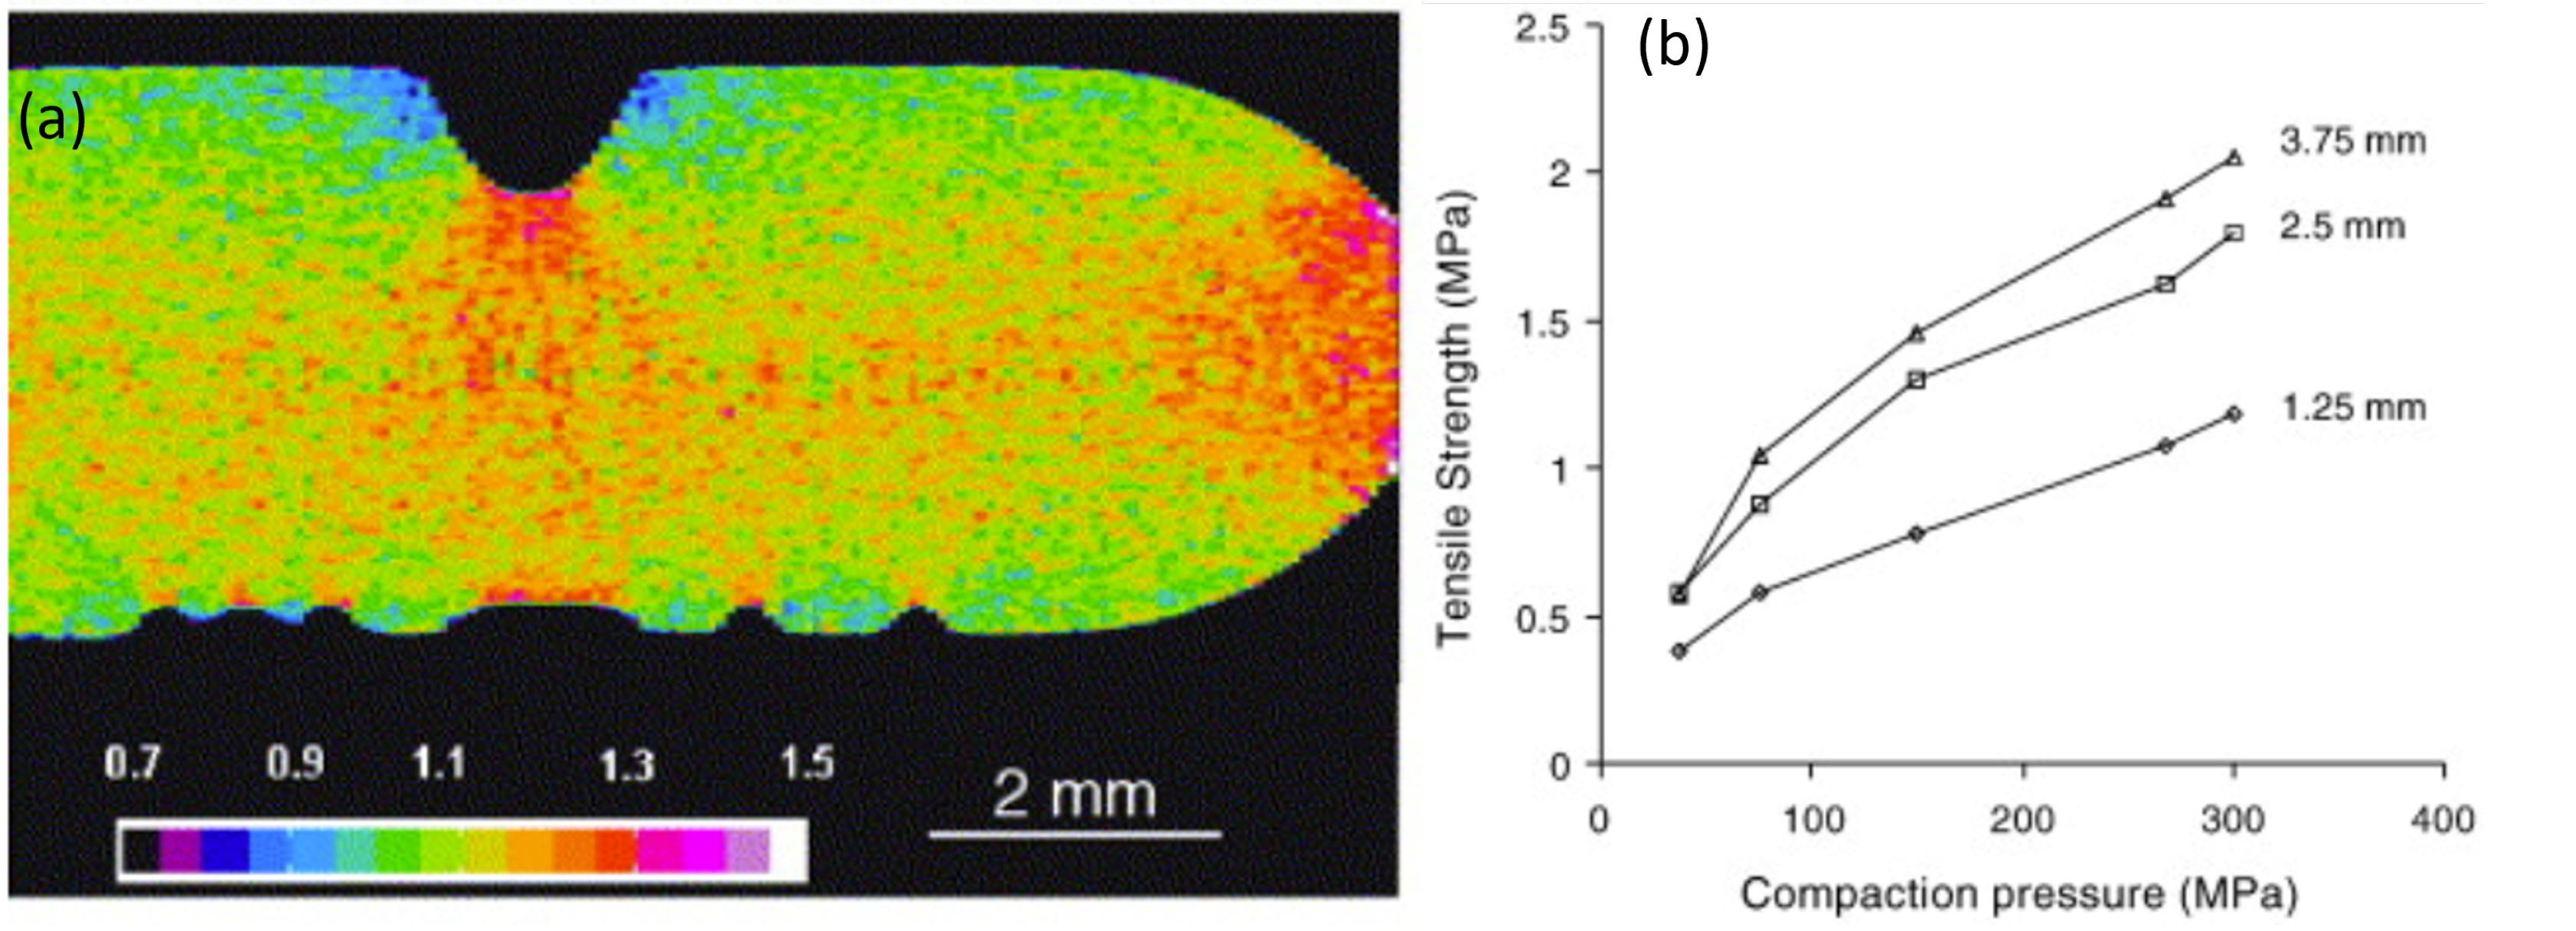
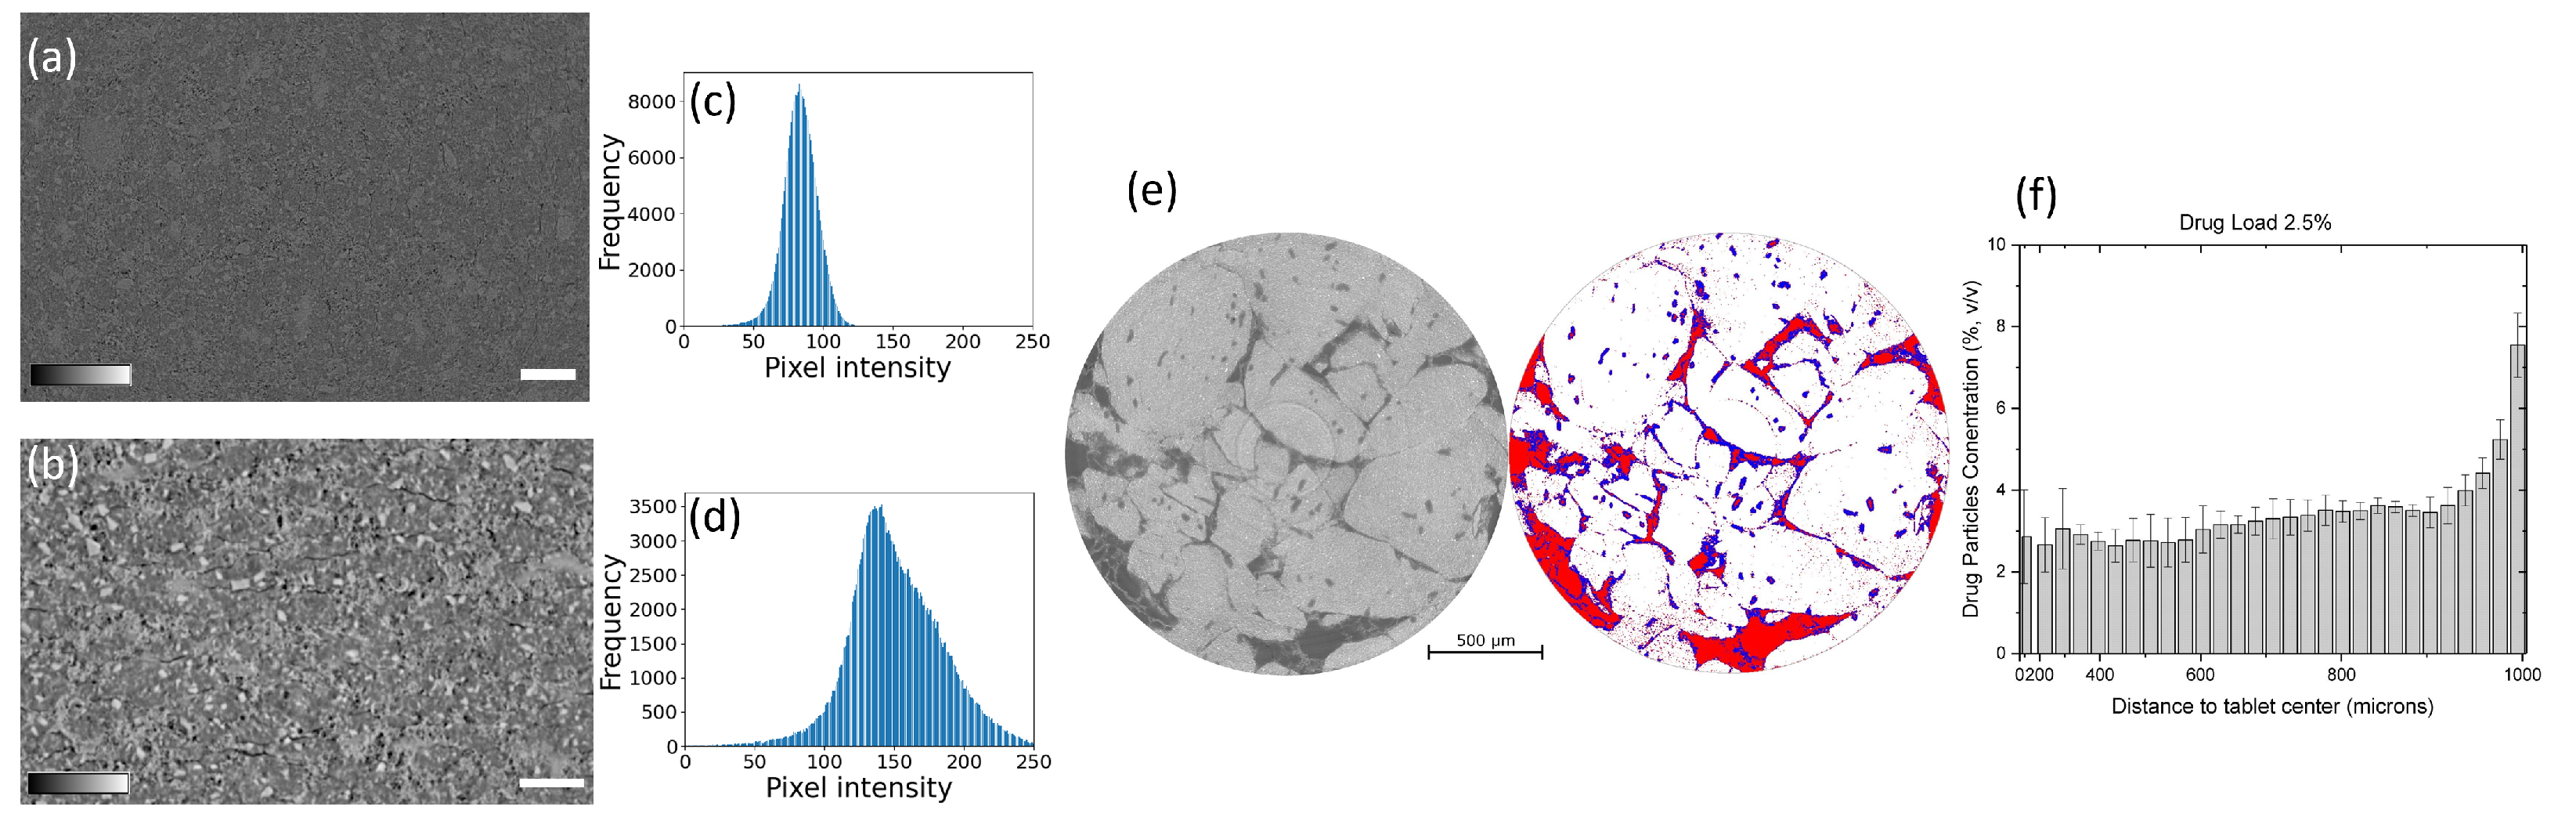
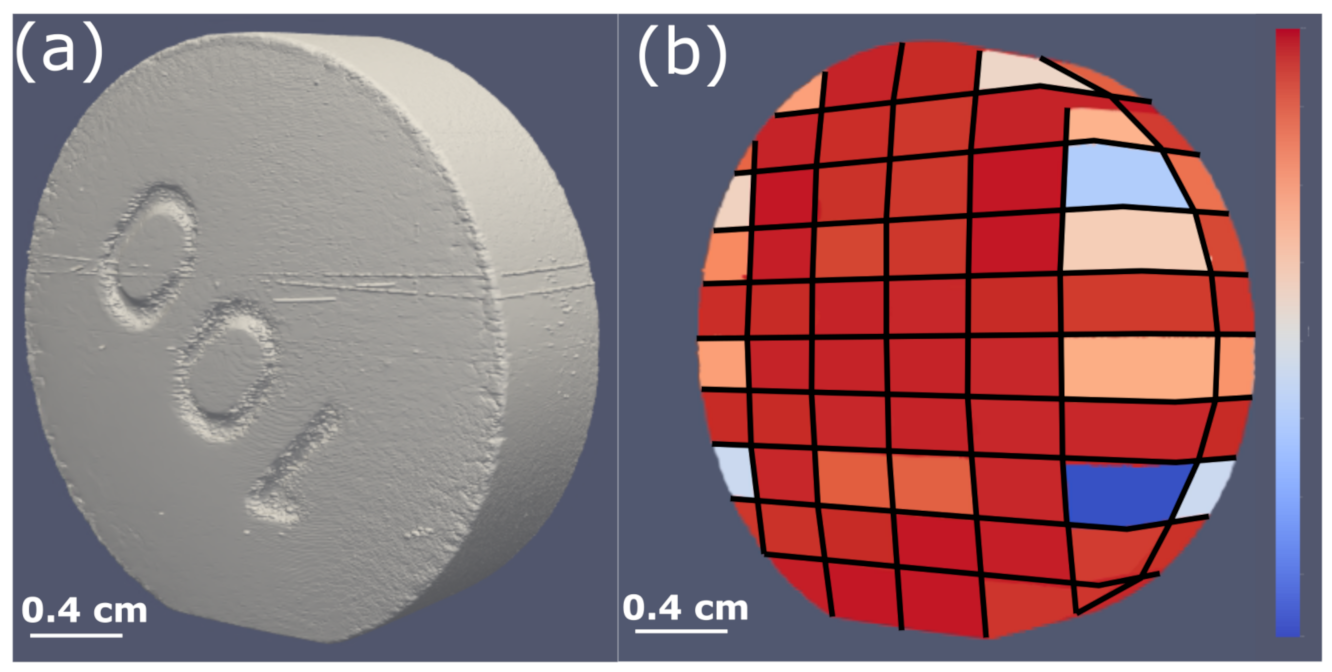
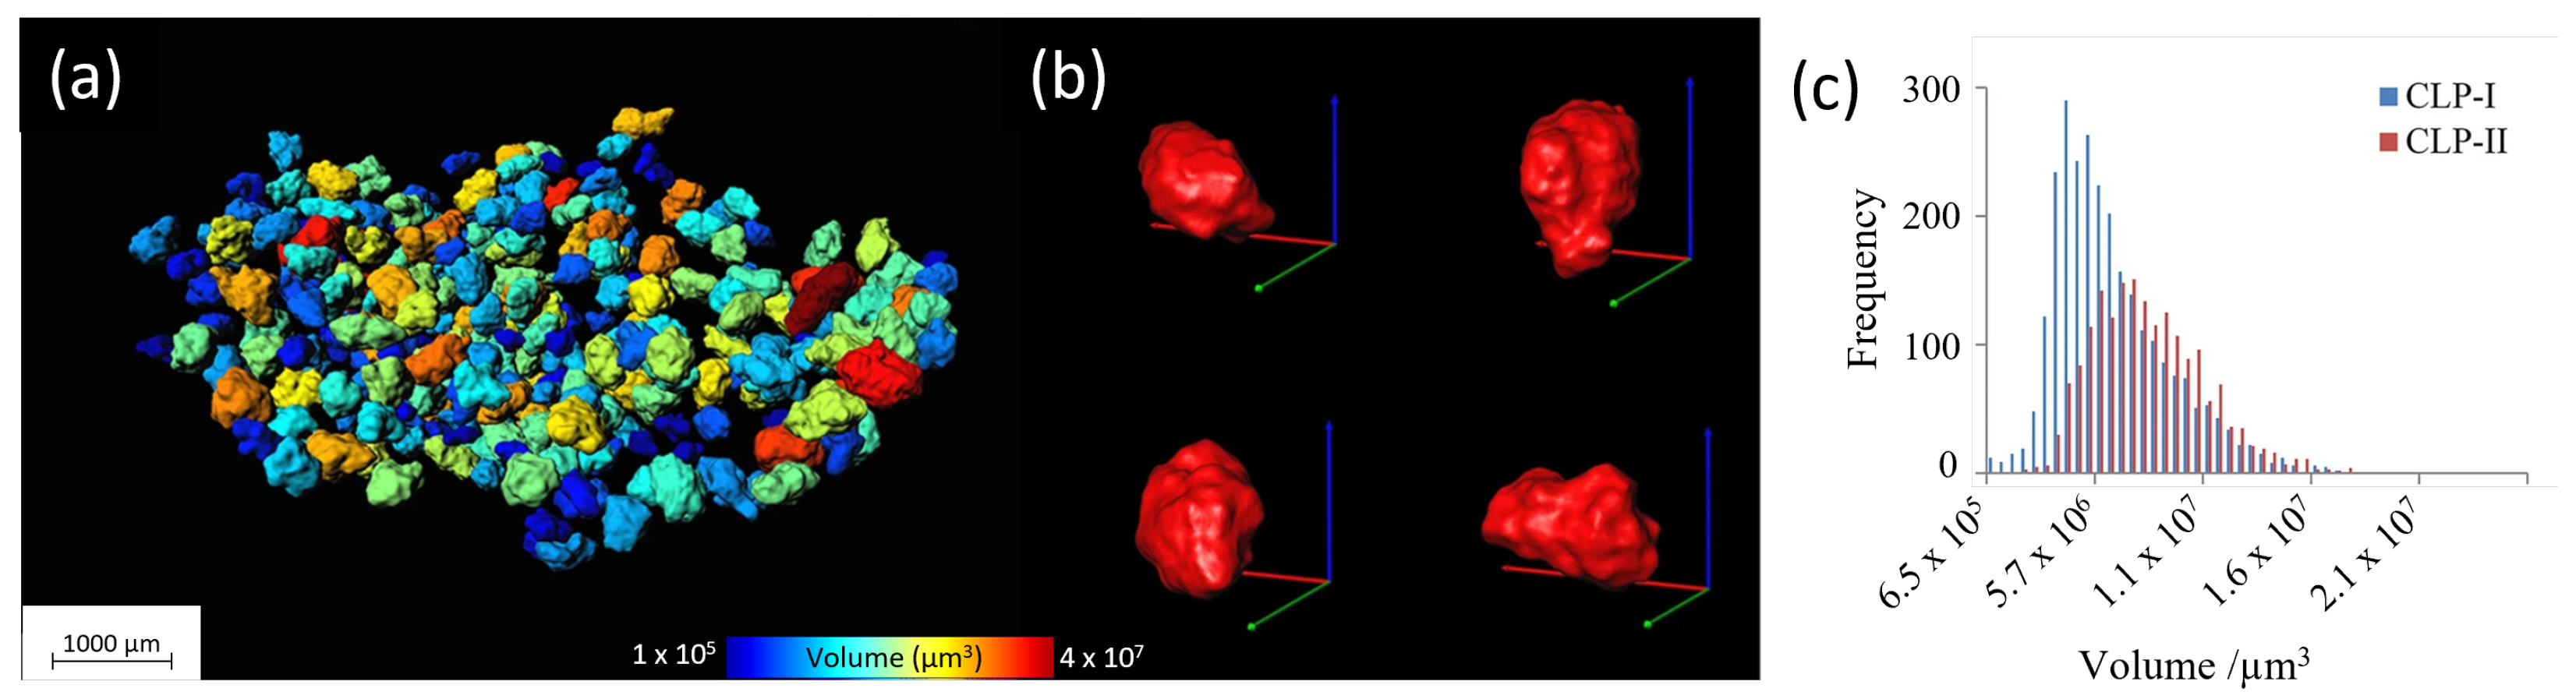
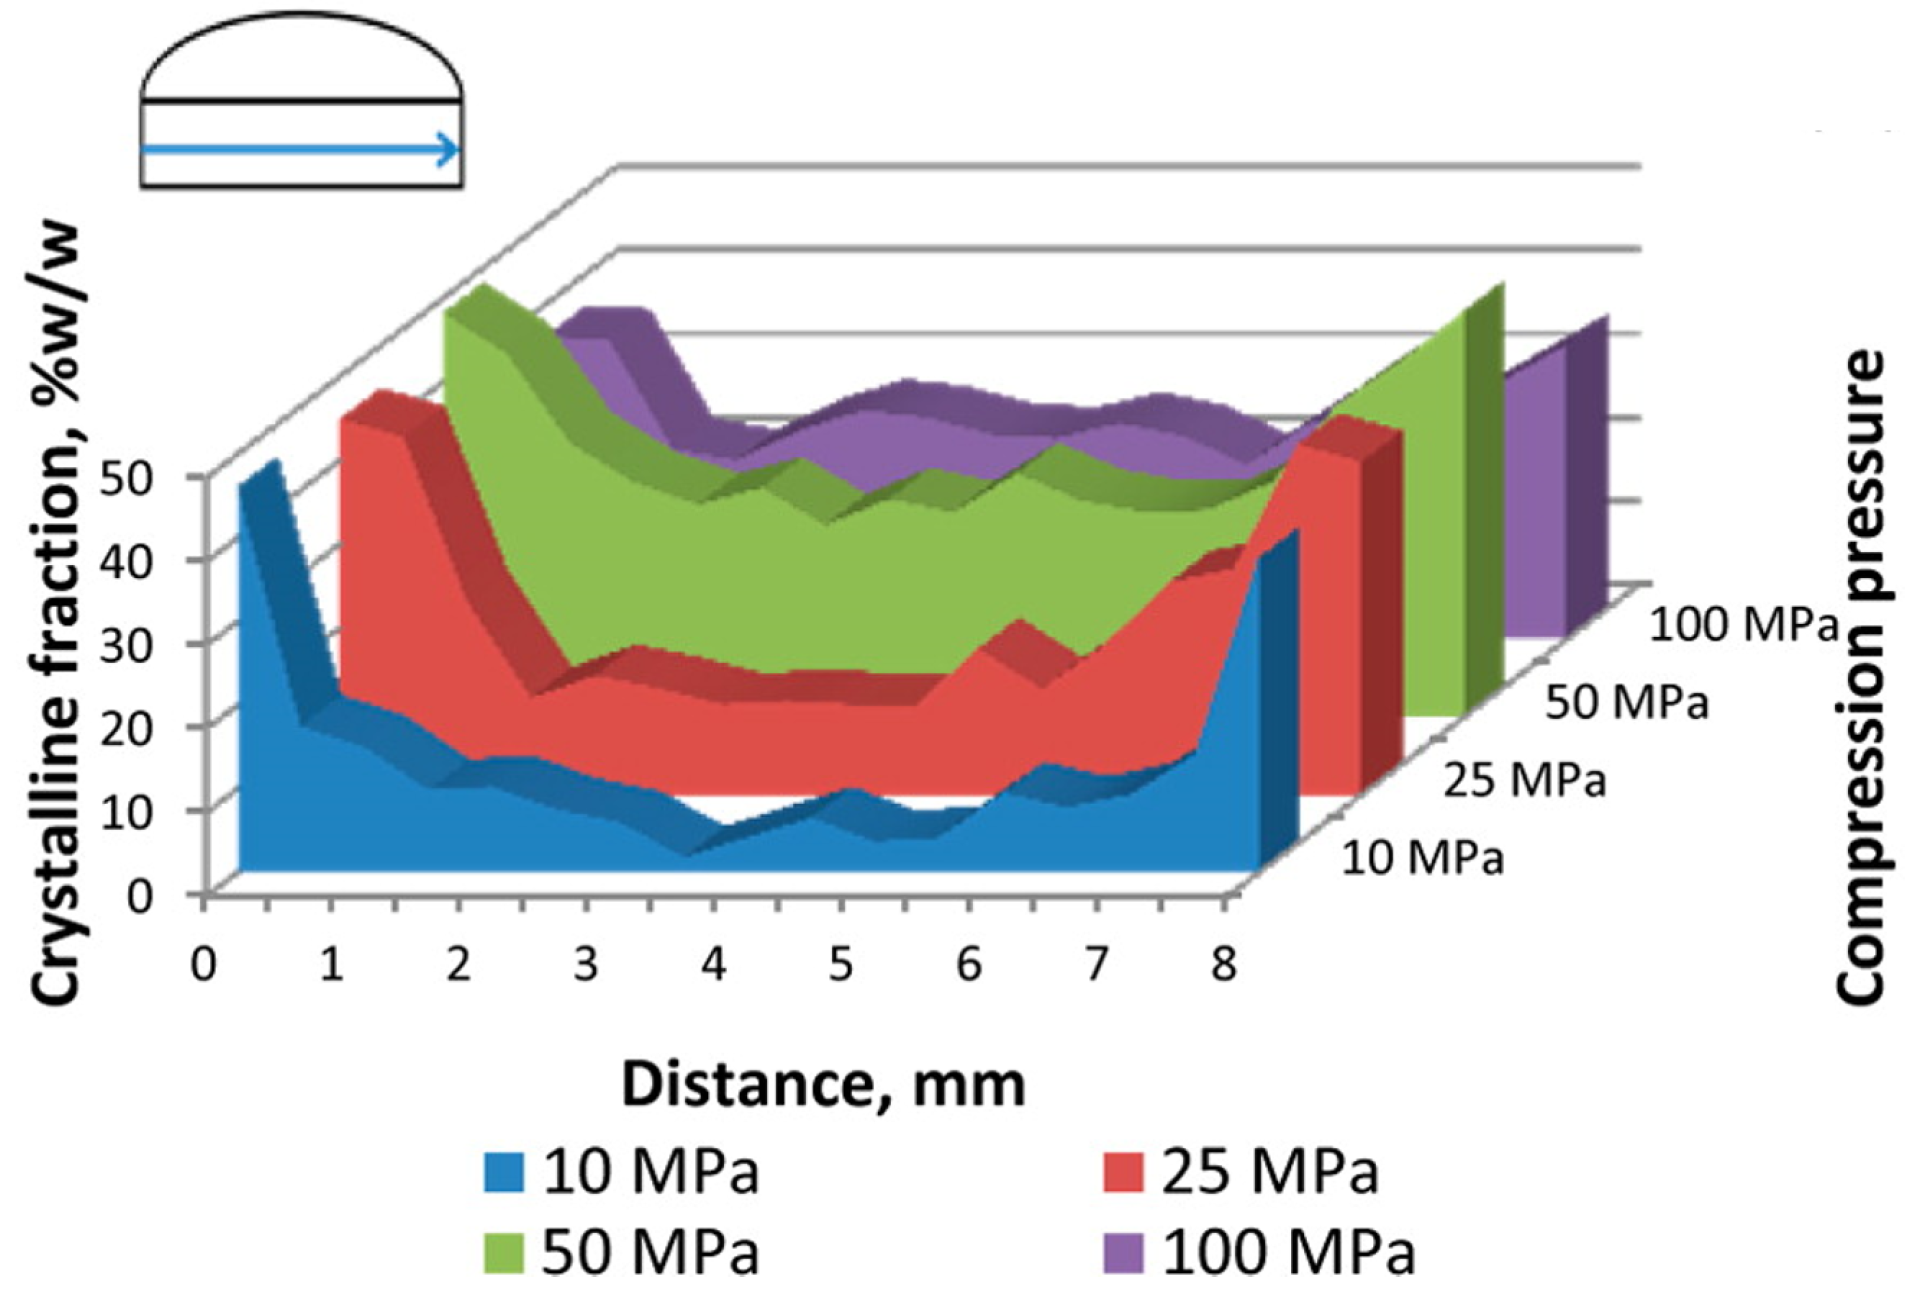
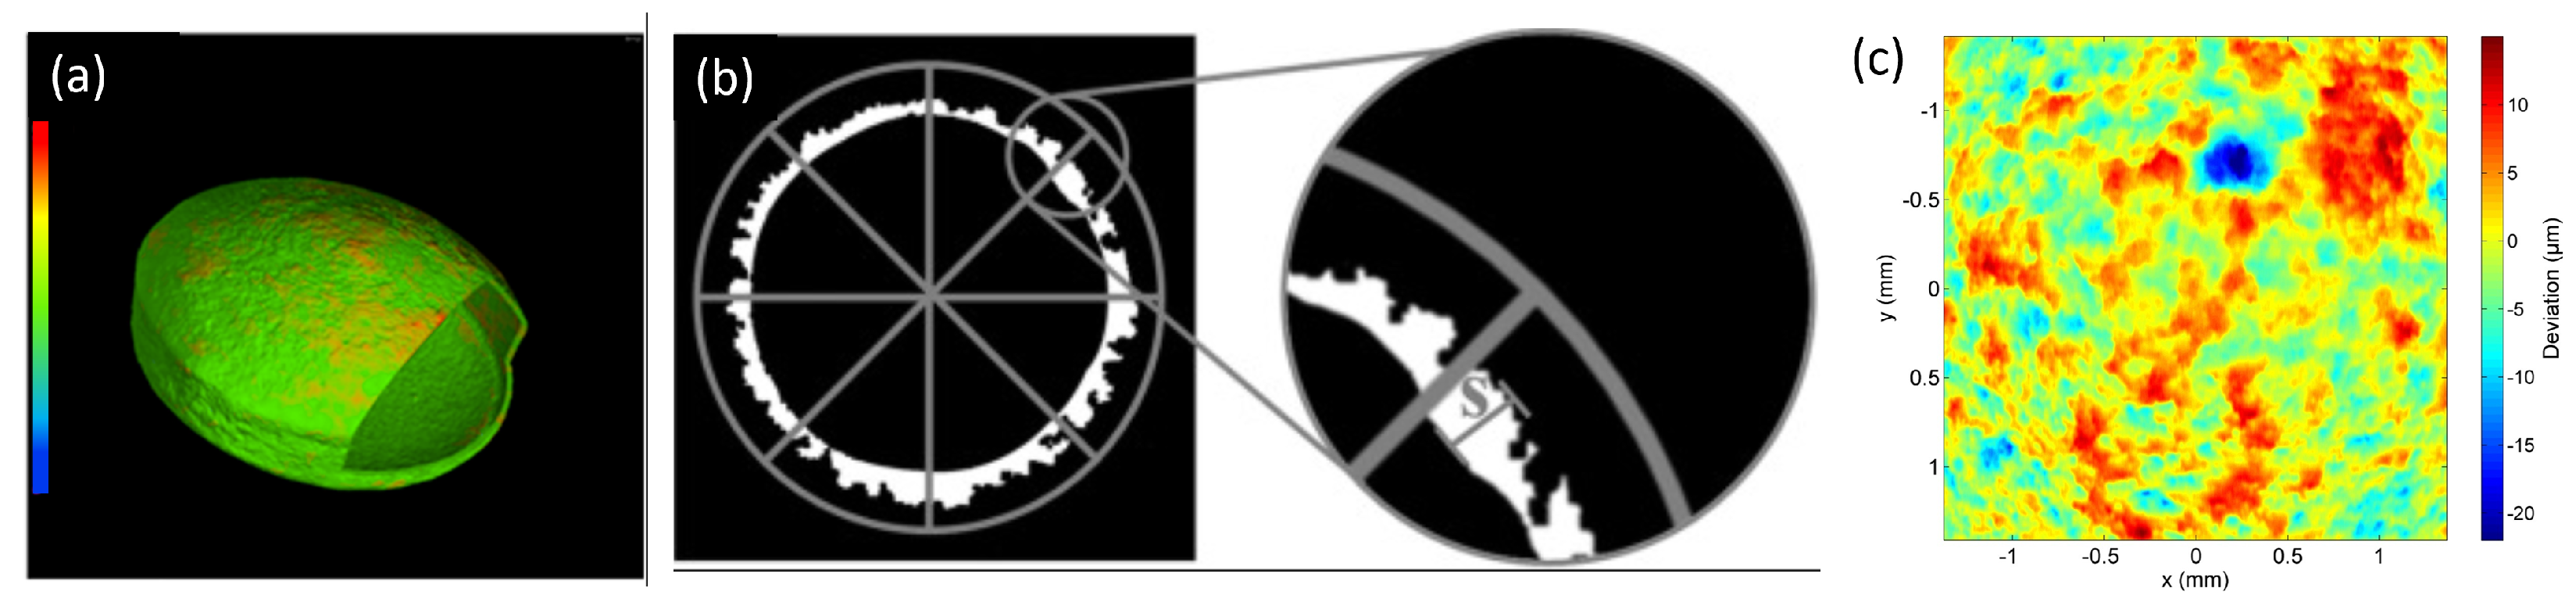
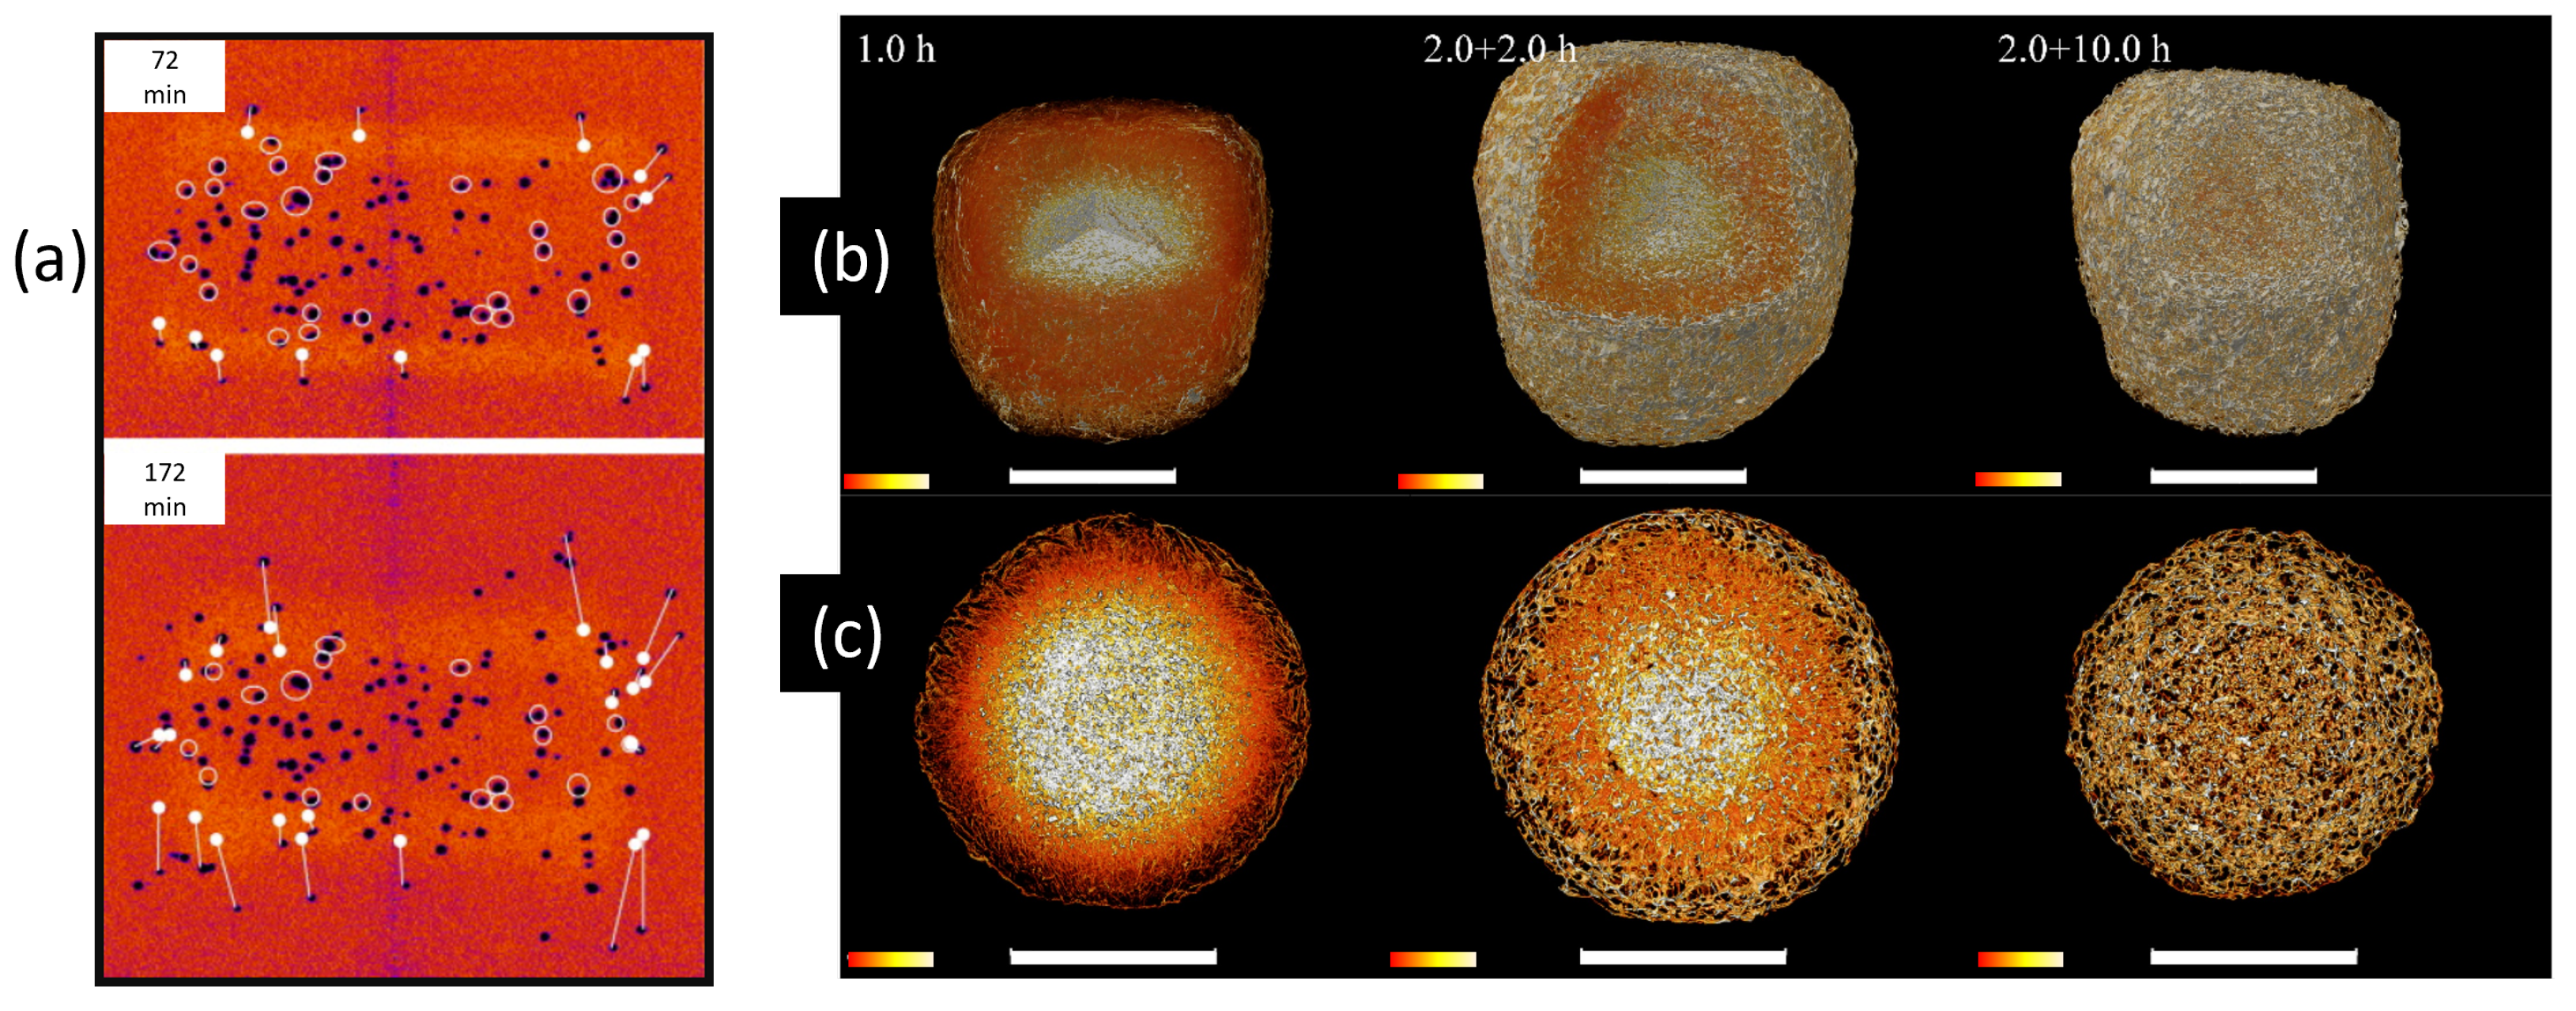
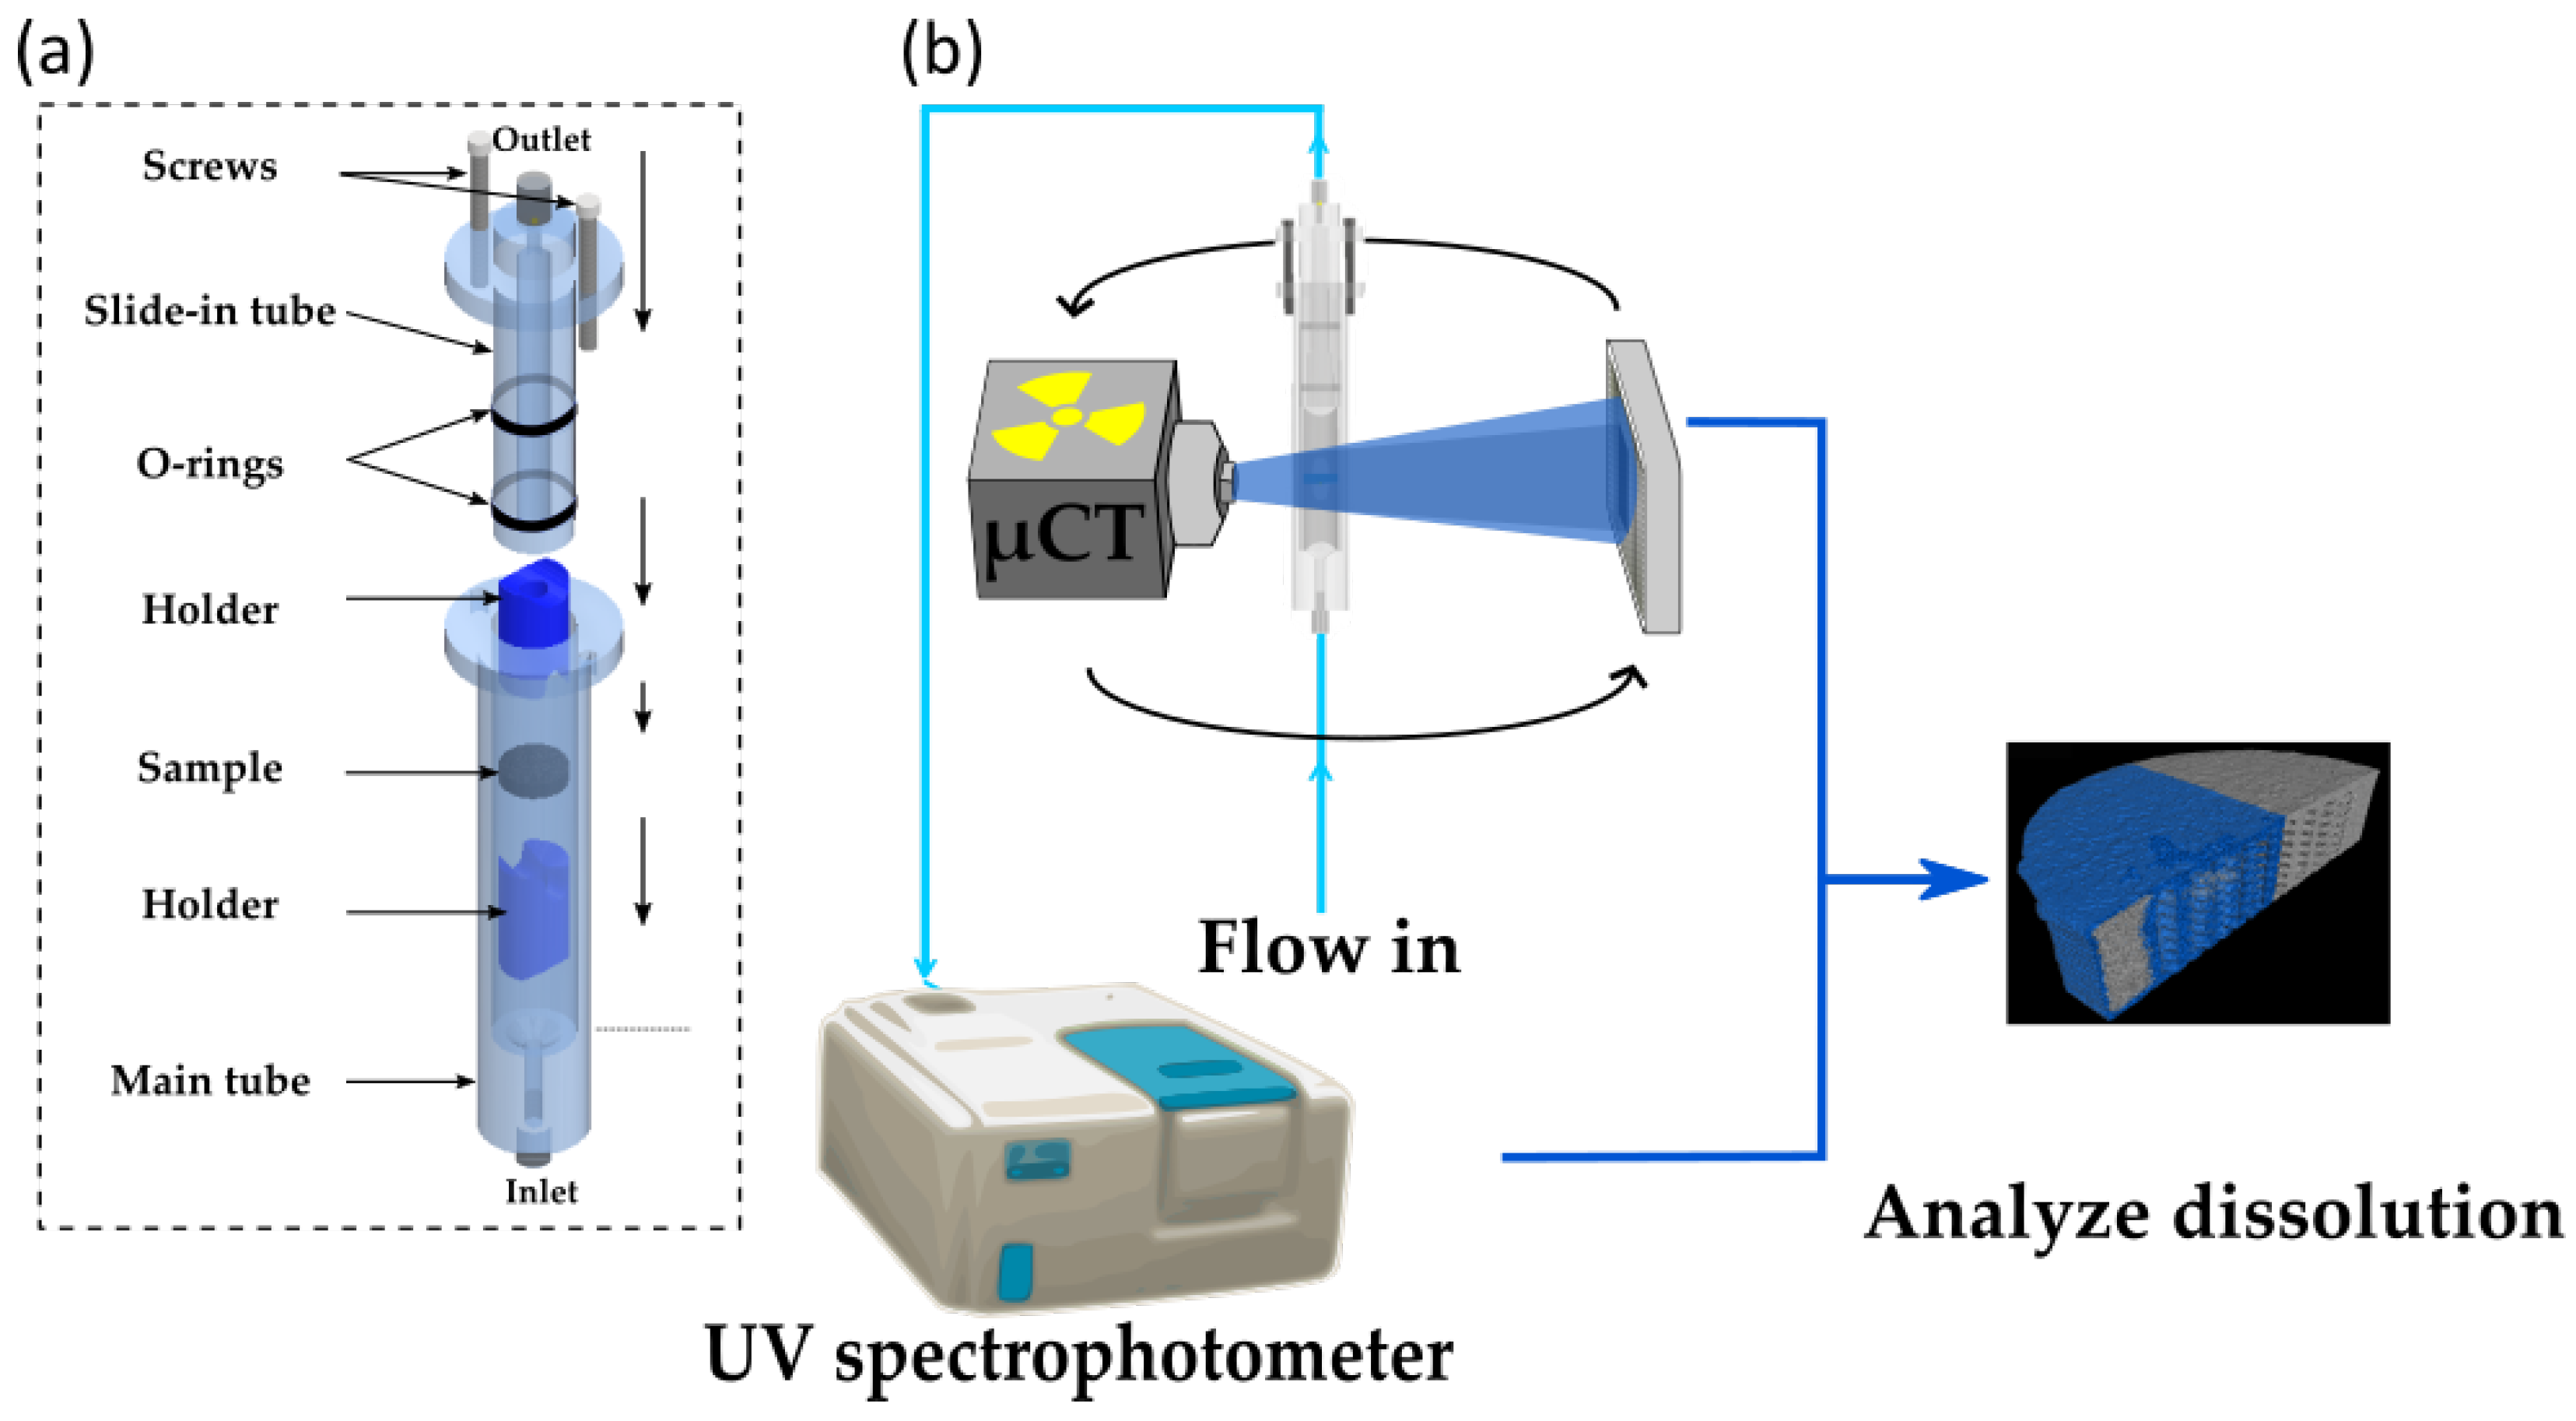
| Characterization | Analytical Approaches | Corresponding X-ray Tomography Characterization |
|---|---|---|
| Mechanical | Hardness test, acoustic methods, hydrostatic weighing and microscopic examinations, compaction simulator [51,52] | Analyze pore concentration, size, shape, connectivity; measure density distribution |
| Content identification (assay/uniformity) | High performance liquid chromatography, NIR, IR Raman, vibrational spectroscopy, tablet weighing, hardness test [53,54,55] | Analyze API/structures of interest distribution, density distribution |
| Intrinsic | Crystallinity-Lab-based diffractometer, small angle X-ray scattering, powder X-ray diffraction [56,57]; particle morphology-SEM | Crystallinity-Diffraction X-ray tomography. Particle morphology-segmentating and analyzing individual particles |
| Coating layer | Tablet weighing, optical microscopy/SEM | Segment coating layer to analyze local thickness, roughness profile |
| Dissolution | Disintegration and dissolution testing [58] | Real time disintegration and dissolution imaging |
Disclaimer/Publisher’s Note: The statements, opinions and data contained in all publications are solely those of the individual author(s) and contributor(s) and not of MDPI and/or the editor(s). MDPI and/or the editor(s) disclaim responsibility for any injury to people or property resulting from any ideas, methods, instructions or products referred to in the content. |
© 2023 by the authors. Licensee MDPI, Basel, Switzerland. This article is an open access article distributed under the terms and conditions of the Creative Commons Attribution (CC BY) license (https://creativecommons.org/licenses/by/4.0/).
Share and Cite
Vijayakumar, J.; Goudarzi, N.M.; Eeckhaut, G.; Schrijnemakers, K.; Cnudde, V.; Boone, M.N. Characterization of Pharmaceutical Tablets by X-ray Tomography. Pharmaceuticals 2023, 16, 733. https://doi.org/10.3390/ph16050733
Vijayakumar J, Goudarzi NM, Eeckhaut G, Schrijnemakers K, Cnudde V, Boone MN. Characterization of Pharmaceutical Tablets by X-ray Tomography. Pharmaceuticals. 2023; 16(5):733. https://doi.org/10.3390/ph16050733
Chicago/Turabian StyleVijayakumar, Jaianth, Niloofar Moazami Goudarzi, Guy Eeckhaut, Koen Schrijnemakers, Veerle Cnudde, and Matthieu N. Boone. 2023. "Characterization of Pharmaceutical Tablets by X-ray Tomography" Pharmaceuticals 16, no. 5: 733. https://doi.org/10.3390/ph16050733