

A Green HPLC Approach to Florfenicol Analysis in Pig Urine
 , , , , ,
Abstract
1. Introduction
2. Results
2.1. RP-HPLC-DAD Method Validation
2.2. Green Profile of the RP-HPLC-DAD Method
2.3. Greenness Assessments of the Published Methods
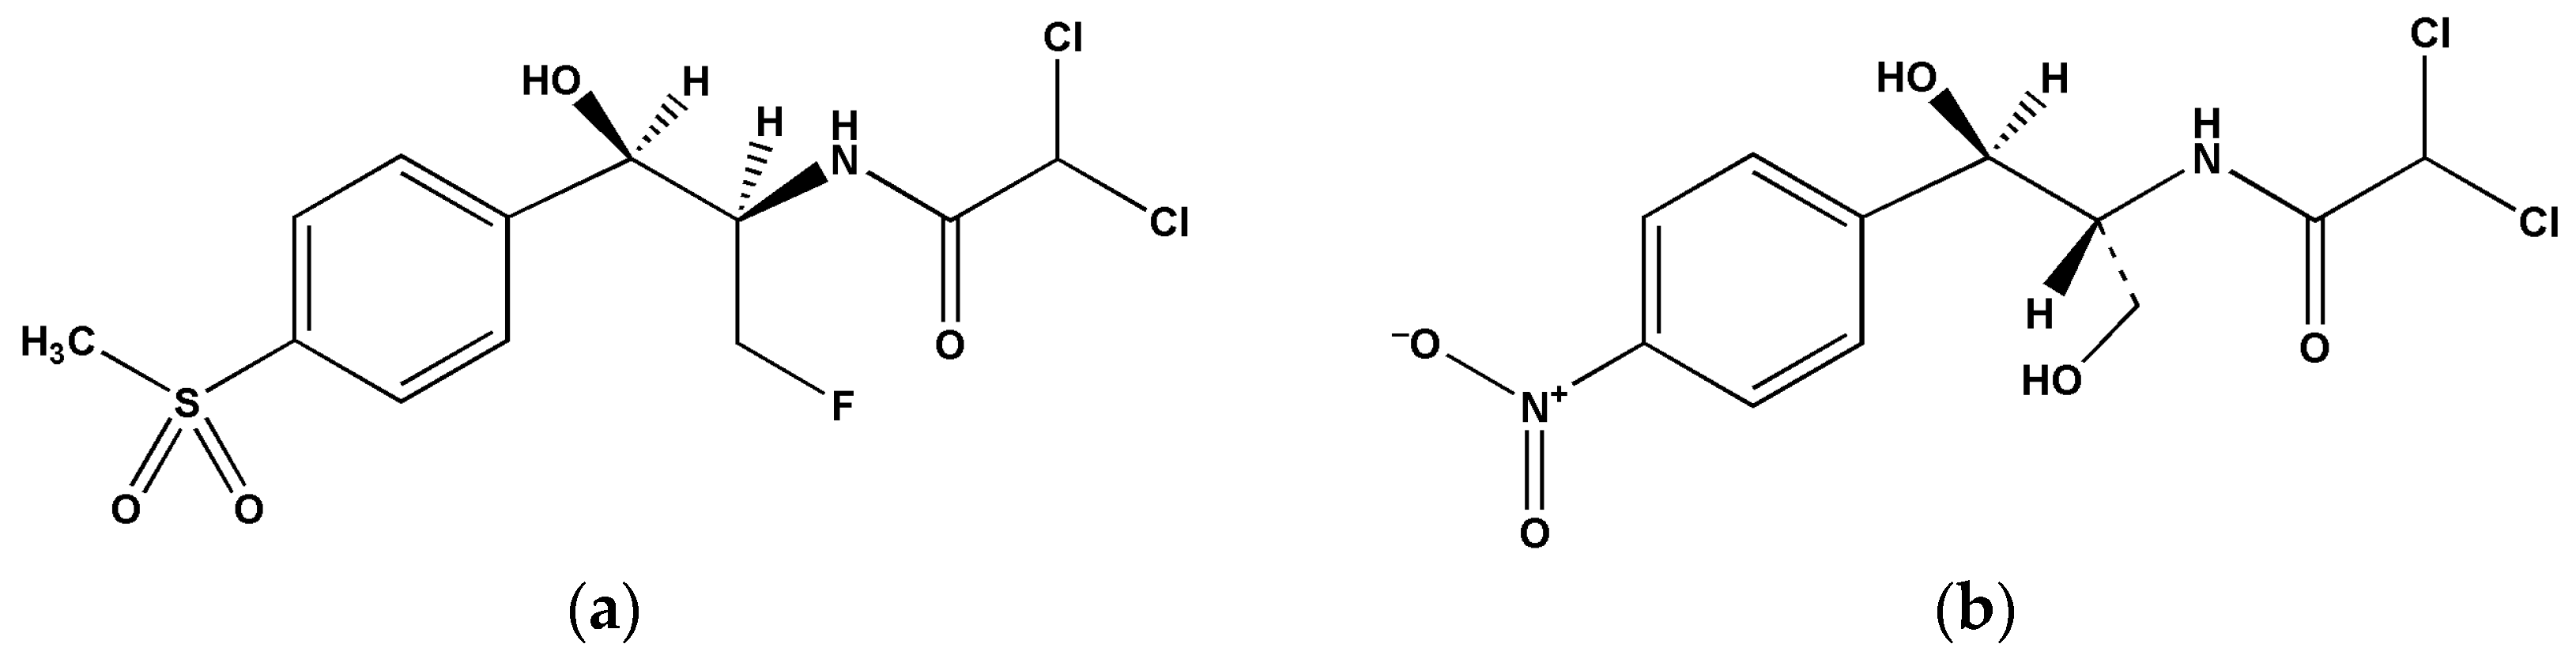
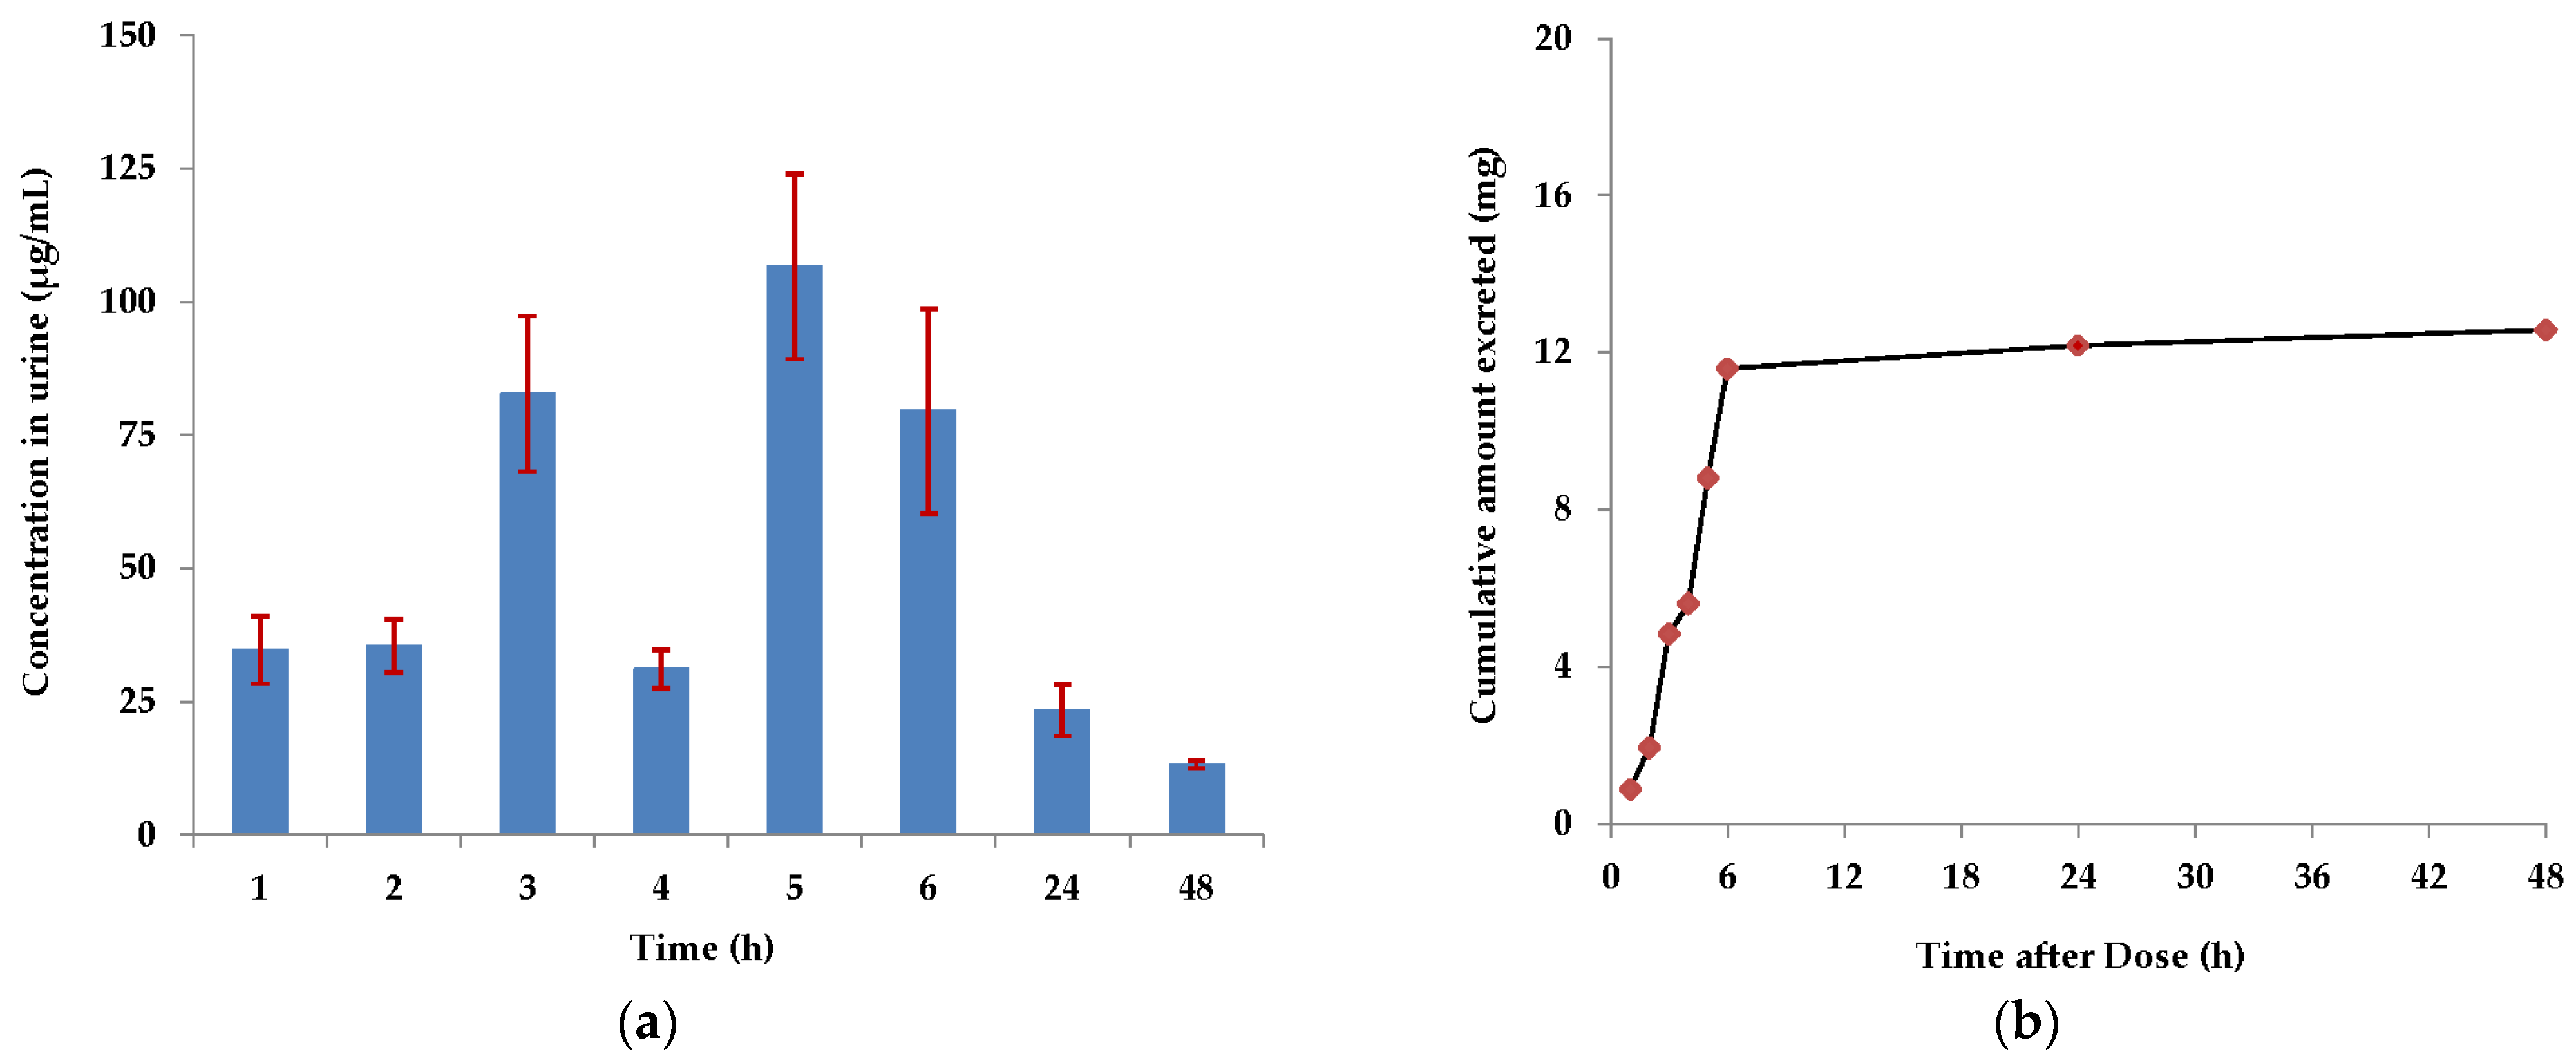
2.4. Urinary Excretion of the FF
3. Discussion
4. Materials and Methods
4.1. Sample Collection
4.2. Standard and Sample Preparation
4.3. RP-HPLC-DAD Method
4.4. Method Validation
4.5. Greenness Assessment
5. Conclusions
Supplementary Materials
Author Contributions
Funding
Institutional Review Board Statement
Informed Consent Statement
Data Availability Statement
Acknowledgments
Conflicts of Interest
References
- Varma, K.J.; Adams, P.E.; Powers, T.E.; Powers, J.D.; Lamendola, J.F. Pharmacokinetics of Florfenicol in Veal Calves. J. Vet. Pharmacol. Therap. 1986, 9, 412–425. [Google Scholar] [CrossRef] [PubMed]
- Ueda, Y.; Ohtsuki, S.; Narukawa, N. Efficacy of Florfenicol on Experimental Actinobacillus Pleuropneumonia in Pigs. J. Vet Med. Sci. 1995, 57, 261–265. [Google Scholar] [CrossRef] [PubMed]
- Apley, M. Antimicrobial Therapy of Bovine Respiratory Disease. Vet. Clin. N. Am. Food Anim. Pract. 1997, 13, 549–574. [Google Scholar] [CrossRef] [PubMed]
- Cook, A.L.; St Claire, M.; Sams, R. Use of Florfenicol in Non-human Primates. J. Med. Primatol. 2004, 33, 127–133. [Google Scholar] [CrossRef] [PubMed]
- Committee for Veterinary Medicinal Products. Florfenicol (Extension to Pigs), Summary Report (4). EMEA/MRL/591/99-FINAL; European Medicines Agency: London, UK, 1999; pp. 1–4. Available online: https://www.ema.europa.eu/documents/mrl-report/florfenicol-extension-pigs-summary-report-4-committee-veterinary-medicinal-products_en.pdf (accessed on 1 March 2024).
- Berendsen, B.J.; Wegh, R.S.; Memelink, J.; Zuidema, T.; Stolker, L.A. The Analysis of Animal Faeces as a Tool to Monitor Antibiotic Usage. Talanta 2015, 132, 258–268. [Google Scholar] [CrossRef] [PubMed]
- Park, M.-K.; Oh, J.-Y.; Lee, S.-E.; Choi, S.-D. Determination of Veterinary Pharmaceutical Runoffs from a Swine Manure Pile Using LC–MS/MS. Appl. Biol. Chem. 2020, 63, 69. [Google Scholar] [CrossRef]
- Chee-Sanford, J.C.; Mackie, R.I.; Koike, S.; Krapac, I.G.; Lin, Y.-F.; Yannarell, A.C.; Maxwell, S.; Aminov, R.I. Fate and Transport of Antibiotic Residues and Antibiotic Resistance Genes following Land Application of Manure Waste. J. Environ. Qual. 2009, 38, 1086–1108. [Google Scholar] [CrossRef]
- Matamoros, V.; Casas, M.E.; Pastor, E.; Tadić, Đ.; Canameras, N.; Carazo, N.; Bayona, J.M. Effects of Tetracycline, Sulfonamide, Fluoroquinolone, and Lincosamide Load in Pig Slurry on Lettuce: Agricultural and Human Health Implications. Environ. Res. 2022, 215, 114237. [Google Scholar] [CrossRef] [PubMed]
- Frey, L.; Tanunchai, B.; Glaser, B. Antibiotics Residues in Pig Slurry and Manure and its Environmental Contamination Potential. A meta-analysis. Agron. Sustain. Dev. 2022, 42, 31. [Google Scholar] [CrossRef]
- Chiesa, L.M.; Nobile, M.; Panseri, S.; Arioli, F. Antibiotic Use in Heavy Pigs: Comparison Between Urine and Muscle Samples from Food Chain Animals Analysed by HPLC-MS/MS. Food Chem. 2017, 235, 111–118. [Google Scholar] [CrossRef]
- Qian, M.; Zhou, D.; Wang, Q.; Gao, J.; Li, D.; Li, Y.; Yang, B. A Reliable, Simple and Cost-Efficient TLC-HPLC Method for Simultaneously Determining Florfenicol and Florfenicol Amine in Porcine Urine: Application to Residue Surveillance. Food Addit. Contam. A 2019, 36, 1218–1227. [Google Scholar] [CrossRef] [PubMed]
- Taskin, I.; Gungor, O.; Duran, S.T. Voltammetric Determination of Florfenicol by Using Poly(3-methylthiophene) Modified Glassy Carbon Electrode. Polym. Bull. 2021, 78, 4721–4741. [Google Scholar] [CrossRef]
- Tao, X.; Yu, X.; Zhang, D.; Shi, W.; Jiang, H.; Wang, X.; Wang, Z.; Niu, L.; Wu, X.; Xia, X.; et al. Development of a Rapid Chemiluminescent ciELISA for Simultaneous Determination of Florfenicol and its Metabolite Florfenicol Amine in Animal Meat Products. J. Sci. Food Agric. 2014, 94, 301–307. [Google Scholar] [CrossRef] [PubMed]
- Castaneda, P.S.; Olvera, L.G.; Bernad, M.J.B.; Lopez, H.S.; Escobar-Chavez, J.J. Development of a Spectrophotometric Method for the Determination of Florfenicol in Eudragit Nanocapsules. Pharm. Chem. J. 2021, 54, 1181–1185. [Google Scholar] [CrossRef]
- Bastidas, C.Y.; von Plessing, C.; Troncoso, J.; Sanhueza, M.I.; Neira, J.Y.; del P. Castillo, R. Analytical Strategies Based on Near Infrared Spectroscopy and Multivariate Calibration for Rapid Quantification of Florfenicol at Low-Concentrations in Medicated-feed Pellets. Microchem. J. 2019, 147, 1068–1074. [Google Scholar] [CrossRef]
- Aboul-Enein, H.Y.; Wagdy, H.A.; Bowser, J.E. Stability Indicating Assay of Florfenicol using Capillary Zone Electrophoresis in Veterinary Formulation and in Milk. Anal. Chem. Lett. 2019, 9, 143–151. [Google Scholar] [CrossRef]
- Zhou, D.; Li, Y.; Huang, L.; Qian, M.; Li, D.; Sun, G.; Yang, B. A Reliable and Cost-efficient TLC-HPLC Method for Determining Total Florfenicol Residues in Porcine Edible Tissues. Food Chem. 2020, 303, 125399. [Google Scholar] [CrossRef] [PubMed]
- Shen, J.; Xia, X.; Jiang, H.; Li, C.; Li, J.; Li, X.; Ding, S. Determination of Chloramphenicol, Thiamphenicol, Florfenicol, and Florfenicol Amine in Poultry and Porcine Muscle and Liver by Gas Chromatography-negative Chemical Ionization Mass Spectrometry. J. Chromatogr. B 2009, 877, 1523–1529. [Google Scholar] [CrossRef] [PubMed]
- Lei, Z.; Liu, Q.; Khaliq, H.; Cao, J.; He, Q. Resistant Cutoff Values and Optimal Scheme Establishments for Florfenicol Against Escherichia coli with PK-PD Modeling Analysis in Pigs. J. Vet. Pharmacol. Ther. 2019, 42, 324–335. [Google Scholar] [CrossRef]
- Wang, G.; Wang, B.; Zhao, X.; Xie, X.; Xie, K.; Wang, X.; Zhang, G.; Zhang, T.; Liu, X.; Dai, G. Determination of Thiamphenicol, Florfenicol and Florfenicol Amine Residues in Poultry Meat and Pork via ASE-UPLC-FLD. J. Food Compos. Anal. 2019, 81, 19–27. [Google Scholar] [CrossRef]
- Rairat, T.; Kumphaphat, S.; Chuchird, N.; Srisapoome, P.; Phansawat, P.; Keetanon, A.; Liu, Y.-K.; Chou, C.-C. Pharmacokinetics, Optimal Dosages and Withdrawal Time of Florfenicol in Asian Seabass (Lates calcarifer) after Oral Administration via Medicated Feed. J. Fish Dis. 2022, 46, 75–84. [Google Scholar] [CrossRef] [PubMed]
- Guo, Y.; Hong, L.; Gao, P.; Liu, S.; Zhu, Y.; Xie, X.; Zhang, G.; Xie, K. Development of a QuEChERS–HPLC–FLD Procedure for the Simultaneous Detection of Residues of Florfenicol, Its Metabolite Florfenicol Amine, and Three Fluoroquinolones in Eggs. Molecules 2024, 29, 252. [Google Scholar] [CrossRef] [PubMed]
- Šandor, K.; Andrišić, M.; Žarković, I.; Perak Junaković, E.; Vujnović, A.; Terzić, S. Development of an SPE-HPLC-DAD Method for the Experimental Study of Florfenicol and Florfenicol Amine in Pig Cerebrospinal Fluid. Vet. Stn. 2020, 51, 129–138. [Google Scholar] [CrossRef]
- Šandor, K.; Perak Junaković, E.; Andrišić, M.; Žarković, I.; Benić, M.; Mihaljević, Ž.; Terzić, S. Analysis of Florfenicol in Pig Plasma Using a Validated PPT-HPLC-DAD method. Vet. Stn. 2023, 54, 265–277. [Google Scholar] [CrossRef]
- Gavilan, R.E.; Nebot, C.; Patyra, E.; Vazquez, B.; Miranda, J.M.; Cepeda, A. Determination of Florfenicol, Thiamfenicol and Chloramfenicol at Trace Levels in Animal Feed by HPLC-MS/MS. Antibiotics 2019, 8, 59. [Google Scholar] [CrossRef] [PubMed]
- Shiroma, L.S.; Queiroz, S.C.N.; Jonsson, C.M.; Bottoli, C.B.G. Extraction Strategies for Simultaneous Determination of Florfenicol and Florfenicol Amine in Tilapia (Oreochromis niloticus) Muscle: Quantification by LC-MS/MS. Food Anal. Methods 2020, 13, 291–302. [Google Scholar] [CrossRef]
- Zheng, Y.; Fan, L.; Zhao, L.; Dong, Y.; Jiao, Y.; Xue, X.; Yang, F.; Yuan, X.; Wang, L.; Zhao, S. Development and Validation of a Method for Quantification of Residual Florfenicol in Various Tissues of Broiler Chicken by UPLC-MS/MS. J. Food Meas. Charact. 2021, 15, 3143–3152. [Google Scholar] [CrossRef]
- Somogyi, Z.; Mag, P.; Kovacs, D.; Kerek, A.; Szabo, P.; Makrai, L.; Jerzsele, A. Synovial and Systemic Pharmacokinetics of Florfenicol and PK/PD integration Against Streptococcus suis in Pigs. Pharmaceutics 2022, 14, 109. [Google Scholar] [CrossRef]
- Azzouz, A.; Ballesteros, E. Gas Chromatography–mass spectrometry Determination of Pharmacologically Active Substances in Urine and Blood Samples by Use of a Continuous Solid-phase Extraction System and Microwave-assisted Derivatization. J. Chromatogr. B 2012, 891–892, 12–19. [Google Scholar] [CrossRef]
- Alina, Z.; Noreen, S.; Abbas, R.; Kousar, S.; Riaz, L.; Naeem, H.; Naseer, F. Therapeutic Effects of Albendazole on Kidney Functions and Urinary Excretion of Florfenicol in Goats. J. Biomedical. Sci. 2016, 6, 1. [Google Scholar] [CrossRef]
- Li, R.; Lin, Z.-J.; Yang, J.-Y.; Xu, Z.-L.; Wang, H.; Lei, H.-T.; Sun, Y.-M.; Shen, Y.-D. An Indirect Competitive Enzyme-Linked Immunosorbent Assay for Simultaneous Determination of Florfenicol and Thiamphenicol in Animal Meat and Urine. Chin. J. Anal. Chem. 2018, 46, 1321–1328. [Google Scholar] [CrossRef]
- Liu, S.; Guo, Y.; Qu, H.; Dong, Y.; Zhao, S.; Fu, T.; Kang, R.; Cheng, J.; Huang, S.; Zhao, L.; et al. Pharmacokinetics of Florfenicol and Its Metabolite Florfenicol Amine in the Plasma, Urine, and Feces of Fattening Male Donkeys Following Single Oral Administration. Front. Vet. Sci. 2024, 10, 1314029. [Google Scholar] [CrossRef]
- Keith, L.H.; Gron, L.U.; Young, J.L. Green Analytical Methodologies. Chem. Rev. 2007, 107, 2695–2708. [Google Scholar] [CrossRef] [PubMed]
- Armenta, S.; Garrigues, S.; de la Guardia, M. Green Analytical Chemistry. TrAC Trend. Anal. Chem. 2008, 27, 497–511. [Google Scholar] [CrossRef]
- Galuszka, A.; Konieczka, P.; Migaszewski, Z.M.; Namiesnik, J. Analytical Eco-Scale for Assessing the Greenness of Analytical Procedures. Trend Anal. Chem. 2012, 37, 61–72. [Google Scholar] [CrossRef]
- Plotka-Wasylka, J. A New Tool for the Evaluation of the Analytical Procedure: Green Analytical Procedure Index. Talanta 2018, 181, 204–209. [Google Scholar] [CrossRef]
- Pena-Pereira, F.; Wojnowski, W.; Tobiszewski, M. AGREE-Analytical Greenness Metric Approach and Software. Anal. Chem. 2020, 92, 10076–10082. [Google Scholar] [CrossRef] [PubMed]
- Capello, C.; Fischer, U.; Hungerbühlera, K. What is a Green Solvent? A Comprehensive Framework for the Environmental Assessment of Solvents. Green Chem. 2007, 9, 927–934. [Google Scholar] [CrossRef]
- McConvey, I.F.; Woods, D.; Lewis, M.; Gan, Q.; Nancarrow, P. The Importance of Acetonitrile in the Pharmaceutical Industry and Opportunities for its Recovery from Waste. Org. Process Res. Dev. 2012, 16, 612–624. [Google Scholar] [CrossRef]
- Byrne, F.P.; Jin, S.; Paggiola, G.; Petchey, T.H.M.; Clark, J.H.; Farmer, T.J.; Hunt, A.J.; McElroy, C.R.; Sherwood, J. Tools and Techniques for Solvent Selection: Green Solvent Selection Guides. Sustain. Chem. Process 2016, 4, 7. [Google Scholar] [CrossRef]
- Wang, Y.; Mei, X.; Ma, T.; Xue, C.; Wu, M.; Ji, M.; Li, Y. Green Recovery of Hazardous Acetonitrile from High-salt Chemical Wastewater by Pervaporation. J. Clean. Prod. 2018, 197, 742–749. [Google Scholar] [CrossRef]
- Plotka-Wasylka, J.; Wojnowski, W. Complementary Green Analytical Procedure Index (ComplexGAPI) and Software. Green Chem. 2021, 23, 8657–8665. [Google Scholar] [CrossRef]
- Wojnowski, W.; Tobiszewski, M.; Pena-Pereira, F.; Psillakis, E. AGREEprep—Analytical greenness metric for sample preparation. TrAC Trend. Anal. Chem. 2022, 149, 116553. [Google Scholar] [CrossRef]
- Pastor-Belda, M.; Campillo, N.; Arroyo-Manzanares, N.; Hernández-Córdoba, M.; Viñas, P. Determination of Amphenicol Antibiotics and Their Glucuronide Metabolites in Urine Samples Using Liquid Chromatography with Quadrupole Time-Of-Flight Mass Spectrometry. J. Chromatogr. B 2020, 1146, 122122. [Google Scholar] [CrossRef] [PubMed]
- Manousi, N.; Wojnowski, W.; Płotka-Wasylka, J.; Samanidou, V. Blue Applicability Grade Index (BAGI) and Software: A New Tool for the Evaluation of Method Practicality. Green Chem. 2023, 25, 7598–7604. [Google Scholar] [CrossRef]
- Wang, H.; Wang, N.; Wang, B.; Zhao, Q.; Fang, H.; Fu, C.; Tang, C.; Jiang, F.; Zhou, Y.; Chen, Y.; et al. Antibiotics in Drinking Water in Shanghai and Their Contribution to Antibiotic Exposure of School Children. Environ. Sci. Technol. 2016, 50, 2692–2699. [Google Scholar] [CrossRef] [PubMed]
- Osman, K.; Zolnikov, T.R.; Badr, J.; Naim, H.; Hanafy, M.; Saad, A.; Elbehiry, A. Vancomycin and Florfenicol Resistant Enterococcus Faecalis and Enterococcus Faecium Isolated from Human Urine in an Egyptian Urban-Rural Community. Acta Trop. 2020, 201, 105209. [Google Scholar] [CrossRef] [PubMed]
- Zhou, Y.-J.; Zhu, F.; Zheng, D.-Y.; Gao, M.-M.; Guo, B.-F.; Zhang, N.; Meng, Y.; Wu, G.-L.; Zhou, Y.-L.; Huo, X. Detection of Antibiotics in the Urine of Children and Pregnant Women in Jiangsu, China. Environ. Res. 2021, 196, 110945. [Google Scholar] [CrossRef]
- Li, J.; Wang, B.; Liu, S.; Zhang, Y.; Chen, C.; Jin, Y.; Shen, Z.; Yuan, T.; Yu, X. Antibiotic Exposure and Risk of Overweight/Obesity in School Children: A Multicenter, Case-Control Study from China. Ecotoxicol. Environ. Saf. 2022, 240, 113702. [Google Scholar] [CrossRef]
- Committee for Medicinal Products for Human Use. Guideline on Bioanalytical Method Validation. EMEA/CHMP/EWP/192217/2009 Rev. 1 Corr. 2; European Medicines Agency: London, UK, 2011; pp. 1–23. Available online: https://www.ema.europa.eu/en/bioanalytical-method-validation-scientific-guideline (accessed on 1 March 2024).
- United States Environmental Protection Agency. Defining Hazardous Waste: Listed, Characteristic and Mixed Radiological Wastes. Available online: https://www.epa.gov/hw/defining-hazardous-waste-listed-characteristic-and-mixed-radiological-wastes (accessed on 1 March 2024).
- National Environmental Methods Index. Available online: https://www.nemi.gov/home (accessed on 1 March 2024).
- National Fire Protection Association. List of NFPA Codes and Standards. Available online: https://www.nfpa.org/Codes-and-Standards/All-Codes-and-Standards/List-of-Codes-and-Standards (accessed on 1 March 2024).


| Parameters | Standard Solution | Urine Solution |
|---|---|---|
| Range (µg/mL) | 0.05–20.0 | 0.05–20.0 |
| Correlation coefficient, R2 | 0.998 | 0.997 |
| Regression, p-value | <0.05 | <0.05 |
| Limit of detection (µg/mL) | 0.001 | 0.005 |
| Limit of quantification (µg/mL) | 0.004 | 0.016 |
| Intra-day precision (%RSD, n = 6) | 0.48 | 0.32 |
| Inter-day precision (%RSDpooled, n = 18, 3 days) | 0.55 | 1.12 |
| Accuracy at a nominal concentration of: * | ||
| 2% | 101.32 ± 1.16 | 102.53 ± 2.24 |
| 100% | 99.75 ± 0.20 | 99.41 ± 1.71 |
| 200% | 100.95 ± 0.16 | 100.36 ± 1.73 |
| Pre-extraction spiked urine (recovery% ± %RSD, n = 6): | ||
| FF at 1.0 µg/mL | 98.48 ± 1.17 | |
| CAP at 1.0 µg/mL | 101.77 ± 1.84 | |
| FF at 10.0 µg/mL | 101.93 ± 2.49 | |
| CAP at 10.0 µg/mL | 98.78 ± 0.83 | |
| Post-extraction spiked urine (ME% ± SD, n = 6): | ||
| FF at 1.0 µg/mL | 1.03 ± 0.35 | |
| CAP at 1.0 µg/mL | 1.88 ± 1.28 | |
| FF at 10.0 µg/mL | 2.27 ± 0.51 | |
| CAP at 10.0 µg/mL | 2.10 ± 1.96 | |
| Stability after 24 h at 5 ± 3 °C ** | >0.05 | >0.05 |
| Stability after 168 h at 5 ± 3 °C ** | >0.05 | <0.05 |
| Stability after 24 h at −20 ± 5 °C ** | >0.05 | >0.05 |
| Stability after 168 h at −20 ± 5 °C ** | >0.05 | >0.05 |
| Steps | NEMI | AES | GAPI | AGREE |
|---|---|---|---|---|
| Sample treatment | Collection (1): offline | Sample procedure (1): offline Sample amount (2): 0.5 mL Device positioning (3): off line Preparation stages (4): 3 Automatization (5): semi- automatic; miniaturized | ||
| Preservation (2): none | ||||
| Transport (3): required | ||||
| Storage (4): at −20 °C | ||||
| Type of method (5): simple | ||||
| Scale of extraction (6): - * | ||||
| Solvents/reagents used (7): non-green | ||||
| Additional treatments (8): filtration | ||||
| Reagents and solvents | Chloramphenicol: 3 | Amount (9): <10 mL Health hazard (10): NFPAscore ** 2 or 3 Safety hazard (11): NFPAscore ** 2 or 3 | Derivatization (6): none Source of regents (10): 2 bio-based Toxicity (11): 8.2 mL | |
| Methanol: 3 | ||||
| Acetonitrile: 4 | ||||
| Phosphoric acid: 2 | ||||
| Instruments | Transport: 1 | Energy (12): | Waste (7): 42.1 mL Analysis per hour (8): 2 analytes/h Energy consumption (9): LC Operator’s safety (12): highly flammable | |
| Storage: 2 | <0.1 kWh/sample: pH-meter | |||
| pH-meter: 0 | ≤1.5 kWh/sample: | |||
| Centrifuge: 1 | Centrifuge | |||
| Vortex: 1 | Vortex | |||
| Sonicator: 1 | Sonicator | |||
| HPLC-DAD: 1 | HPLC-DAD | |||
| Occupational hazard: 0 | Occupational hazard (13): hermetic | |||
| Waste: 6 | Waste (14): ≥42 mL | |||
| ∑ total PP ***: 25 | Waste treatment (15): recycling **** | |||
| Pictogram and/or score |  | 75 |  | 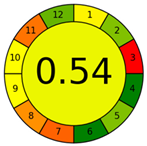 |
| Sample | Reference | Treatments and Analytical Conditions | Assessment | ||
|---|---|---|---|---|---|
| NEMI | GAPI * | AGREE | |||
| calve urine | [1] | Vsample: 1 mL of diluted urine; internal standard: thiamphenicol; LLE with ethyl acetate; centrifuged; evaporated; dissolved; sonicated; vortexed; HPLC-UV: C-18 (250 × 4.6 mm ID, 5 μm); 223 nm; 1.2 mL/min; acetonitrile/water (40:60, v/v); 20 µL |  |  |  |
| pig urine | [11] | Vsample: 5 mL; internal standard: enrofloxacin d5; centrifuged; SPE (methanol, water; 0.5 M hydrochloric acid); evaporated; dissolved; vortexed; HPLC-MS/MS: C-18 (150 × 2.0 mm ID, 4 μm); 0.2 mL/min; A (0.1% aqueous formic acid) and B (methanol), gradient elution; 10 µL; run: 30 min |  |  |  |
| pig urine | [12] | Vsample: 2 mL; LLE with ethyl acetate; evaporation at 50 °C; purification of 0.1 mL urine extract; TLC; HPLC-UV; silica gel 60 GF254 glass plates (10 × 20 cm), 254 nm; C18 (250 × 4.6 mm ID, 5 μm), 32 °C; 225 nm; 0.6 mL/min; acetonitrile/phosphate buffer + sodium 1-dodecane-sulfonate + triethylamine (33.3:66.7, v/v); 50 µL |  |  |  |
| cow, pig and lamb urine | [30] | Vsample: 5 mL; internal standard: triphenylphosphate; continuous SPE with ethyl acetate; microwave-assisted derivatization with BSTFA and TMCS **; GC-MS; DB-5 (30 m × 0.25 mm ID, 0.25 μm); carrier: helium, 1 mL/min; injection at 280 °C; split mode; run: 30 min |  | 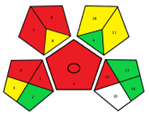 | 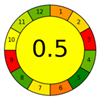 |
| goat urine | [31] | Vsample: 1 mL diluted urine; internal standard: thiamphenicol; LLE with ethyl acetate; centrifuged; evaporated; dissolved; vortexed; sonicated; HPLC-UV: C-18 (75 × 4.6 mm ID, 3.5 μm) at 20 °C; 224 nm; 1.5 mL/min; acetonitrile/water (18:82, v/v); 20 µL |  |  | 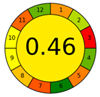 |
| pig and bovine urine | [32] | Synthesis of haptens; purification by gel column chromatography; ID of haptens; coating antigens by active ester method; ID of antigens; preparation and purification of antibodies by precipitation; screening of antibody and coating antigen; centrifugation of urine; LC-MS/MS: HPLC-UV; ultramicro UV spectrometry; 96-well microplates; 450 nm |  | 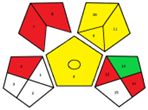 |  |
Disclaimer/Publisher’s Note: The statements, opinions and data contained in all publications are solely those of the individual author(s) and contributor(s) and not of MDPI and/or the editor(s). MDPI and/or the editor(s) disclaim responsibility for any injury to people or property resulting from any ideas, methods, instructions or products referred to in the content. |
© 2024 by the authors. Licensee MDPI, Basel, Switzerland. This article is an open access article distributed under the terms and conditions of the Creative Commons Attribution (CC BY) license (https://creativecommons.org/licenses/by/4.0/).
Share and Cite
Šandor, K.; Perak Junaković, E.; Terzić, S.; Žarković, I.; Vujnović, A.; Fajdić, D.; Pehnec, M.; Sinković, S.; Ćaleta, I.; Andrišić, M. A Green HPLC Approach to Florfenicol Analysis in Pig Urine. Pharmaceuticals 2024, 17, 495. https://doi.org/10.3390/ph17040495
Šandor K, Perak Junaković E, Terzić S, Žarković I, Vujnović A, Fajdić D, Pehnec M, Sinković S, Ćaleta I, Andrišić M. A Green HPLC Approach to Florfenicol Analysis in Pig Urine. Pharmaceuticals. 2024; 17(4):495. https://doi.org/10.3390/ph17040495
Chicago/Turabian StyleŠandor, Ksenija, Eleonora Perak Junaković, Svjetlana Terzić, Irena Žarković, Anja Vujnović, Dominika Fajdić, Mirta Pehnec, Sonja Sinković, Irena Ćaleta, and Miroslav Andrišić. 2024. "A Green HPLC Approach to Florfenicol Analysis in Pig Urine" Pharmaceuticals 17, no. 4: 495. https://doi.org/10.3390/ph17040495
APA StyleŠandor, K., Perak Junaković, E., Terzić, S., Žarković, I., Vujnović, A., Fajdić, D., Pehnec, M., Sinković, S., Ćaleta, I., & Andrišić, M. (2024). A Green HPLC Approach to Florfenicol Analysis in Pig Urine. Pharmaceuticals, 17(4), 495. https://doi.org/10.3390/ph17040495