

Simvastatin-Encapsulated Topical Liposomal Gel for Augmented Wound Healing: Optimization Using the Box-Behnken Model, Evaluations, and In Vivo Studies

 , , , , , , and
Abstract
:
1. Introduction
2. Results and Discussion
2.1. Box-Behnken Design
2.1.1. Polynomial Equations Were Used to Analyze the Responses
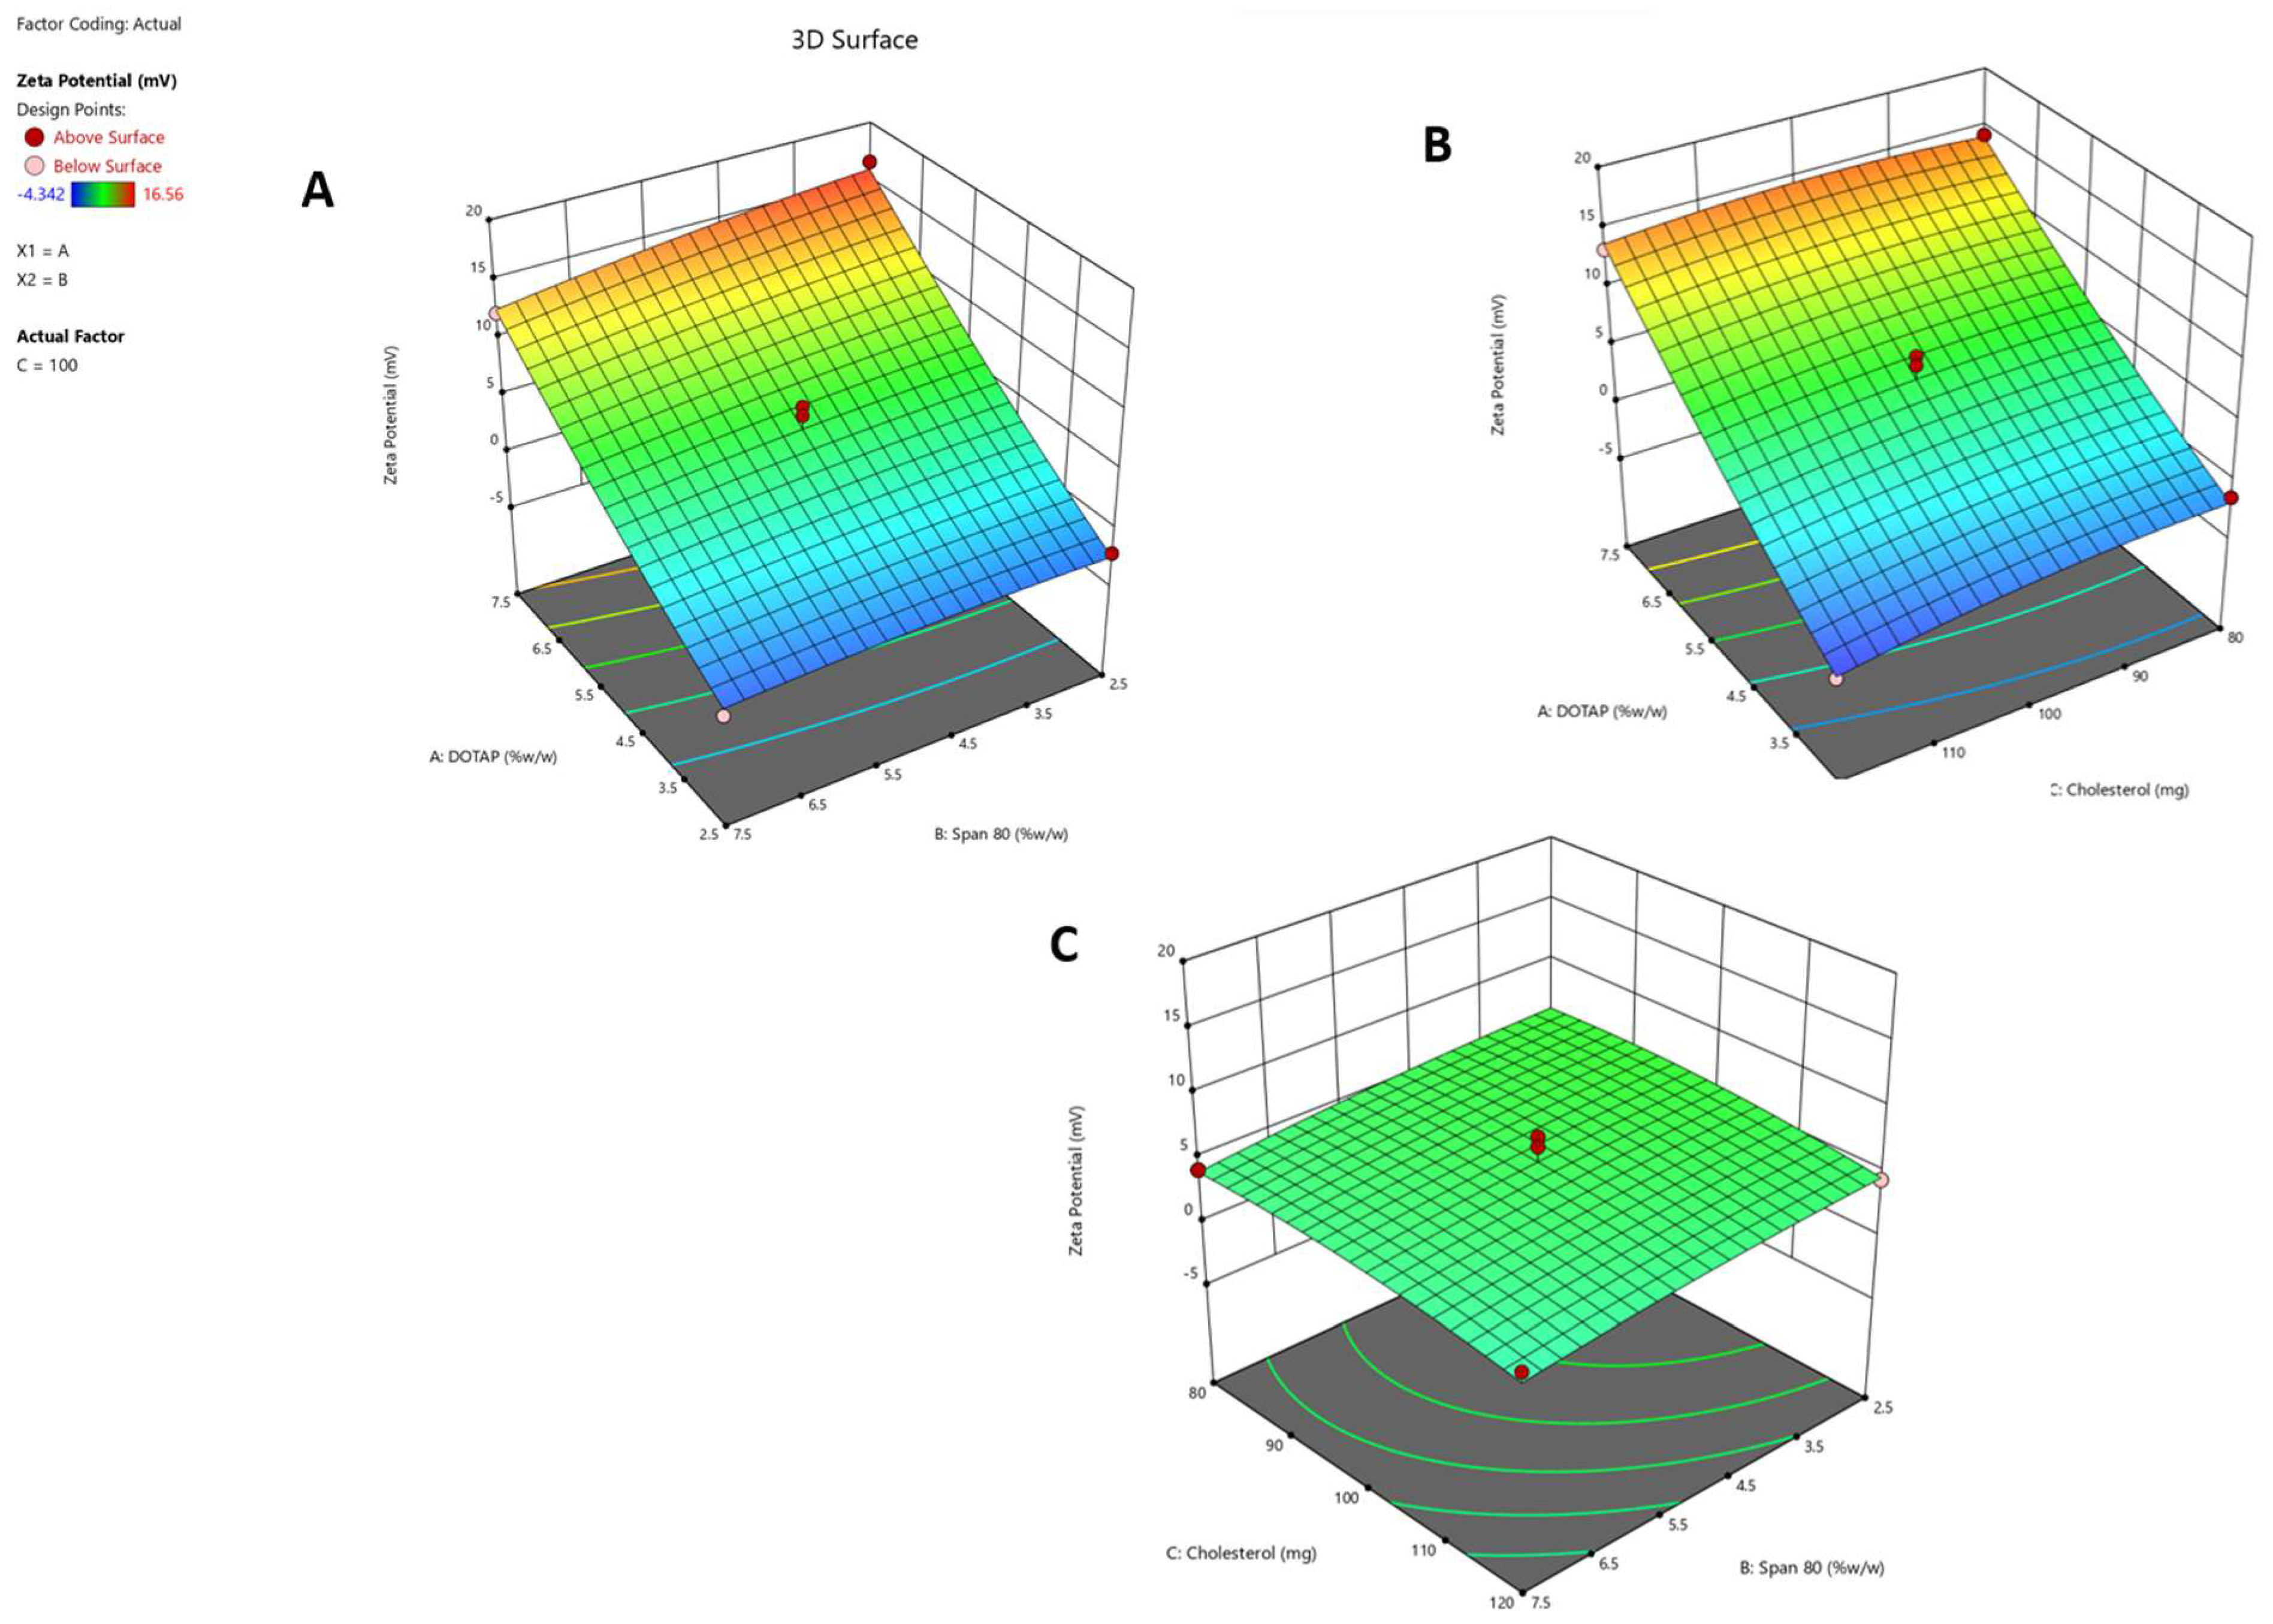
Response 1 (Y1): Impact on Zeta Potential
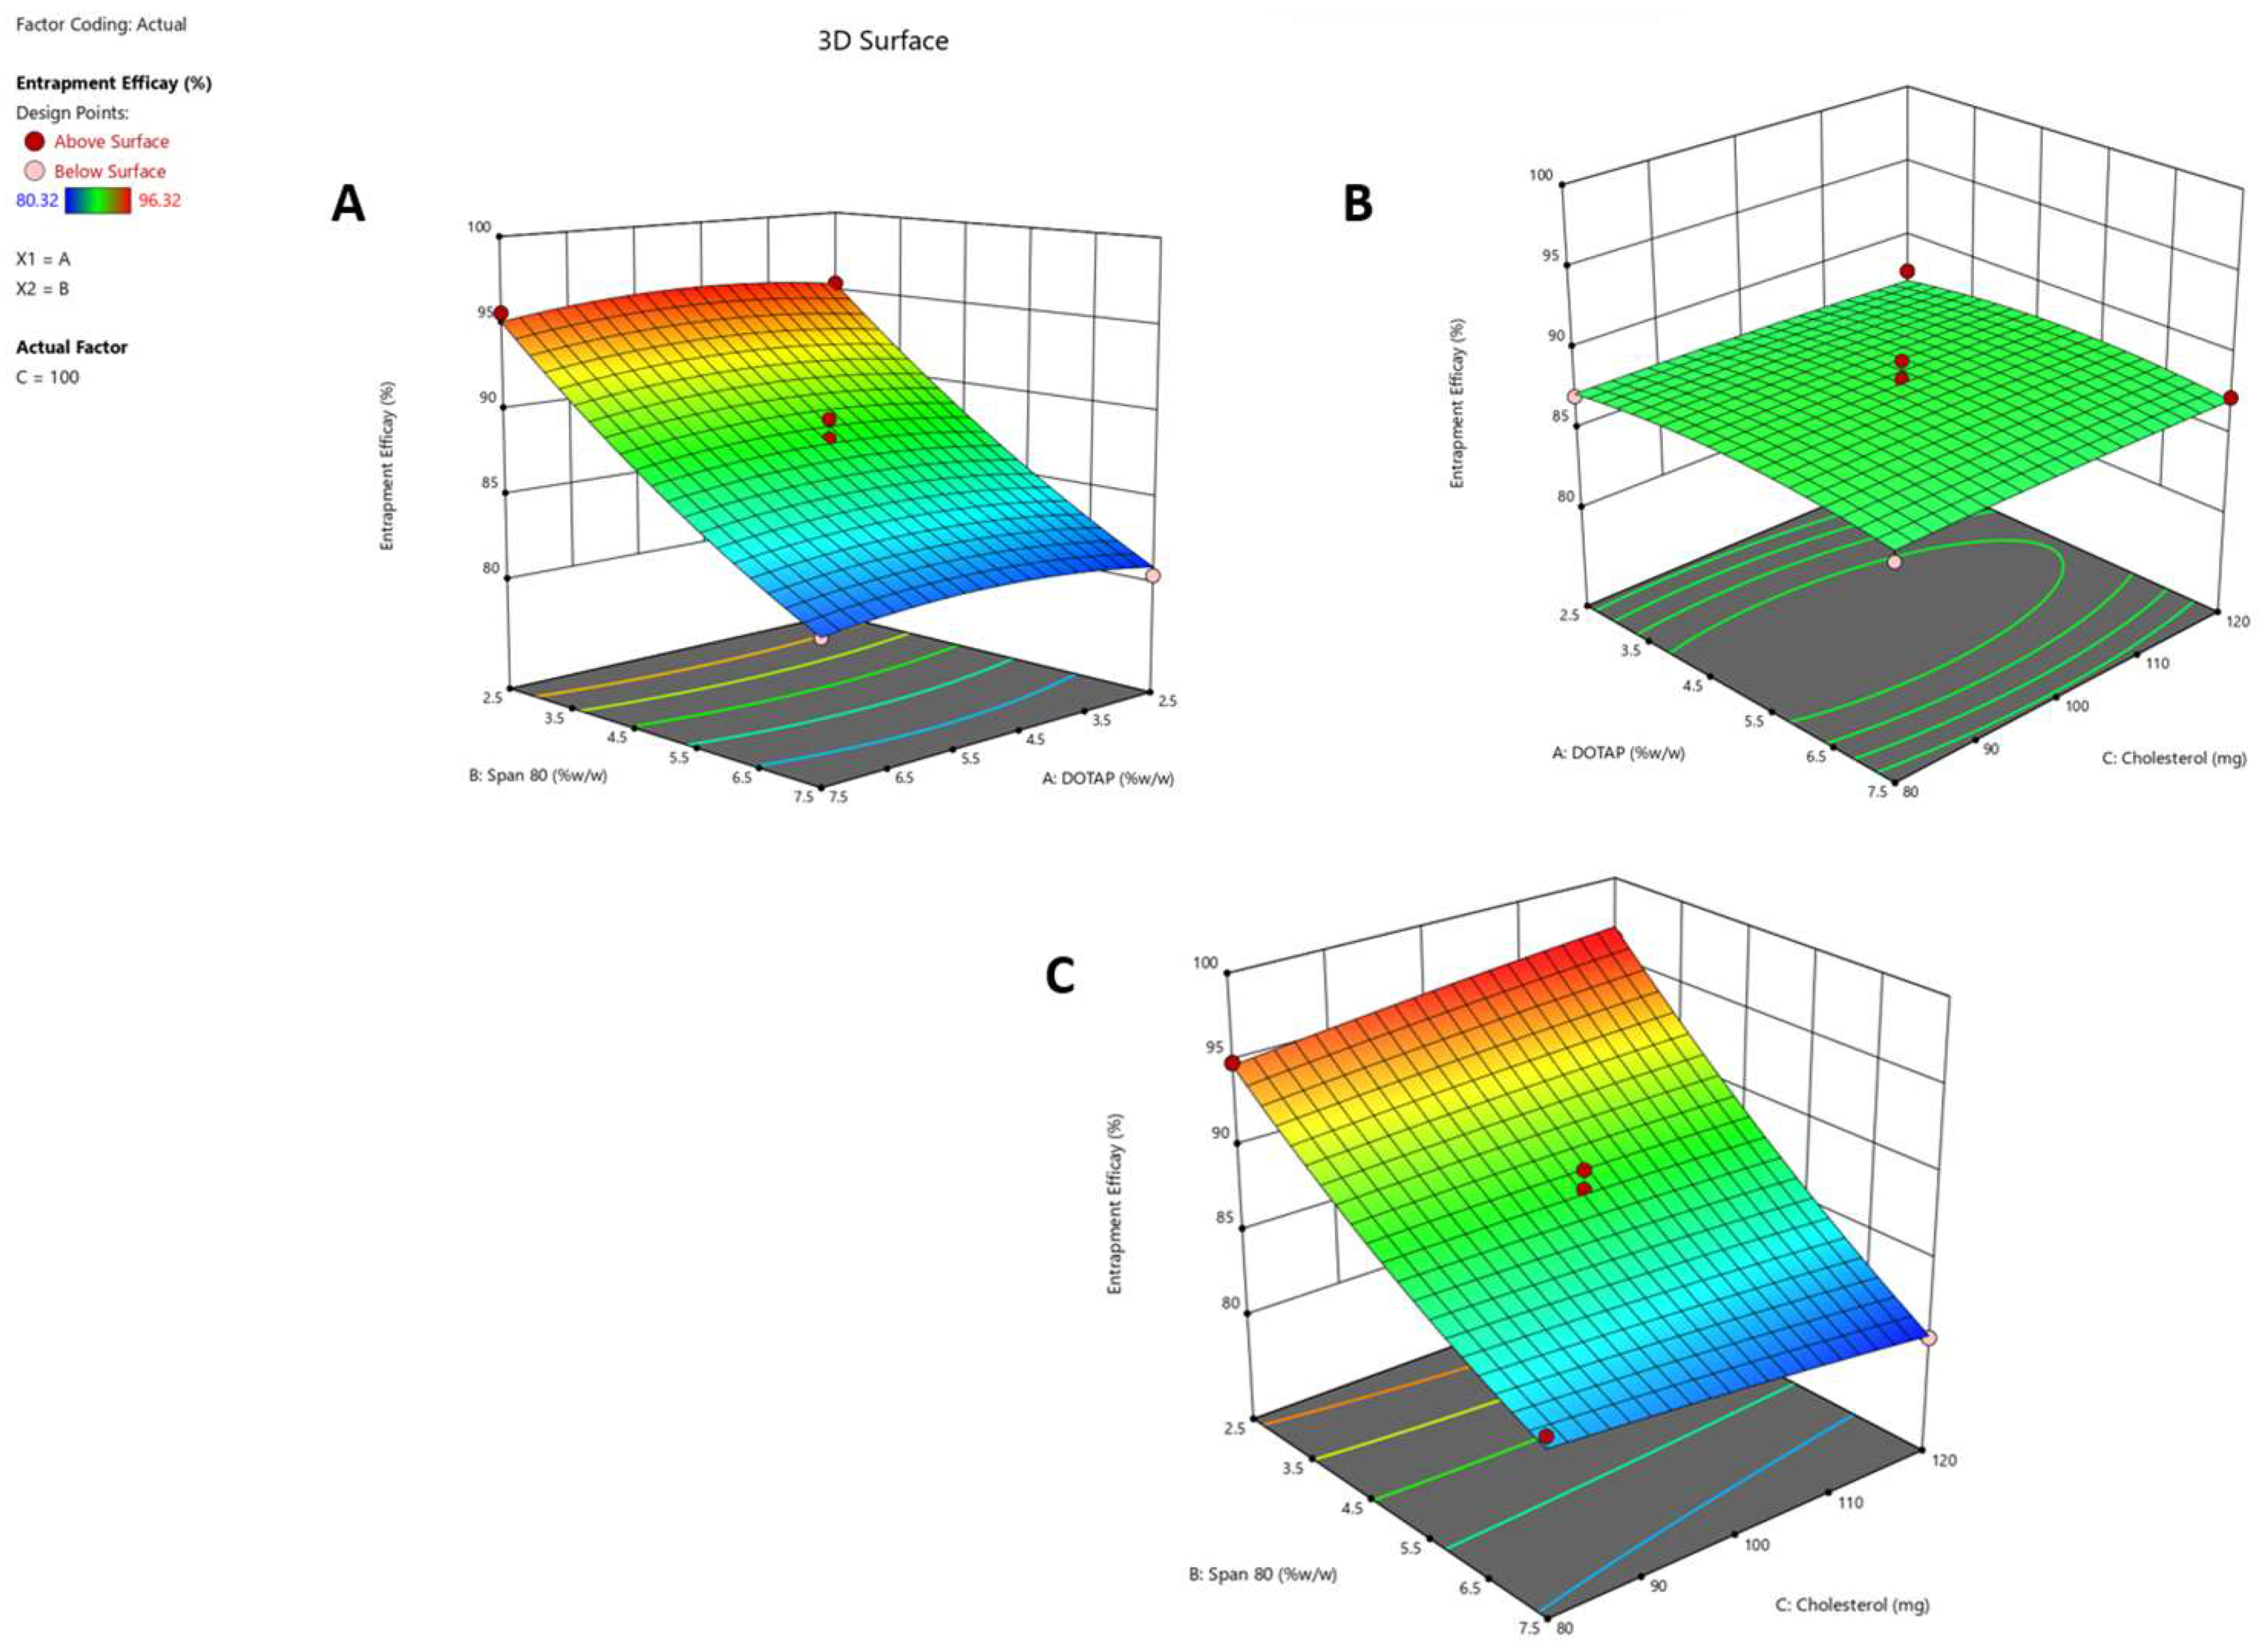
Response 2 (Y2): Effect on Entrapment Efficacy
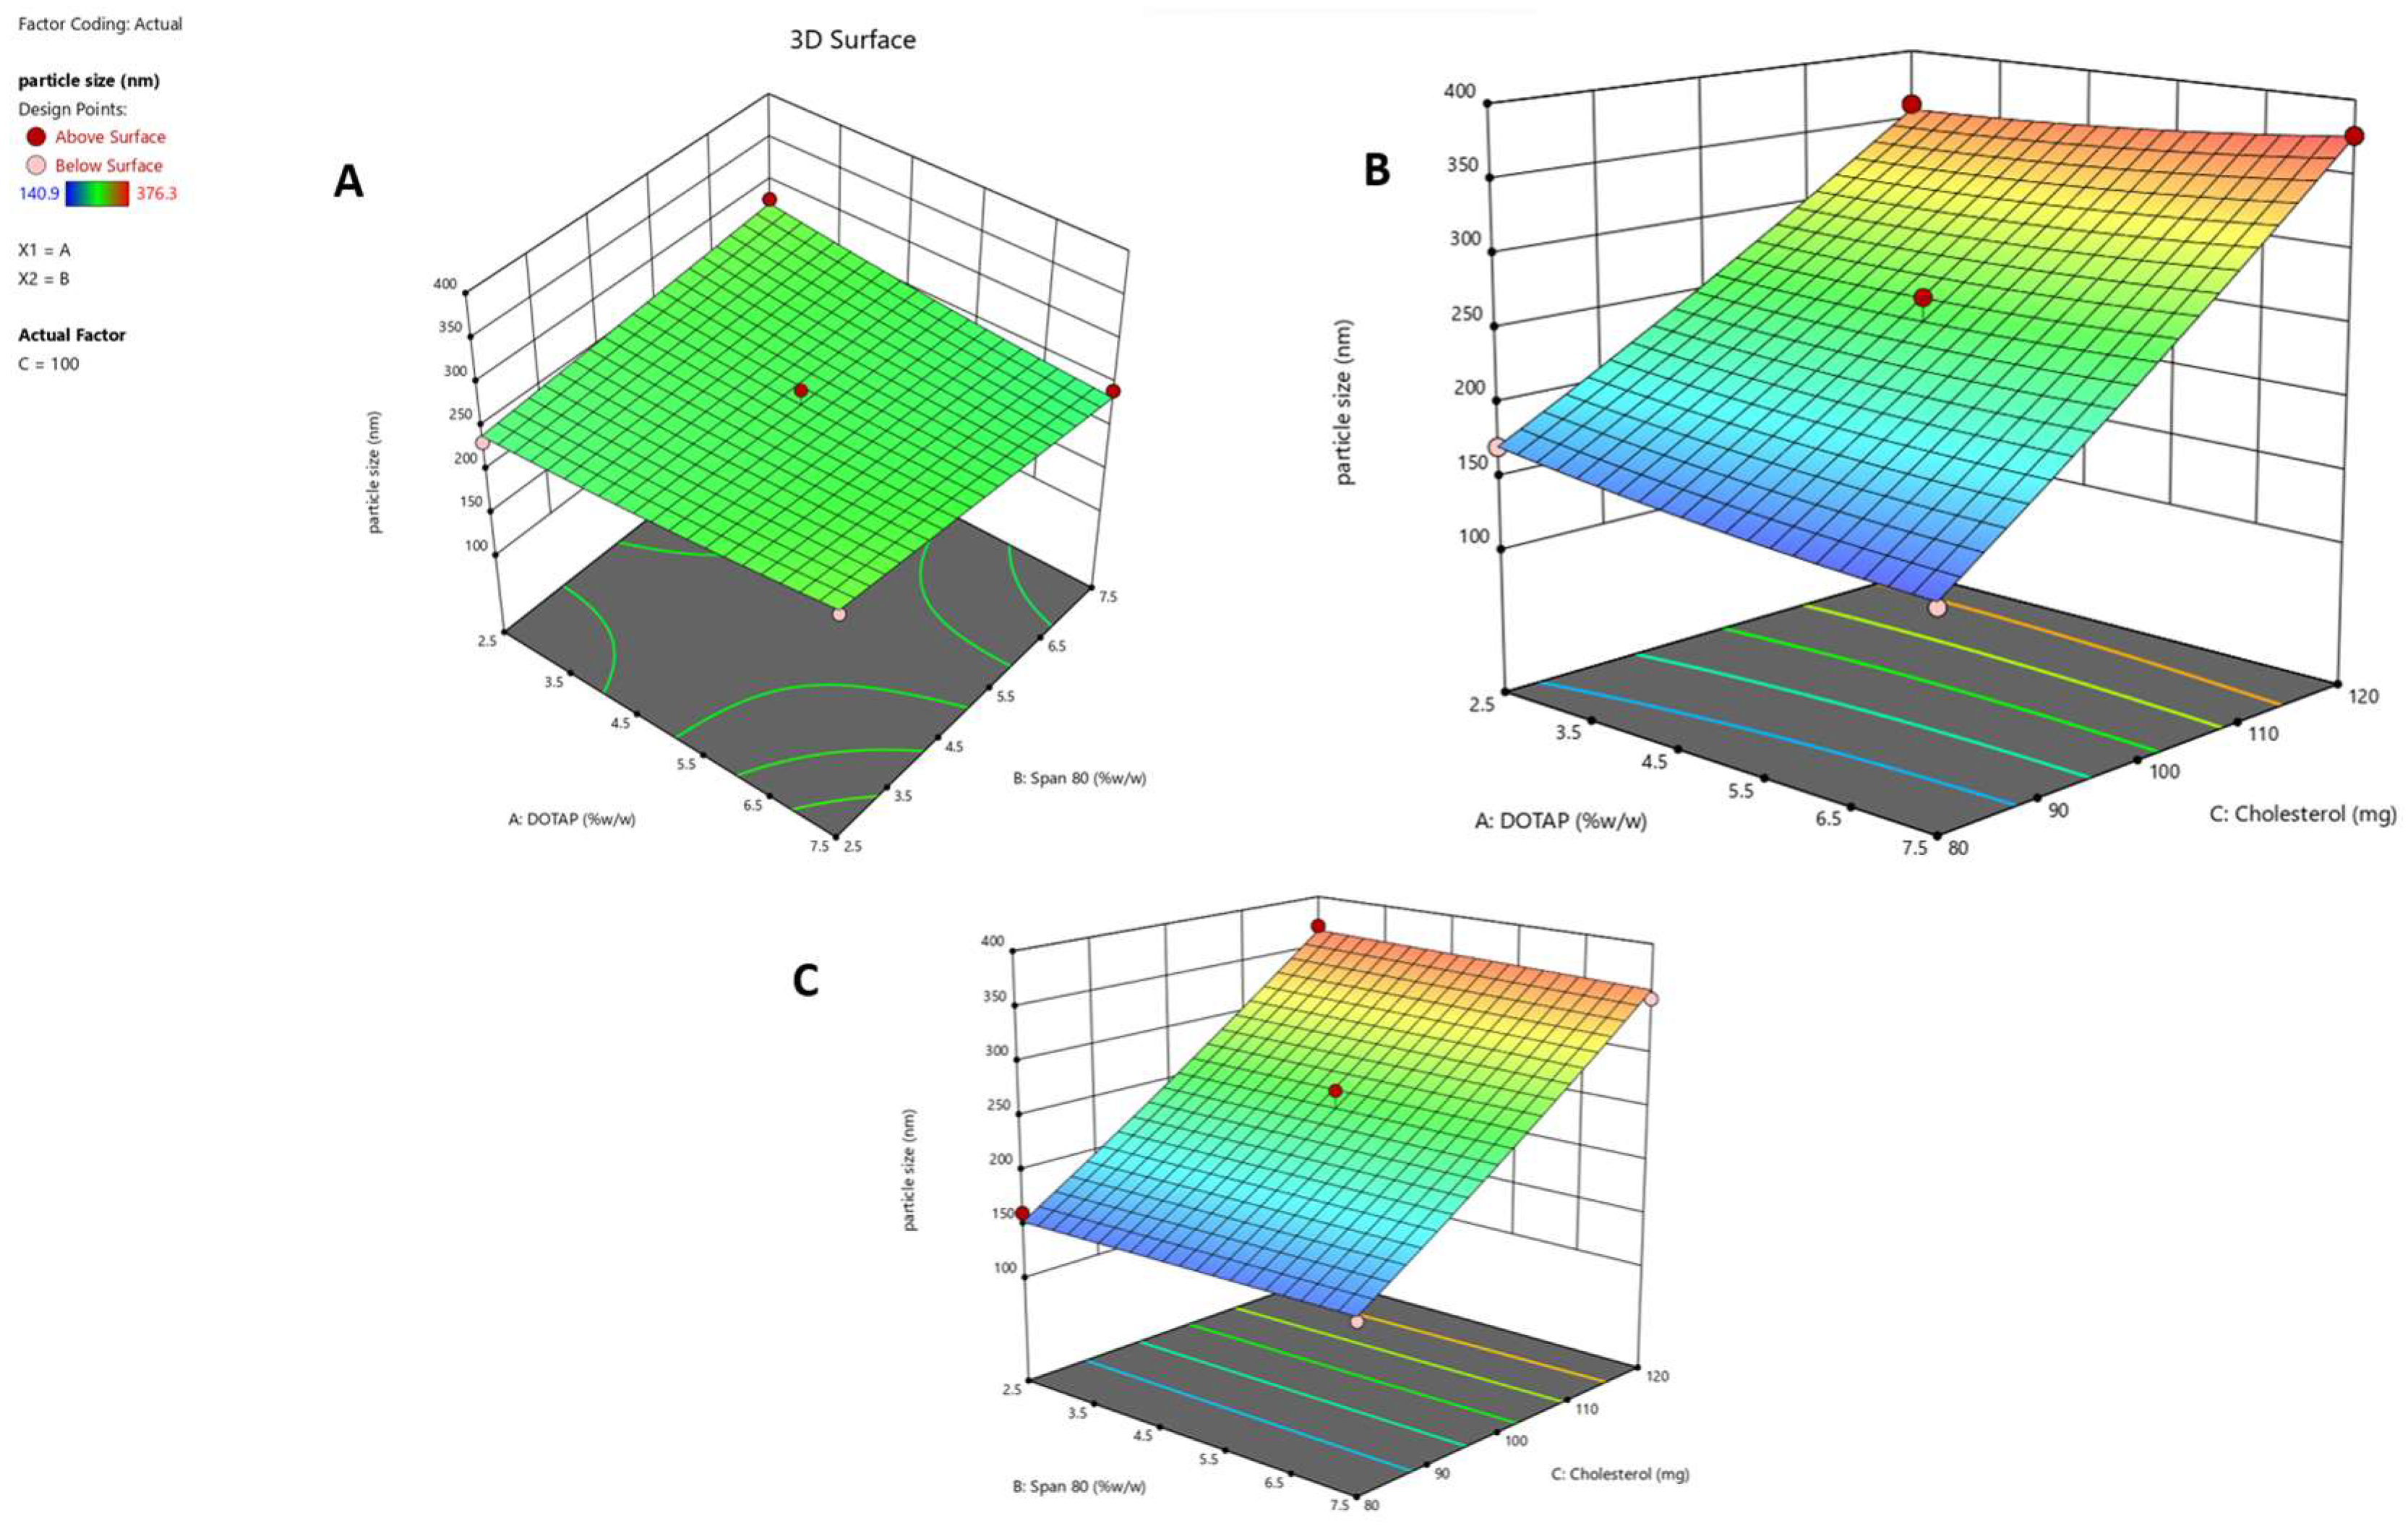
Response 3 (Y3): Effect on Particle Size
2.2. Optimization of Formulation Composition
2.3. Determination of the Entrapment Efficiency (EE%)
2.4. Zeta Potential and Vesicular Size
2.5. Microscopic Analysis by SEM and HR-TEM
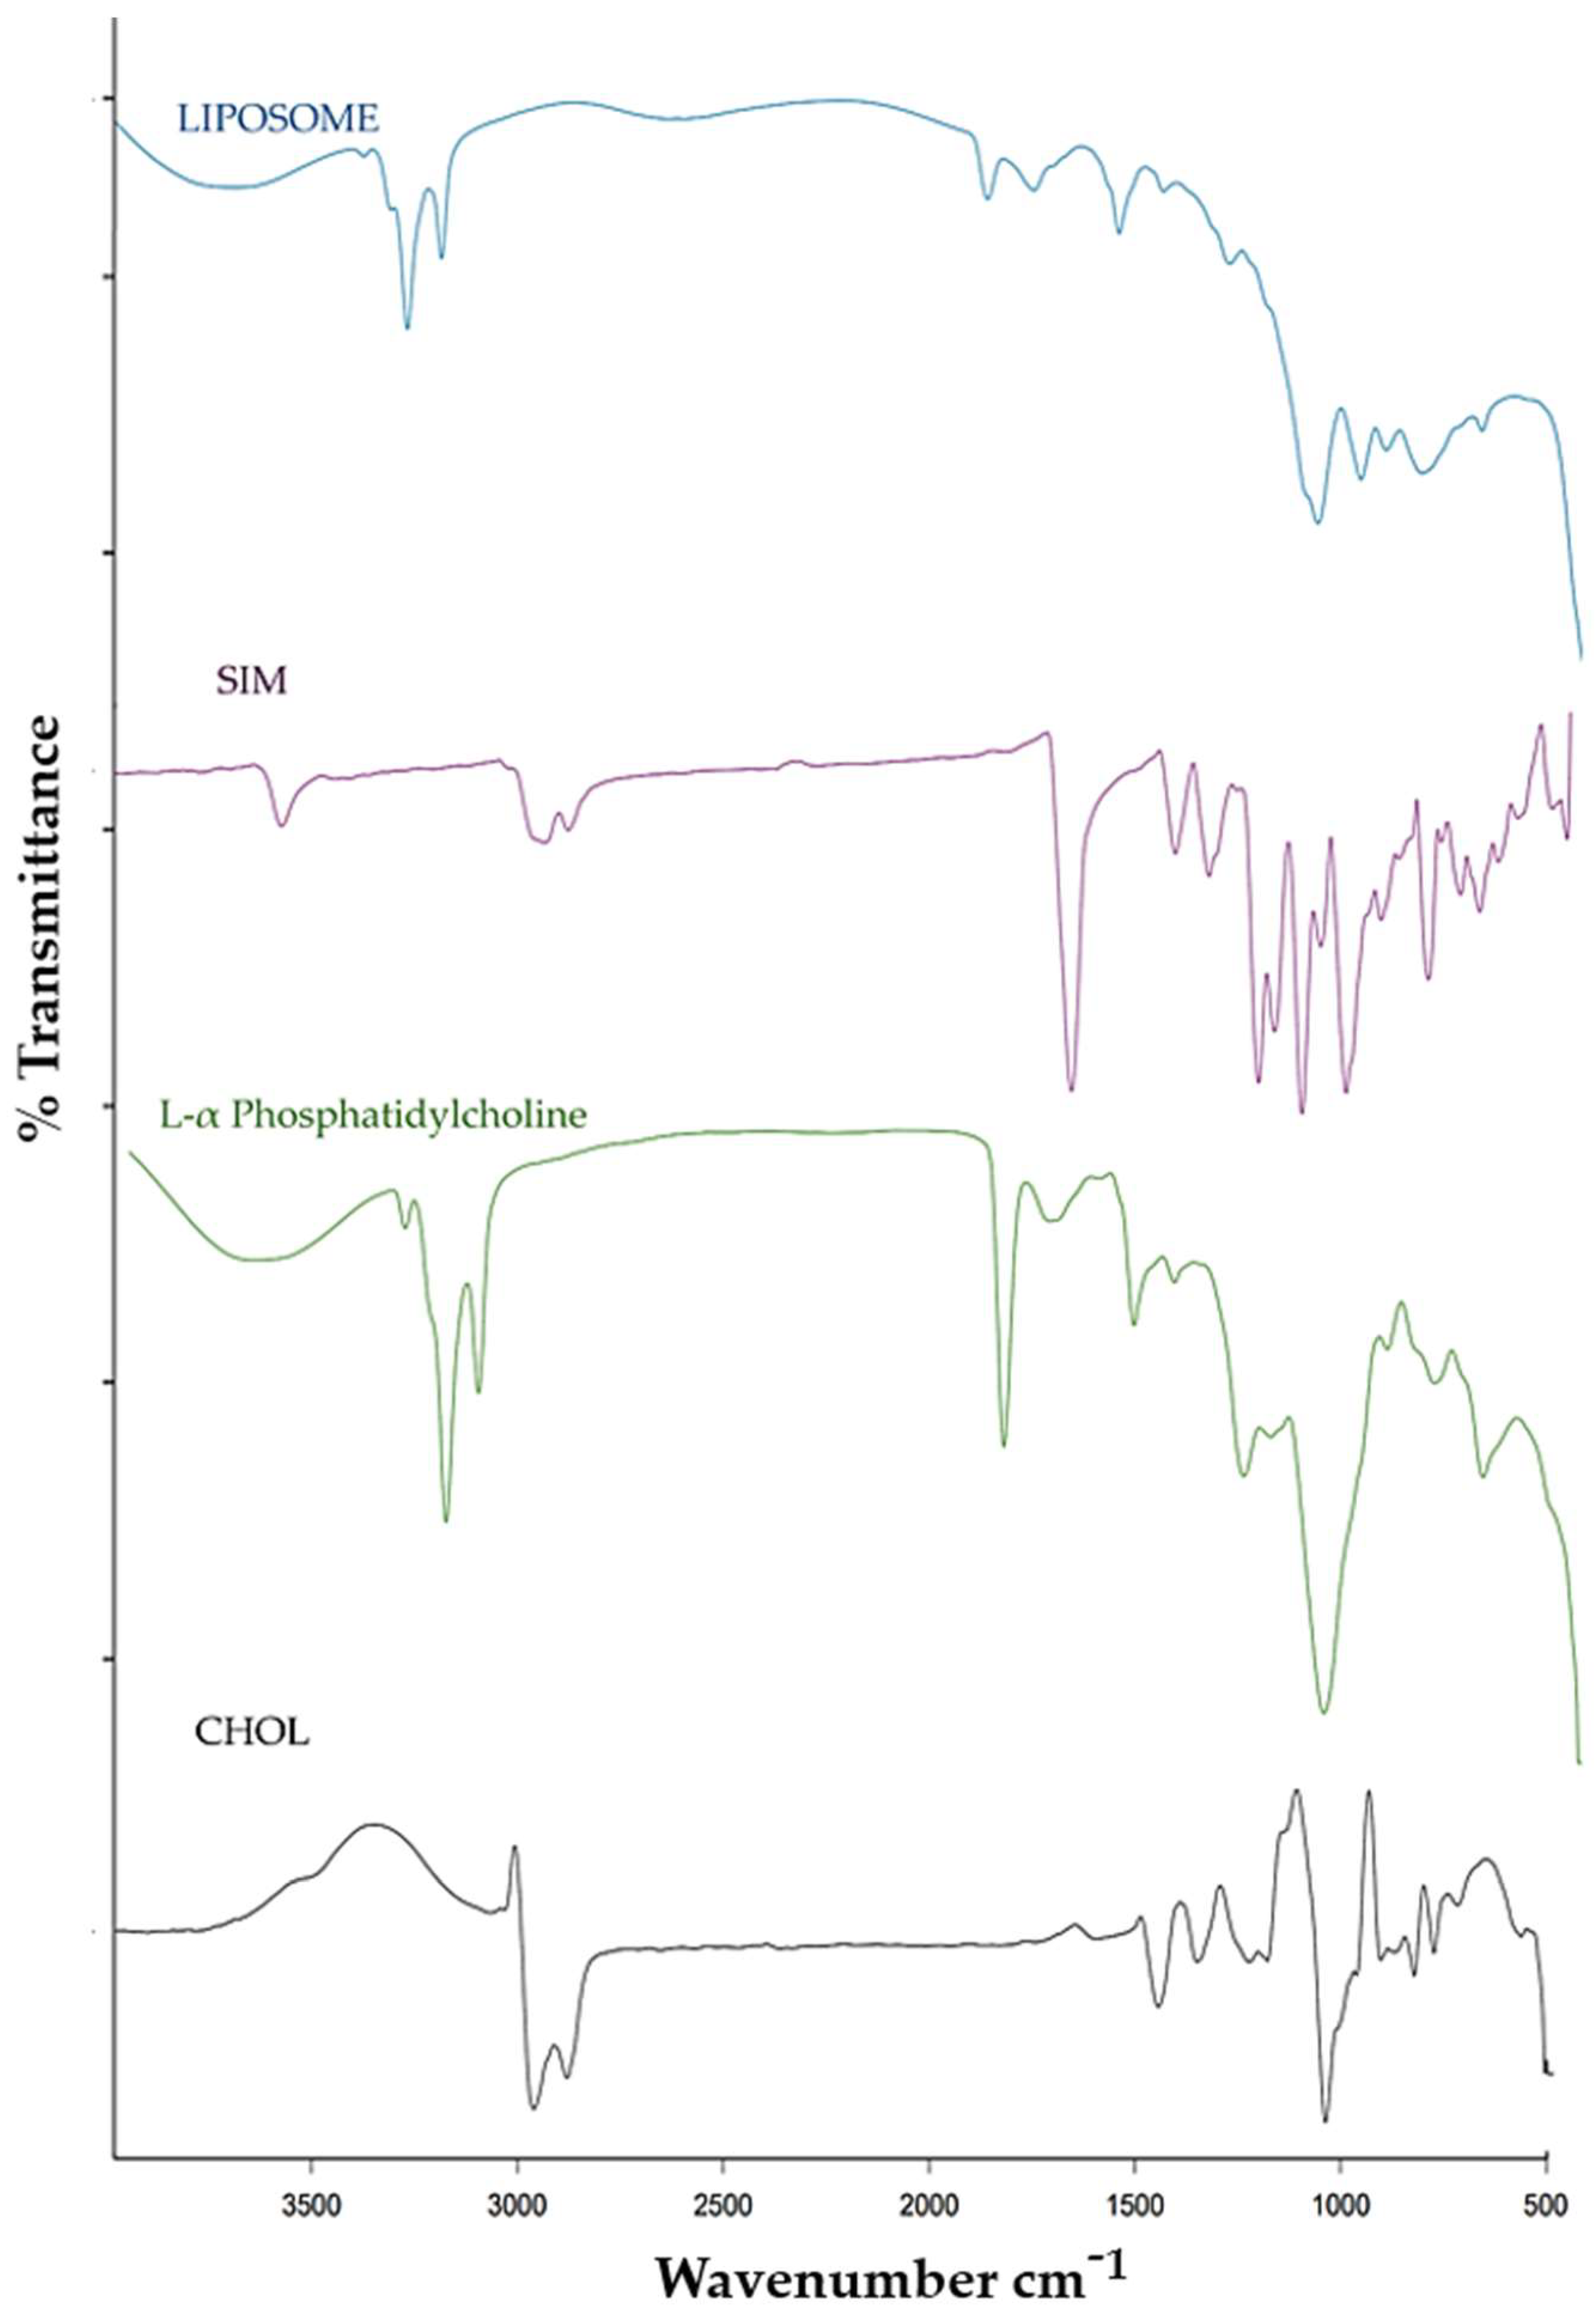
2.6. FTIR
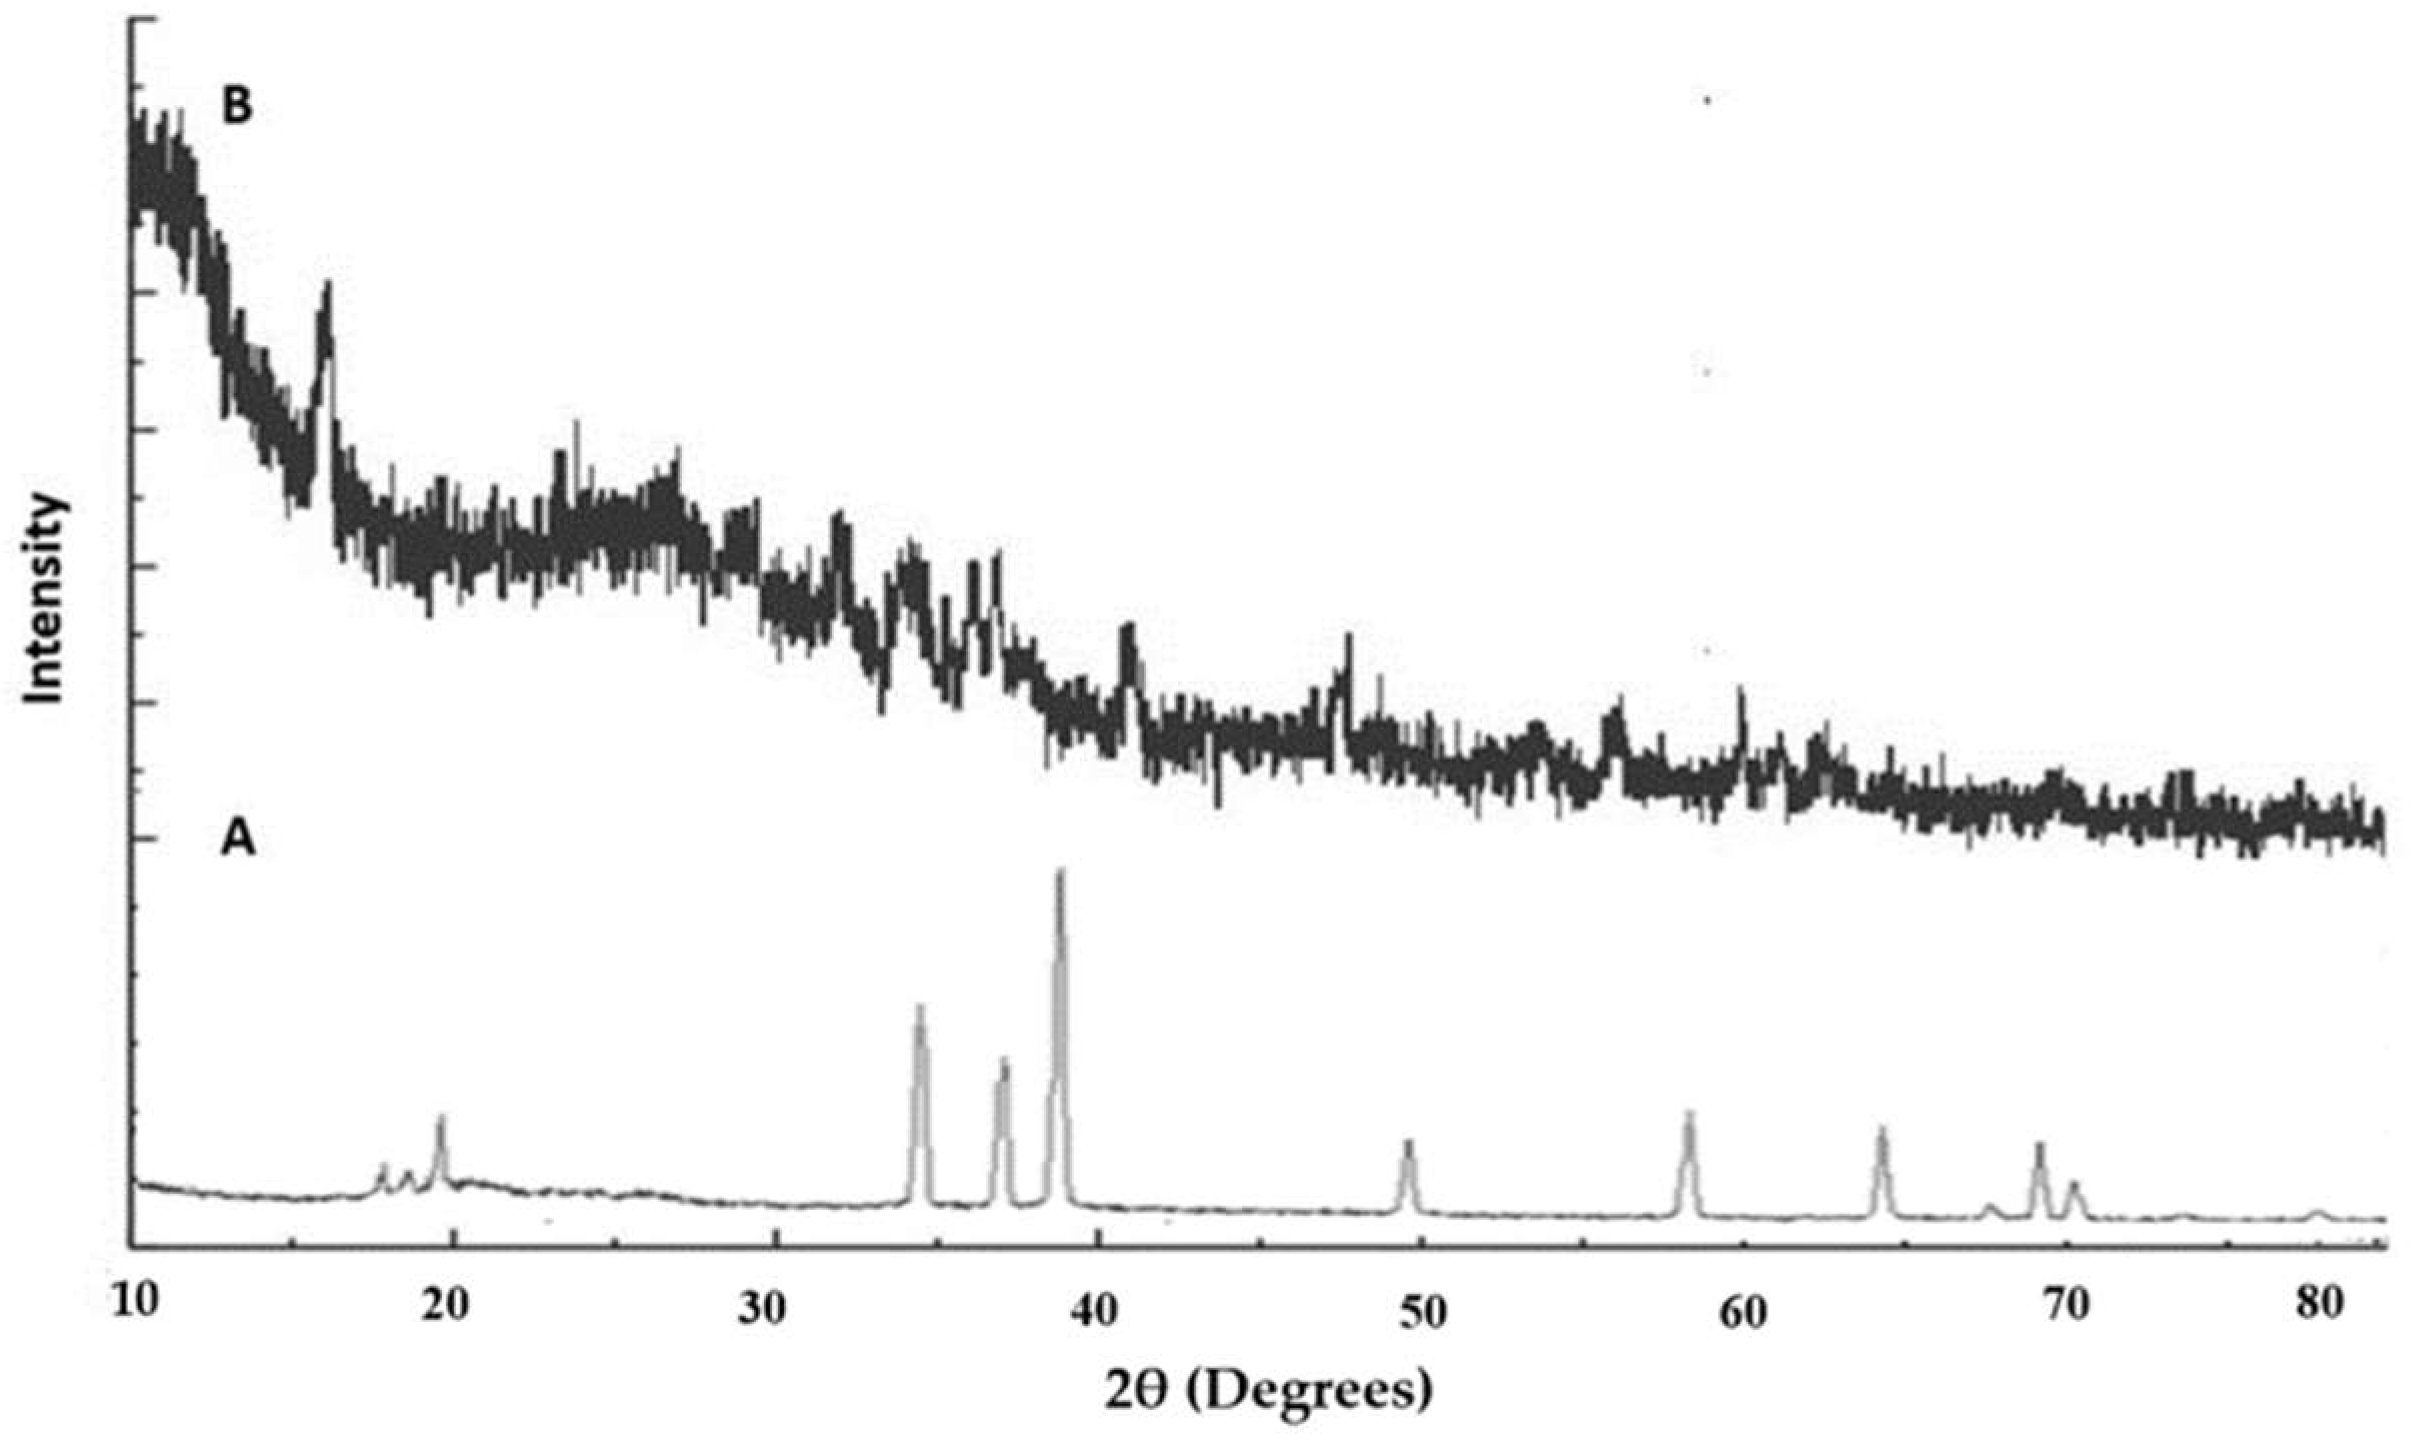
2.7. XRD
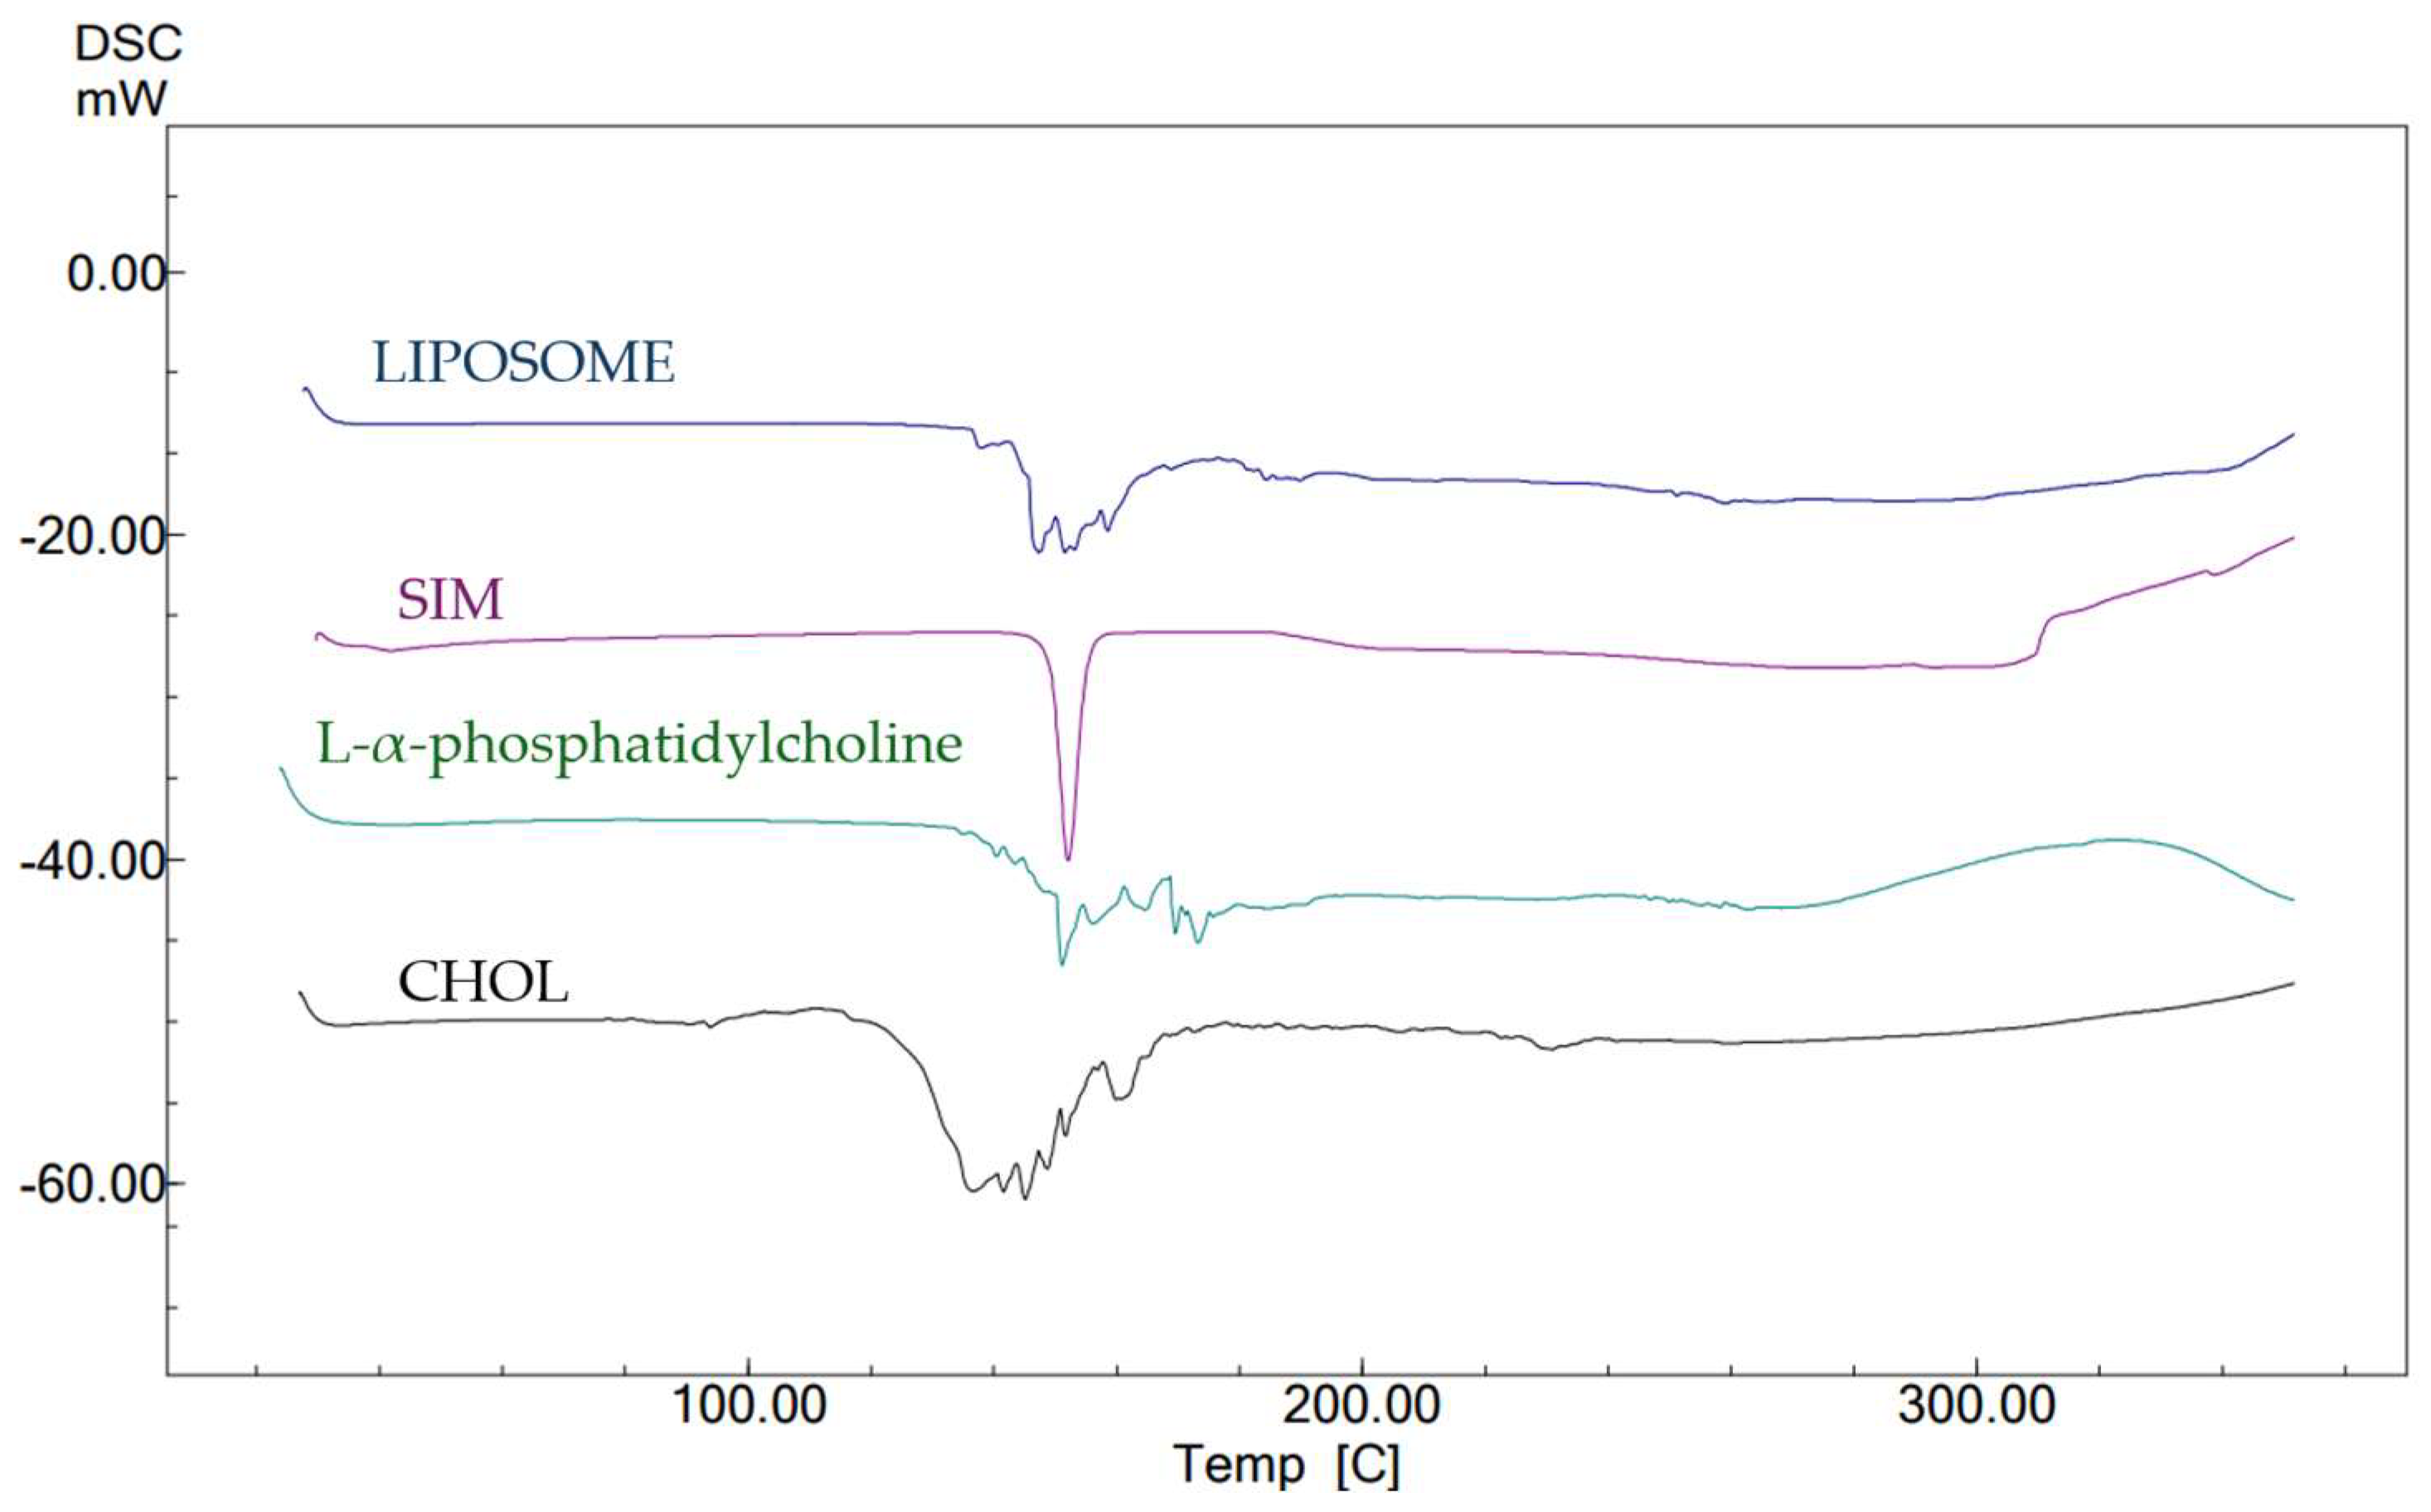
2.8. DSC
2.8.1. Appearance, pH, and Spreadability
2.8.2. Viscosity
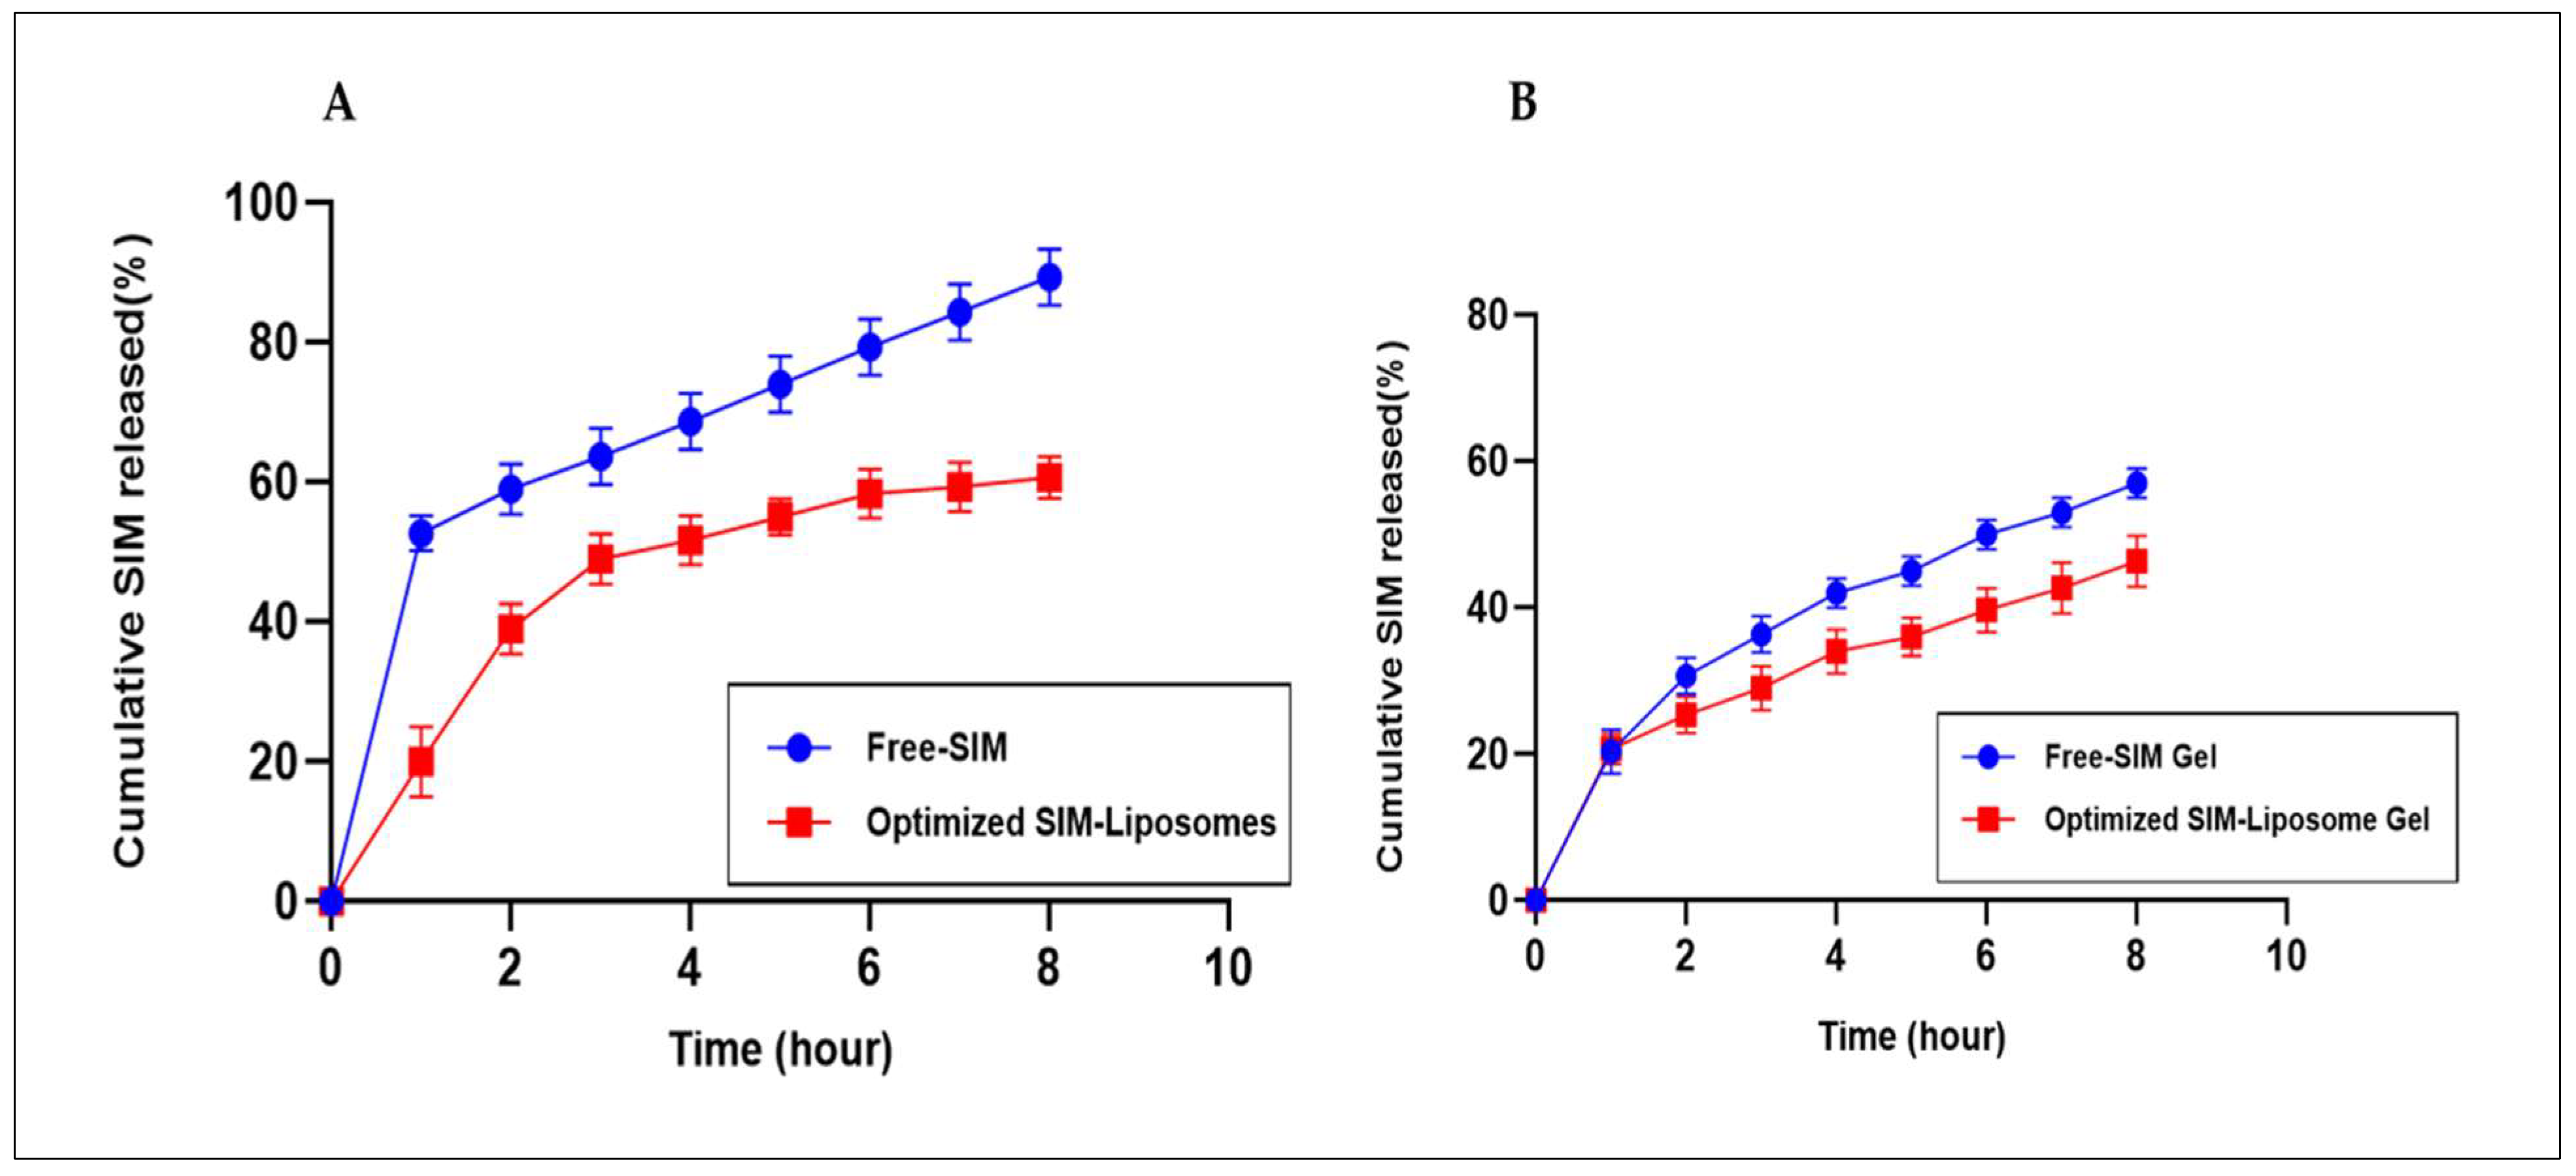
2.8.3. In Vitro Drug Release Study
2.8.4. In Vitro Drug Release Kinetic Modeling
2.9. Assessment of In Vivo Wound Healing Efficacy
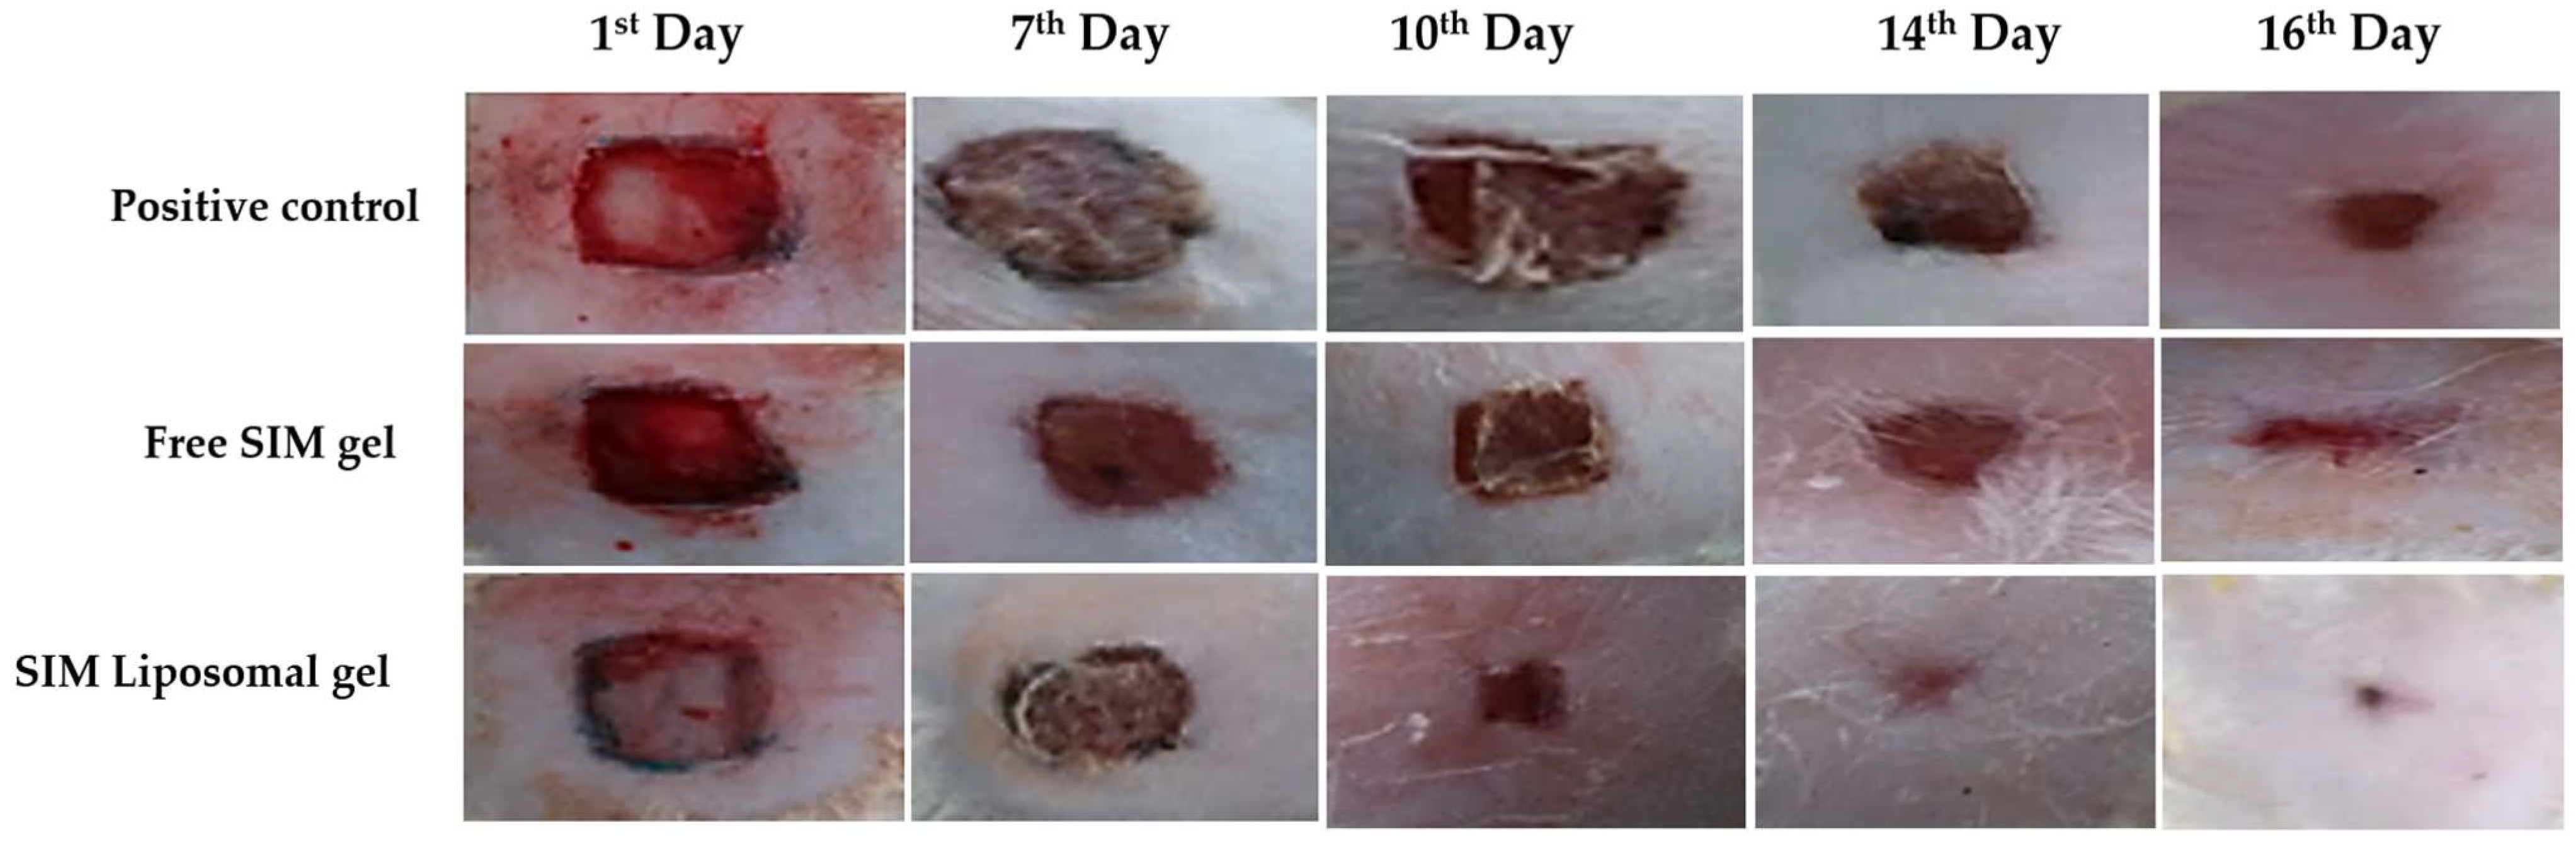
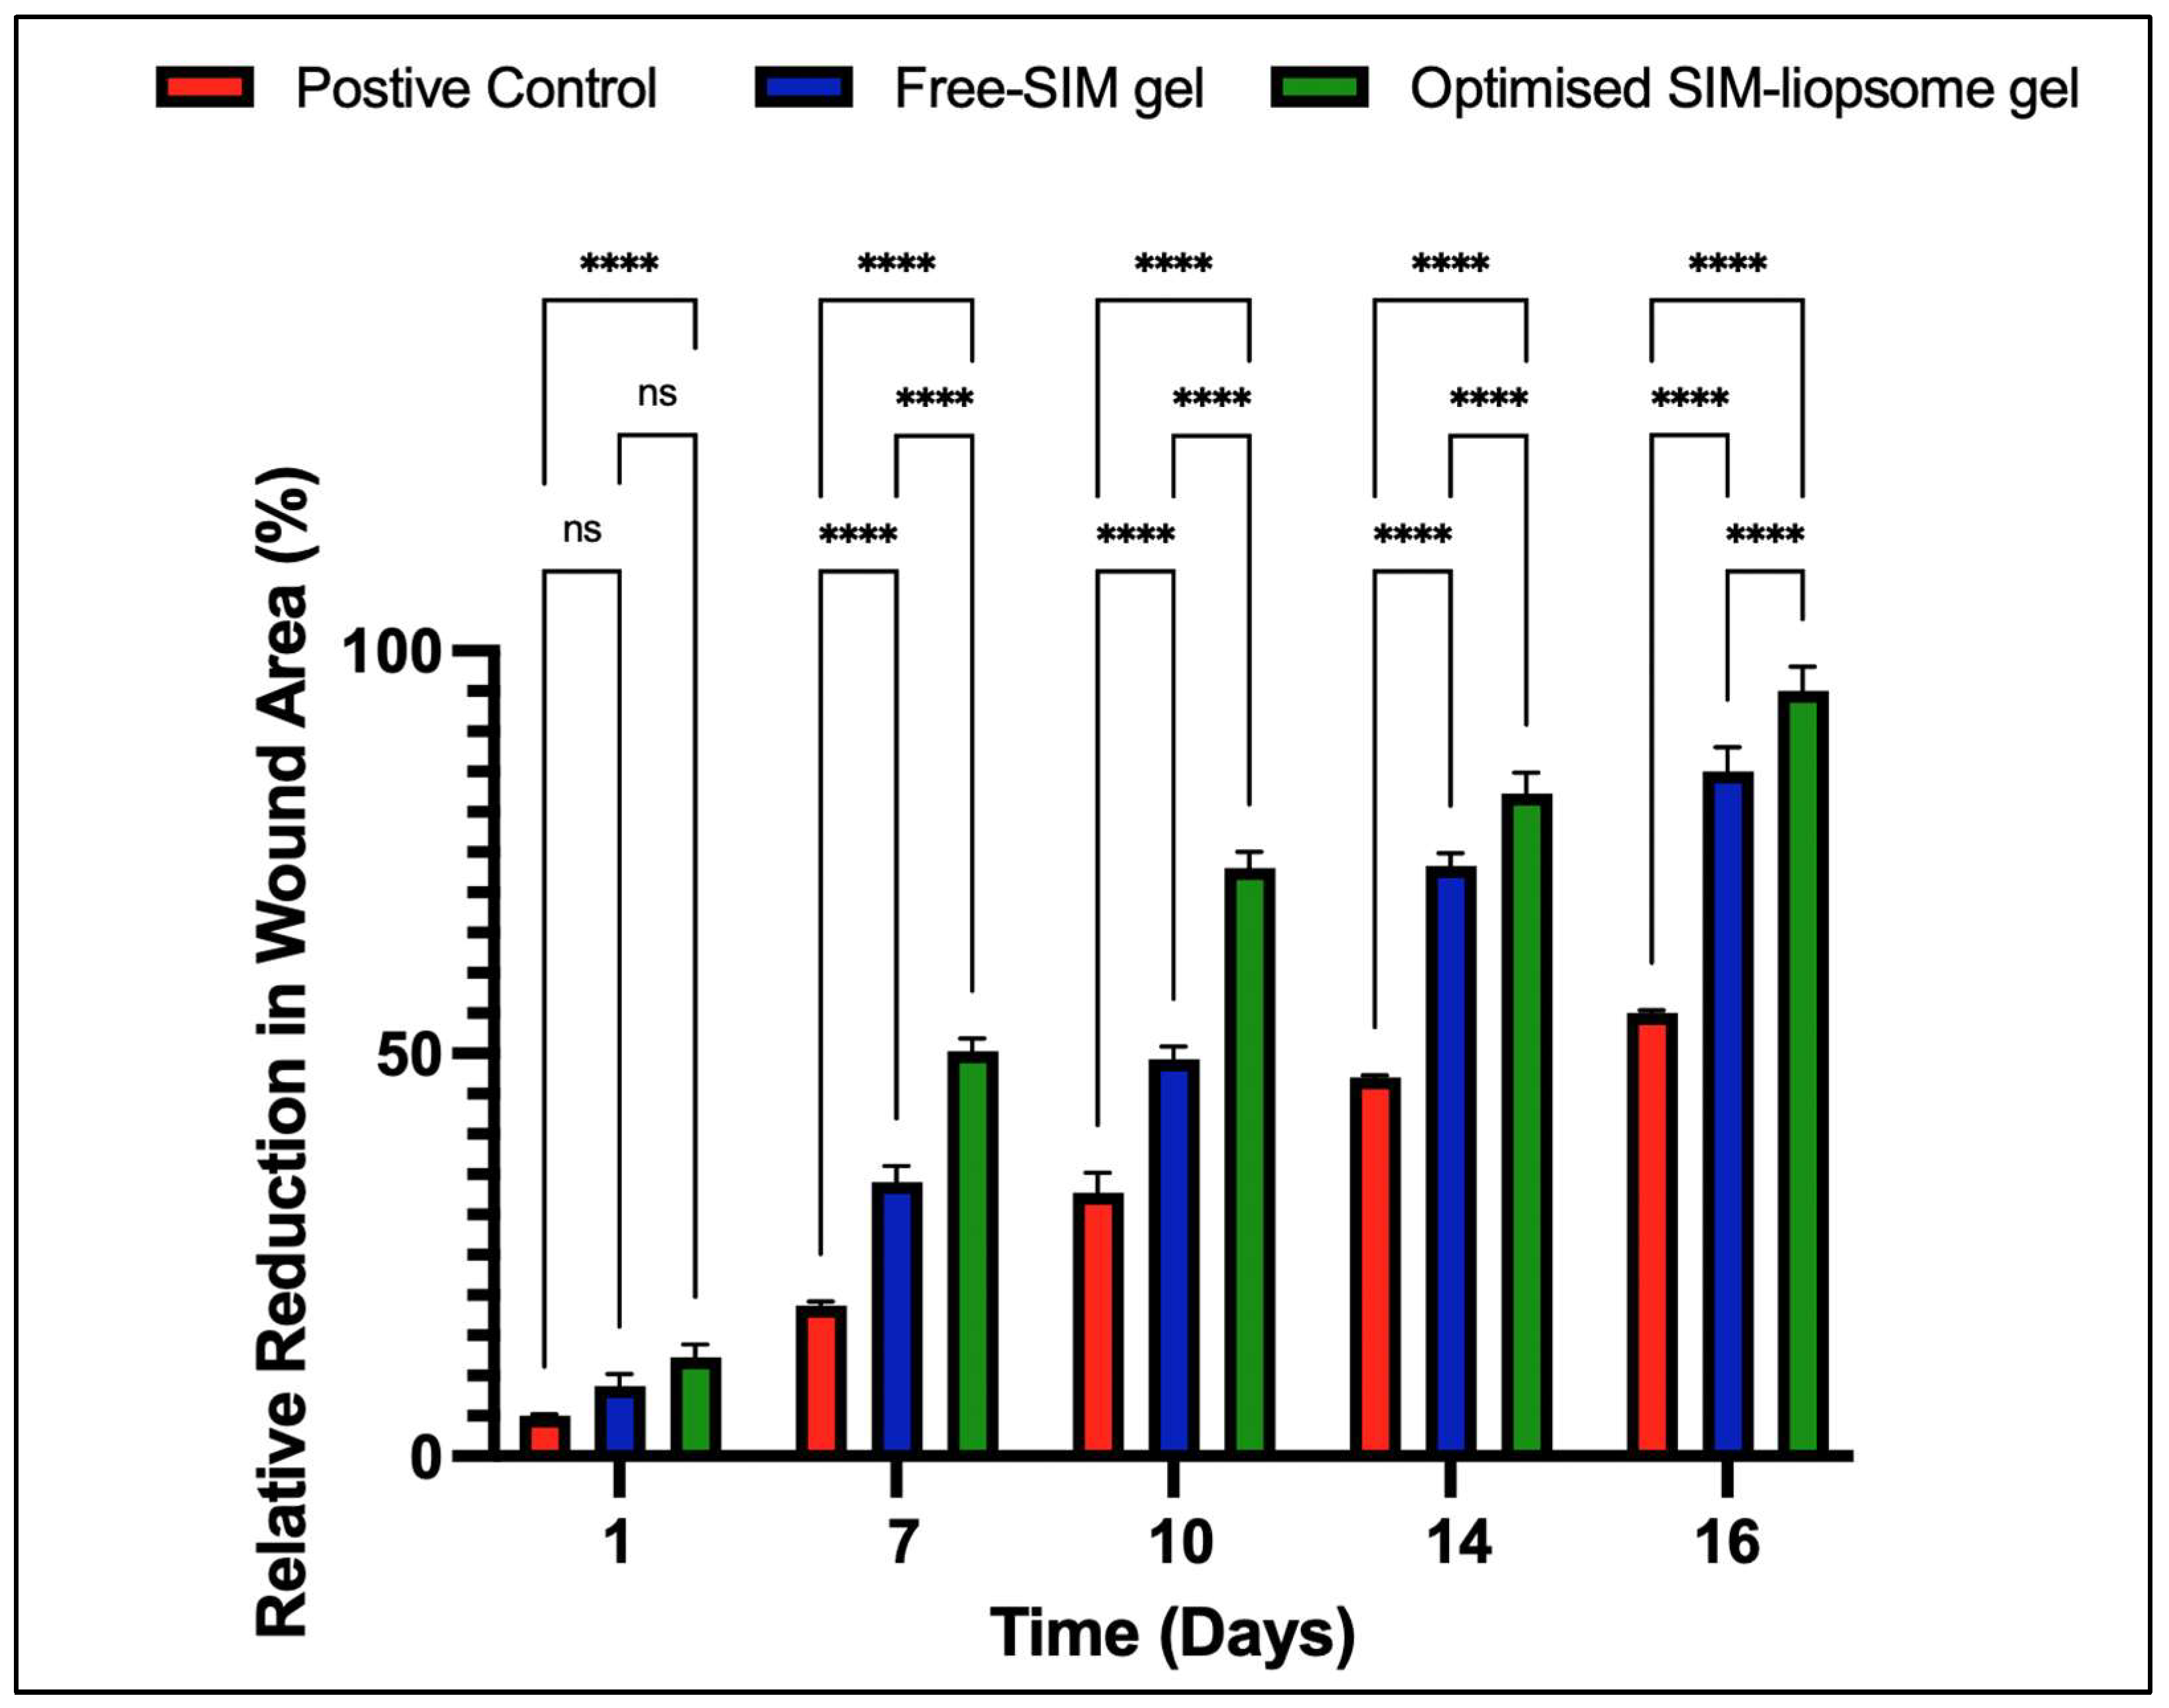
2.9.1. Evaluation of Wound Size
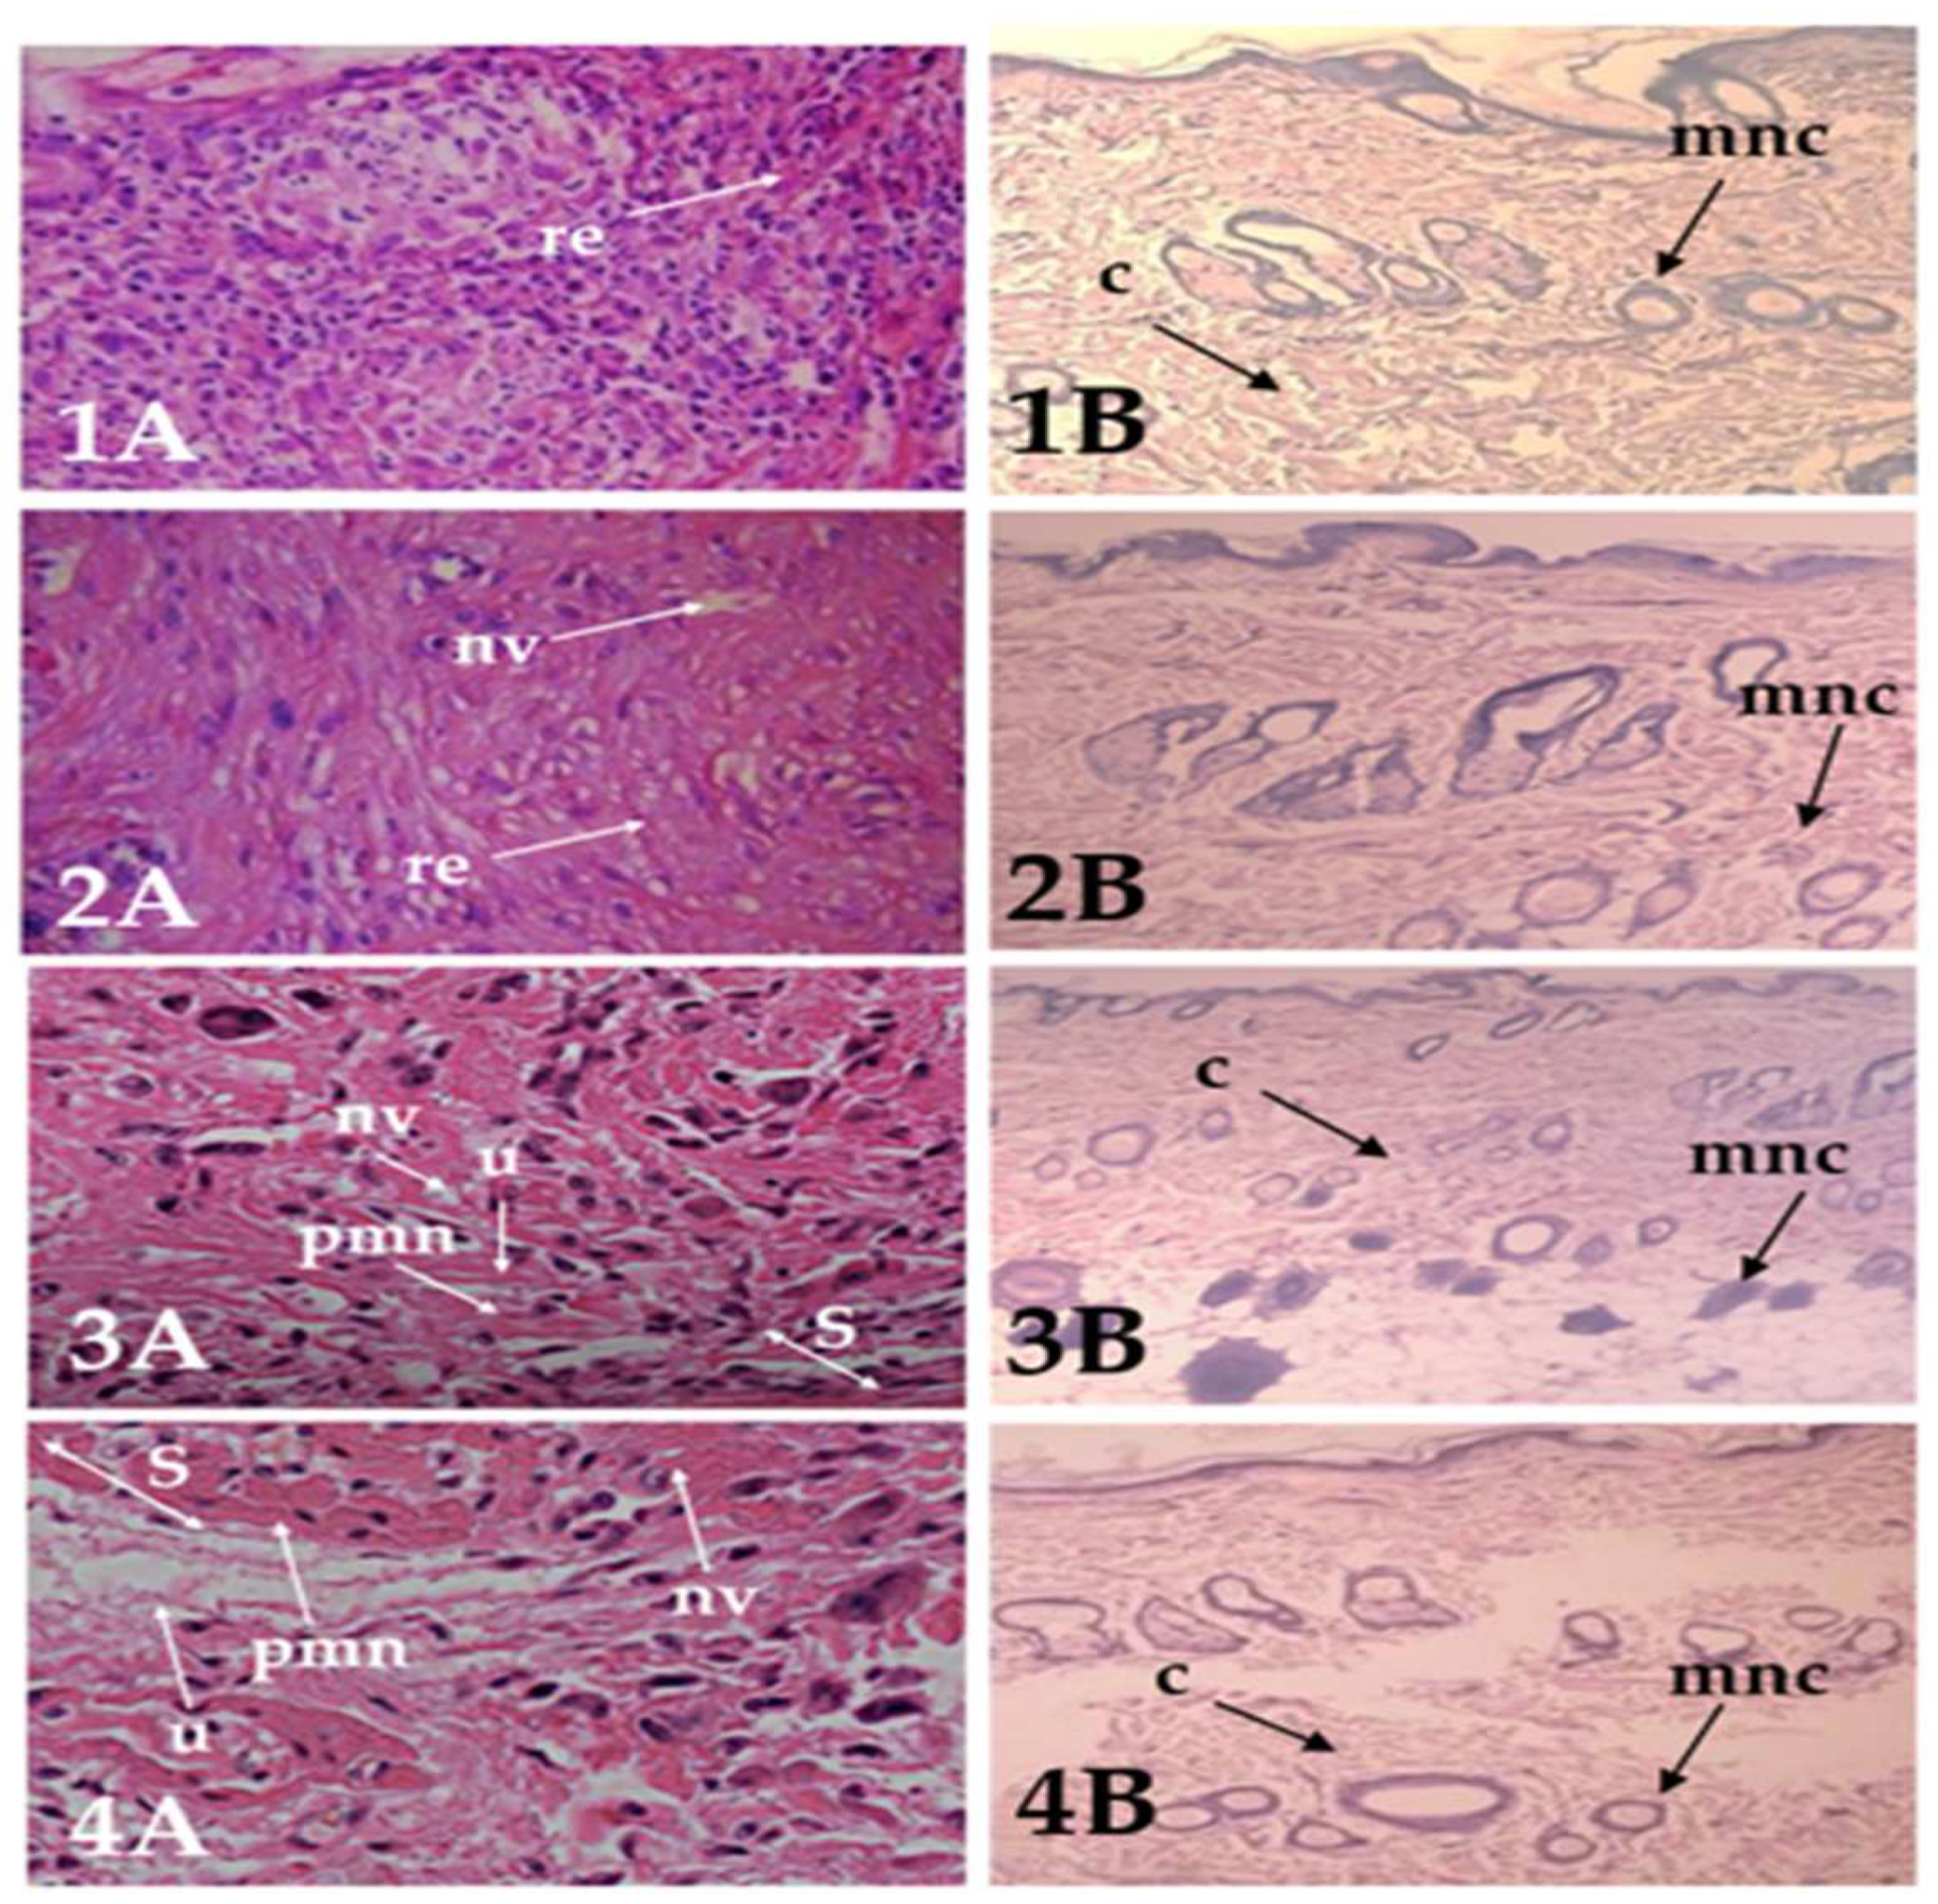
2.9.2. Histopathology Study
2.10. Stability Study
3. Conclusions
4. Materials and Methods
4.1. Materials
4.1.1. Chemicals
4.1.2. Animals
4.2. Design of the Experiment
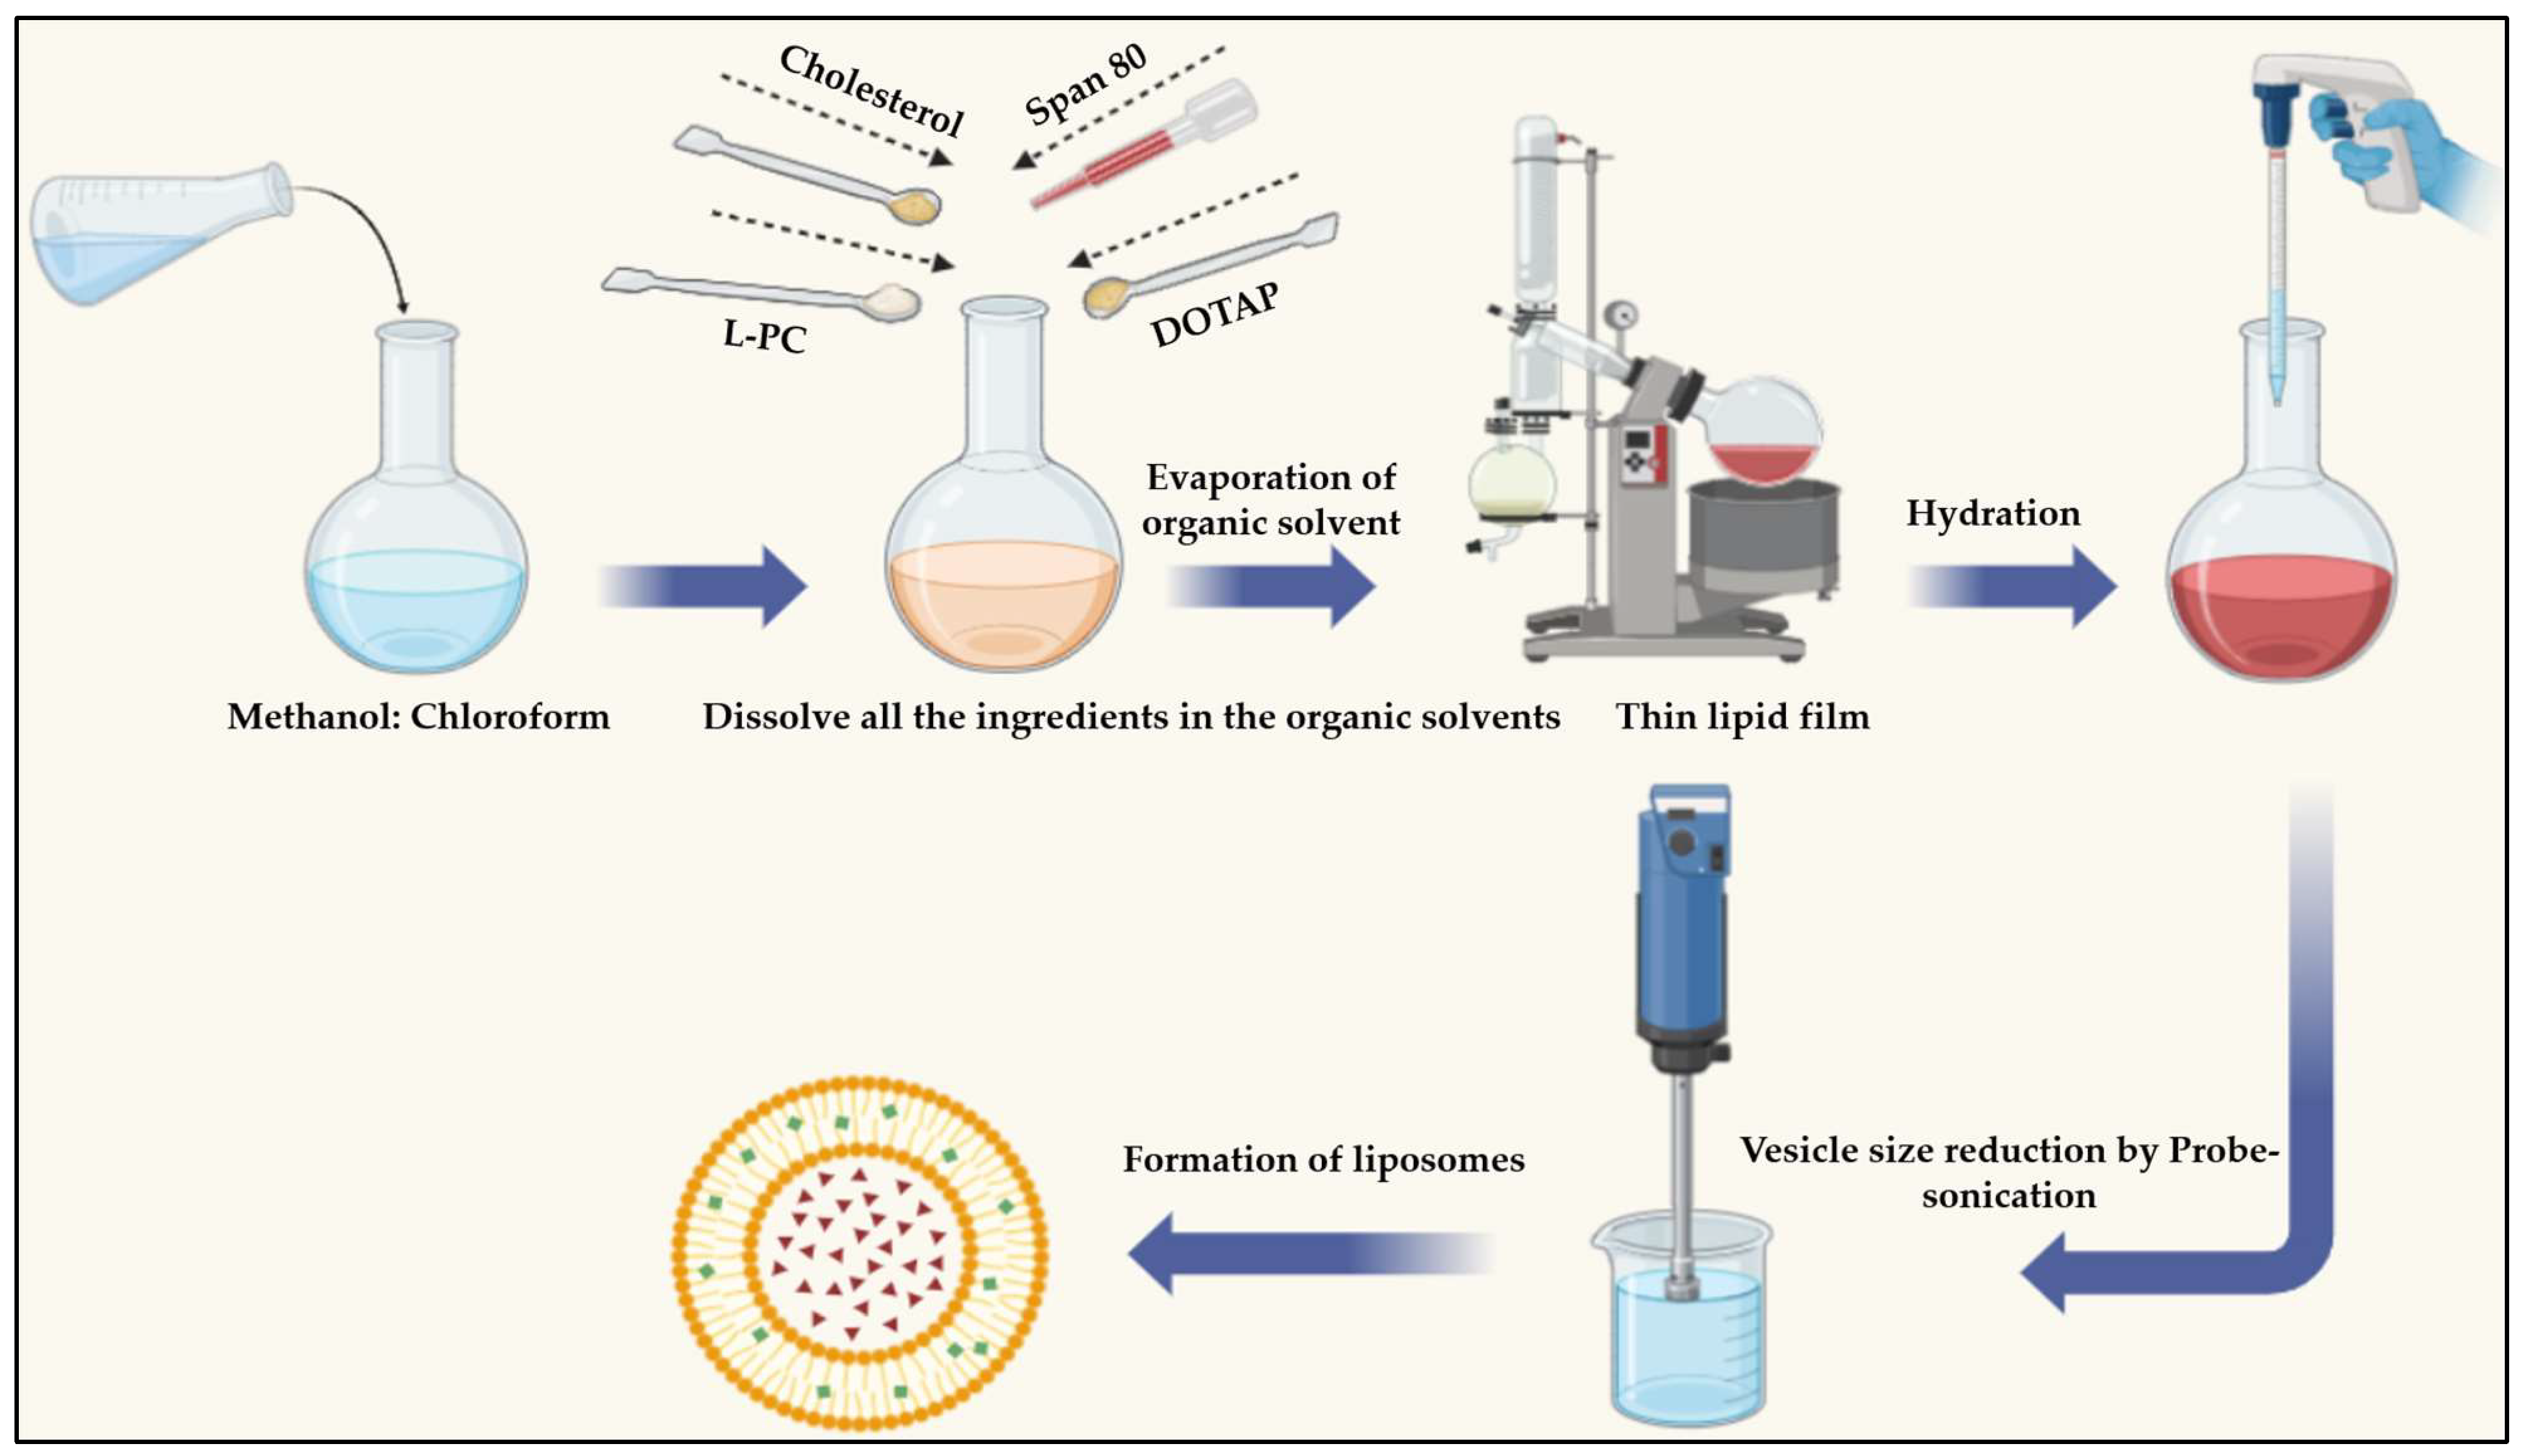
4.3. SIM-Encapsulated Liposome Preparation
4.4. Analytical Characterization of the Liposome-Encapsulated SIM Formulation
4.4.1. Determination of Entrapment Efficiency
4.4.2. Evaluation of Vesicle Size and Zeta Potential
4.4.3. Scanning Electron Microscopy (SEM)
4.4.4. High-Resolution Transmission Electron Microscopy (HR-TEM) Analysis
4.5. FTIR, XRD, and DSC
4.6. Incorporation of Liposomes into the Gel
4.7. Evaluation of the Optimized SIM-Loaded Liposome Gel
4.7.1. Appearance
4.7.2. Determination of pH
4.7.3. Spreadability
4.7.4. Viscosity
4.7.5. Drug Release Study
4.7.6. Drug Release Kinetics
4.8. Assessment of the In Vivo Wound Recovery Process
4.8.1. Experimental Design
4.8.2. Evaluation of Wound Size
4.8.3. Histopathology
4.9. Stability Studies
4.10. Statistical Analysis
Author Contributions
Funding
Institutional Review Board Statement
Informed Consent Statement
Data Availability Statement
Acknowledgments
Conflicts of Interest
References
- Farghaly Aly, U.; Abou-Taleb, H.A.; Abdellatif, A.A.; Sameh Tolba, N. Formulation and Evaluation of Simvastatin Polymeric Nanoparticles Loaded in Hydrogel for Optimum Wound Healing Purpose. Drug Des. Devel. Ther. 2019, 13, 1567–1580. [Google Scholar] [CrossRef] [PubMed]
- Toker, S.; Gulcan, E.; Çaycı, M.K.; Olgun, E.G.; Erbilen, E.; Özay, Y. Topical Atorvastatin in the Treatment of Diabetic Wounds. Am. J. Med. Sci. 2009, 338, 201–204. [Google Scholar] [CrossRef]
- Mohanty, C.; Das, M.; Sahoo, S.K. Sustained Wound Healing Activity of Curcumin Loaded Oleic Acid Based Polymeric Bandage in a Rat Model. Mol. Pharm. 2012, 9, 2801–2811. [Google Scholar] [CrossRef] [PubMed]
- Boateng, J.S.; Matthews, K.H.; Stevens, H.N.E.; Eccleston, G.M. Wound Healing Dressings and Drug Delivery Systems: A Review. J. Pharm. Sci. 2008, 97, 2892–2923. [Google Scholar] [CrossRef]
- Boyapati, L.; Wang, H.-L. The Role of Stress in Periodontal Disease and Wound Healing. Periodontol. 2000 2007, 44, 195–210. [Google Scholar] [CrossRef] [PubMed]
- Xie, P.; Dolivo, D.M.; Jia, S.; Cheng, X.; Salcido, J.; Galiano, R.D.; Hong, S.J.; Mustoe, T.A. Liposome-Encapsulated Statins Reduce Hypertrophic Scarring through Topical Application. Wound Repair Regen. 2020, 28, 460–469. [Google Scholar] [CrossRef] [PubMed]
- Farsaei, S.; Khalili, H.; Farboud, E.S. Potential Role of Statins on Wound Healing: Review of the Literature. Int. Wound J. 2012, 9, 238–247. [Google Scholar] [CrossRef]
- Haslinger-Löffler, B. Multiple Effects of HMG-CoA Reductase Inhibitors (Statins) besides Their Lipid-Lowering Function. Kidney Int. 2008, 74, 553–555. [Google Scholar] [CrossRef]
- Raposio, E.; Libondi, G.; Bertozzi, N.; Grignaffini, E.; Grieco, M.P. Effects of Topic Simvastatin for the Treatment of Chronic Vascular Cutaneous Ulcers: A Pilot Study. J. Am. Coll. Clin. Wound Spec. 2015, 7, 13–18. [Google Scholar] [CrossRef]
- Thangamani, S.; Mohammad, H.; Abushahba, M.F.N.; Hamed, M.I.; Sobreira, T.J.P.; Hedrick, V.E.; Paul, L.N.; Seleem, M.N. Exploring Simvastatin, an Antihyperlipidemic Drug, as a Potential Topical Antibacterial Agent. Sci. Rep. 2015, 5, 16407. [Google Scholar] [CrossRef]
- Casula, L.; Zidar, A.; Kristl, J.; Jeras, M.; Kralj, S.; Fadda, A.M.; Zupančič, Š. Development of Nanofibers with Embedded Liposomes Containing an Immunomodulatory Drug Using Green Electrospinning. Pharmaceutics 2023, 15, 1245. [Google Scholar] [CrossRef] [PubMed]
- Varshosaz, J.; Taymouri, S.; Minaiyan, M.; Rastegarnasab, F.; Baradaran, A. Development and in Vitro/in Vivo Evaluation of HPMC/Chitosan Gel Containing Simvastatin Loaded Self-Assembled Nanomicelles as a Potent Wound Healing Agent. Drug Dev. Ind. Pharm. 2018, 44, 276–288. [Google Scholar] [CrossRef] [PubMed]
- Morrow, D.I.J.; McCarron, P.A.; Woolfson, A.D.; Donnelly, R.F. Innovative Strategies for Enhancing Topical and Transdermal Drug Delivery. Open Drug Deliv. J. 2007, 1, 36–59. [Google Scholar] [CrossRef]
- Sharma, A.; Sharma, U.S. Liposomes in Drug Delivery: Progress and Limitations. Int. J. Pharm. 1997, 154, 123–140. [Google Scholar] [CrossRef]
- Schmid, M.-H.; Korting, H.C. Therapeutic Progress with Topical Liposome Drugs for Skin Disease. Adv. Drug Deliv. Rev. 1996, 18, 335–342. [Google Scholar] [CrossRef]
- Mohapatra, S.; Mirza, M.A.; Hilles, A.R.; Zakir, F.; Gomes, A.C.; Ansari, M.J.; Iqbal, Z.; Mahmood, S. Biomedical Application, Patent Repository, Clinical Trial and Regulatory Updates on Hydrogel: An Extensive Review. Gels 2021, 7, 207. [Google Scholar] [CrossRef] [PubMed]
- Wieber, A.; Selzer, T.; Kreuter, J. Physico-Chemical Characterisation of Cationic DOTAP Liposomes as Drug Delivery System for a Hydrophilic Decapeptide before and after Freeze-Drying. Eur. J. Pharm. Biopharm. 2012, 80, 358–367. [Google Scholar] [CrossRef] [PubMed]
- Honary, S.; Zahir, F. Effect of Zeta Potential on the Properties of Nano-Drug Delivery Systems—A Review (Part 1). Trop. J. Pharm. Res. 2013, 12, 255–264. [Google Scholar] [CrossRef]
- El Zaafarany, G.M.; Awad, G.A.S.; Holayel, S.M.; Mortada, N.D. Role of Edge Activators and Surface Charge in Developing Ultradeformable Vesicles with Enhanced Skin Delivery. Int. J. Pharm. 2010, 397, 164–172. [Google Scholar] [CrossRef]
- Jain, S.; Jain, P.; Umamaheshwari, R.B.; Jain, N.K. Transfersomes—A Novel Vesicular Carrier for Enhanced Transdermal Delivery: Development, Characterization, and Performance Evaluation. Drug Dev. Ind. Pharm. 2003, 29, 1013–1026. [Google Scholar] [CrossRef]
- Elnaggar, Y.S.R.; El-Refaie, W.M.; El-Massik, M.A.; Abdallah, O.Y. Lecithin-Based Nanostructured Gels for Skin Delivery: An Update on State of Art and Recent Applications. J. Controlled Release 2014, 180, 10–24. [Google Scholar] [CrossRef]
- Guan, Y.; Zuo, T.; Chang, M.; Zhang, F.; Wei, T.; Shao, W.; Lin, G. Propranolol Hydrochloride-Loaded Liposomal Gel for Transdermal Delivery: Characterization and in Vivo Evaluation. Int. J. Pharm. 2015, 487, 135–141. [Google Scholar] [CrossRef] [PubMed]
- Hemmingsen, L.M.; Julin, K.; Ahsan, L.; Basnet, P.; Johannessen, M.; Škalko-Basnet, N. Chitosomes-In-Chitosan Hydrogel for Acute Skin Injuries: Prevention and Infection Control. Mar. Drugs 2021, 19, 269. [Google Scholar] [CrossRef]
- Gupta, A.; Aggarwal, G.; Singla, S.; Arora, R. Transfersomes: A Novel Vesicular Carrier for Enhanced Transdermal Delivery of Sertraline: Development, Characterization, and Performance Evaluation. Sci. Pharm. 2012, 80, 1061–1080. [Google Scholar] [CrossRef]
- Abd-Elbary, A.; El-laithy, H.M.; Tadros, M.I. Sucrose Stearate-Based Proniosome-Derived Niosomes for the Nebulisable Delivery of Cromolyn Sodium. Int. J. Pharm. 2008, 357, 189–198. [Google Scholar] [CrossRef]
- Abd El-Alim, S.H.; Kassem, A.A.; Basha, M.; Salama, A. Comparative Study of Liposomes, Ethosomes and Transfersomes as Carriers for Enhancing the Transdermal Delivery of Diflunisal: In Vitro and in Vivo Evaluation. Int. J. Pharm. 2019, 563, 293–303. [Google Scholar] [CrossRef]
- El-Badry, M.; Fetih, G.; Fathalla, D.; Shakeel, F. Transdermal Delivery of Meloxicam Using Niosomal Hydrogels: In Vitro and Pharmacodynamic Evaluation. Pharm. Dev. Technol. 2015, 20, 820–826. [Google Scholar] [CrossRef] [PubMed]
- Ning, M.; Guo, Y.; Pan, H.; Chen, X.; Gu, Z. Preparation, in Vitro and in Vivo Evaluation of Liposomal/Niosomal Gel Delivery Systems for Clotrimazole. Drug Dev. Ind. Pharm. 2005, 31, 375–383. [Google Scholar] [CrossRef]
- Beaulac, C.; Clement-Major, S.; Hawari, J.; Lagace, J. In Vitro Kinetics of Drug Release and Pulmonary Retention of Microencapsulated Antibiotic in Liposomal Formulations in Relation to the Lipid Composition. J. Microencapsul. 1997, 14, 335–348. [Google Scholar] [CrossRef] [PubMed]
- Puglisi, G.; Fresta, M.; Mazzone, G.; Furneri, P.M.; Tempera, G. Formulation Parameters of Fluoroquinolone-Loaded Liposomes and in Vitro Antimicrobial Activity. Int. J. Pharm. 1995, 118, 65–76. [Google Scholar] [CrossRef]
- Bueno, V.B.; Bentini, R.; Catalani, L.H.; Petri, D.F.S. Synthesis and Swelling Behavior of Xanthan-Based Hydrogels. Carbohydr. Polym. 2013, 92, 1091–1099. [Google Scholar] [CrossRef] [PubMed]
- Cojocaru, V.; Ranetti, A.E.; Hinescu, L.G.; Ionescu, M.; Cosmescu, C.; Poștoarcă, A.G.; Cinteză, L.O. Formulation and Evaluation of in Vitro Release Kinetics of Na3CaDTPA Decorporation Agent Embedded in Microemulsion-Based Gel Formulation for Topical Delivery. Farmacia 2015, 63, 656–664. [Google Scholar]
- Ahmed, L.M.; Hassanein, K.M.A.; Mohamed, F.A.; Elfaham, T.H. Formulation and Evaluation of Simvastatin Cubosomal Nanoparticles for Assessing Its Wound Healing Effect. Sci. Rep. 2023, 13, 17941. [Google Scholar] [CrossRef] [PubMed]
- Osmani, R.A.; Kulkarni, P.K.; Shanmuganathan, S.; Hani, U.; Srivastava, A.; Prerana, M.; Shinde, C.G.; Bhosale, R.R. A 32 Full Factorial Design for Development and Characterization of a Nanosponge-based Intravaginal In-situ Gelling System for Vulvovaginal Candidiasis. RSC Adv. 2016, 6, 18737–18750. [Google Scholar] [CrossRef]
- Kiani, M.; Moraffah, F.; Khonsari, F.; Kharazian, B.; Dinarvand, R.; Shokrgozar, M.-A.; Atyabi, F. Co-Delivery of Simvastatin and microRNA-21 through Liposome Could Accelerates the Wound Healing Process. Biomater. Adv. 2023, 154, 213658. [Google Scholar] [CrossRef] [PubMed]
- Muppidi, K.; Pumerantz, A.S.; Wang, J.; Betageri, G. Development and Stability Studies of Novel Liposomal Vancomycin Formulations. Int. Sch. Res. Not. 2012, 2012, e636743. [Google Scholar] [CrossRef] [PubMed]
- Balasubramaniam, A.; Anil Kumar, V.; Sadasivan Pillai, K. Formulation and in Vivo Evaluation of Niosome-Encapsulated Daunorubicin Hydrochloride. Drug Dev. Ind. Pharm. 2002, 28, 1181–1193. [Google Scholar] [CrossRef]
- Arzani, G.; Haeri, A.; Daeihamed, M.; Bakhtiari-Kaboutaraki, H.; Dadashzadeh, S. Niosomal Carriers Enhance Oral Bioavailability of Carvedilol: Effects of Bile Salt-Enriched Vesicles and Carrier Surface Charge. Int. J. Nanomed. 2015, 10, 4797–4813. [Google Scholar]
- Zidan, A.S.; Hosny, K.M.; Ahmed, O.A.; Fahmy, U.A. Assessment of Simvastatin Niosomes for Pediatric Transdermal Drug Delivery. Drug Deliv. 2016, 23, 1536–1549. [Google Scholar] [CrossRef]
- Zorzi, G.K.; Schuh, R.S.; Maschio, V.J.; Brazil, N.T.; Rott, M.B.; Teixeira, H.F. Box Behnken Design of siRNA-Loaded Liposomes for the Treatment of a Murine Model of Ocular Keratitis Caused by Acanthamoeba. Colloids Surf. B Biointerfaces 2019, 173, 725–732. [Google Scholar] [CrossRef]
- Shi, J.; Ma, F.; Wang, X.; Wang, F.; Liao, H. Formulation of Liposomes Gels of Paeonol for Transdermal Drug Delivery by Box-Behnken Statistical Design. J. Liposome Res. 2012, 22, 270–278. [Google Scholar] [CrossRef] [PubMed]
- Bragagni, M.; Mennini, N.; Maestrelli, F.; Cirri, M.; Mura, P. Comparative Study of Liposomes, Transfersomes and Ethosomes as Carriers for Improving Topical Delivery of Celecoxib. Drug Deliv. 2012, 19, 354–361. [Google Scholar] [CrossRef] [PubMed]
- Arayne, M.S.; Sultana, N.; Hussain, F.; Ali, S.A. Validated Spectrophotometric Method for Quantitative Determination of Simvastatin in Pharmaceutical Formulations and Human Serum. J. Anal. Chem. 2007, 62, 536–541. [Google Scholar] [CrossRef]
- Khan, M.I.; Madni, A.; Ahmad, S.; Mahmood, M.A.; Rehman, M.; Ashfaq, M. Formulation Design and Characterization of a Non-Ionic Surfactant Based Vesicular System for the Sustained Delivery of a New Chondroprotective Agent. Braz. J. Pharm. Sci. 2015, 51, 607–615. [Google Scholar] [CrossRef]
- Bragagni, M.; Mennini, N.; Ghelardini, C.; Mura, P. Development and Characterization of Niosomal Formulations of Doxorubicin Aimed at Brain Targeting. J. Pharm. Pharm. Sci. 2012, 15, 184–196. [Google Scholar] [CrossRef] [PubMed]
- He, R.-X.; Ye, X.; Li, R.; Chen, W.; Ge, T.; Huang, T.-Q.; Nie, X.-J.; Chen, H.-J.-T.; Peng, D.Y.; Chen, W.-D. PEGylated Niosomes-Mediated Drug Delivery Systems for Paeonol: Preparation, Pharmacokinetics Studies and Synergistic Anti-Tumor Effects with 5-FU. J. Liposome Res. 2017, 27, 161–170. [Google Scholar] [CrossRef] [PubMed]
- Arunraj, T.R.; Rejinold, N.S.; Mangalathillam, S.; Saroj, S.; Biswas, R.; Jayakumar, R. Synthesis, Characterization and Biological Activities of Curcumin Nanospheres. J. Biomed. Nanotechnol. 2014, 10, 238–250. [Google Scholar] [CrossRef] [PubMed]
- Changsan, N.; Chan, H.; Separovic, F.; Srichana, T. Physicochemical Characterization and Stability of Rifampicin Liposome Dry Powder Formulations for Inhalation. J. Pharm. Sci. 2009, 98, 628–639. [Google Scholar] [CrossRef] [PubMed]
- Tavano, L. Liposomal Gels in Enhancing Skin Delivery of Drugs. In Percutaneous Penetration Enhancers Chemical Methods in Penetration Enhancement: Drug Manipulation Strategies and Vehicle Effects; Dragicevic, N., Maibach, H.I., Eds.; Springer: Berlin/Heidelberg, Germany, 2015; pp. 329–341. ISBN 978-3-662-45013-0. [Google Scholar]
- Hua, S. Development of an Effective Topical LiposomalFormulation for Localized Analgesia and Antiinflammatory Actions in the Complete Freund’sAdjuvant Rodent Model of Acute Inflammatory Pain. Pain Physician 2014, 6, E719–E735. [Google Scholar] [CrossRef]
- Pandey, S.; Shamim, A.; Shaif, M.; Kushwaha, P. Development and Evaluation of Resveratrol-Loaded Liposomes in Hydrogel-Based Wound Dressing for Diabetic Foot Ulcer. Naunyn. Schmiedebergs Arch. Pharmacol. 2023, 396, 1811–1825. [Google Scholar] [CrossRef]
- Salem, H.F.; Nafady, M.M.; Kharshoum, R.M.; Abd el-Ghafar, O.A.; Farouk, H.O. Novel Enhanced Therapeutic Efficacy of Dapoxetine HCl by Nano-Vesicle Transdermal Gel for Treatment of Carrageenan-Induced Rat Paw Edema. AAPS PharmSciTech 2020, 21, 113. [Google Scholar] [CrossRef] [PubMed]
- Batheja, P.; Sheihet, L.; Kohn, J.; Singer, A.J.; Michniak-Kohn, B. Topical Drug Delivery by a Polymeric Nanosphere Gel: Formulation Optimization and in Vitro and in Vivo Skin Distribution Studies. J. Controlled Release 2011, 149, 159–167. [Google Scholar] [CrossRef] [PubMed]
- Dragicevic, N.; Krajisnik, D.; Milic, J.; Fahr, A.; Maibach, H. Development of Hydrophilic Gels Containing Coenzyme Q10-Loaded Liposomes: Characterization, Stability and Rheology Measurements. Drug Dev. Ind. Pharm. 2019, 45, 43–54. [Google Scholar] [CrossRef] [PubMed]
- Goyal, G.; Garg, T.; Malik, B.; Chauhan, G.; Rath, G.; Goyal, A.K. Development and Characterization of Niosomal Gel for Topical Delivery of Benzoyl Peroxide. Drug Deliv. 2015, 22, 1027–1042. [Google Scholar] [CrossRef] [PubMed]
- Costa, P.; Sousa Lobo, J.M. Modeling and Comparison of Dissolution Profiles. Eur. J. Pharm. Sci. 2001, 13, 123–133. [Google Scholar] [CrossRef] [PubMed]
- Morsy, M.A.; Abdel-Latif, R.G.; Nair, A.B.; Venugopala, K.N.; Ahmed, A.F.; Elsewedy, H.S.; Shehata, T.M. Preparation and Evaluation of Atorvastatin-Loaded Nanoemulgel on Wound-Healing Efficacy. Pharmaceutics 2019, 11, 609. [Google Scholar] [CrossRef] [PubMed]
- Asfour, M.H.; Elmotasem, H.; Mostafa, D.M.; Salama, A.A.A. Chitosan Based Pickering Emulsion as a Promising Approach for Topical Application of Rutin in a Solubilized Form Intended for Wound Healing: In Vitro and in Vivo Study. Int. J. Pharm. 2017, 534, 325–338. [Google Scholar] [CrossRef]
- Karimi, M.; Gheybi, F.; Zamani, P.; Mashreghi, M.; Golmohammadzadeh, S.; Darban, S.A.; Badiee, A.; Jaafari, M.R. Preparation and Characterization of Stable Nanoliposomal Formulations of Curcumin with High Loading Efficacy: In Vitro and in Vivo Anti-Tumor Study. Int. J. Pharm. 2020, 580, 119211. [Google Scholar] [CrossRef]


| Independent Variables | Optimized Level | Dependent Variables | Predicted Values | Experimental Values |
|---|---|---|---|---|
| DOTAP (mg) | 7.36% | %EE | 93.25 | 95.6 ± 4.2 |
| Span 80 (%w/w) | 2.36 | Particle size (nm) | 187.75 | 190.3 ± 3.3 |
| Cholesterol (mg) | 99.78 | Zeta potential (mV) | 15.86 | 16.56 ± 2.5 |
| Kinetic Model | |||||
|---|---|---|---|---|---|
| Formulation | Parameters | Zero-Order | First-Order | Higuchi | Korsmeyer-Peppas |
| Free-SIM gel | R2 | 0.7616 | 0.7756 | 0.9254 | 0.9727 |
| K | 0.2331 | 0.0331 | 2.4072 | 16.5433 | |
| n | − | − | − | 0.1732 | |
| Optimized SIM-loaded liposomes | R2 | 0.1670 | 0.9341 | 0.9961 | 0.9781 |
| K | 0.1467 | 0.0013 | 1.6091 | 6.3751 | |
| n | − | − | − | 0.2561 | |
| Optimized SIM–liposome gel | R2 | 0.7241 | 0.7408 | 0.9152 | 0.9536 |
| K | 0.04828 | 0.0005 | 0.4351 | 6.2619 | |
| n | − | − | − | 0.1641 | |
| Groups | Wound Healing Process | Healing Process | ||||||||
|---|---|---|---|---|---|---|---|---|---|---|
| S | RE | U | C | MNC | NV | PMN | I | P | R | |
| Optimized Liposome-gel | ++ | ++ | ++/+++ | ++ | +/+++ | ++/+++ | ++/+++ | ++/+++ | +++ | ++/+++ |
| SIM-gel free | ++ | ++ | ++/+++ | ++ | ++/+++ | +/++ | ++/+++ | ++ | ++ | −/+ |
| Positive control | ++ | − | ++ | ++ | +/++ | ++ | +/++ | ++ | ++ | − |
| Negative control | + | − | ++ | + | +/++ | + | + | + | + | − |
| Time (Days) | Storage Temperature | ||||||||
|---|---|---|---|---|---|---|---|---|---|
| 4 °C | 25 °C | 35 °C | |||||||
| Particle Size (nm) * | Zeta Potential (mV) * | Entrapment Efficiency (%) * | Particle Size (nm) * | Zeta Potential (mV) * | Entrapment Efficiency (%) * | Particle Size (nm) * | Zeta Potential (mV) * | Entrapment Efficiency (%) * | |
| 0 | 190.3 ± 5.3 | +16.56 ± 2.2 | 95.6 ± 4.2 | 183.3 ± 7.3 | +18.32 ± 4.2 | 93.4 ± 6.2 | 194.4 ± 6.3 | +17.71 ± 4.1 | 94.7 ± 5.6 |
| 15 | 195.6 ± 3.1 | +14.72 ± 4.7 | 93.2 ± 6.7 | 186.9 ± 4.1 | +16.67 ± 8.3 | 91.3 ± 8.4 | 204.3 ± 4.2 | +15.41 ± 3.6 | 92.4 ± 7.9 |
| 30 | 194.7 ± 8.3 | +15.33 ± 9.4 | 91.4 ± 3.5 | 188.4 ± 6.2 | +14.21 ± 7.4 | 88.3 ± 7.2 | 205.4 ± 8.4 | +14.64 ± 8.1 | 89.2 ± 3.2 |
| 60 | 196.9 ± 4.7 | +13.52 ± 3.7 | 90.7 ± 5.1 | 190.21 ± 3.1 | +11.42 ± 9.2 | 86.4 ± 9.4 | 201.4 ± 6.7 | +11.45 ± 7.3 | 86.7 ± 8.6 |
| 90 | 193.2 ± 6.2 | +12.81 ± 7.5 | 89.4 ± 6.8 | 195 ± 7.5 | +8.84 ± 3.2 | 85.3 ± 4.2 | 212.4 ± 3.2 | +7.71 ± 9.4 | 85.4 ± 4.7 |
| Dependent Variables with Their Limitations, along with Independent Variables with Their Level | ||
|---|---|---|
| Variables | Level | |
| Low [−1] | High [+1] | |
| Independent variables | ||
| DOTAP (mg) | 2.5 | 7.5 |
| Span 80 (%) | 2.5 | 7.5 |
| Cholesterol (mg) | 80 | 120 |
| Dependent variables | ||
| Zeta Potential [mV] | Maximize | |
| Entrapment Efficacy [%] | Maximize | |
| Particle size [nm] | Minimize | |
| Runs | Factor 1 A: DOTAP mg | Factor 2 B: Span 80 %w/w | Factor 3 C: Cholesterol mg | RESPONSE 1 Zeta Potential mV | Response 2 Entrapment Efficacy (%) | Response 3 Particle Size nm |
|---|---|---|---|---|---|---|
| F-1 | 2.5 | 5 | 80 | −1.45 ± 1.53 | 87.09 ± 2.21 | 170.2 ± 3.62 |
| F-2 | 5 | 7.5 | 80 | 4.22 ± 1.82 | 83.67 ± 3.74 | 150.5 ± 5.55 |
| F-3 | 5 | 7.5 | 120 | 3.56 ± 1.46 | 80.32 ± 4.95 | 350.2 ± 5.47 |
| F-4 | 5 | 2.5 | 120 | 4.5 ± 1.73 | 96.32 ± 2.43 | 370.4 ± 6.89 |
| F-5 | 5 | 2.5 | 80 | 5.26 ± 1.87 | 94.93 ± 3.77 | 160.7 ± 3.11 |
| F-6 | 5 | 5 | 100 | 7.32 ± 1.92 | 86.34 ± 3.82 | 245.6 ± 2.32 |
| F-7 | 7.5 | 2.5 | 100 | 16.56 ± 2.51 | 95.6 ± 4.21 | 190.3 ± 3.34 |
| F-8 | 5 | 5 | 100 | 6.54 ± 1.55 | 88.34 ± 2.16 | 245.5 ± 4.26 |
| F-9 | 7.5 | 5 | 80 | 14.23 ± 2.72 | 86.54 ± 3.45 | 140.9 ± 3.53 |
| F-10 | 2.5 | 7.5 | 100 | −3.62 ± 1.91 | 80.34 ± 2.51 | 280.3 ± 6.72 |
| F-11 | 7.5 | 5 | 120 | 13.24 ± 2.25 | 87.34 ± 3.35 | 376.3 ± 7.81 |
| F-12 | 5 | 5 | 100 | 2.245 ± 1.86 | 89.5 ± 4.72 | 270 ± 4.21 |
| F-13 | 2.5 | 5 | 120 | −4.342 ± 1.47 | 87.65 ± 3.96 | 360.5 ± 7.14 |
| F-14 | 2.5 | 2.5 | 100 | −2.123 ± 1.23 | 95.43 ± 5.28 | 235.4 ± 3.52 |
| F-15 | 7.5 | 7.5 | 100 | 12.23 ± 2.57 | 81.23 ± 2.51 | 244.7 ± 4.85 |
Disclaimer/Publisher’s Note: The statements, opinions and data contained in all publications are solely those of the individual author(s) and contributor(s) and not of MDPI and/or the editor(s). MDPI and/or the editor(s) disclaim responsibility for any injury to people or property resulting from any ideas, methods, instructions or products referred to in the content. |
© 2024 by the authors. Licensee MDPI, Basel, Switzerland. This article is an open access article distributed under the terms and conditions of the Creative Commons Attribution (CC BY) license (https://creativecommons.org/licenses/by/4.0/).
Share and Cite
Rahamathulla, M.; Pokale, R.; Al-ebini, Y.; Osmani, R.A.M.; Thajudeen, K.Y.; Gundawar, R.; Ahmed, M.M.; Farhana, S.A.; Shivanandappa, T.B. Simvastatin-Encapsulated Topical Liposomal Gel for Augmented Wound Healing: Optimization Using the Box-Behnken Model, Evaluations, and In Vivo Studies. Pharmaceuticals 2024, 17, 697. https://doi.org/10.3390/ph17060697
Rahamathulla M, Pokale R, Al-ebini Y, Osmani RAM, Thajudeen KY, Gundawar R, Ahmed MM, Farhana SA, Shivanandappa TB. Simvastatin-Encapsulated Topical Liposomal Gel for Augmented Wound Healing: Optimization Using the Box-Behnken Model, Evaluations, and In Vivo Studies. Pharmaceuticals. 2024; 17(6):697. https://doi.org/10.3390/ph17060697
Chicago/Turabian StyleRahamathulla, Mohamed, Rahul Pokale, Yousef Al-ebini, Riyaz Ali M. Osmani, Kamal Y. Thajudeen, Ravi Gundawar, Mohammed Muqtader Ahmed, Syeda Ayesha Farhana, and Thippeswamy Boreddy Shivanandappa. 2024. "Simvastatin-Encapsulated Topical Liposomal Gel for Augmented Wound Healing: Optimization Using the Box-Behnken Model, Evaluations, and In Vivo Studies" Pharmaceuticals 17, no. 6: 697. https://doi.org/10.3390/ph17060697