
A Machine Learning Approach for Predicting Caco-2 Cell Permeability in Natural Products from the Biodiversity in Peru
 ,
,
Abstract
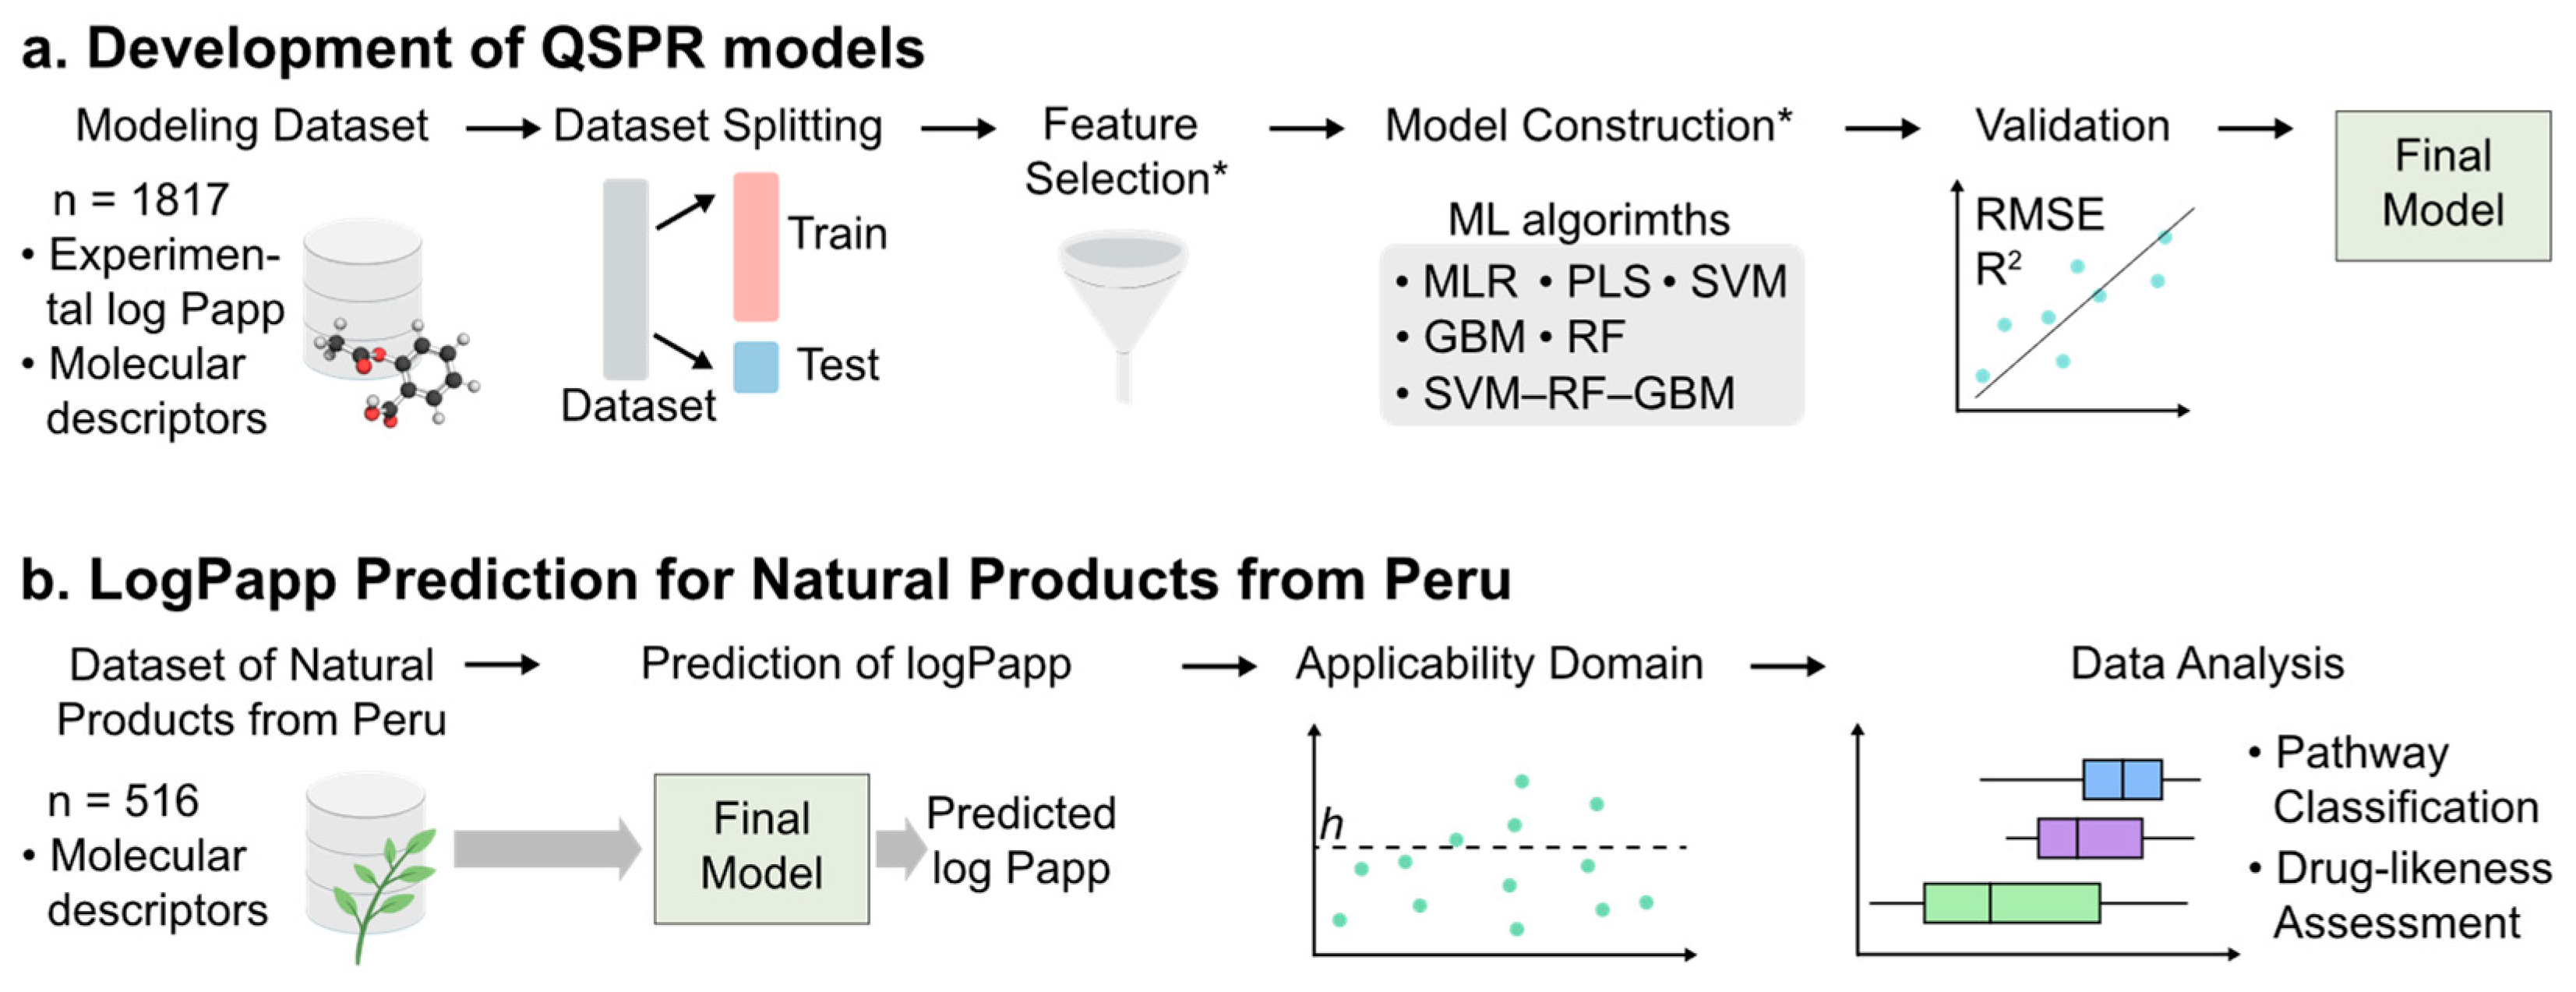
:1. Introduction
2. Results and Discussion
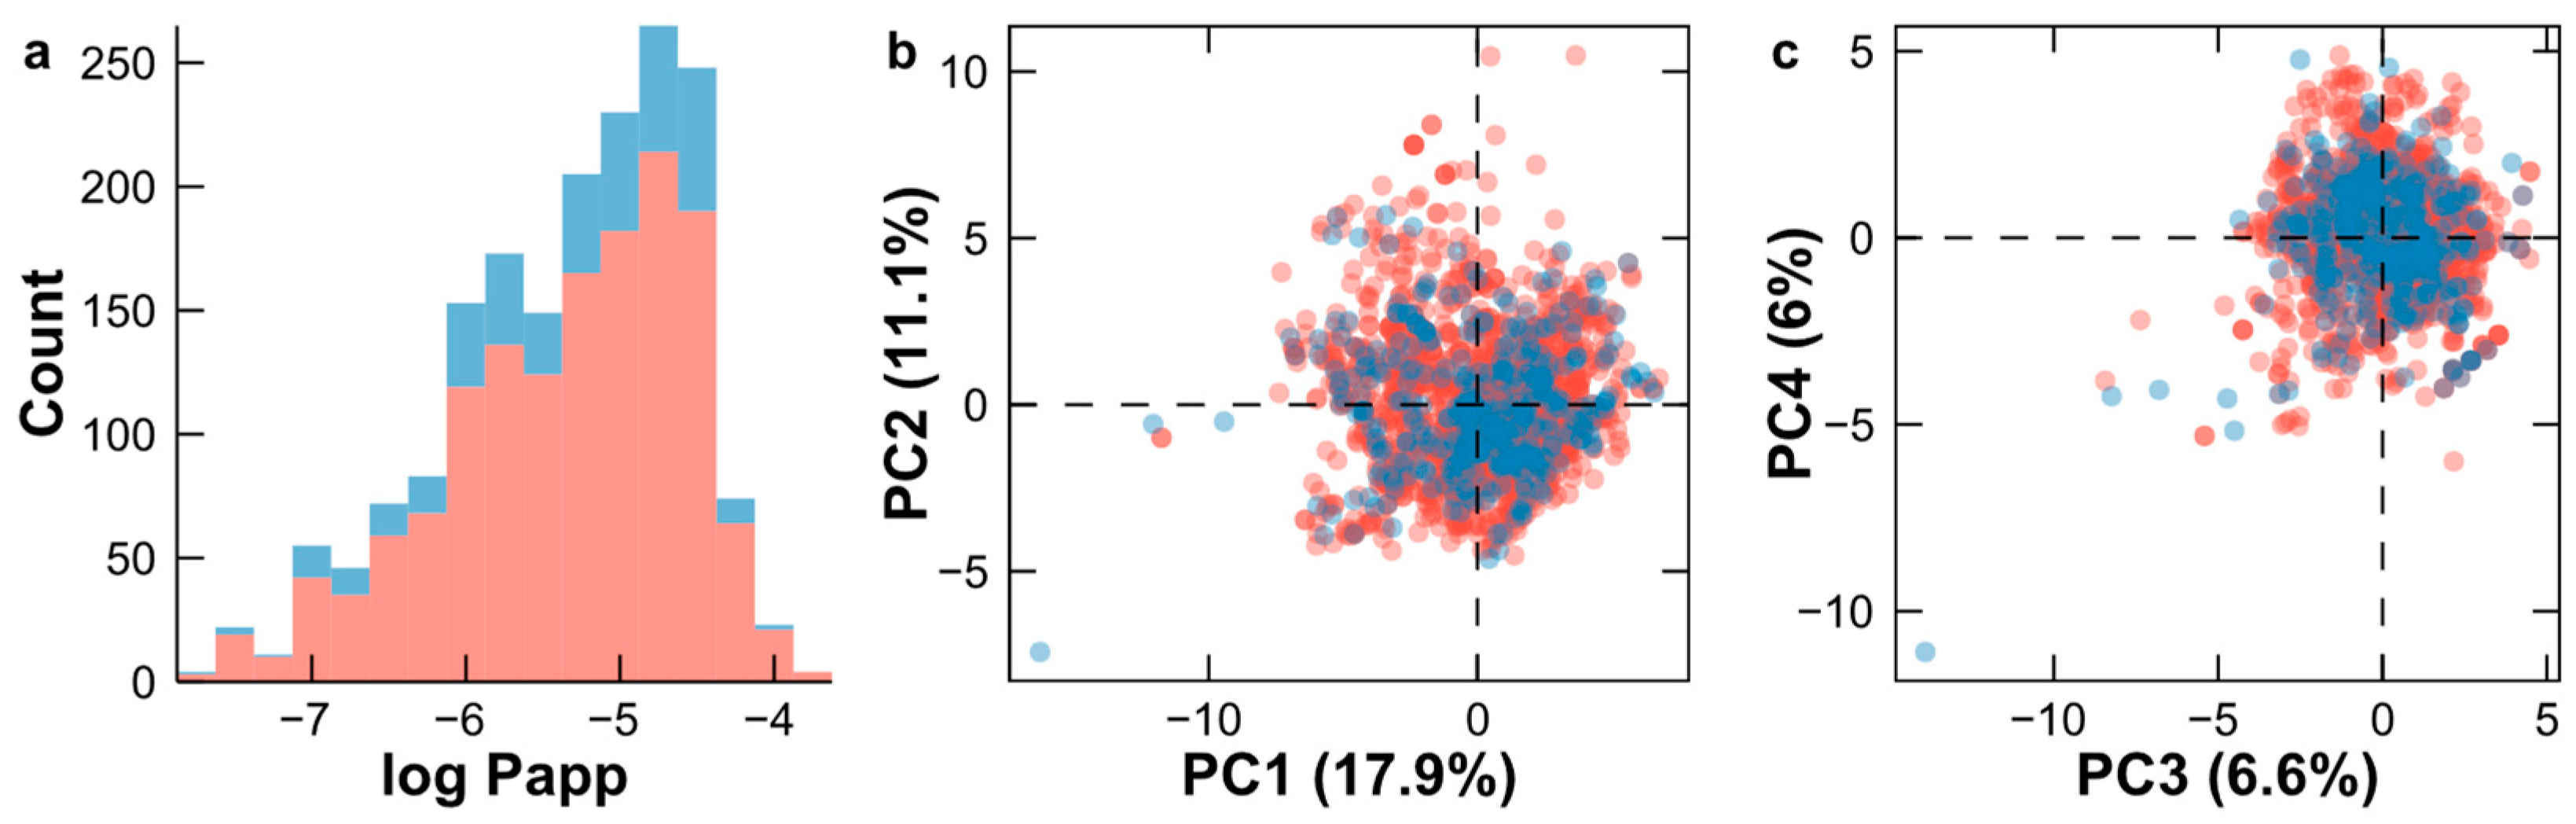
2.1. Analysis of the Datasets
2.2. Feature Selection and Development of QSPR Models
2.3. Mechanism Interpretation
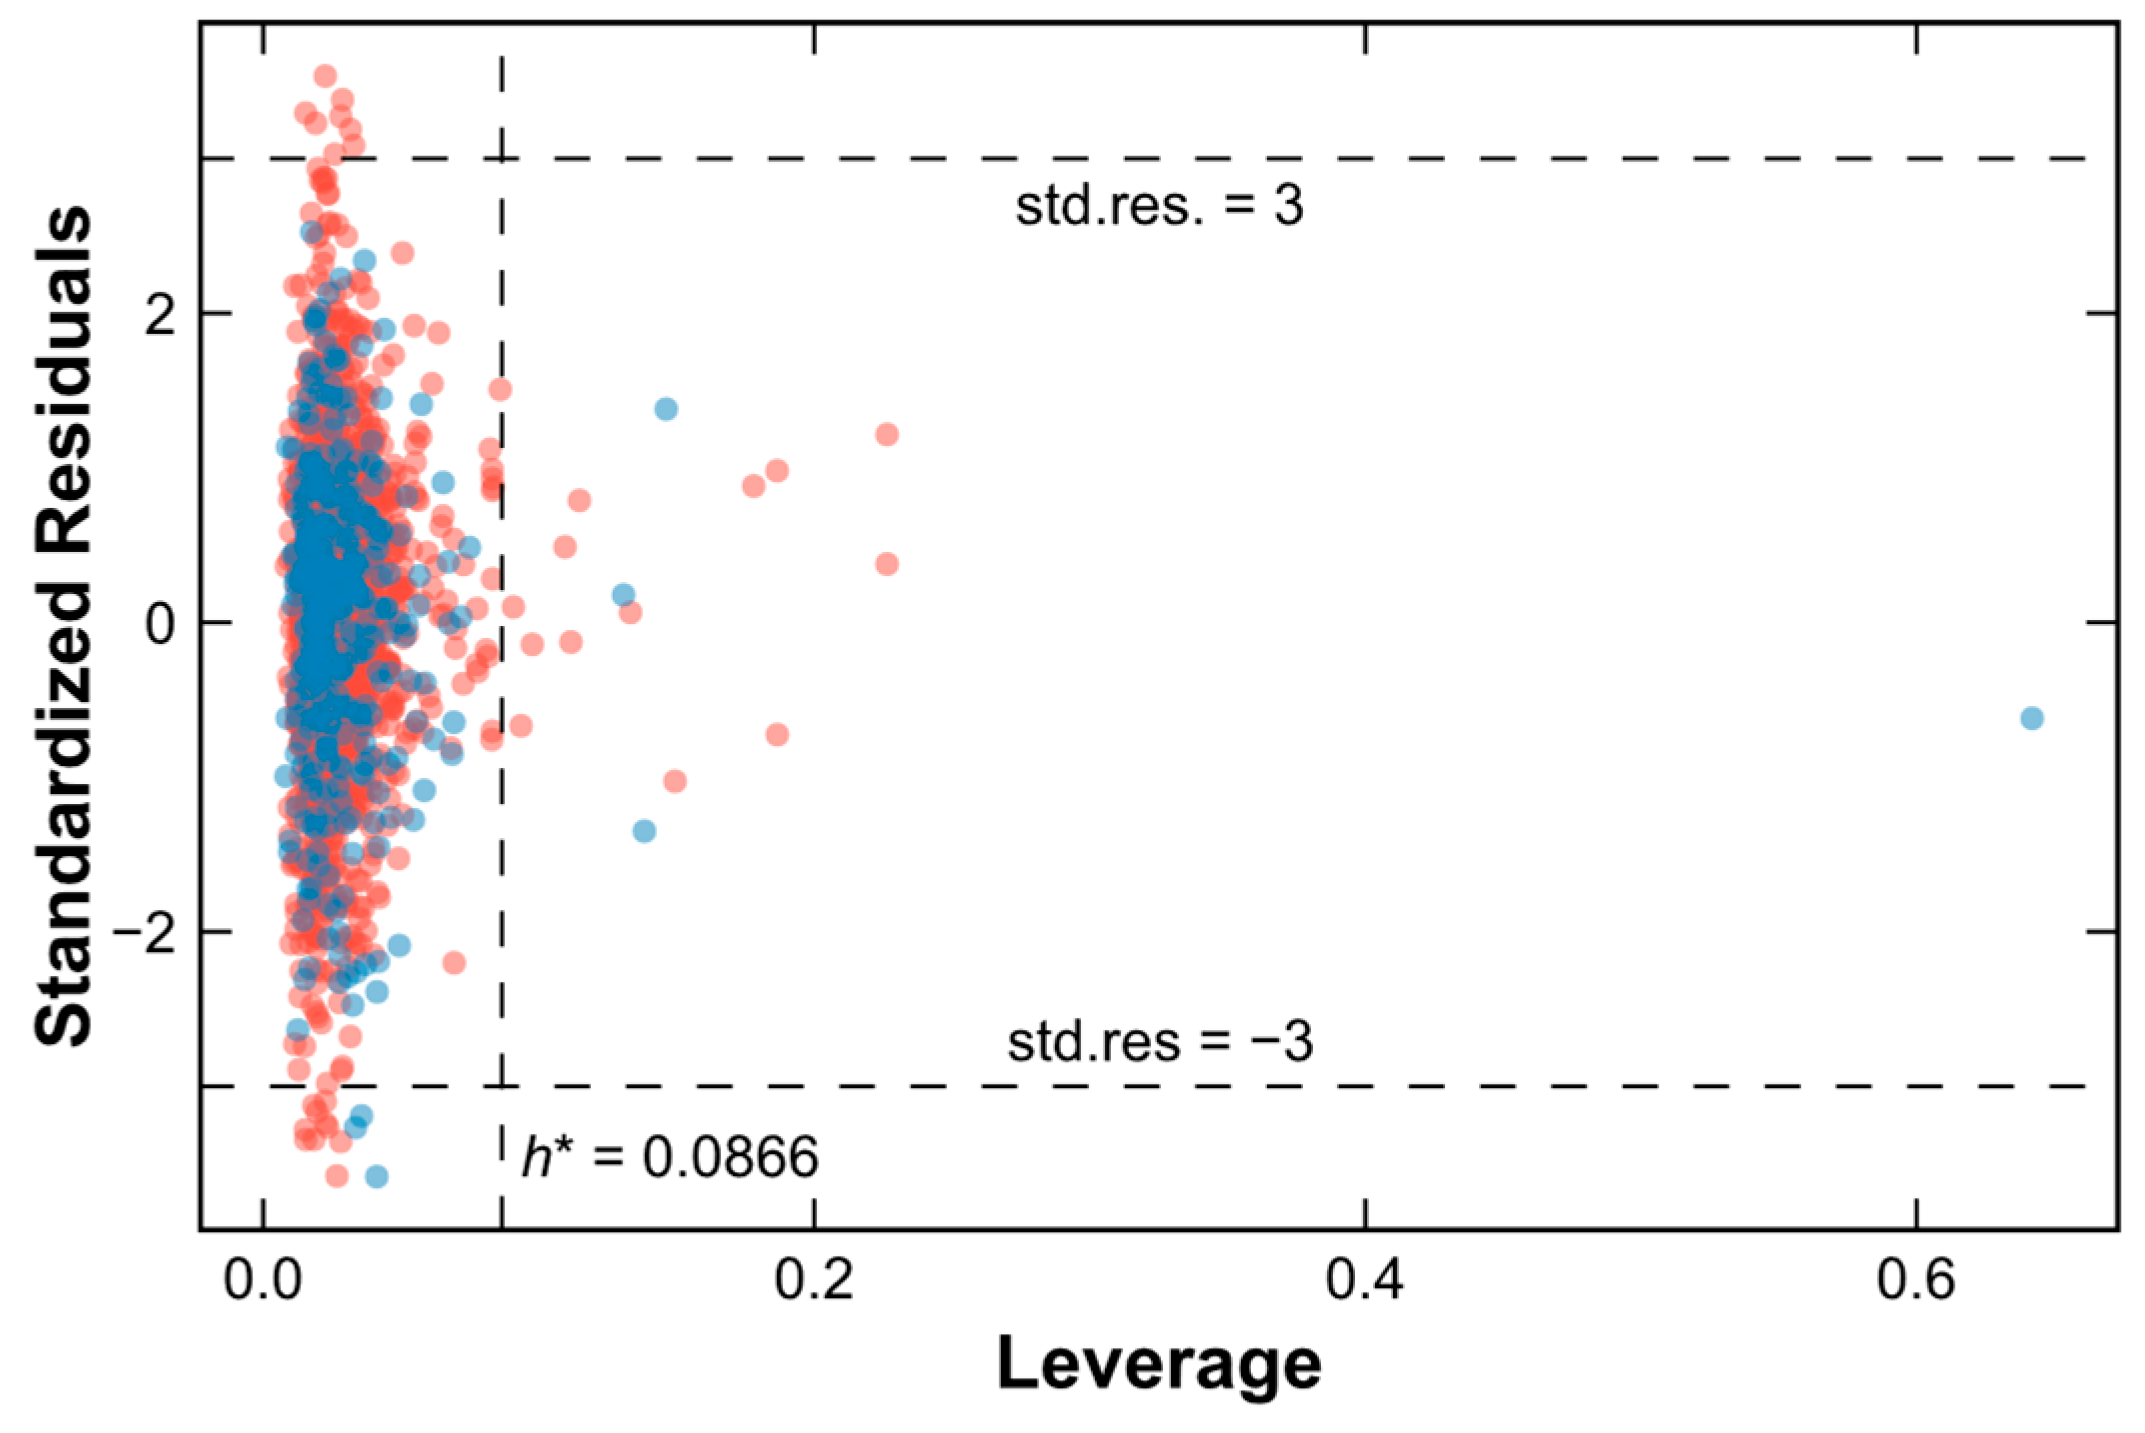
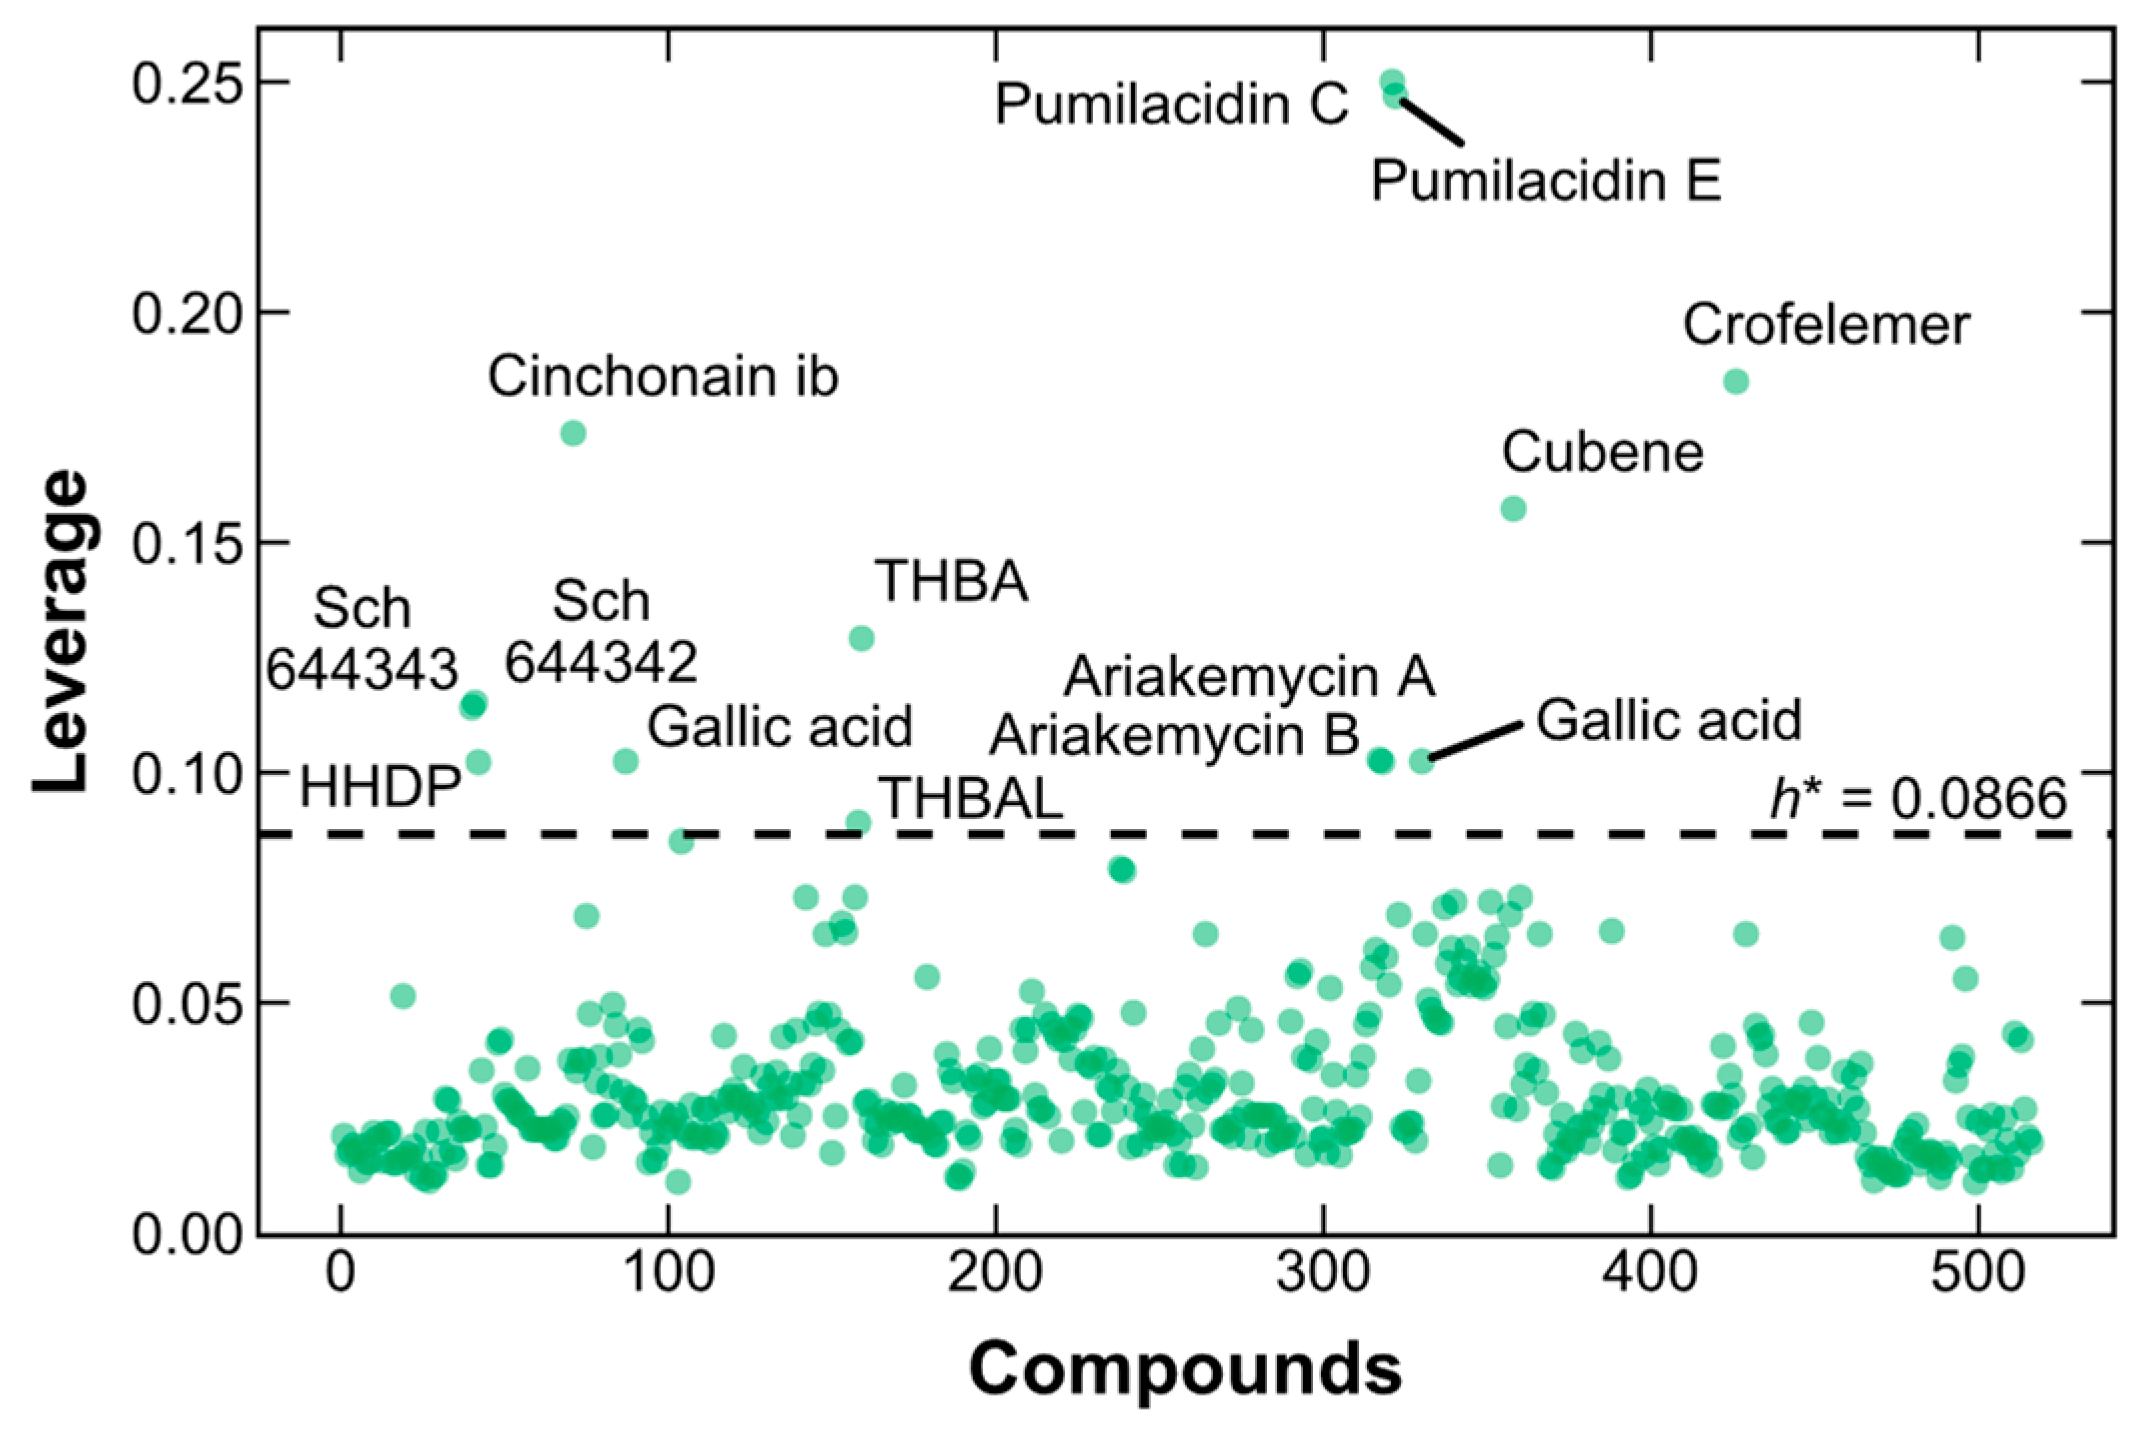
2.4. Applicability Domain of the SVM–RF–GBM Model
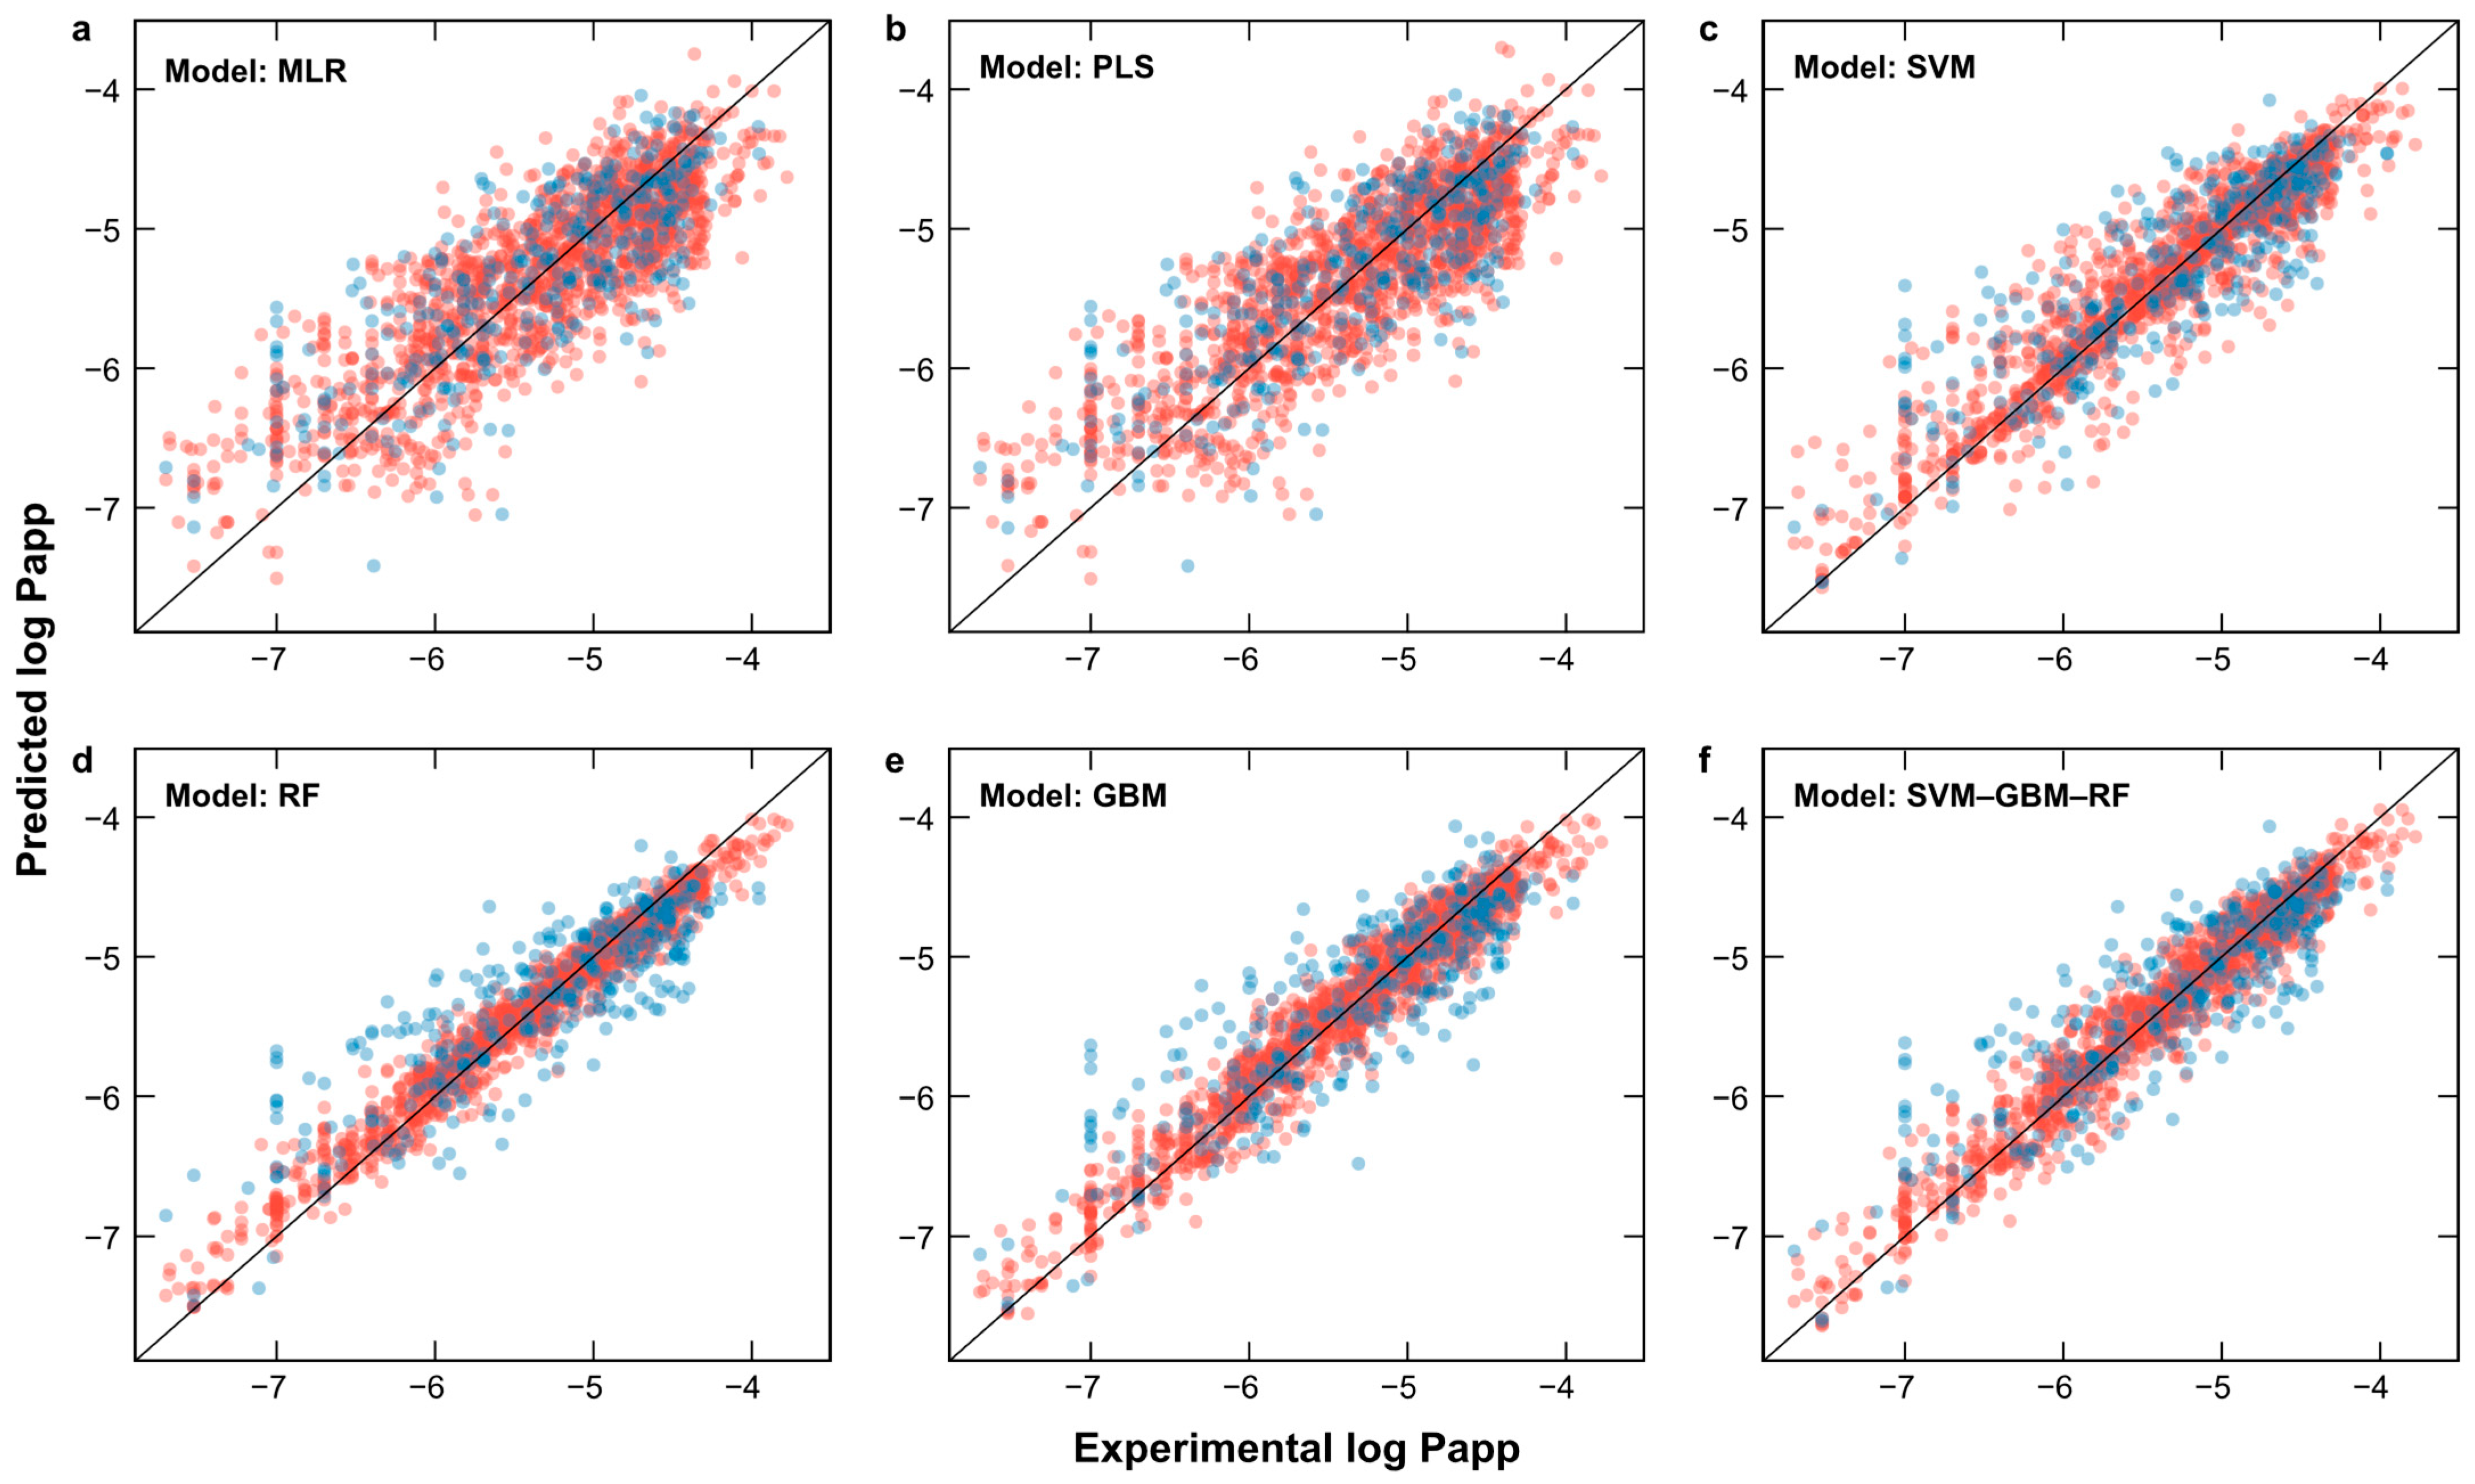
2.5. Comparative Analysis of the SVM–RF–GBM Model and the Other Models
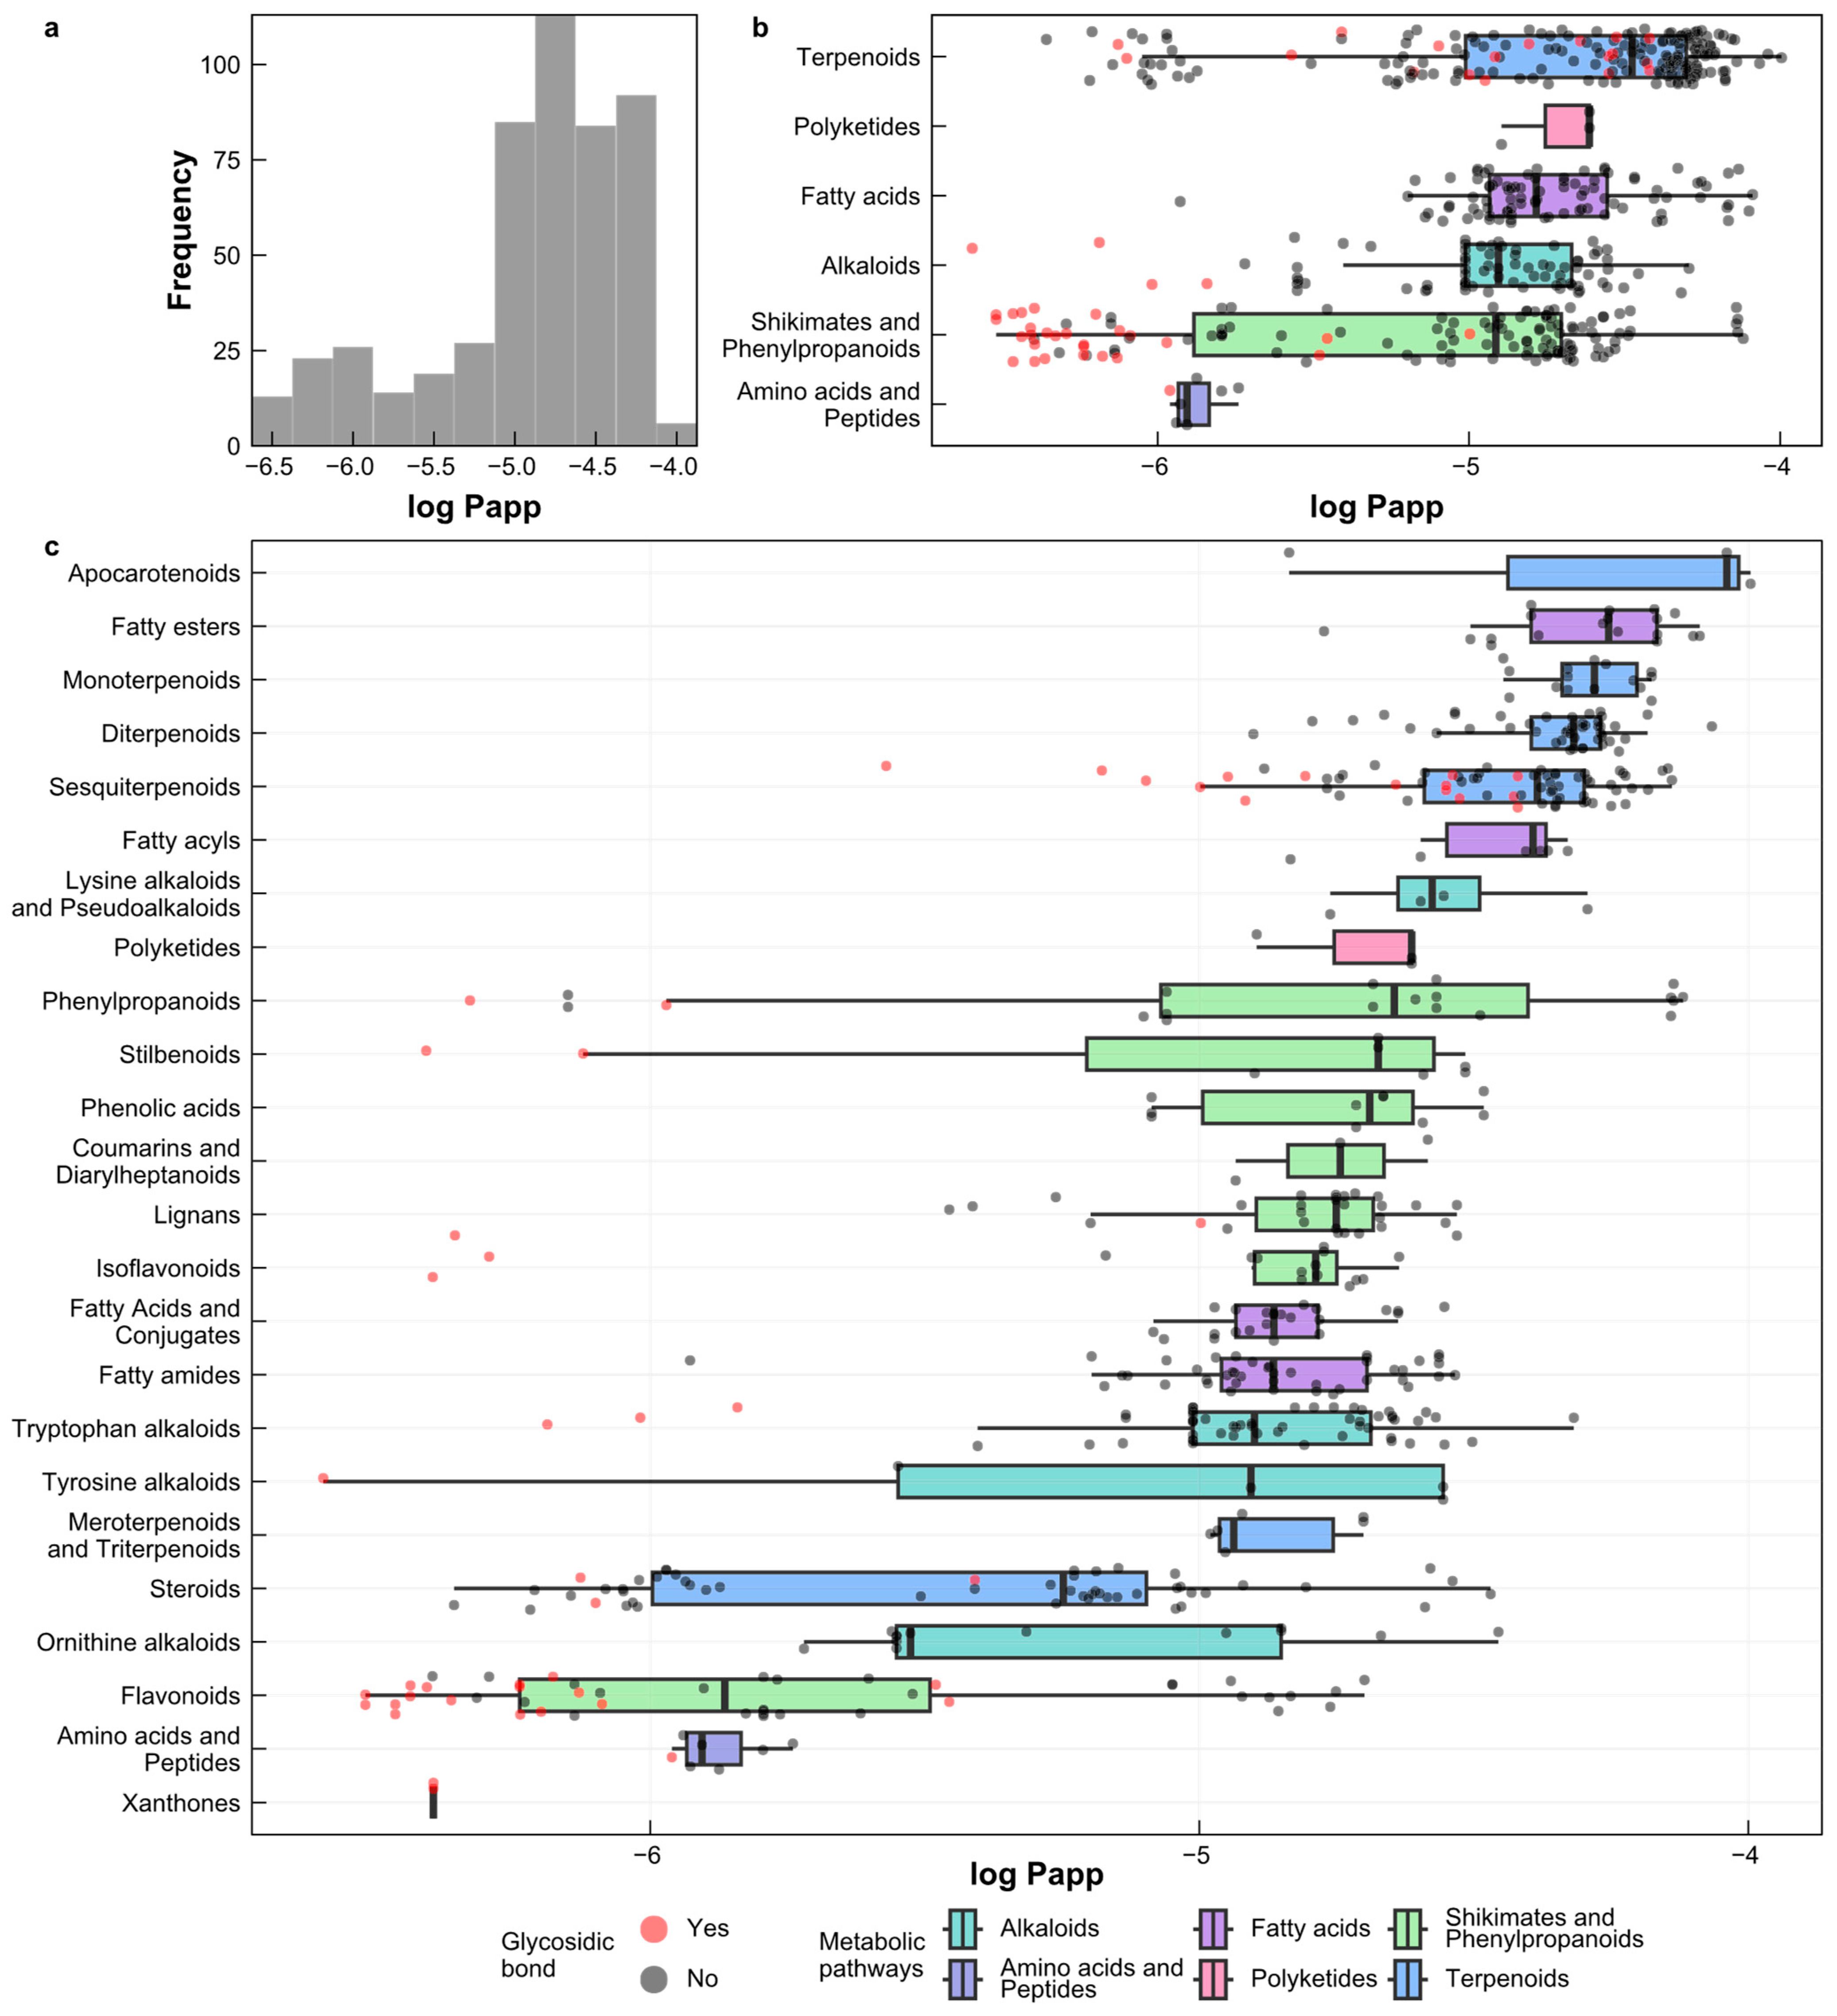
2.6. Prediction of Log Papp Values for Natural Products from Peru
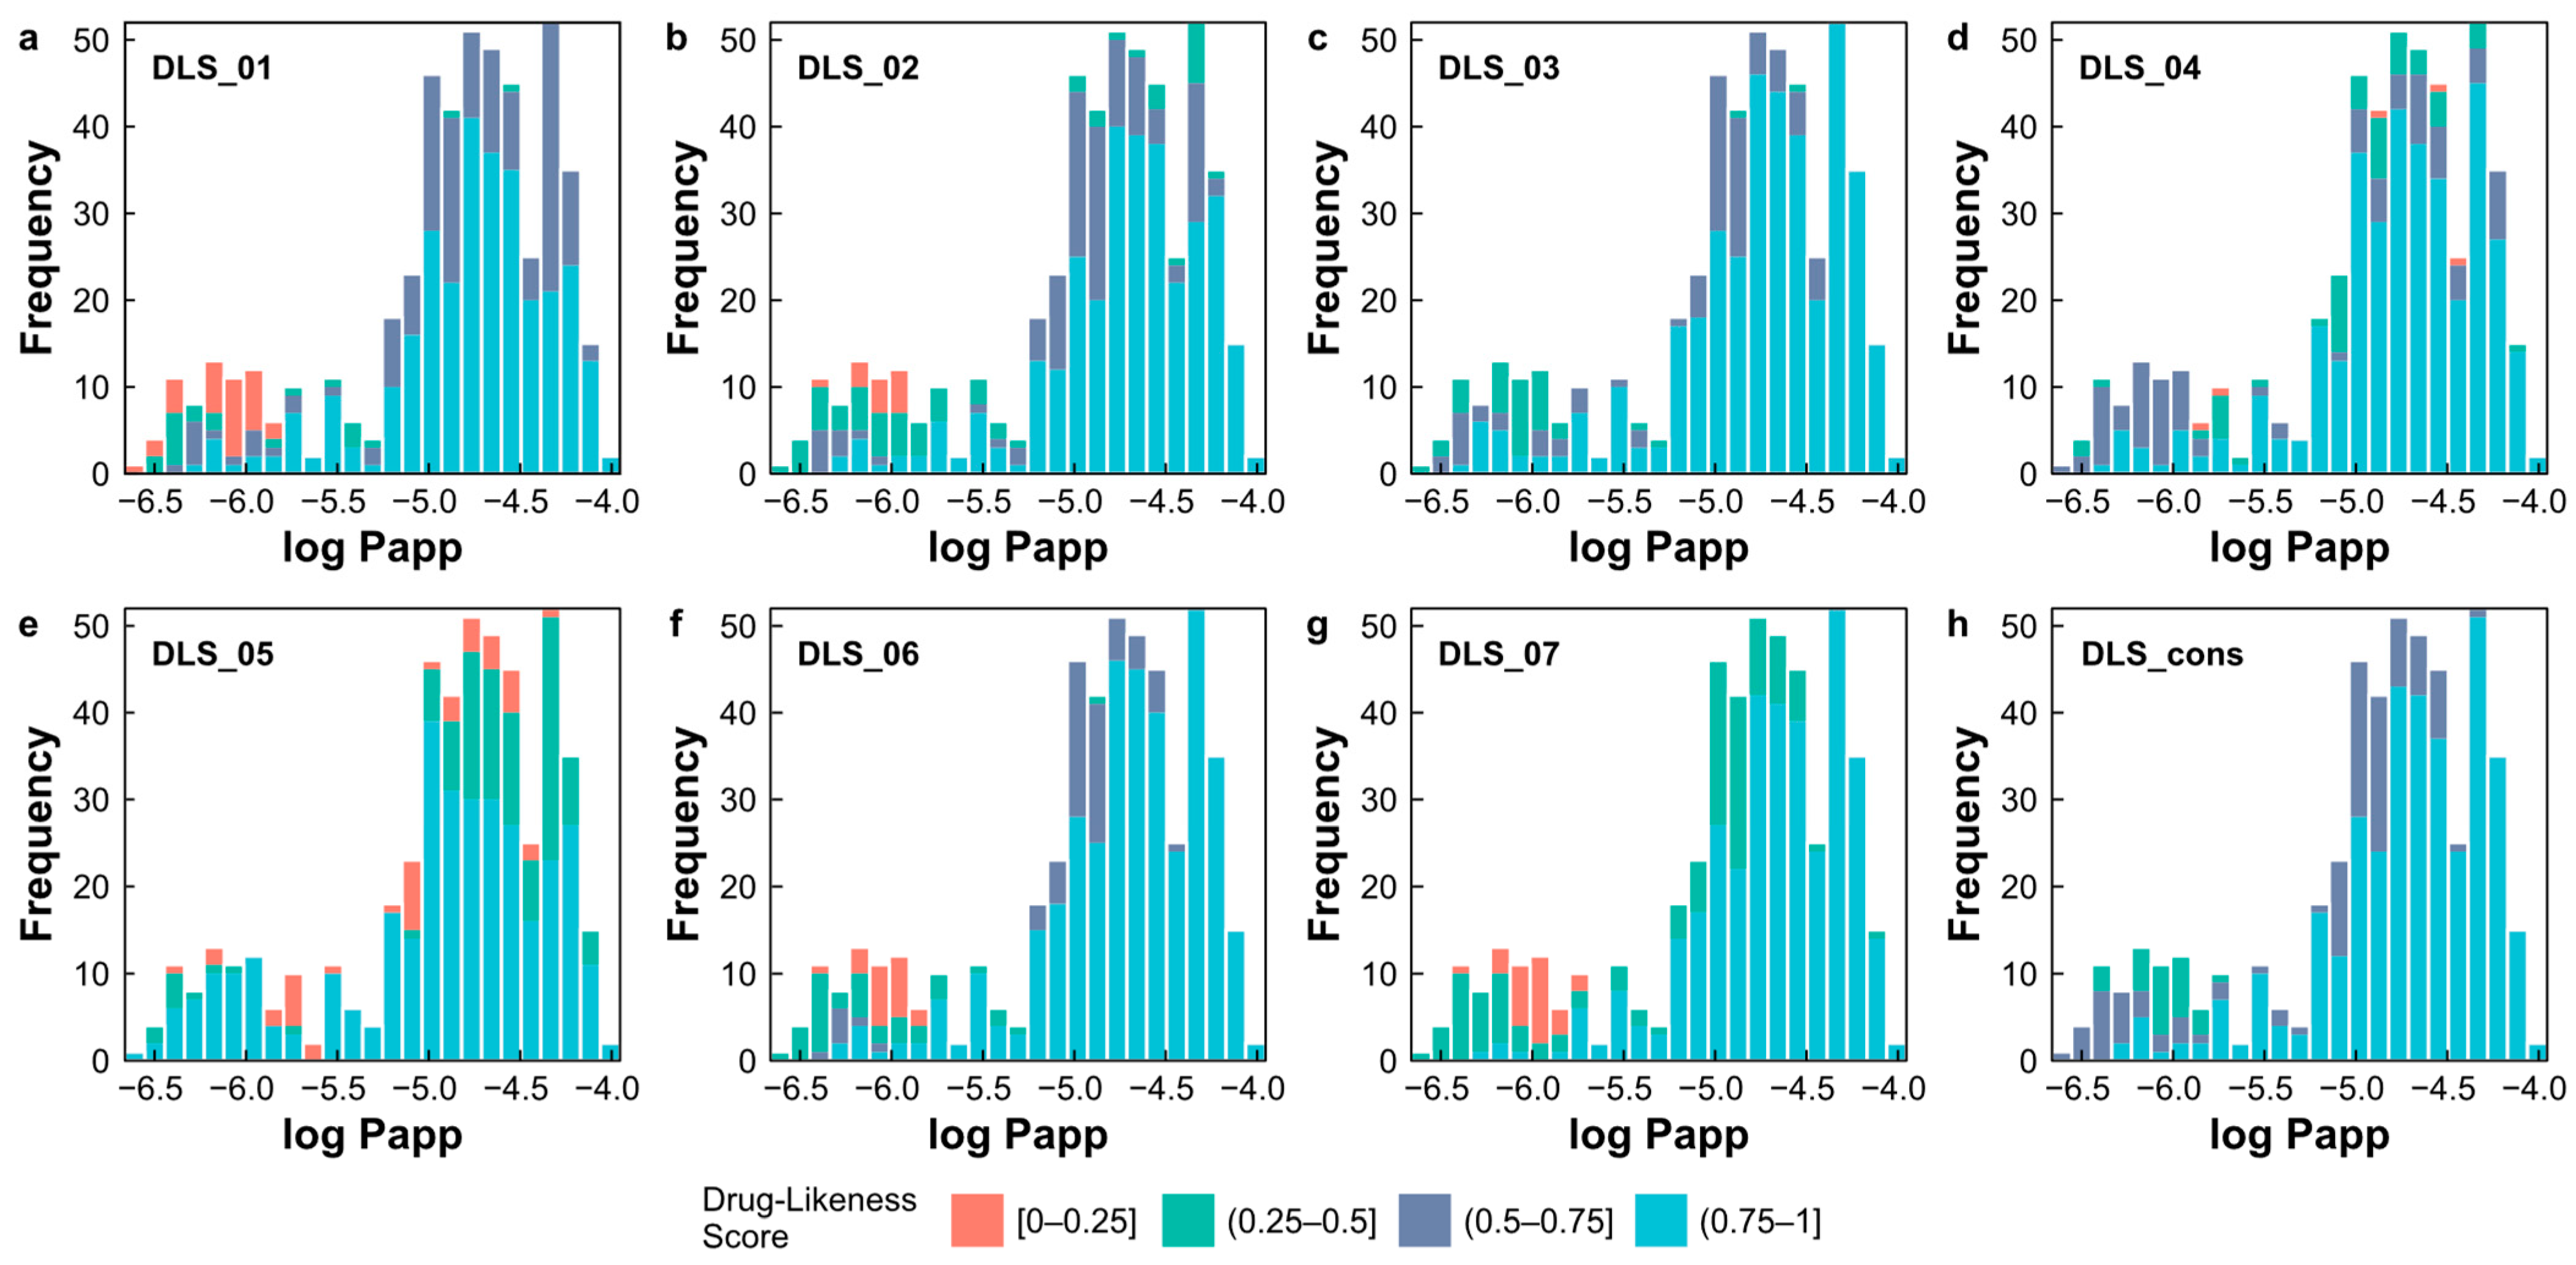
2.7. Evaluation of Drug-Likeness of Natural Products
- DLS_01 is derived from a modified version of Ro5 [36], comprising four rules, according to Equation (1);
- DLS_02 is defined by six rules, including a HBD ≤ 5, a HBA in the range 1–8, an MW in the range 200–450, an MlogP in the range −2.0–4.5, an RBN in the range from 1–9, and the number of rings ≤ 5 [39];
- DLS_03 incorporates criteria such as a HBD ≤ 5, a HBA ≤ 10, an MW from 200 to 500, an MlogP in the range −5.0–5.0, an RBN ≤ 8, and a formal charge in the range −2–2 [40];
- DLS_04 is defined by parameters including a HBD ≤ 5, a HBA in the range 2–10, an MW in the range 78–500, an MlogP in the range −0.5–5.0, the ratio of the number of Csp3 atoms to the total number of non-halogen atoms in the range 0.15–0.8, the ratio of the number of hydrogen atoms to the total number of non-halogen atoms in the range 0.6–1.6, and the ratio of molecular unsaturation (Unsat-p) in the range 0.10–0.45 [41];
- DLS_05 relies on criteria such as the ratio of the total number of oxygen and nitrogen atoms and the number of Csp3 atoms in the range 0.10–1.80, and a descriptor Unsat-p ≤ 0.43 [42];
- DLS_06 is based on a HBD ≤ 5, a HBA ≤ 10, an MW ≤ 500, an MlogP ≤ 5, an RBN ≤ 10, and a TPSA ≤ 140 [43];
- DLS_07 is based on the criteria of an RBN ≤ 10, and a TPSA ≤ 140 [37];
- DLS_cons represents the average drug-likeness score obtained from the previously described criteria.
3. Materials and Methods
3.1. Data Collection
3.2. The Calculation and Optimization of the 3D Structure
3.3. Molecular Descriptor Calculation
3.4. Splitting of the Dataset
3.5. Preprocessing
3.6. Feature Selection
3.7. Modeling
3.8. Model Validation
3.9. Applicability Domain
3.10. Computational Processing
4. Conclusions
Supplementary Materials
Author Contributions
Funding
Institutional Review Board Statement
Informed Consent Statement
Data Availability Statement
Acknowledgments
Conflicts of Interest
References
- MINAM. Estrategia Nacional de Diversidad Biológica al 2021 (Plan de Acción 2014–2018); MINAM: Lima, Peru, 2014.
- Acosta, S.; Meléndez, C. Catálogo Florístico de Plantas Medicinales Peruanas; Centro Nacional De Salud Intercultural, Instituto Nacional De Salud: Lima, Peru, 2013. [Google Scholar]
- García Giménez, D.; García Prado, E.; Sáenz Rodríguez, T.; Fernández Arche, A.; De la Puerta, R. Cytotoxic Effect of the Pentacyclic Oxindole Alkaloid Mitraphylline Isolated from Uncaria Tomentosa Bark on Human Ewing’s Sarcoma and Breast Cancer Cell Lines. Planta Med. 2010, 76, 133–136. [Google Scholar] [CrossRef] [PubMed]
- Wang, S.; Zhu, F.; Kakuda, Y. Sacha Inchi (Plukenetia volubilis L.): Nutritional Composition, Biological Activity, and Uses. Food Chem. 2018, 265, 316–328. [Google Scholar] [CrossRef] [PubMed]
- Guillen Quispe, Y.; Hwang, S.; Wang, Z.; Zuo, G.; Lim, S. Screening In Vitro Targets Related to Diabetes in Herbal Extracts from Peru: Identification of Active Compounds in Hypericum laricifolium Juss. by Offline High-Performance Liquid Chromatography. Int. J. Mol. Sci. 2017, 18, 2512. [Google Scholar] [CrossRef] [PubMed]
- Ahmed, I.; Leach, D.N.; Wohlmuth, H.; De Voss, J.J.; Blanchfield, J.T. Caco-2 Cell Permeability of Flavonoids and Saponins from Gynostemma pentaphyllum: The Immortal Herb. ACS Omega 2020, 5, 21561–21569. [Google Scholar] [CrossRef] [PubMed]
- Firenzuoli, F.; Gori, L. Herbal Medicine Today: Clinical and Research Issues. Evid.-Based Complement. Altern. Med. 2007, 4, 37–40. [Google Scholar] [CrossRef] [PubMed]
- Bernardini, S.; Tiezzi, A.; Laghezza Masci, V.; Ovidi, E. Natural Products for Human Health: An Historical Overview of the Drug Discovery Approaches. Nat. Prod. Res. 2018, 32, 1926–1950. [Google Scholar] [CrossRef] [PubMed]
- Dias, D.A.; Urban, S.; Roessner, U. A Historical Overview of Natural Products in Drug Discovery. Metabolites 2012, 2, 303–336. [Google Scholar] [CrossRef] [PubMed]
- Pilon, A.C.; Valli, M.; Dametto, A.C.; Pinto, M.E.F.; Freire, R.T.; Castro-Gamboa, I.; Andricopulo, A.D.; Bolzani, V.S. NuBBEDB: An Updated Database to Uncover Chemical and Biological Information from Brazilian Biodiversity. Sci. Rep. 2017, 7, 7215. [Google Scholar] [CrossRef]
- Li, J.; Larregieu, C.A.; Benet, L.Z. Classification of Natural Products as Sources of Drugs According to the Biopharmaceutics Drug Disposition Classification System (BDDCS). Chin. J. Nat. Med. 2016, 14, 888–897. [Google Scholar] [CrossRef]
- Kim, H.W.; Wang, M.; Leber, C.A.; Nothias, L.-F.; Reher, R.; Kang, K.B.; van der Hooft, J.J.J.; Dorrestein, P.C.; Gerwick, W.H.; Cottrell, G.W. NPClassifier: A Deep Neural Network-Based Structural Classification Tool for Natural Products. J. Nat. Prod. 2021, 84, 2795–2807. [Google Scholar] [CrossRef]
- Ménard, S.; Cerf-Bensussan, N.; Heyman, M. Multiple Facets of Intestinal Permeability and Epithelial Handling of Dietary Antigens. Mucosal Immunol. 2010, 3, 247–259. [Google Scholar] [CrossRef]
- Xu, Y.; Shrestha, N.; Préat, V.; Beloqui, A. An Overview of in Vitro, Ex Vivo and in Vivo Models for Studying the Transport of Drugs across Intestinal Barriers. Adv. Drug Deliv. Rev. 2021, 175, 113795. [Google Scholar] [CrossRef] [PubMed]
- Bischoff, S.C.; Barbara, G.; Buurman, W.; Ockhuizen, T.; Schulzke, J.-D.; Serino, M.; Tilg, H.; Watson, A.; Wells, J.M. Intestinal Permeability—A New Target for Disease Prevention and Therapy. BMC Gastroenterol. 2014, 14, 189. [Google Scholar] [CrossRef] [PubMed]
- Dahlgren, D.; Lennernäs, H. Intestinal Permeability and Drug Absorption: Predictive Experimental, Computational and In Vivo Approaches. Pharmaceutics 2019, 11, 411. [Google Scholar] [CrossRef] [PubMed]
- Cabrera-Pérez, M.Á.; Pham-The, H. Computational Modeling of Human Oral Bioavailability: What Will Be Next? Expert. Opin. Drug Discov. 2018, 13, 509–521. [Google Scholar] [CrossRef] [PubMed]
- Amidon, G.L.; Lennernäs, H.; Shah, V.P.; Crison, J.R. A Theoretical Basis for a Biopharmaceutic Drug Classification: The Correlation of in Vitro Drug Product Dissolution and in Vivo Bioavailability. Pharm. Res. 1995, 12, 413–420. [Google Scholar] [CrossRef] [PubMed]
- Larregieu, C.A.; Benet, L.Z. Distinguishing between the Permeability Relationships with Absorption and Metabolism to Improve BCS and BDDCS Predictions in Early Drug Discovery. Mol. Pharm. 2014, 11, 1335–1344. [Google Scholar] [CrossRef]
- Lanevskij, K.; Didziapetris, R. Physicochemical QSAR Analysis of Passive Permeability Across Caco-2 Monolayers. J. Pharm. Sci. 2019, 108, 78–86. [Google Scholar] [CrossRef] [PubMed]
- Wang, N.-N.; Dong, J.; Deng, Y.-H.; Zhu, M.-F.; Wen, M.; Yao, Z.-J.; Lu, A.-P.; Wang, J.-B.; Cao, D.-S. ADME Properties Evaluation in Drug Discovery: Prediction of Caco-2 Cell Permeability Using a Combination of NSGA-II and Boosting. J. Chem. Inf. Model. 2016, 56, 763–773. [Google Scholar] [CrossRef]
- Dastmalchi, S.; Hamzeh-Mivehroud, M.; Sokouti, B. Quantitative Structure—Activity Relationship: A Practical Approach; CRC Press, Taylor & Francis Group: Boca Raton, FL, USA, 2018; ISBN 978-0-8153-6209-8. [Google Scholar]
- Vamathevan, J.; Clark, D.; Czodrowski, P.; Dunham, I.; Ferran, E.; Lee, G.; Li, B.; Madabhushi, A.; Shah, P.; Spitzer, M.; et al. Applications of Machine Learning in Drug Discovery and Development. Nat. Rev. Drug Discov. 2019, 18, 463–477. [Google Scholar] [CrossRef]
- Norinder, U.; Österberg, T.; Artursson, P. Theoretical Calculation and Prediction of Caco-2 Cell Permeability Using MolSurf Parametrization and PLS Statistics. Pharm. Res. 1997, 14, 1786–1791. [Google Scholar] [CrossRef]
- Fredlund, L.; Winiwarter, S.; Hilgendorf, C. In Vitro Intrinsic Permeability: A Transporter-Independent Measure of Caco-2 Cell Permeability in Drug Design and Development. Mol. Pharm. 2017, 14, 1601–1609. [Google Scholar] [CrossRef]
- Over, B.; Matsson, P.; Tyrchan, C.; Artursson, P.; Doak, B.C.; Foley, M.A.; Hilgendorf, C.; Johnston, S.E.; Lee, M.D.; Lewis, R.J.; et al. Structural and Conformational Determinants of Macrocycle Cell Permeability. Nat. Chem. Biol. 2016, 12, 1065–1074. [Google Scholar] [CrossRef] [PubMed]
- Sherer, E.C.; Verras, A.; Madeira, M.; Hagmann, W.K.; Sheridan, R.P.; Roberts, D.; Bleasby, K.; Cornell, W.D. QSAR Prediction of Passive Permeability in the LLC-PK1 Cell Line: Trends in Molecular Properties and Cross-Prediction of Caco-2 Permeabilities. Mol. Inf. 2012, 31, 231–245. [Google Scholar] [CrossRef] [PubMed]
- Wang, Y.; Chen, X. QSPR Model for Caco-2 Cell Permeability Prediction Using a Combination of HQPSO and Dual-RBF Neural Network. RSC Adv. 2020, 10, 42938–42952. [Google Scholar] [CrossRef] [PubMed]
- Hubatsch, I.; Ragnarsson, E.G.E.; Artursson, P. Determination of Drug Permeability and Prediction of Drug Absorption in Caco-2 Monolayers. Nat. Protoc. 2007, 2, 2111–2119. [Google Scholar] [CrossRef]
- Hall, L.H.; Mohney, B.; Kier, L.B. The Electrotopological State: An Atom Index for QSAR. Quant. Struct.-Act. Relat. 1991, 10, 43–51. [Google Scholar] [CrossRef]
- Hall, L.H.; Kier, L.B. Electrotopological State Indices for Atom Types: A Novel Combination of Electronic, Topological, and Valence State Information. J. Chem. Inf. Comput. Sci. 1995, 35, 1039–1045. [Google Scholar] [CrossRef]
- Organisation for Economic Co-operation and Development. OECD Guidance Document on the Validation of (Quantitative) Structure-Activity Relationship [(Q)SAR] Models; Organisation for Economic Co-operation and Development: Paris, Francia, 2014. [Google Scholar]
- Yee, S. In Vitro Permeability Across Caco-2 Cells (Colonic) Can Predict In Vivo (Small Intestinal) Absorption in Man—Fact or Myth. Pharm. Res. 1997, 14, 763–766. [Google Scholar] [CrossRef]
- Marchica, A.; Cotrozzi, L.; Detti, R.; Lorenzini, G.; Pellegrini, E.; Petersen, M.; Nali, C. The Biosynthesis of Phenolic Compounds Is an Integrated Defence Mechanism to Prevent Ozone Injury in Salvia officinalis. Antioxidants 2020, 9, 1274. [Google Scholar] [CrossRef]
- Foye, W.O.; Lemke, T.L.; Williams, D.A. (Eds.) Foye’s Principles of Medicinal Chemistry, 7th ed.; Wolters Kluwer Health/Lippincott Williams & Wilkins: Philadelphia, PA, USA, 2013; ISBN 978-1-60913-345-0. [Google Scholar]
- Lipinski, C.A.; Lombardo, F.; Dominy, B.W.; Feeney, P.J. Experimental and Computational Approaches to Estimate Solubility and Permeability in Drug Discovery and Development Setting. Adv. Drug Deliv. Rev. 2001, 24, 3–25. [Google Scholar] [CrossRef] [PubMed]
- Veber, D.F.; Johnson, S.R.; Cheng, H.-Y.; Smith, B.R.; Ward, K.W.; Kopple, K.D. Molecular Properties That Influence the Oral Bioavailability of Drug Candidates. J. Med. Chem. 2002, 45, 2615–2623. [Google Scholar] [CrossRef] [PubMed]
- Mauri, A. alvaDesc: A Tool to Calculate and Analyze Molecular Descriptors and Fingerprints. In Ecotoxicological QSARs; Roy, K., Ed.; Methods in Pharmacology and Toxicology; Springer US: New York, NY, USA, 2020; pp. 801–820. ISBN 978-1-07-160149-5. [Google Scholar]
- Oprea, T.I.; Gottfries, J.; Sherbukhin, V.; Svensson, P.; Kühler, T.C. Chemical Information Management in Drug Discovery: Optimizing the Computational and Combinatorial Chemistry Interfaces. J. Mol. Graph. Model. 2000, 18, 541. [Google Scholar] [CrossRef] [PubMed]
- Walters, W.P.; Murcko, M.A. Prediction of ‘Drug-Likeness’. Adv. Drug Deliv. Rev. 2002, 54, 255–271. [Google Scholar] [CrossRef] [PubMed]
- Chen, G.; Zheng, S.; Luo, X.; Shen, J.; Zhu, W.; Liu, H.; Gui, C.; Zhang, J.; Zheng, M.; Puah, C.M.; et al. Focused Combinatorial Library Design Based on Structural Diversity, Druglikeness and Binding Affinity Score. J. Comb. Chem. 2005, 7, 398–406. [Google Scholar] [CrossRef]
- Zheng, S.; Luo, X.; Chen, G.; Zhu, W.; Shen, J.; Chen, K.; Jiang, H. A New Rapid and Effective Chemistry Space Filter in Recognizing a Druglike Database. J. Chem. Inf. Model. 2005, 45, 856–862. [Google Scholar] [CrossRef] [PubMed]
- Rishton, G.M. Nonleadlikeness and Leadlikeness in Biochemical Screening. Drug Discov. Today 2003, 8, 86–96. [Google Scholar] [CrossRef] [PubMed]
- Okuyama, E.; Umeyama, K.; Ohmori, S.; Yamazaki, M.; Satake, M. Pharmacologically Active Components from a Peruvian Medicinal Plant Huira-Huira (Culcitium canescens H. & B.). Chem. Pharm. Bull. 1994, 42, 2183–2186. [Google Scholar] [CrossRef] [PubMed]
- Fuchino, H.; Koide, T.; Takahashi, M.; Sekita, S.; Satake, M. New Sesquiterpene Lactones from Elephantopus mollis and Their Leishmanicidal Activities. Planta Med. 2001, 67, 647–653. [Google Scholar] [CrossRef]
- Kang, T.-H.; Matsumoto, K.; Tohda, M.; Murakami, Y.; Takayama, H.; Kitajima, M.; Aimi, N.; Watanabe, H. Pteropodine and Isopteropodine Positively Modulate the Function of Rat Muscarinic M1 and 5-HT2 Receptors Expressed in Xenopus oocyte. Eur. J. Pharmacol. 2002, 444, 39–45. [Google Scholar] [CrossRef]
- Tincusi, B.M.; Jiménez, I.A.; Bazzocchi, I.L.; Moujir, L.M.; Mamani, Z.A.; Barroso, J.P.; Ravelo, A.G.; Hernández, B.V. Antimicrobial Terpenoids from the Oleoresin of the Peruvian Medicinal Plant Copaifera paupera. Planta Med. 2002, 68, 808–812. [Google Scholar] [CrossRef] [PubMed]
- Hegde, V.R.; Pu, H.; Patel, M.; Das, P.R.; Butkiewicz, N.; Arreaza, G.; Gullo, V.P.; Chan, T.-M. Two Antiviral Compounds from the Plant Stylogne cauliflora as Inhibitors of HCV NS3 Protease. ChemInform 2003, 34, 2925–2928. [Google Scholar] [CrossRef]
- Hegde, V.R.; Pu, H.; Patel, M.; Black, T.; Soriano, A.; Zhao, W.; Gullo, V.P.; Chan, T.-M. Two New Bacterial DNA Primase Inhibitors from the Plant Polygonum cuspidatum. Bioorg. Med. Chem. Lett. 2004, 14, 2275–2277. [Google Scholar] [CrossRef] [PubMed]
- Hegde, V.R.; Pu, H.; Patel, M.; Das, P.R.; Strizki, J.; Gullo, V.P.; Chou, C.-C.; Buevich, A.V.; Chan, T.-M. Three New Compounds from the Plant Lippia alva as Inhibitors of Chemokine Receptor 5 (CCR5). Bioorg. Med. Chem. Lett. 2004, 14, 5339–5342. [Google Scholar] [CrossRef]
- Heitzman, M.E.; Neto, C.C.; Winiarz, E.; Vaisberg, A.J.; Hammond, G.B. Ethnobotany, Phytochemistry and Pharmacology of Uncaria (Rubiaceae). Phytochemistry 2005, 66, 5–29. [Google Scholar] [CrossRef] [PubMed]
- Aguayo, L.; Guzman, L.; Perez, C.; Aguayo, L.; Silva, M.; Becerra, J.; Fuentealba, J. Historical and Current Perspectives of Neuroactive Compounds Derived from Latin America. MRMC 2006, 6, 997–1008. [Google Scholar] [CrossRef] [PubMed]
- Rojas, R.; Bustamante, B.; Ventosilla, P.; Fernádez, I.; Caviedes, L.; Gilman, R.H.; Lock, O.; Hammond, G.B. Larvicidal, Antimycobacterial and Antifungal Compounds from the Bark of the Peruvian Plant Swartzia polyphylla DC. Chem. Pharm. Bull. 2006, 54, 278–279. [Google Scholar] [CrossRef]
- Aguiar, C.L.; Baptista, A.S.; Alencar, S.M.; Haddad, R.; Eberlin, M.N. Analysis of Isoflavonoids from Leguminous Plant Extracts by RPHPLC/DAD and Electrospray Ionization Mass Spectrometry. Int. J. Food Sci. Nutr. 2007, 58, 116–124. [Google Scholar] [CrossRef] [PubMed]
- Castillo, D.; Arevalo, J.; Herrera, F.; Ruiz, C.; Rojas, R.; Rengifo, E.; Vaisberg, A.; Lock, O.; Lemesre, J.-L.; Gornitzka, H.; et al. Spirolactone Iridoids Might Be Responsible for the Antileishmanial Activity of a Peruvian Traditional Remedy Made with Himatanthus sucuuba (Apocynaceae). J. Ethnopharmacol. 2007, 112, 410–414. [Google Scholar] [CrossRef]
- Mesa-Siverio, D.; Machín, R.P.; Estévez-Braun, A.; Ravelo, Á.G.; Lock, O. Structure and Estrogenic Activity of New Lignans from Iryanthera lancifolia. Bioorg. Med. Chem. 2008, 16, 3387–3394. [Google Scholar] [CrossRef]
- Gonzales, G.F.; Gonzales-Castañeda, C. The Methyltetrahydro-β-Carbolines in Maca (Lepidium meyenii). Evid.-Based Complement. Altern. Med. 2009, 6, 315–316. [Google Scholar] [CrossRef] [PubMed]
- Kawano, M.; Otsuka, M.; Umeyama, K.; Yamazaki, M.; Shiota, T.; Satake, M.; Okuyama, E. Anti-Inflammatory and Analgesic Components from “Hierba Santa,” a Traditional Medicine in Peru. J. Nat. Med. 2009, 63, 147–158. [Google Scholar] [CrossRef]
- Aponte, J.; Yang, H.; Vaisberg, A.; Castillo, D.; Málaga, E.; Verástegui, M.; Casson, L.; Stivers, N.; Bates, P.; Rojas, R.; et al. Cytotoxic and Anti-Infective Sesquiterpenes Present in Plagiochila disticha (Plagiochilaceae) and Ambrosia peruviana (Asteraceae). Planta Med. 2010, 76, 705–707. [Google Scholar] [CrossRef] [PubMed]
- Aponte, J.; Jin, Z.; Vaisberg, A.; Castillo, D.; Málaga, E.; Lewis, W.; Sauvain, M.; Gilman, R.; Hammond, G. Cytotoxic and Anti-Infective Phenolic Compounds Isolated from Mikania decora and Cremastosperma microcarpum. Planta Med. 2011, 77, 1597–1599. [Google Scholar] [CrossRef]
- Fuchino, H.; Kiuchi, F.; Yamanaka, A.; Obu, A.; Wada, H.; Mori-Yasumoto, K.; Kawahara, N.; Flores, D.; Palacios, O.; Sekita, S.; et al. New Leishmanicidal Stilbenes from a Peruvian Folk Medicine, Lonchocarpus nicou. Chem. Pharm. Bull. 2013, 61, 979–982. [Google Scholar] [CrossRef]
- Leuner, O.; Havlik, J.; Budesinsky, M.; Vrkoslav, V.; Chu, J.; Bradshaw, T.D.; Hummelova, J.; Miksatkova, P.; Lapcik, O.; Valterova, I.; et al. Cytotoxic Constituents of Pachyrhizus Tuberosus from Peruvian Amazon. Nat. Prod. Commun. 2013, 8, 1934578X1300801. [Google Scholar] [CrossRef]
- Wu, H.; Kelley, C.J.; Pino-Figueroa, A.; Vu, H.D.; Maher, T.J. Macamides and Their Synthetic Analogs: Evaluation of in Vitro FAAH Inhibition. Bioorg. Med. Chem. 2013, 21, 5188–5197. [Google Scholar] [CrossRef]
- Baldera-Aguayo, P.A. Phytochemical Study of Echinopsis peruviana. Rev. Soc. Quím Perú. 2014, 9, 202–210. [Google Scholar]
- Hajdu, Z.; Nicolussi, S.; Rau, M.; Lorántfy, L.; Forgo, P.; Hohmann, J.; Csupor, D.; Gertsch, J. Identification of Endocannabinoid System-Modulating N -Alkylamides from Heliopsis Helianthoides Var. Scabra and Lepidium meyenii. J. Nat. Prod. 2014, 77, 1663–1669. [Google Scholar] [CrossRef]
- Reina, M.; Ruiz-Mesia, L.; Ruiz-Mesia, W.; Sosa-Amay, F.E.; Arevalo-Encinas, L.; González-Coloma, A.; Martínez-Díaz, R. Antiparasitic Indole Alkaloids from Aspidosperma desmanthum and A. spruceanum from the Peruvian Amazonia. Nat. Prod. Commun. 2014, 9, 1934578X1400900. [Google Scholar] [CrossRef]
- Abderrahim, F.; Huanatico, E.; Segura, R.; Arribas, S.; Gonzalez, M.C.; Condezo-Hoyos, L. Physical Features, Phenolic Compounds, Betalains and Total Antioxidant Capacity of Coloured Quinoa Seeds (Chenopodium quinoa Willd.) from Peruvian Altiplano. Food Chem. 2015, 183, 83–90. [Google Scholar] [CrossRef] [PubMed]
- Colegate, S.M.; Boppré, M.; Monzón, J.; Betz, J.M. Pro-Toxic Dehydropyrrolizidine Alkaloids in the Traditional Andean Herbal Medicine “Asmachilca”. J. Ethnopharmacol. 2015, 172, 179–194. [Google Scholar] [CrossRef] [PubMed]
- Esparza, E.; Hadzich, A.; Kofer, W.; Mithöfer, A.; Cosio, E.G. Bioactive Maca (Lepidium meyenii) Alkamides Are a Result of Traditional Andean Postharvest Drying Practices. Phytochemistry 2015, 116, 138–148. [Google Scholar] [CrossRef] [PubMed]
- Girardi, C.; Fabre, N.; Paloque, L.; Ramadani, A.P.; Benoit-Vical, F.; González-Aspajo, G.; Haddad, M.; Rengifo, E.; Jullian, V. Evaluation of Antiplasmodial and Antileishmanial Activities of Herbal Medicine Pseudelephantopus spiralis (Less.) Cronquist and Isolated Hirsutinolide-Type Sesquiterpenoids. J. Ethnopharmacol. 2015, 170, 167–174. [Google Scholar] [CrossRef]
- Patel, K.; Ruiz, C.; Calderon, R.; Marcelo, M.; Rojas, R. Characterisation of Volatile Profiles in 50 Native Peruvian Chili Pepper Using Solid Phase Microextraction–Gas Chromatography Mass Spectrometry (SPME–GCMS). Food Res. Int. 2016, 89, 471–475. [Google Scholar] [CrossRef] [PubMed]
- Schmeda-Hirschmann, G.; Quispe, C.; Arana, G.V.; Theoduloz, C.; Urra, F.A.; Cárdenas, C. Antiproliferative Activity and Chemical Composition of the Venom from the Amazonian Toad Rhinella marina (Anura: Bufonidae). Toxicon 2016, 121, 119–129. [Google Scholar] [CrossRef]
- Boniface, P.K.; Baptista Ferreira, S.; Roland Kaiser, C. Current State of Knowledge on the Traditional Uses, Phytochemistry, and Pharmacology of the Genus Hymenaea. J. Ethnopharmacol. 2017, 206, 193–223. [Google Scholar] [CrossRef] [PubMed]
- Feuereisen, M.M.; Zimmermann, B.F.; Schulze-Kaysers, N.; Schieber, A. Differentiation of Brazilian Peppertree (Schinus terebinthifolius Raddi) and Peruvian Peppertree (Schinus molle L.) Fruits by UHPLC–UV–MS Analysis of Their Anthocyanin and Biflavonoid Profiles. J. Agric. Food Chem. 2017, 65, 5330–5338. [Google Scholar] [CrossRef]
- Gálvez Ranilla, L.; Christopher, A.; Sarkar, D.; Shetty, K.; Chirinos, R.; Campos, D. Phenolic Composition and Evaluation of the Antimicrobial Activity of Free and Bound Phenolic Fractions from a Peruvian Purple Corn (Zea mays L.) Accession. J. Food Sci. 2017, 82, 2968–2976. [Google Scholar] [CrossRef]
- Linares-Otoya, L.; Linares-Otoya, V.; Armas-Mantilla, L.; Blanco-Olano, C.; Crüsemann, M.; Ganoza-Yupanqui, M.; Campos-Florian, J.; König, G.; Schäberle, T. Diversity and Antimicrobial Potential of Predatory Bacteria from the Peruvian Coastline. Mar. Drugs 2017, 15, 308. [Google Scholar] [CrossRef]
- Quispe, Y.; Hwang, S.; Wang, Z.; Lim, S. Screening of Peruvian Medicinal Plants for Tyrosinase Inhibitory Properties: Identification of Tyrosinase Inhibitors in Hypericum laricifolium Juss. Molecules 2017, 22, 402. [Google Scholar] [CrossRef] [PubMed]
- Xu, Y.-M.; Wijeratne, E.M.K.; Babyak, A.L.; Marks, H.R.; Brooks, A.D.; Tewary, P.; Xuan, L.-J.; Wang, W.-Q.; Sayers, T.J.; Gunatilaka, A.A.L. Withanolides from Aeroponically Grown Physalis peruviana and Their Selective Cytotoxicity to Prostate Cancer and Renal Carcinoma Cells. J. Nat. Prod. 2017, 80, 1981–1991. [Google Scholar] [CrossRef] [PubMed]
- Morales-Soriano, E.; Kebede, B.; Ugás, R.; Grauwet, T.; Van Loey, A.; Hendrickx, M. Flavor Characterization of Native Peruvian Chili Peppers through Integrated Aroma Fingerprinting and Pungency Profiling. Food Res. Int. 2018, 109, 250–259. [Google Scholar] [CrossRef]
- Stivers, N.; Islam, A.; Reyes-Reyes, E.; Casson, L.; Aponte, J.; Vaisberg, A.; Hammond, G.; Bates, P. Plagiochiline A Inhibits Cytokinetic Abscission and Induces Cell Death. Molecules 2018, 23, 1418. [Google Scholar] [CrossRef]
- Alves, N.S.F.; Setzer, W.N.; da Silva, J.K.R. The Chemistry and Biological Activities of Peperomia pellucida (Piperaceae): A Critical Review. J. Ethnopharmacol. 2019, 232, 90–102. [Google Scholar] [CrossRef] [PubMed]
- Carlos Castro, J.; Dylan Maddox, J.; Cobos, M.; Diana Paredes, J.; Jhoao Fasabi, A.; Vargas-Arana, G.; Luis Marapara, J.; Marcelino Adrianzen, P.; Zadith Casuso, M.; Levi Estela, S. Medicinal Plants of the Peruvian Amazon: Bioactive Phytochemicals, Mechanisms of Action, and Biosynthetic Pathways. In Pharmacognosy—Medicinal Plants; Perveen, S., Al-Taweel, A., Eds.; IntechOpen: London, UK, 2019; ISBN 978-1-83880-610-1. [Google Scholar]
- Han, Y.; Chi, J.; Zhang, M.; Zhang, R.; Fan, S.; Huang, F.; Xue, K.; Liu, L. Characterization of Saponins and Phenolic Compounds: Antioxidant Activity and Inhibitory Effects on α-Glucosidase in Different Varieties of Colored Quinoa (Chenopodium quinoa Willd). Biosci. Biotechnol. Biochem. 2019, 83, 2128–2139. [Google Scholar] [CrossRef]
- Hwang, S.H.; Kim, H.-Y.; Guillen Quispe, Y.N.; Wang, Z.; Zuo, G.; Lim, S.S. Aldose Reductase, Protein Glycation Inhibitory and Antioxidant of Peruvian Medicinal Plants: The Case of Tanacetum parthenium L. and Its Constituents. Molecules 2019, 24, 2010. [Google Scholar] [CrossRef]
- Radice, M.; Tasambay, A.; Pérez, A.; Diéguez-Santana, K.; Sacchetti, G.; Buso, P.; Buzzi, R.; Vertuani, S.; Manfredini, S.; Baldisserotto, A. Ethnopharmacology, Phytochemistry and Pharmacology of the Genus Hedyosmum (Chlorantaceae): A Review. J. Ethnopharmacol. 2019, 244, 111932. [Google Scholar] [CrossRef] [PubMed]
- Tauchen, J.; Huml, L.; Bortl, L.; Doskocil, I.; Jarosova, V.; Marsik, P.; Frankova, A.; Clavo Peralta, Z.M.; Chuspe Zans, M.-E.; Havlik, J.; et al. Screening of Medicinal Plants Traditionally Used in Peruvian Amazon for in Vitro Antioxidant and Anticancer Potential. Nat. Prod. Res. 2019, 33, 2718–2721. [Google Scholar] [CrossRef]
- Zhang, Y.; Zhang, S.; Fan, W.; Duan, M.; Han, Y.; Li, H. Identification of Volatile Compounds and Odour Activity Values in Quinoa Porridge by Gas Chromatography–Mass Spectrometry. J. Sci. Food Agric. 2019, 99, 3957–3966. [Google Scholar] [CrossRef]
- Zhong, J.-L.; Yan, H.; Xu, H.-D.; Muhammad, N.; Yan, W.-D. Preparation from Lepidium Meyenii Walpers Using High-Speed Countercurrent Chromatography and Thermal Stability of Macamides in Air at Various Temperatures. J. Pharm. Biomed. Anal. 2019, 164, 768–776. [Google Scholar] [CrossRef] [PubMed]
- Halgren, T.A.; Nachbar, R.B. Merck Molecular Force Field. IV. Conformational Energies and Geometries for MMFF94. J. Comput. Chem. 1996, 17, 587–615. [Google Scholar] [CrossRef]
- O’Boyle, N.M.; Banck, M.; James, C.A.; Morley, C.; Vandermeersch, T.; Hutchison, G.R. Open Babel: An Open Chemical Toolbox. J. Cheminform. 2011, 3, 33. [Google Scholar] [CrossRef]
- Wang, J.; Wolf, R.M.; Caldwell, J.W.; Kollman, P.A.; Case, D.A. Development and Testing of a General Amber Force Field. J. Comput. Chem. 2004, 25, 1157–1174. [Google Scholar] [CrossRef] [PubMed]
- Yap, C.W. PaDEL-Descriptor: An Open Source Software to Calculate Molecular Descriptors and Fingerprints. J. Comput. Chem. 2011, 32, 1466–1474. [Google Scholar] [CrossRef] [PubMed]
- Boehmke, B.; Greenwell, B.M. Hands-on Machine Learning with R; Chapman & Hall/CRC the R series; CRC Press: Boca Raton, FL, USA, 2019; ISBN 978-1-138-49568-5. [Google Scholar]
- Müller, A.C.; Guido, S. Introduction to Machine Learning with Python: A Guide for Data Scientists, 1st ed.; O’Reilly Media, Inc.: Sebastopol, CA, USA, 2016; ISBN 978-1-4493-6941-5. [Google Scholar]
- Zhu, L.; Zhao, J.; Zhang, Y.; Zhou, W.; Yin, L.; Wang, Y.; Fan, Y.; Chen, Y.; Liu, H. ADME Properties Evaluation in Drug Discovery: In Silico Prediction of Blood–Brain Partitioning. Mol. Divers. 2018, 22, 979–990. [Google Scholar] [CrossRef]
- Shi, Y. Support Vector Regression-Based QSAR Models for Prediction of Antioxidant Activity of Phenolic Compounds. Sci. Rep. 2021, 11, 8806. [Google Scholar] [CrossRef]
- Instituto de Investigaciones de la Amazonía Peruana Centro de Alto Rendimiento Computacional de la Amazonia Peruana 2017. Available online: https://www.iiap.gob.pe/web/manati.aspx/ (accessed on 11 May 2024).
- R Core Team. R: A Language and Environment for Statistical Computing; R Foundation for Statistical Computing: Vienna, Austria, 2022. [Google Scholar]

| Model | RMSETrain | R2Train | RMSECV | R2CV | RMSETest | R2Test | Hyperparameters |
|---|---|---|---|---|---|---|---|
| MLR | 0.43 | 0.70 | 0.44 | 0.68 | 0.47 | 0.63 | - |
| PLS | 0.43 | 0.70 | 0.44 | 0.68 | 0.47 | 0.63 | ncomp = 11 |
| SVM | 0.28 | 0.87 | 0.40 | 0.74 | 0.40 | 0.73 | sigma = 0.015, C = 2 |
| RF | 0.16 | 0.97 | 0.40 | 0.75 | 0.39 | 0.74 | mtry = 18 |
| GBM | 0.19 | 0.94 | 0.40 | 0.74 | 0.39 | 0.74 | n.trees = 100, interaction.depth = 16 |
| SVM–RF–GBM | 0.19 | 0.94 | 0.38 | 0.76 | 0.38 | 0.76 | - |
| Molecular Descriptor | Group | r | Description |
|---|---|---|---|
| maxHBint7 | E-state | −0.50 | Maximum E-state descriptors of strength for potential hydrogen bonds of path length 7 |
| ALogP | Constitucional | 0.46 | Ghose-Crippen LogKow |
| SpMAD_Dzs | Barysz matrix | −0.43 | Spectral mean absolute deviation from Barysz matrix/weighted by I-state |
| maxHBint5 | E-state | −0.48 | Maximum E-state descriptors of strength for potential hydrogen bonds of path length 5 |
| maxHBint9 | E-state | −0.47 | Maximum E-state descriptors of strength for potential hydrogen Bonds of path length 9 |
| Eta_D_epsiD | ETA index | −0.39 | Eta measure of hydrogen bond donor atoms |
| maxHBint3 | E-state | −0.46 | Maximum E-state descriptors of strength for potential hydrogen bonds of path length 3 |
| SHED_DL | Pharmacophore descriptor | −0.47 | SHED donor–lipophilic |
| maxHBd | E-state | −0.35 | Maximum E-states for (strong) hydrogen bond donors |
| Hypertens.80 | Drug-like index | 0.41 | Ghose–Viswanadhan–Wendoloski antihypertensive-like index at 80% |
| Study | Method | Descriptors | N | RMSETest | R2Test | Reference |
|---|---|---|---|---|---|---|
| This study | SVM–RF–GBM | 2D and 3D descriptors from PaDEL-Descriptor and alvaDesc | 1817 | 0.38 | 0.76 | - |
| Wang and Chen, 2020 | Dual-RBF neural network | 2D descriptors from PaDEL-Descriptor | 1827 | 0.39 | 0.76 | [28] |
| Wang et al., 2016 | Boosting | 2D and 3D MOE descriptors | 1017 | 0.31 | 0.812 | [21] |
| Lanevskij et al., 2019 | Non-linear least squares | log Do/w, pKa, NHD, Vx | 442 | 0.49 | 0.77 | [20] |
Disclaimer/Publisher’s Note: The statements, opinions and data contained in all publications are solely those of the individual author(s) and contributor(s) and not of MDPI and/or the editor(s). MDPI and/or the editor(s) disclaim responsibility for any injury to people or property resulting from any ideas, methods, instructions or products referred to in the content. |
© 2024 by the authors. Licensee MDPI, Basel, Switzerland. This article is an open access article distributed under the terms and conditions of the Creative Commons Attribution (CC BY) license (https://creativecommons.org/licenses/by/4.0/).
Share and Cite
Acuña-Guzman, V.; Montoya-Alfaro, M.E.; Negrón-Ballarte, L.P.; Solis-Calero, C. A Machine Learning Approach for Predicting Caco-2 Cell Permeability in Natural Products from the Biodiversity in Peru. Pharmaceuticals 2024, 17, 750. https://doi.org/10.3390/ph17060750
Acuña-Guzman V, Montoya-Alfaro ME, Negrón-Ballarte LP, Solis-Calero C. A Machine Learning Approach for Predicting Caco-2 Cell Permeability in Natural Products from the Biodiversity in Peru. Pharmaceuticals. 2024; 17(6):750. https://doi.org/10.3390/ph17060750
Chicago/Turabian StyleAcuña-Guzman, Victor, María E. Montoya-Alfaro, Luisa P. Negrón-Ballarte, and Christian Solis-Calero. 2024. "A Machine Learning Approach for Predicting Caco-2 Cell Permeability in Natural Products from the Biodiversity in Peru" Pharmaceuticals 17, no. 6: 750. https://doi.org/10.3390/ph17060750