
An In Silico Study Based on QSAR and Molecular Docking and Molecular Dynamics Simulation for the Discovery of Novel Potent Inhibitor against AChE

 , , and
Abstract
:1. Introduction
2. Results and Discussion
2.1. Randomization Test
2.2. Variance Inflation Factor
2.3. Applicability Domain
2.4. Design of New Inhibitors and Interpretation of Model Descriptors
2.5. In Silico Drug Resemblance and ADMET Pharmacokinetic Prediction
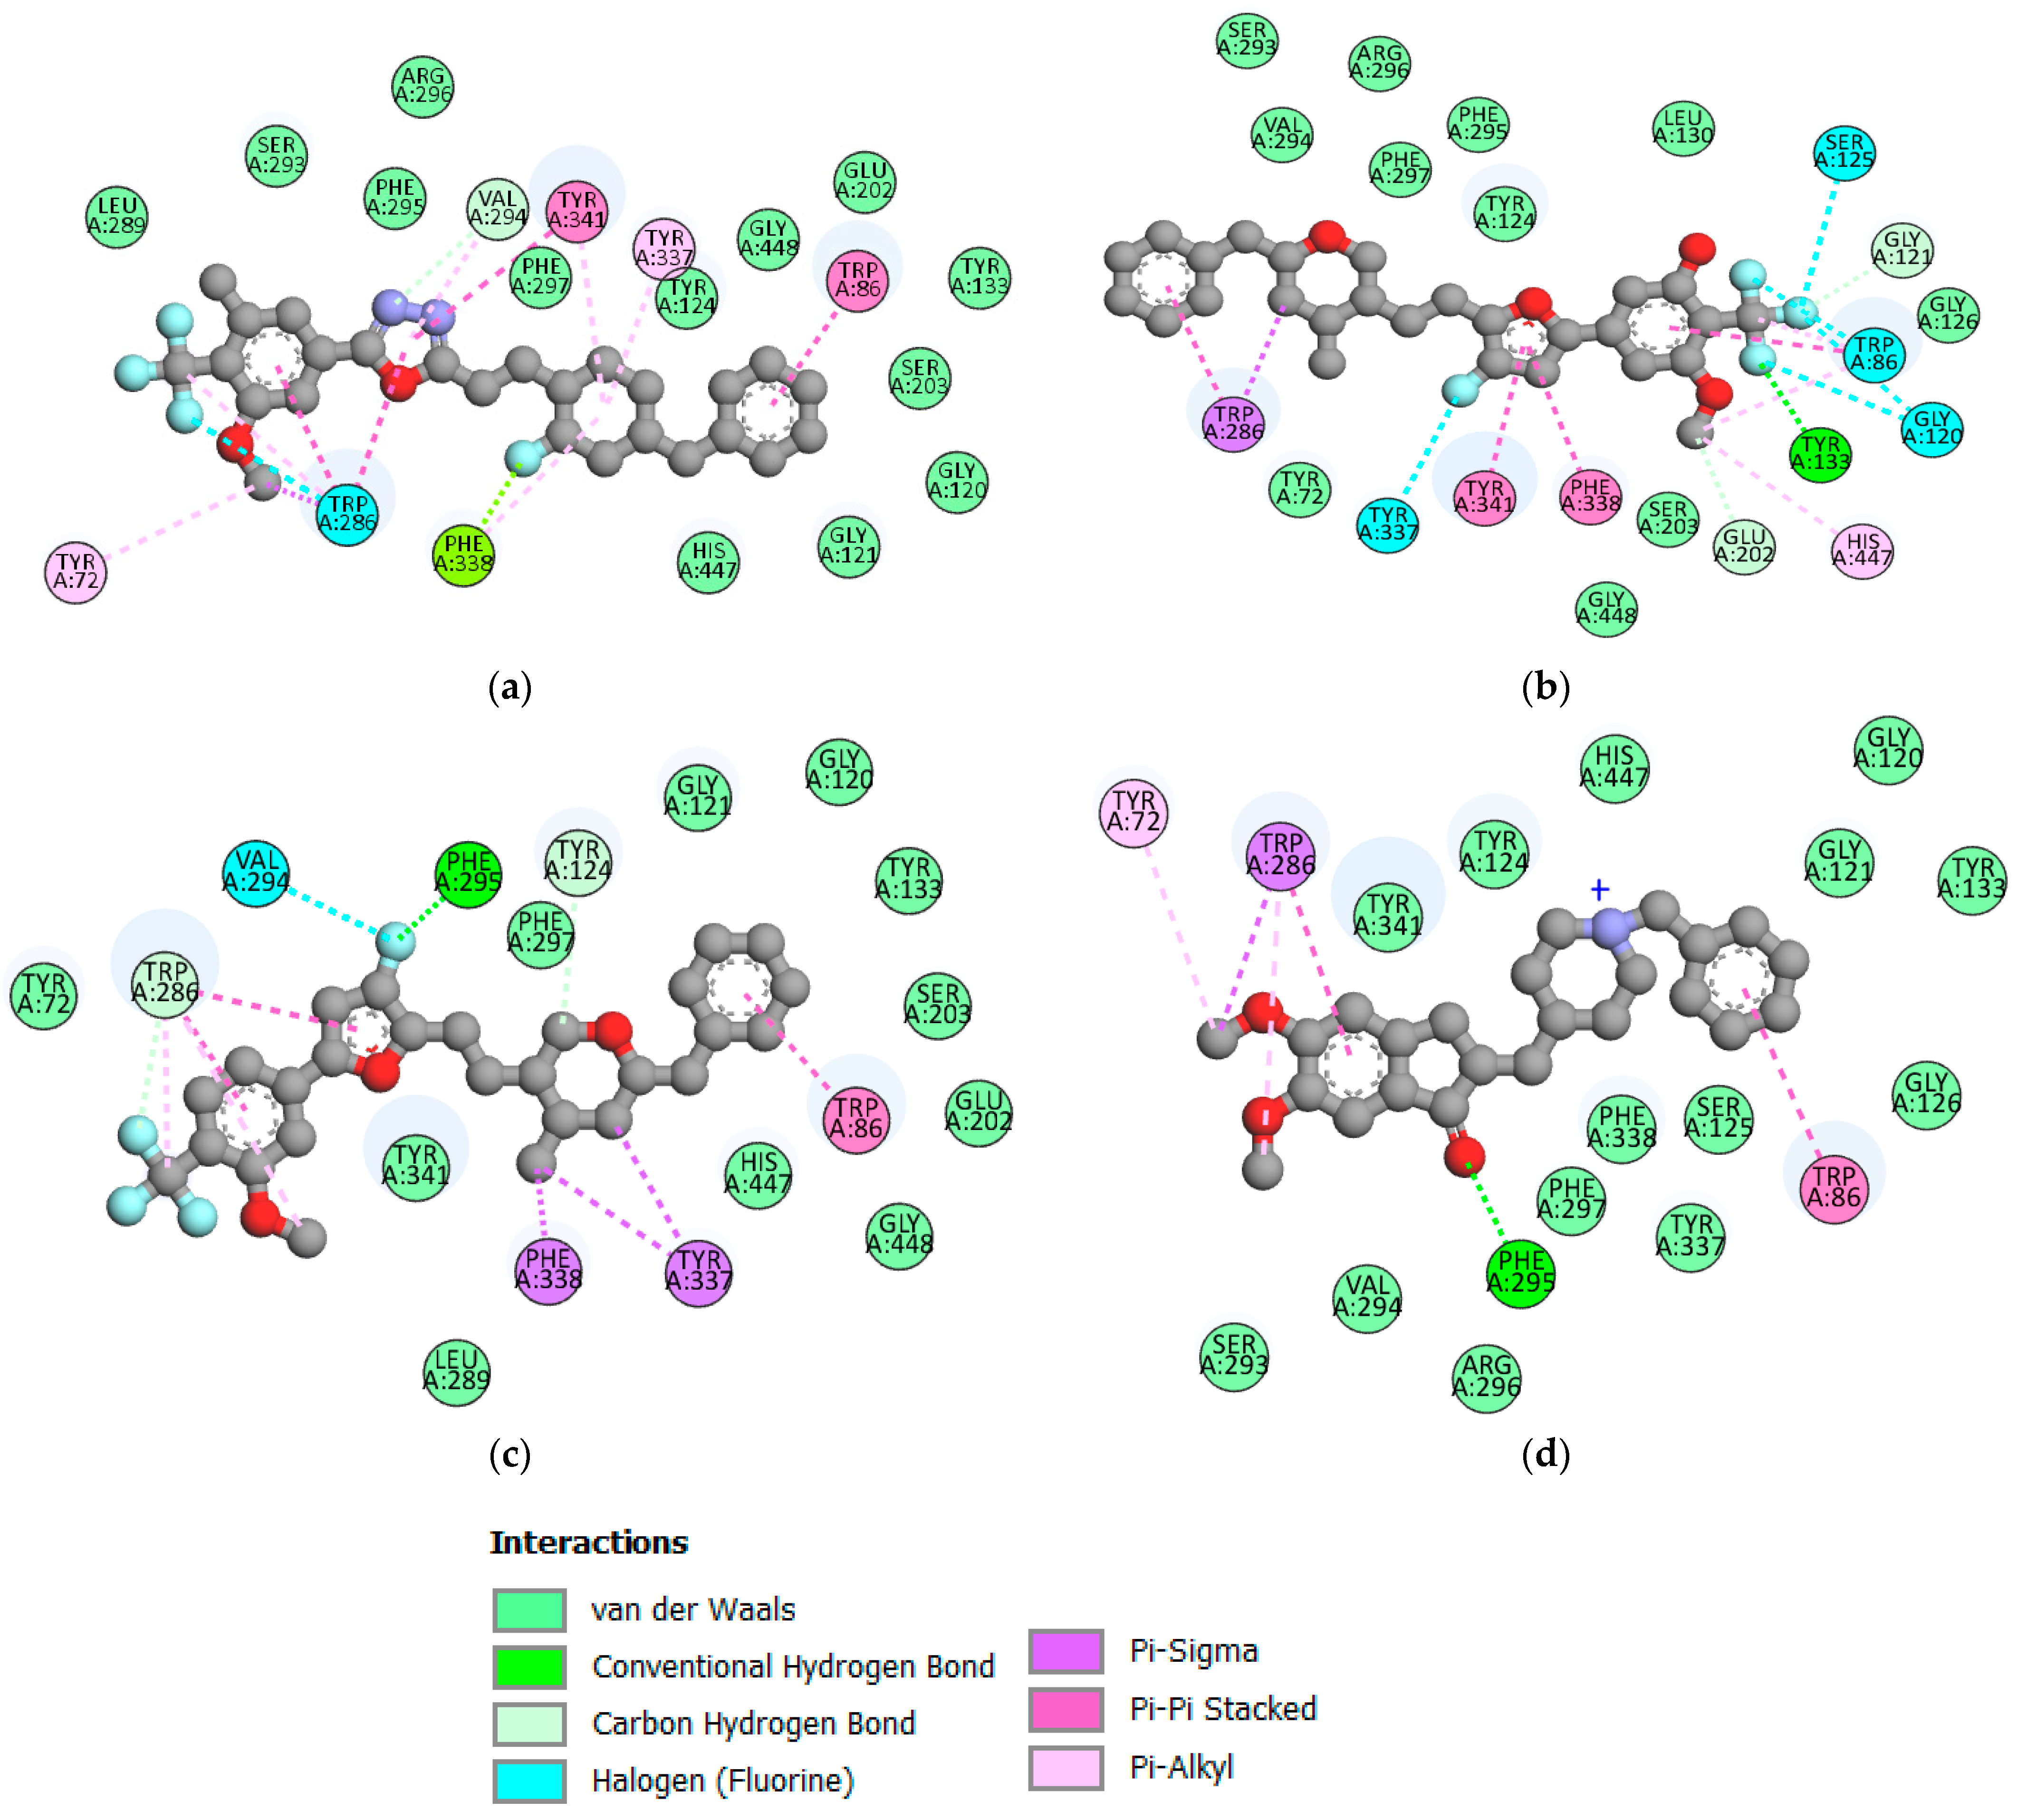
2.6. Molecular Docking
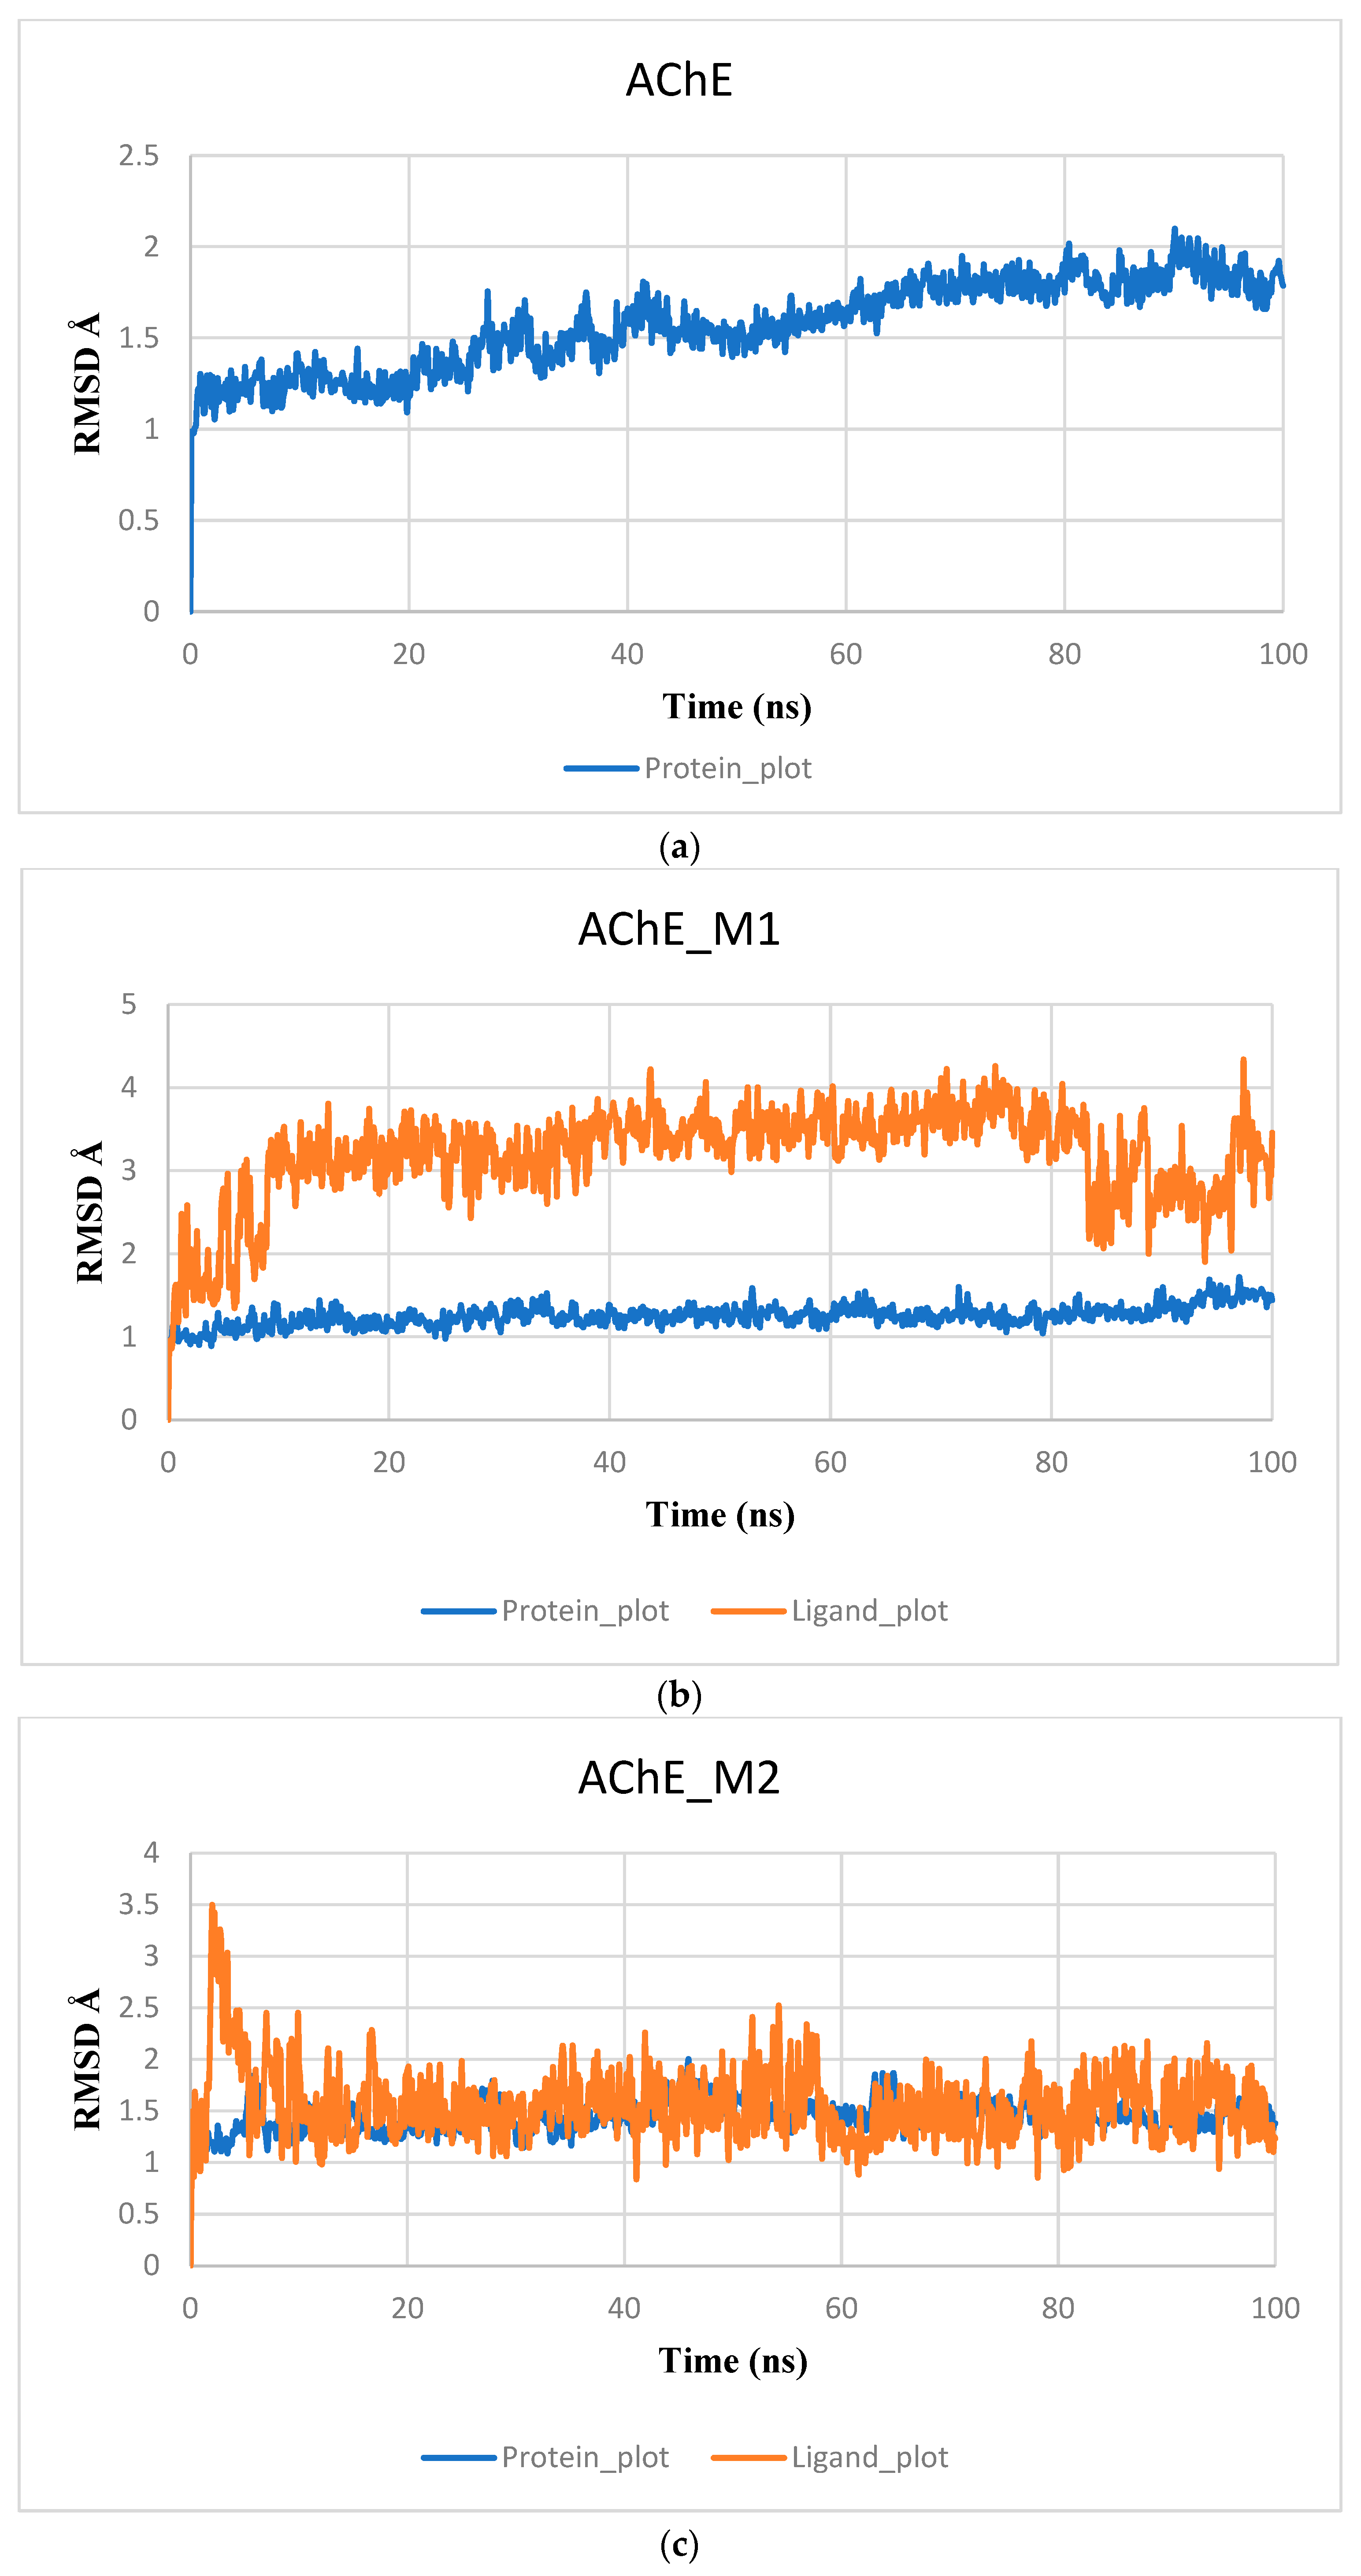
2.7. Molecular Dynamic and MMGBSA Calculations
3. Materials and Methods
3.1. Collects the Database and Calculates Molecular Descriptors
3.2. Analysis of Correlation Matrices
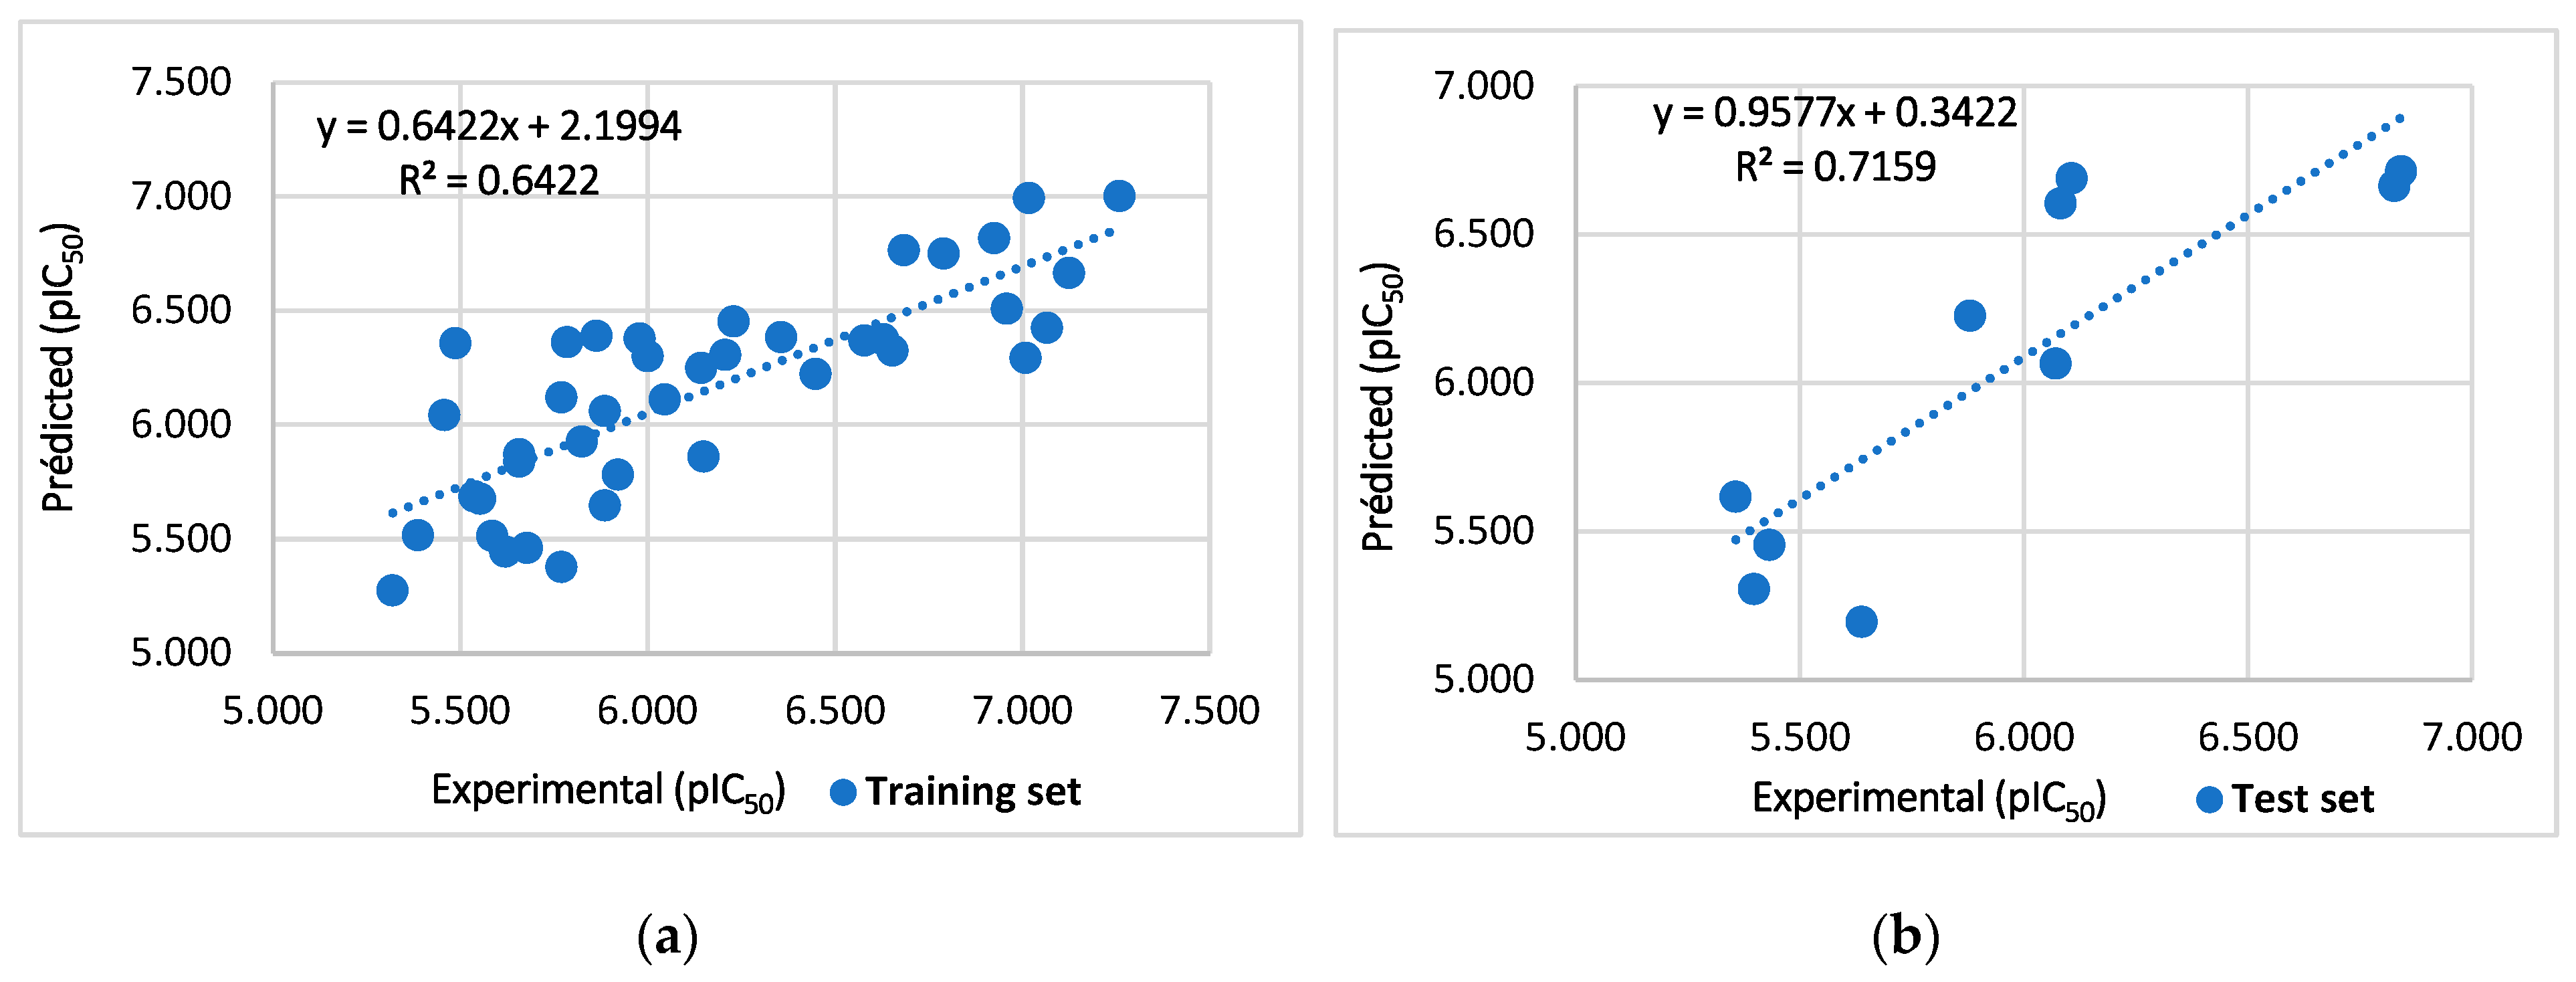
3.3. Data Split and Model Develop
3.4. Model Validation
3.5. Applicability Domain
3.6. ADMET In Silico Pharmacokinetic Prediction
3.7. Molecular Docking
3.8. Molecular Dynamics Simulation
4. Conclusions
Author Contributions
Funding
Institutional Review Board Statement
Informed Consent Statement
Data Availability Statement
Conflicts of Interest
References
- Hampel, H.; Prvulovic, D.; Teipel, S.J.; Jessen, F.; Luckhaus, C.; Frölich, L.; Riepe, M.W.; Dodel, R.; Leyhe, T.; Bertram, L.; et al. The future of Alzheimer’s disease: The next 10 years. Prog. Neurobiol. 2011, 95, 718–728. [Google Scholar] [CrossRef] [PubMed]
- Awasthi, M.; Singh, S.; Pandey, V.P.; Dwivedi, U.N. Alzheimer’s disease: An overview of amyloid beta dependent pathogenesis and its therapeutic implications along with in silico approaches emphasizing the role of natural products. J. Neurol. Sci. 2016, 361, 256–271. [Google Scholar] [CrossRef] [PubMed]
- Mishra, C.B.; Kumari, S.; Manral, A.; Prakash, A.; Saini, V.; Lynn, A.M.; Tiwari, M. Design, synthesis, in-silico and biological evaluation of novel donepezil derivatives as multi-target-directed ligands for the treatment of Alzheimer’s disease. Eur. J. Med. Chem. 2017, 125, 736–750. [Google Scholar] [CrossRef] [PubMed]
- Hammoudi, N.; Sobhi, W.; Attoui, A.; Lemaoui, T.; Erto, A.; Benguerba, Y. In silico drug discovery of Acetylcholinesterase and Butyrylcholinesterase enzymes inhibitors based on Quantitative Structure-Activity Relationship (QSAR) and drug-likeness evaluation. J. Mol. Struct. 2021, 1229, 129845. [Google Scholar] [CrossRef]
- Baddeley, A.; Baddeley, H.; Bucks, R.S.; Wilcock, G. Attentional control in Alzheimer’s disease. Brain 2001, 124, 1492–1508. [Google Scholar] [CrossRef] [PubMed]
- Abdelnour, C.; Agosta, F.; Bozzali, M.; Fougère, B.; Iwata, A.; Nilforooshan, R.; Takada, L.T.; Viñuela, F.; Traber, M. Perspectives and challenges in patient stratification in Alzheimer’s disease. Alzheimer’s Res. Ther. 2022, 14, 112. [Google Scholar] [CrossRef] [PubMed]
- Langbaum, J.B.; Zissimopoulos, J.; Au, R.; Bose, N.; Edgar, C.J.; Ehrenberg, E.; Fillit, H.; Hill, C.V.; Hughes, L.; Irizarry, M.C.; et al. Recommendations to address key recruitment challenges of Alzheimer’s disease clinical trials. Alzheimer’s Dement. 2022, 19, 696–707. [Google Scholar] [CrossRef] [PubMed]
- Tarawneh, H.Y.; Menegola, H.K.; Peou, A.; Tarawneh, H.; Jayakody DM, P. Central Auditory Functions of Alzheimer’s Disease and its Preclinical Stages: A Systematic Review and Meta-Analysis. Cells 2022, 11, 1007. [Google Scholar] [CrossRef] [PubMed]
- Boada, M.; Kiprov, D.; Anaya, F.; López, O.L.; Núñez, L.; Olazarán, J.; Lima, J.; Grifols, C.; Barceló, M.; Rohe, R.; et al. Feasibility, safety, and tolerability of two modalities of plasma exchange with albumin replacement to treat elderly patients with Alzheimer’s disease in the AMBAR study. J. Clin. Apher. 2022, 38, 45–54. [Google Scholar] [CrossRef]
- Sengoku, R. Aging and Alzheimer’s disease pathology. Neuropathology 2019, 40, 22–29. [Google Scholar] [CrossRef] [PubMed]
- Pini, L. Brain network modulation in Alzheimer’s disease: Clinical phenotypes and windows of opportunity. Neural Regen. Res. 2023, 18, 115. [Google Scholar] [CrossRef] [PubMed]
- Lourenco, M.V.; Borelli, W.V.; Duran-Aniotz, C.; Zimmer, E.R.; De Castro, S.S. Promoting diversity and overcoming publication barriers in Latin American neuroscience and Alzheimer’s disease research: A call to action. Alzheimer’s Dement. Transl. Res. Clin. Interv. 2023, 9, e12378. [Google Scholar] [CrossRef] [PubMed]
- Uwishema, O.; Mahmoud, A.; Sun, J.; Correia IF, S.; Bejjani, N.; Alwan, M.; Aderinto, N.; Oluyemisi, A.; Dost, B. Is Alzheimer’s disease an infectious neurological disease? A review of the literature. Brain Behav. 2022, 12, e2728. [Google Scholar] [CrossRef] [PubMed]
- Kumar, V.; Saha, A.; Roy, K. In silico modeling for dual inhibition of acetylcholinesterase (AChE) and butyrylcholinesterase (BuChE) enzymes in Alzheimer’s disease. Comput. Biol. Chem. 2020, 88, 107355. [Google Scholar] [CrossRef] [PubMed]
- Chen, Z.; Huang, J.; Yang, S.; Hong, F. Role of cholinergic signaling in Alzheimer’s disease. Molecules 2022, 27, 1816. [Google Scholar] [CrossRef] [PubMed]
- Dwomoh, L.; Tejeda, G.S.; Tobin, A.B. Targeting the M1 muscarinic acetylcholine receptor in Alzheimer’s disease. Neuronal Signal. 2022, 6, NS20210004. [Google Scholar] [CrossRef] [PubMed]
- Abuhamdah, S.; Habash, M.; Taha, M.O. Elaborate ligand-based modeling coupled with QSAR analysis and in silico screening reveal new potent acetylcholinesterase inhibitors. J. Comput. Aided Mol. Des. 2013, 27, 1075–1092. [Google Scholar] [CrossRef] [PubMed]
- Bautista-Aguilera, O.M.; Esteban, G.; Bolea, I.; Nikolic, K.; Agbaba, D.; Moraleda, I.; Iriepa, I.; Samadi, A.; Soriano, E.; Unzeta, M.; et al. Design, synthesis, pharmacological evaluation, QSAR analysis, molecular modeling and ADMET of novel donepezil–indolyl hybrids as multipotent cholinesterase/monoamine oxidase inhibitors for the potential treatment of Alzheimer’s disease. Eur. J. Med. Chem. 2014, 75, 82–95. [Google Scholar] [CrossRef] [PubMed]
- Wong, K.Y.; Duchowicz, P.R.; Mercader, A.G.; Castro, E.A. QSAR Applications During Last Decade on Inhibitors of Acetylcholinesterase in Alzheimer’s Disease. Mini Rev. Med. Chem. 2012, 12, 936–946. [Google Scholar] [CrossRef]
- Nour, H.; Abchir, O.; Belaidi, S.; Qais, F.A.; Chtita, S.; Belaaouad, S. 2D-QSAR and molecular docking studies of carbamate derivatives to discover novel potent anti-butyrylcholinesterase agents for Alzheimer’s disease treatment. Bull. Korean Chem. Soc. 2021, 43, 277–292. [Google Scholar] [CrossRef]
- Velmurugan, B.A.; Sivaraman, B.; Natarajan, R. 2D QSAR and docking studies on chalcone—Quinoxaline variants—A potential target for acetylcholinestrase inhibitors. Res. Sq. 2023. [Google Scholar] [CrossRef]
- Tropsha, A.; Gramatica, P.; Gombar, V.K. The Importance of Being Earnest: Validation is the Absolute Essential for Successful Application and Interpretation of QSPR Models. Qsar Comb. Sci. 2003, 22, 69–77. [Google Scholar] [CrossRef]
- Yamari, I.; Abchir, O.; Nour, H.; Kouali, M.E.; Chtita, S. Identification of new dihydrophenanthrene derivatives as promising anti-SARS-CoV-2 drugs through in silico investigations. Main Group Chem. 2023, 22, 469–484. [Google Scholar] [CrossRef]
- Abdullahi, M.; Uzairu, A.; Shallangwa, G.A.; Mamza, P.A.; Ibrahim, M. Computational modelling of some phenolic diterpenoid compounds as anti-influenza A virus agents. Sci. Afr. 2023, 19, e01462. [Google Scholar] [CrossRef]
- Yang, H.; Du, Z.; Lv, W.; Zhang, X.; Zhai, H. In silico toxicity evaluation of dioxins using structure–activity relationship (SAR) and two-dimensional quantitative structure–activity relationship (2D-QSAR). Arch. Toxicol. 2019, 93, 3207–3218. [Google Scholar] [CrossRef] [PubMed]
- Kumar, V.; Roy, K. Development of a simple, interpretable and easily transferable QSAR model for quick screening antiviral databases in search of novel 3C-like protease (3CLpro) enzyme inhibitors against SARS-CoV diseases. SAR QSAR Environ. Res. 2020, 31, 511–526. [Google Scholar] [CrossRef] [PubMed]
- De, P.; Bhayye, S.; Kumar, V.; Roy, K. In silico modeling for quick prediction of inhibitory activity against 3CLpro enzyme in SARS CoV diseases. J. Biomol. Struct. Dyn. 2020, 40, 1010–1036. [Google Scholar] [CrossRef] [PubMed]
- Speck-Planche, A.; Scotti, M.T.; López, A.; De Paulo Emerenciano, V.; Pérez, E.M.; Uriarte, E. Design of novel antituberculosis compounds using graph-theoretical and substructural approaches. Mol. Divers. 2009, 13, 445–458. [Google Scholar] [CrossRef] [PubMed]
- Tian, S.; Wang, J.; Li, Y.; Li, D.; Xu, L.; Hou, T. The application of in silico drug-likeness predictions in pharmaceutical research. Adv. Drug Deliv. Rev. 2015, 86, 2–10. [Google Scholar] [CrossRef] [PubMed]
- Ji, D.; Ma, J.; Dai, J.; Xu, M.; Harris PW, R.; Brimble, M.A.; Agyei, D. Anticholinesterase inhibition, Drug-Likeness Assessment, and molecular docking evaluation of milk Protein-Derived opioid peptides for the control of Alzheimer’s disease. Dairy 2022, 3, 422–437. [Google Scholar] [CrossRef]
- Daina, A.; Michielin, O.; Zoete, V. SwissADME: A free web tool to evaluate pharmacokinetics, drug-likeness and medicinal chemistry friendliness of small molecules. Sci. Rep. 2017, 7, 42717. [Google Scholar] [CrossRef]
- Khan, M.F.; Verma, G.; Akhtar, W.; Shaquiquzzaman, M.; Akhter, M.; Rizvi, A.; Alam, M.M. Pharmacophore modeling, 3D-QSAR, docking study and ADME prediction of acyl 1,3,4-thiadiazole amides and sulfonamides as antitubulin agents. Arab. J. Chem. 2019, 12, 5000–5018. [Google Scholar] [CrossRef]
- Khaldan, A.; Bouamrane, S.; El-Mernissi, R.; Maghat, H.; Ajana, M.A.; Sbai, A.; Bouachrine, M.; Lakhlifi, T. 3D-QSAR modeling, molecular docking and ADMET properties of benzothiazole derivatives as α-glucosidase inhibitors. Mater. Today Proc. 2021, 45, 7643–7652. [Google Scholar] [CrossRef]
- Ghose, A.K.; Herbertz, T.; Hudkins, R.L.; Dorsey, B.D.; Mallamo, J.P. Knowledge-Based, Central nervous system (CNS) lead selection and lead optimization for CNS drug discovery. ACS Chem. Neurosci. 2011, 3, 50–68. [Google Scholar] [CrossRef] [PubMed]
- Nagalakshmamma, V.; Avula VK, R.; Zyryanov, G.V.; Vallela, S.; Anireddy, J.S.; Pasupuleti, V.R.; Venkataswamy, M.; Chamarthi, N.R.; Ponne, V.C. Multiple molecular targets mediated antioxidant activity, molecular docking, ADMET, QSAR and bioactivity studies of halo substituted urea derivatives of α-Methyl-DOPA. Bioorg. Chem. 2020, 97, 103708. [Google Scholar] [CrossRef]
- Rhabori, S.E.; Aissouq, A.E.; Chtita, S.; Khalil, F. 3D-QSAR, molecular docking and ADMET studies of thioquinazolinone derivatives against breast cancer. J. Indian Chem. Soc. 2022, 99, 100675. [Google Scholar] [CrossRef]
- El-Behairy, M.F.; Fayed, M.A.A.; Ahmed, R.M.; Abdallah, I.A. Computational drug reproposing to identify SARS-CoV-2 mpro inhibitors: Molecular docking, admet analysis, and in-silico/in-vitro toxicity study. Univers. J. Pharm. Res. 2022, 7, 23–31. [Google Scholar] [CrossRef]
- El-Gamal, K.M.; El-Morsy, A.; Saad, A.M.; Eissa, I.H.; Alswah, M. Synthesis, docking, QSAR, ADMET and antimicrobial evaluation of new quinoline-3-carbonitrile derivatives as potential DNA-gyrase inhibitors. J. Mol. Struct. 2018, 1166, 15–33. [Google Scholar] [CrossRef]
- Fouedjou, R.T.; Daoui, O.; Nour, H.; Ayoub, M.; Fogang HP, D.; Siddique, F.; Chtita, S. In Silico Approach for Designing Novel SARS-CoV-2 Inhibitors from Medicinal Plants. Phys. Chem. Res. 2023, 11, 589–604. [Google Scholar]
- Nour, H.; Abchir, O.; Belaidi, S.; Chtita, S. Research of new acetylcholinesterase inhibitors based on QSAR and molecular docking studies of benzene-based carbamate derivatives. Struct. Chem. 2022, 33, 1935–1946. [Google Scholar] [CrossRef]
- Umar, A.B.; Uzairu, A.; Shallangwa, G.A.; Uba, S. Ligand-based drug design and molecular docking simulation studies of some novel anticancer compounds on MALME-3M melanoma cell line. Egypt. J. Med. Hum. Genet. 2021, 22, 6. [Google Scholar] [CrossRef]
- Abchir, O.; Khedraoui, M.; Nour, H.; Yamari, I.; Errougui, A.; Samadi, A.; Chtita, S. Integrative approach for designing novel triazole derivatives as A-Glucosidase inhibitors: QSAR, molecular docking, ADMET, and molecular dynamics investigations. Pharmaceuticals 2024, 17, 261. [Google Scholar] [CrossRef] [PubMed]
- Daoud, I.; Melkemi, N.; Salah, T.; Ghalem, S. Combined QSAR, molecular docking and molecular dynamics study on new Acetylcholinesterase and Butyrylcholinesterase inhibitors. Comput. Biol. Chem. 2018, 74, 304–326. [Google Scholar] [CrossRef] [PubMed]
- Shafferman, A.; Kronman, C.; Flashner, Y.; Leitner, M.; Grosfeld, H.; Ordentlich, A.; Gozes, Y.; Cohen, S.; Ariel, N.; Barak, D. Mutagenesis of human acetylcholinesterase. Identification of residues involved in catalytic activity and in polypeptide folding. J. Biol. Chem. 1992, 267, 17640–17648. [Google Scholar] [CrossRef] [PubMed]
- Cordova-Sintjago, T.C.; Fang, L.; Bruysters, M.; Leurs, R.; Booth, R.G. Molecular determinants of ligand binding at the human histamine H1 receptor: Site-directed mutagenesis results analyzed with ligand docking and molecular dynamics studies at H1 homology and crystal structure models. J. Chem. Pharm. Res. 2012, 4, 2937. [Google Scholar] [PubMed]
- Sharma, P.; Tripathi, A.; Tripathi, P.P.; Singh, S.; Singh, S.P.; Shrivastava, S.K. Novel molecular hybrids of N-Benzylpiperidine and 1,3,4-Oxadiazole as multitargeted therapeutics to treat Alzheimer’s disease. ACS Chem. Neurosci. 2019, 10, 4361–4384. [Google Scholar] [CrossRef] [PubMed]
- Sharma, P.; Tripathi, A.; Tripathi, P.P.; Prajapati, S.K.; Seth, A.; Tripathi, M.K.; Srivastava, P.; Tiwari, V.; Krishnamurthy, S.; Shrivastava, S.K. Design and development of multitarget-directed N-Benzylpiperidine analogs as potential candidates for the treatment of Alzheimer’s disease. Eur. J. Med. Chem. 2019, 167, 510–524. [Google Scholar] [CrossRef] [PubMed]
- ChemOffice. PerkinElmer Informatics. 2016. Available online: http://www.cambridgesoft.com (accessed on 16 June 2024).
- Frisch, M.J.; Trucks, G.W.; Schlegel, H.B.; Scuseria, G.E.; Robb, M.A.; Cheeseman, J.R.; Scalmani, G.; Barone, V.; Petersson, G.A.; Nakatsuji, H.; et al. Gaussian 09, Revision A.02. 2009. Available online: https://gaussian.com/g09citation/ (accessed on 16 June 2024).
- Ouassaf, M.; Belaidi, S.; Shtaiwi, A.; Chtita, S. Quantitative Structure Activity Relationship (QSAR) investigations and molecular docking analysis of plasmodium protein farnesyltransferase inhibitors as potent antimalarial agents. Jordan J. Pharm. Sci. 2022, 15, 315–340. [Google Scholar] [CrossRef]
- XLSTAT. XLSTAT Company. 2013. Available online: https://www.xlstat.com (accessed on 16 June 2024).
- Wang, J.; Li, L.; Hu, M.; Wu, B.; Fan, W.; Peng, W.; Wei, D.; Wu, C. In silico drug design of inhibitor of nuclear factor kappa B kinase subunit beta inhibitors from 2-acylamino-3-aminothienopyridines based on quantitative structure–activity relationships and molecular docking. Comput. Biol. Chem. 2019, 78, 297–305. [Google Scholar] [CrossRef] [PubMed]
- Roy, P.P.; Paul, S.; Mitra, I.; Roy, K. On two novel parameters for validation of predictive QSAR models. Molecules 2009, 14, 1660–1701. [Google Scholar] [CrossRef]
- Cao, D.; Shao, L.; Li, F.; Liang, Y. QSAR analysis of the effects of OATP1B1 transporter by structurally diverse natural products using a particle swarm optimization-combined multiple linear regression approach. Chemom. Intell. Lab. Syst. 2014, 130, 84–90. [Google Scholar] [CrossRef]
- Chtita, S.; Belhassan, A.; Bakhouch, M.; Taourati, A.I.; Aouidate, A.; Belaidi, S.; Moutaabbid, M.; Belaaouad, S.; Bouachrine, M.; Lakhlifi, T. QSAR study of unsymmetrical aromatic disulfides as potent avian SARS-CoV main protease inhibitors using quantum chemical descriptors and statistical methods. Chemom. Intell. Lab. Syst. 2021, 210, 104266. [Google Scholar] [CrossRef] [PubMed]
- Sushko, I.; Novotarskyi, S.; Körner, R.; Pandey, A.K.; Kovalishyn, V.; Прoкoпeнкo, B.M.; Tetko, I.V. Applicability domain for in silico models to achieve accuracy of experimental measurements. J. Chemom. 2010, 24, 202–208. [Google Scholar] [CrossRef]
- Rakhimbekova, A.; Madzhidov, T.; Nugmanov, R.; Gimadiev, T.; Baskin, I.I.; Varnek, A. Comprehensive analysis of applicability domains of QSPR models for chemical reactions. Int. J. Mol. Sci. 2020, 21, 5542. [Google Scholar] [CrossRef] [PubMed]
- Aouidate, A.; Ghaleb, A.; Ghamali, M.; Chtita, S.; Ousaa, A.; Choukrad, M.; Sbai, A.; Bouachrine, M.; Lakhlifi, T. Structural basis of pyrazolopyrimidine derivatives as CAMKIIδ kinase inhibitors: Insights from 3D QSAR, docking studies and in silico ADMET evaluation. Chem. Pap. 2018, 72, 2833–2847. [Google Scholar] [CrossRef]
- Pkcsm. 25 July 2022. Available online: https://biosig.lab.uq.edu.au/pkcsm/prediction (accessed on 16 June 2024).
- Yadav, D.K.; Kumar, S.; Saloni Singh, H.; Kim, M.; Sharma, P.; Misra, S.; Khan, F. Molecular docking, QSAR and ADMET studies of withanolide analogs against breast cancer. Drug Des. Dev. Ther. 2017, 11, 1859–1870. [Google Scholar] [CrossRef] [PubMed]
- Zoete, V.; Daina, A.; Bovigny, C.; Michielin, O. SwissSimilarity: A web tool for low to ultra high throughput Ligand-Based virtual screening. J. Chem. Inf. Model. 2016, 56, 1399–1404. [Google Scholar] [CrossRef] [PubMed]
- Mounadi, N.; Nour, H.; Errougui, A.; Talbi, M.; ElKouali, M.; Chtita, S. Discovery of Eugenol-derived Drug Candidates for the Treatment of COVID-19 by Applying Molecular Docking, Molecular Dynamics, and Pharmacokinetic Analysis. Phys. Chem. Res. 2024, 12, 289–303. [Google Scholar]
- Morris, G.M.; Huey, R.; Lindstrom, W.M.; Sanner, M.F.; Belew, R.K.; Goodsell, D.S.; Olson, A.J. AutoDock4 and AutoDockTools4: Automated docking with selective receptor flexibility. J. Comput. Chem. 2009, 30, 2785–2791. [Google Scholar] [CrossRef] [PubMed]
- Trott, O.; Olson, A.J. AutoDock Vina: Improving the speed and accuracy of docking with a new scoring function, efficient optimization, and multithreading. J. Comput. Chem. 2009, 31, 455–461. [Google Scholar] [CrossRef] [PubMed]
- Systèmes, D. BIOVIA Discovery Studio. Dassault Systèmes BIOVIA, Discovery Studio Modeling Environment, Release 2017; Dassault Systèmes: Seoul, Republic of Korea, 2016. [Google Scholar]
- Schrodinger, System, Maestro-Desmond Interoperability Tools, Software (2021); Schrödinger, LLC: New York, NY, USA, 2017.
- Roos, K.; Wu, C.; Damm, W.; Reboul, M.; Stevenson, J.; Lü, C.; Dahlgren, M.; Mondal, S.; Chen, W.; Wang, L.; et al. OPLS3E: Extending Force Field Coverage for Drug-Like Small Molecules. J. Chem. Theory Comput. 2019, 15, 1863–1874. [Google Scholar] [CrossRef]


| Symbol Value | Name | Value |
|---|---|---|
| R2 | Coefficient of determination | ≥0.6 |
| Next test set | Minimum number of external test set | ≥5 |
| R2 − Q2cv | Difference between R2 and Q2cv | ≤0.3 |
| Q2cv | Cross-validation coefficient | >0.5 |
| P (95%) | Confidence interval at 95% confidence level | ˂0.05 |
| Parameters | Values | Threshold Value |
|---|---|---|
| Average r2 | 0.09 | ˂R2 |
| Average Q2 | −0.12 | ˂R2CV |
| CRp2 | 0.60 | >0.500 |
| Statistic | Polar Surface Area | Dipolar Moment | Mol Weight |
|---|---|---|---|
| VIF | 2.16 | 2.069 | 1.388 |
| Structures | Dipole Moment | PSA | Mol Wight | pIC50 | hi | Outlier/ Inside | |
|---|---|---|---|---|---|---|---|
| M1 | 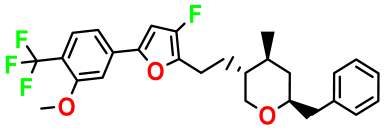 | 3.599 | 27.690 | 476.510 | 7.49 | 0.106 | Inside |
| M2 |  | 3.678 | 43.180 | 476.510 | 7.36 | 0.058 | Inside |
| M3 |  | 3.291 | 63.410 | 460.500 | 7.01 | - | - |
| M4 | 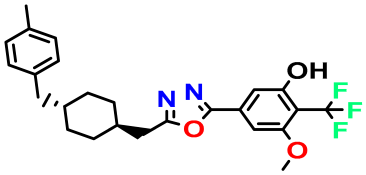 | 3.811 | 63.410 | 460.500 | 7.11 | - | - |
| M5 | 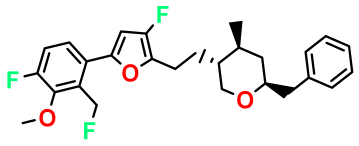 | 2.125 | 27.690 | 458.520 | 7.13 | - | - |
| M6 | 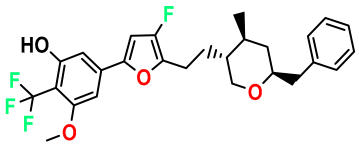 | 2.721 | 47.920 | 492.510 | 7.27 | 0.080 | Inside |
| M7 |  | 3.239 | 88.380 | 478.460 | 6.92 | - | - |
| M8 |  | 2.110 | 47.920 | 474.520 | 7.07 | - | - |
| M9 | 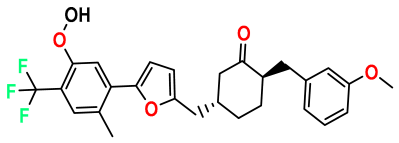 | 4.230 | 64.990 | 488.500 | 7.36 | 0.054 | Inside |
| M10 | 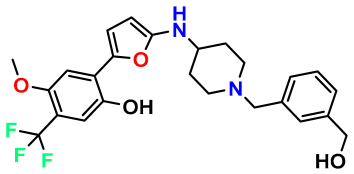 | 5.186 | 74.190 | 476.490 | 7.34 | 0.060 | Inside |
| M11 | 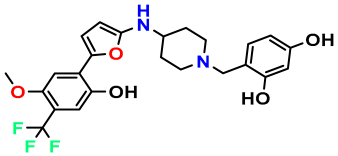 | 5.080 | 94.420 | 478.468 | 7.15 | 0.138 | Inside |
| logP | Molecular Weight | Num. H-Bond Acceptors | Num. H-Bond Donors | |
|---|---|---|---|---|
| M1 | 6.86 | 476.50 | 7 | 0 |
| M2 | 6.71 | 476.51 | 8 | 0 |
| M6 | 6.47 | 492.50 | 8 | 1 |
| M9 | 5.90 | 488.50 | 8 | 1 |
| M10 | 4.40 | 476.49 | 8 | 3 |
| Absorption | Distribution | Metabolism | Excretion | Toxicity | ||||||
|---|---|---|---|---|---|---|---|---|---|---|
| CaCO2 | HIA % | BBB Permeability (log BB) | CNS Permeability (log PS) | CYP2D6 Inhibitor | Total Clearance | AMES Toxicity | LD50 | Hepatotoxicity | Skin Sensitization | |
| M1 | 1.039 | 91.194 | 0.39 | −1.292 | No | 0.336 | No | 2.553 | No | No |
| M2 | 1.108 | 92.923 | 0.001 | −1.371 | No | 0.261 | No | 2.752 | No | No |
| M6 | 1.025 | 88.775 | 0.12 | −1.56 | No | 0.214 | No | 2.366 | No | No |
| M9 | 0.457 | 91.153 | −0.96 | −1.692 | No | 0.239 | No | 2.964 | No | No |
| M10 | 0.947 | 88.76 | −1.299 | −2.193 | No | 0.647 | No | 2.85 | Yes | No |
| Ligands | M2 | M1 | M6 | Donepezil |
|---|---|---|---|---|
| Score (kcal/mol) | −13 | −12.6 | −12.4 | −10.8 |
pIC50 = 5.879  | pIC50 = 6.106 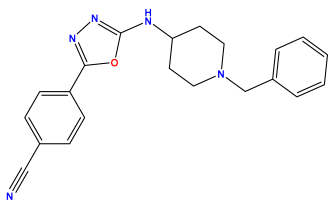 | pIC50 = 6.827 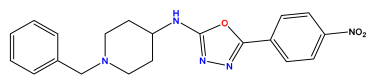 |
pIC50 = 6.578 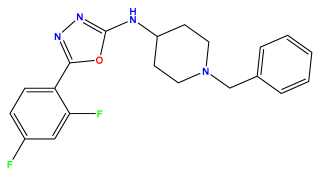 | pIC50 = 6.082 | pIC50 = 7.125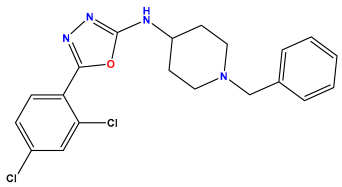 |
pIC50 = 7.260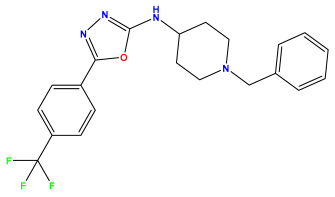 | pIC50 = 7.018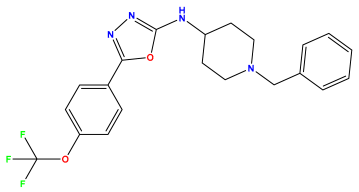 | pIC50 = 5.770 |
pIC50 = 5.979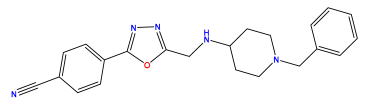 | pIC50 = 6.654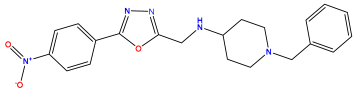 | pIC50 = 6.449 |
pIC50 = 5.785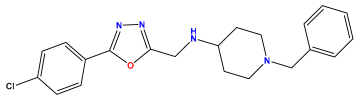 | pIC50 = 7.066 | pIC50 = 6.842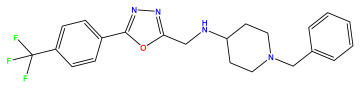 |
pIC50 = 6.924  | pIC50 = 5.863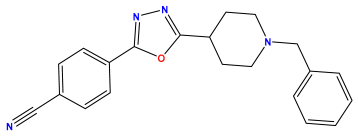 | pIC50 = 6.629 |
pIC50 = 5.457 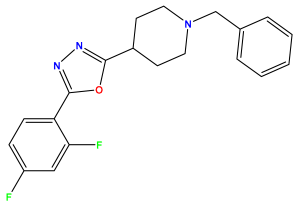 | pIC50 = 7.009 | pIC50 = 5.487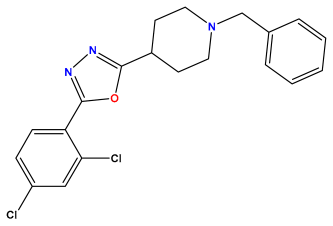 |
pIC50 = 6.684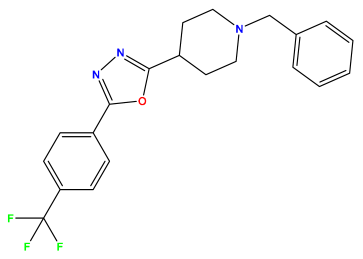 | pIC50 = 6.790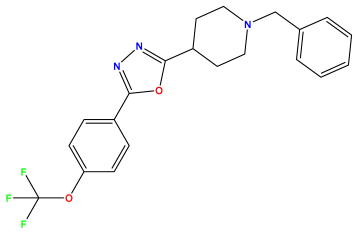 | pIC50 = 5.678  |
pIC50 = 5.553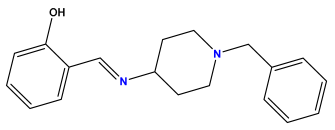 | pIC50 = 5.319  | pIC50 = 5.585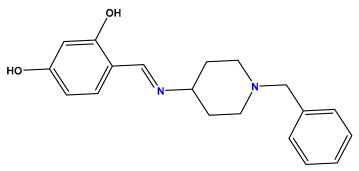 |
pIC50 = 5.357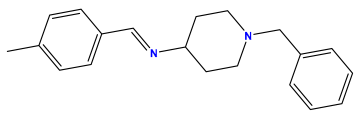 | pIC50 = 6.046 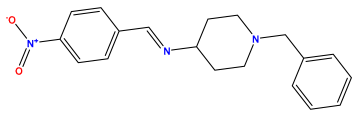 | pIC50 = 6.357 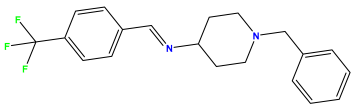 |
pIC50 = 6.000 | pIC50 = 5.824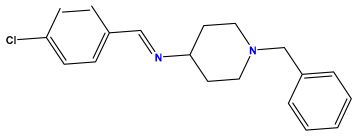 | pIC50 = 5.886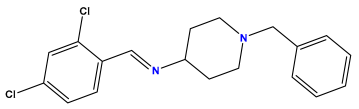 |
pIC50 = 5.538 | pIC50 = 5.886 | pIC50 = 5.658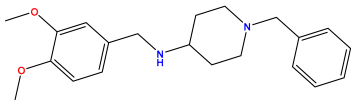 |
pIC50 = 5.770 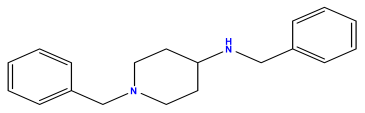 | pIC50 = 5.658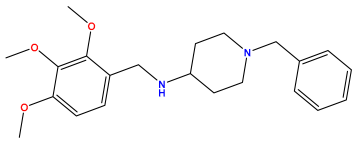 | pIC50 = 5.620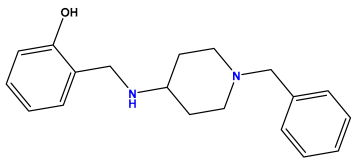 |
pIC50 = 5.398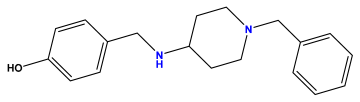 | pIC50 = 5.638 | pIC50 = 5.387 |
pIC50 = 5.432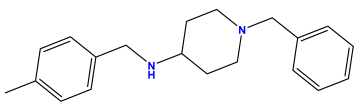 | pIC50 = 6.143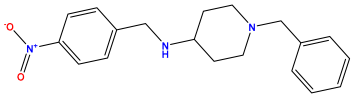 | pIC50 = 6.959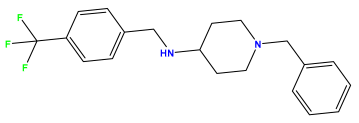 |
pIC50 = 6.230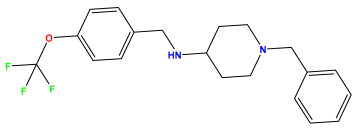 | pIC50 = 6.071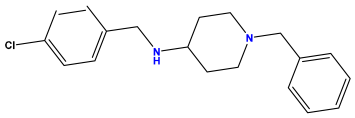 | pIC50 = 6.208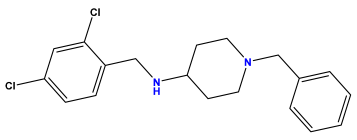 |
pIC50 = 5.921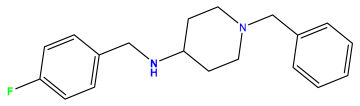 | pIC50 = 6.149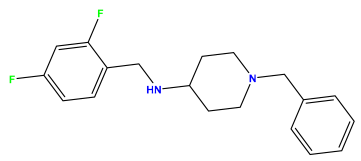 |
Disclaimer/Publisher’s Note: The statements, opinions and data contained in all publications are solely those of the individual author(s) and contributor(s) and not of MDPI and/or the editor(s). MDPI and/or the editor(s) disclaim responsibility for any injury to people or property resulting from any ideas, methods, instructions or products referred to in the content. |
© 2024 by the authors. Licensee MDPI, Basel, Switzerland. This article is an open access article distributed under the terms and conditions of the Creative Commons Attribution (CC BY) license (https://creativecommons.org/licenses/by/4.0/).
Share and Cite
Khedraoui, M.; Abchir, O.; Nour, H.; Yamari, I.; Errougui, A.; Samadi, A.; Chtita, S. An In Silico Study Based on QSAR and Molecular Docking and Molecular Dynamics Simulation for the Discovery of Novel Potent Inhibitor against AChE. Pharmaceuticals 2024, 17, 830. https://doi.org/10.3390/ph17070830
Khedraoui M, Abchir O, Nour H, Yamari I, Errougui A, Samadi A, Chtita S. An In Silico Study Based on QSAR and Molecular Docking and Molecular Dynamics Simulation for the Discovery of Novel Potent Inhibitor against AChE. Pharmaceuticals. 2024; 17(7):830. https://doi.org/10.3390/ph17070830
Chicago/Turabian StyleKhedraoui, Meriem, Oussama Abchir, Hassan Nour, Imane Yamari, Abdelkbir Errougui, Abdelouahid Samadi, and Samir Chtita. 2024. "An In Silico Study Based on QSAR and Molecular Docking and Molecular Dynamics Simulation for the Discovery of Novel Potent Inhibitor against AChE" Pharmaceuticals 17, no. 7: 830. https://doi.org/10.3390/ph17070830