
Network Pharmacology Identifies Intersection Genes of Apigenin and Naringenin in Down Syndrome as Potential Therapeutic Targets

Abstract
:1. Introduction
2. Results
2.1. Protein–Protein Interactions (PPI) Analysis
2.2. Molecular Docking Analysis
2.3. Protein–Ligand Interaction Analysis from Molecular Docking
2.4. Molecular Dynamic Simulation
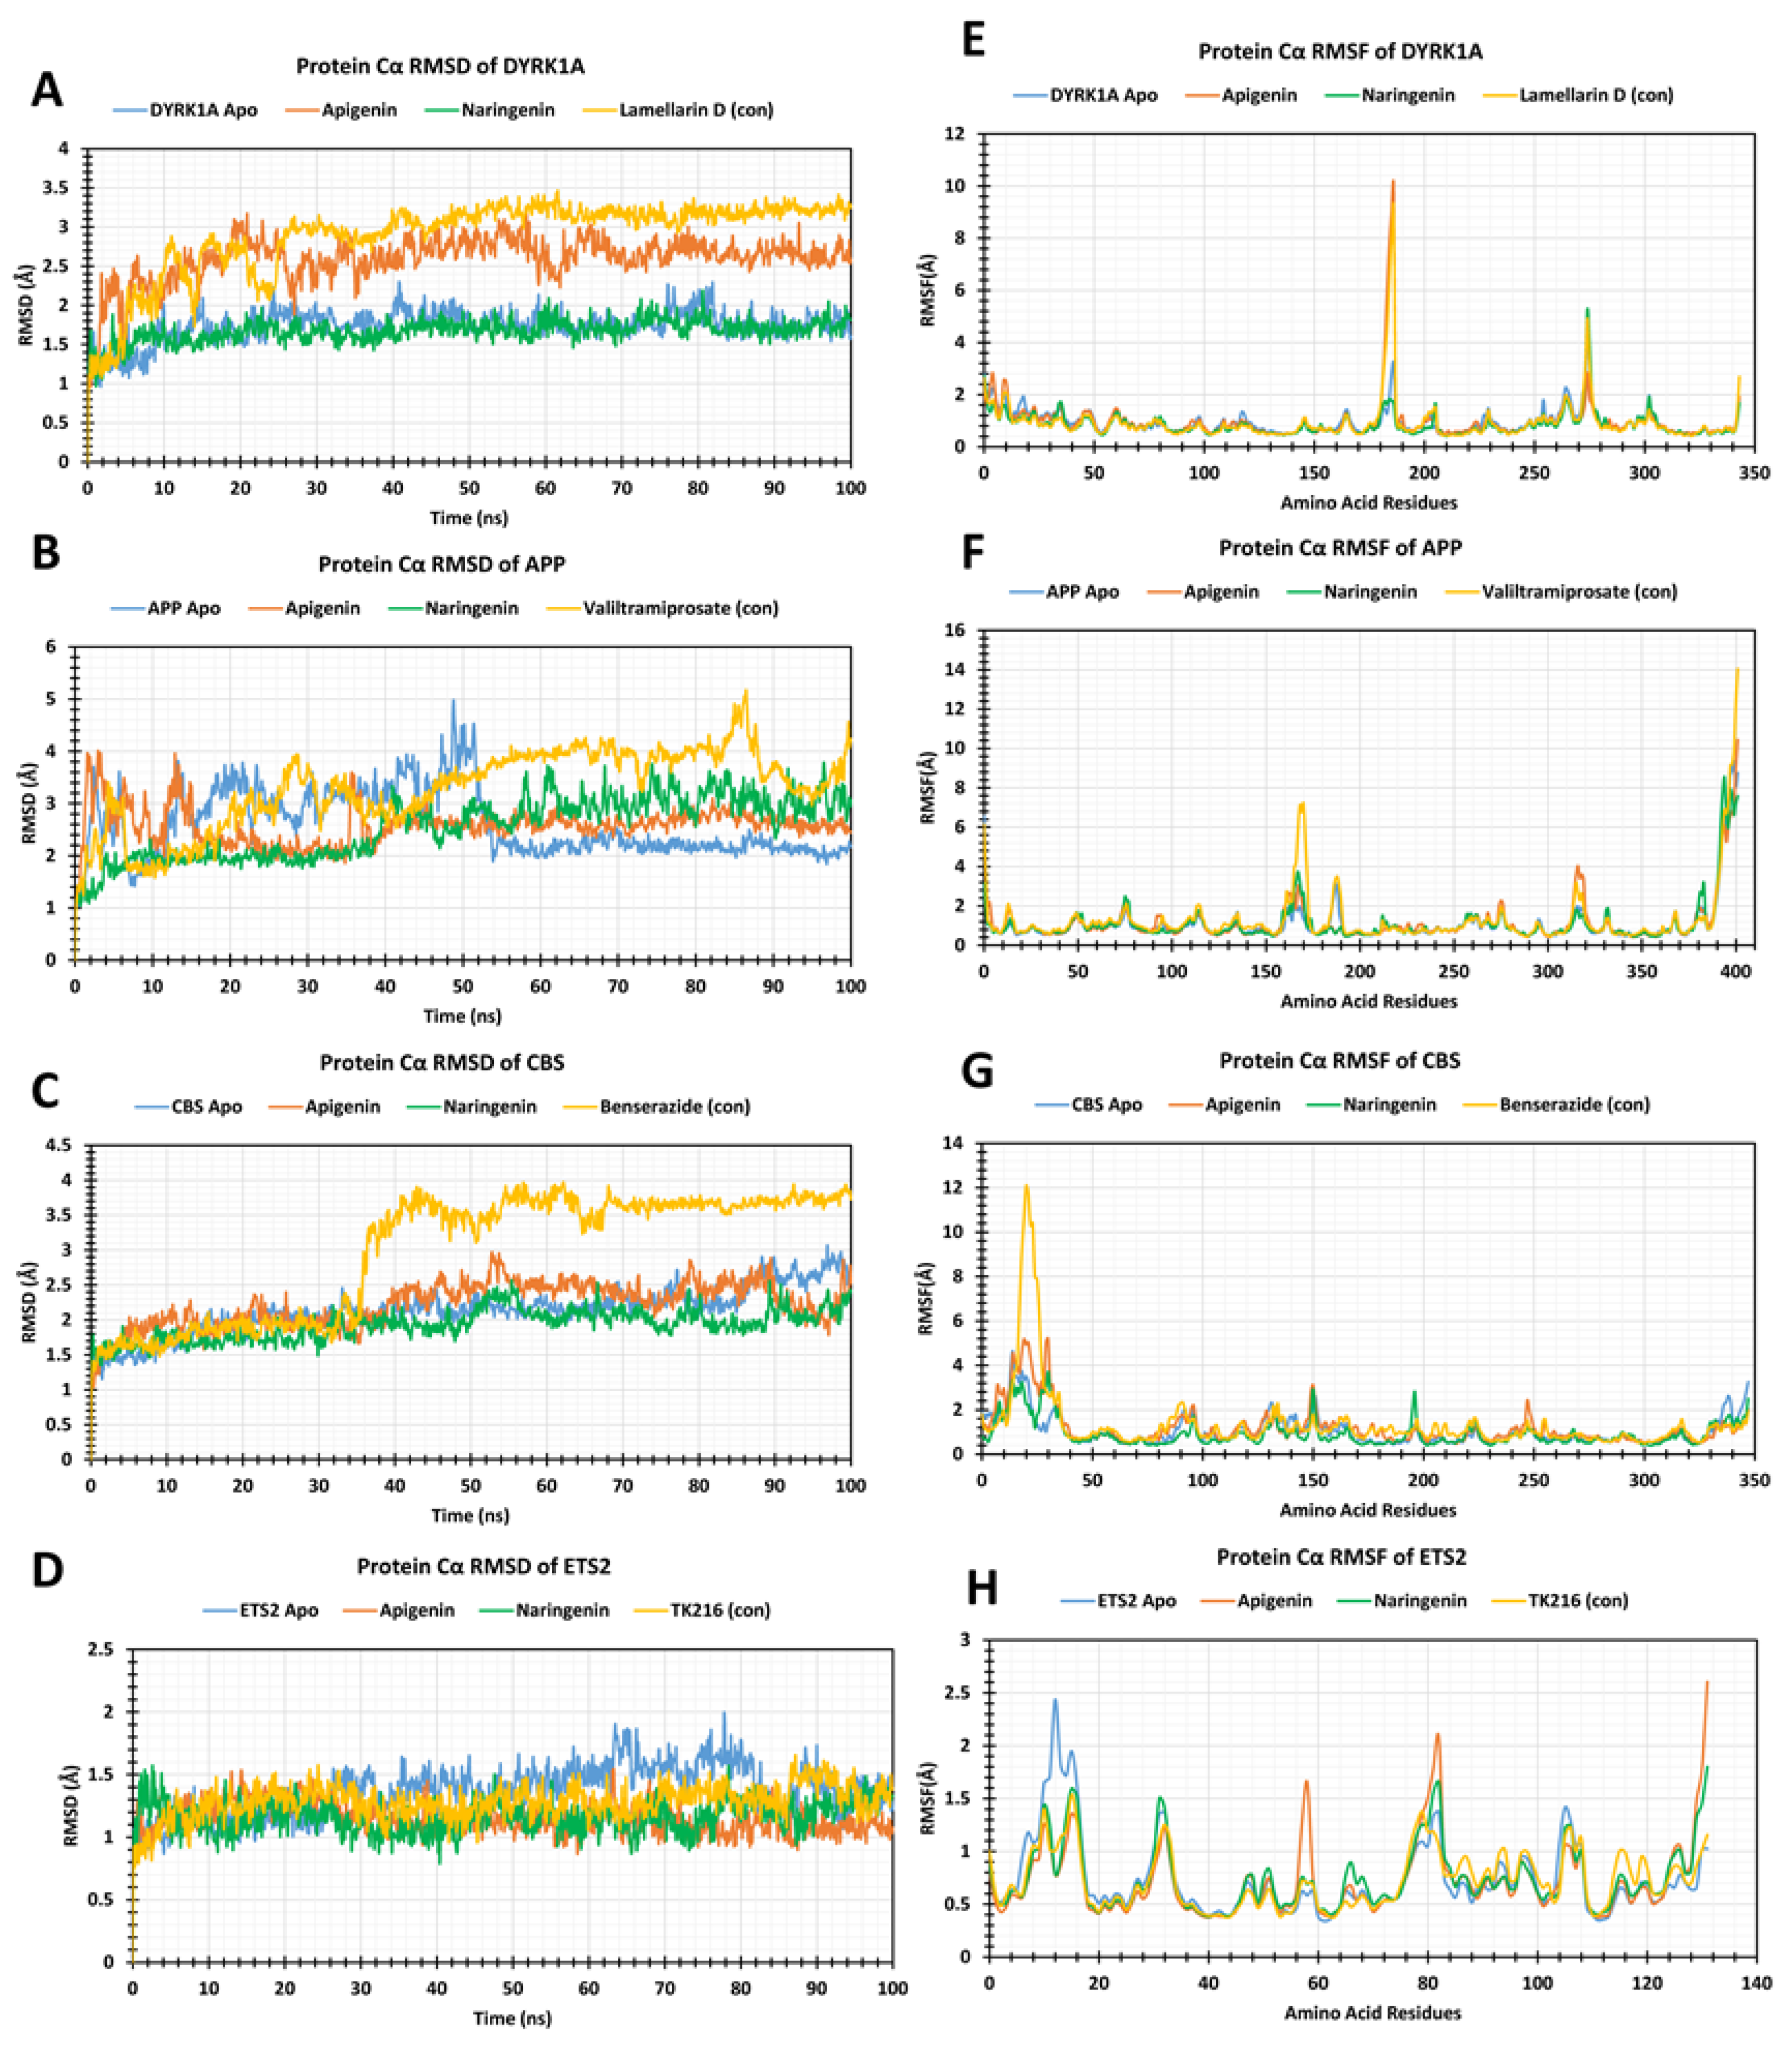
2.5. RMSD Analysis
2.6. RMSF Analysis
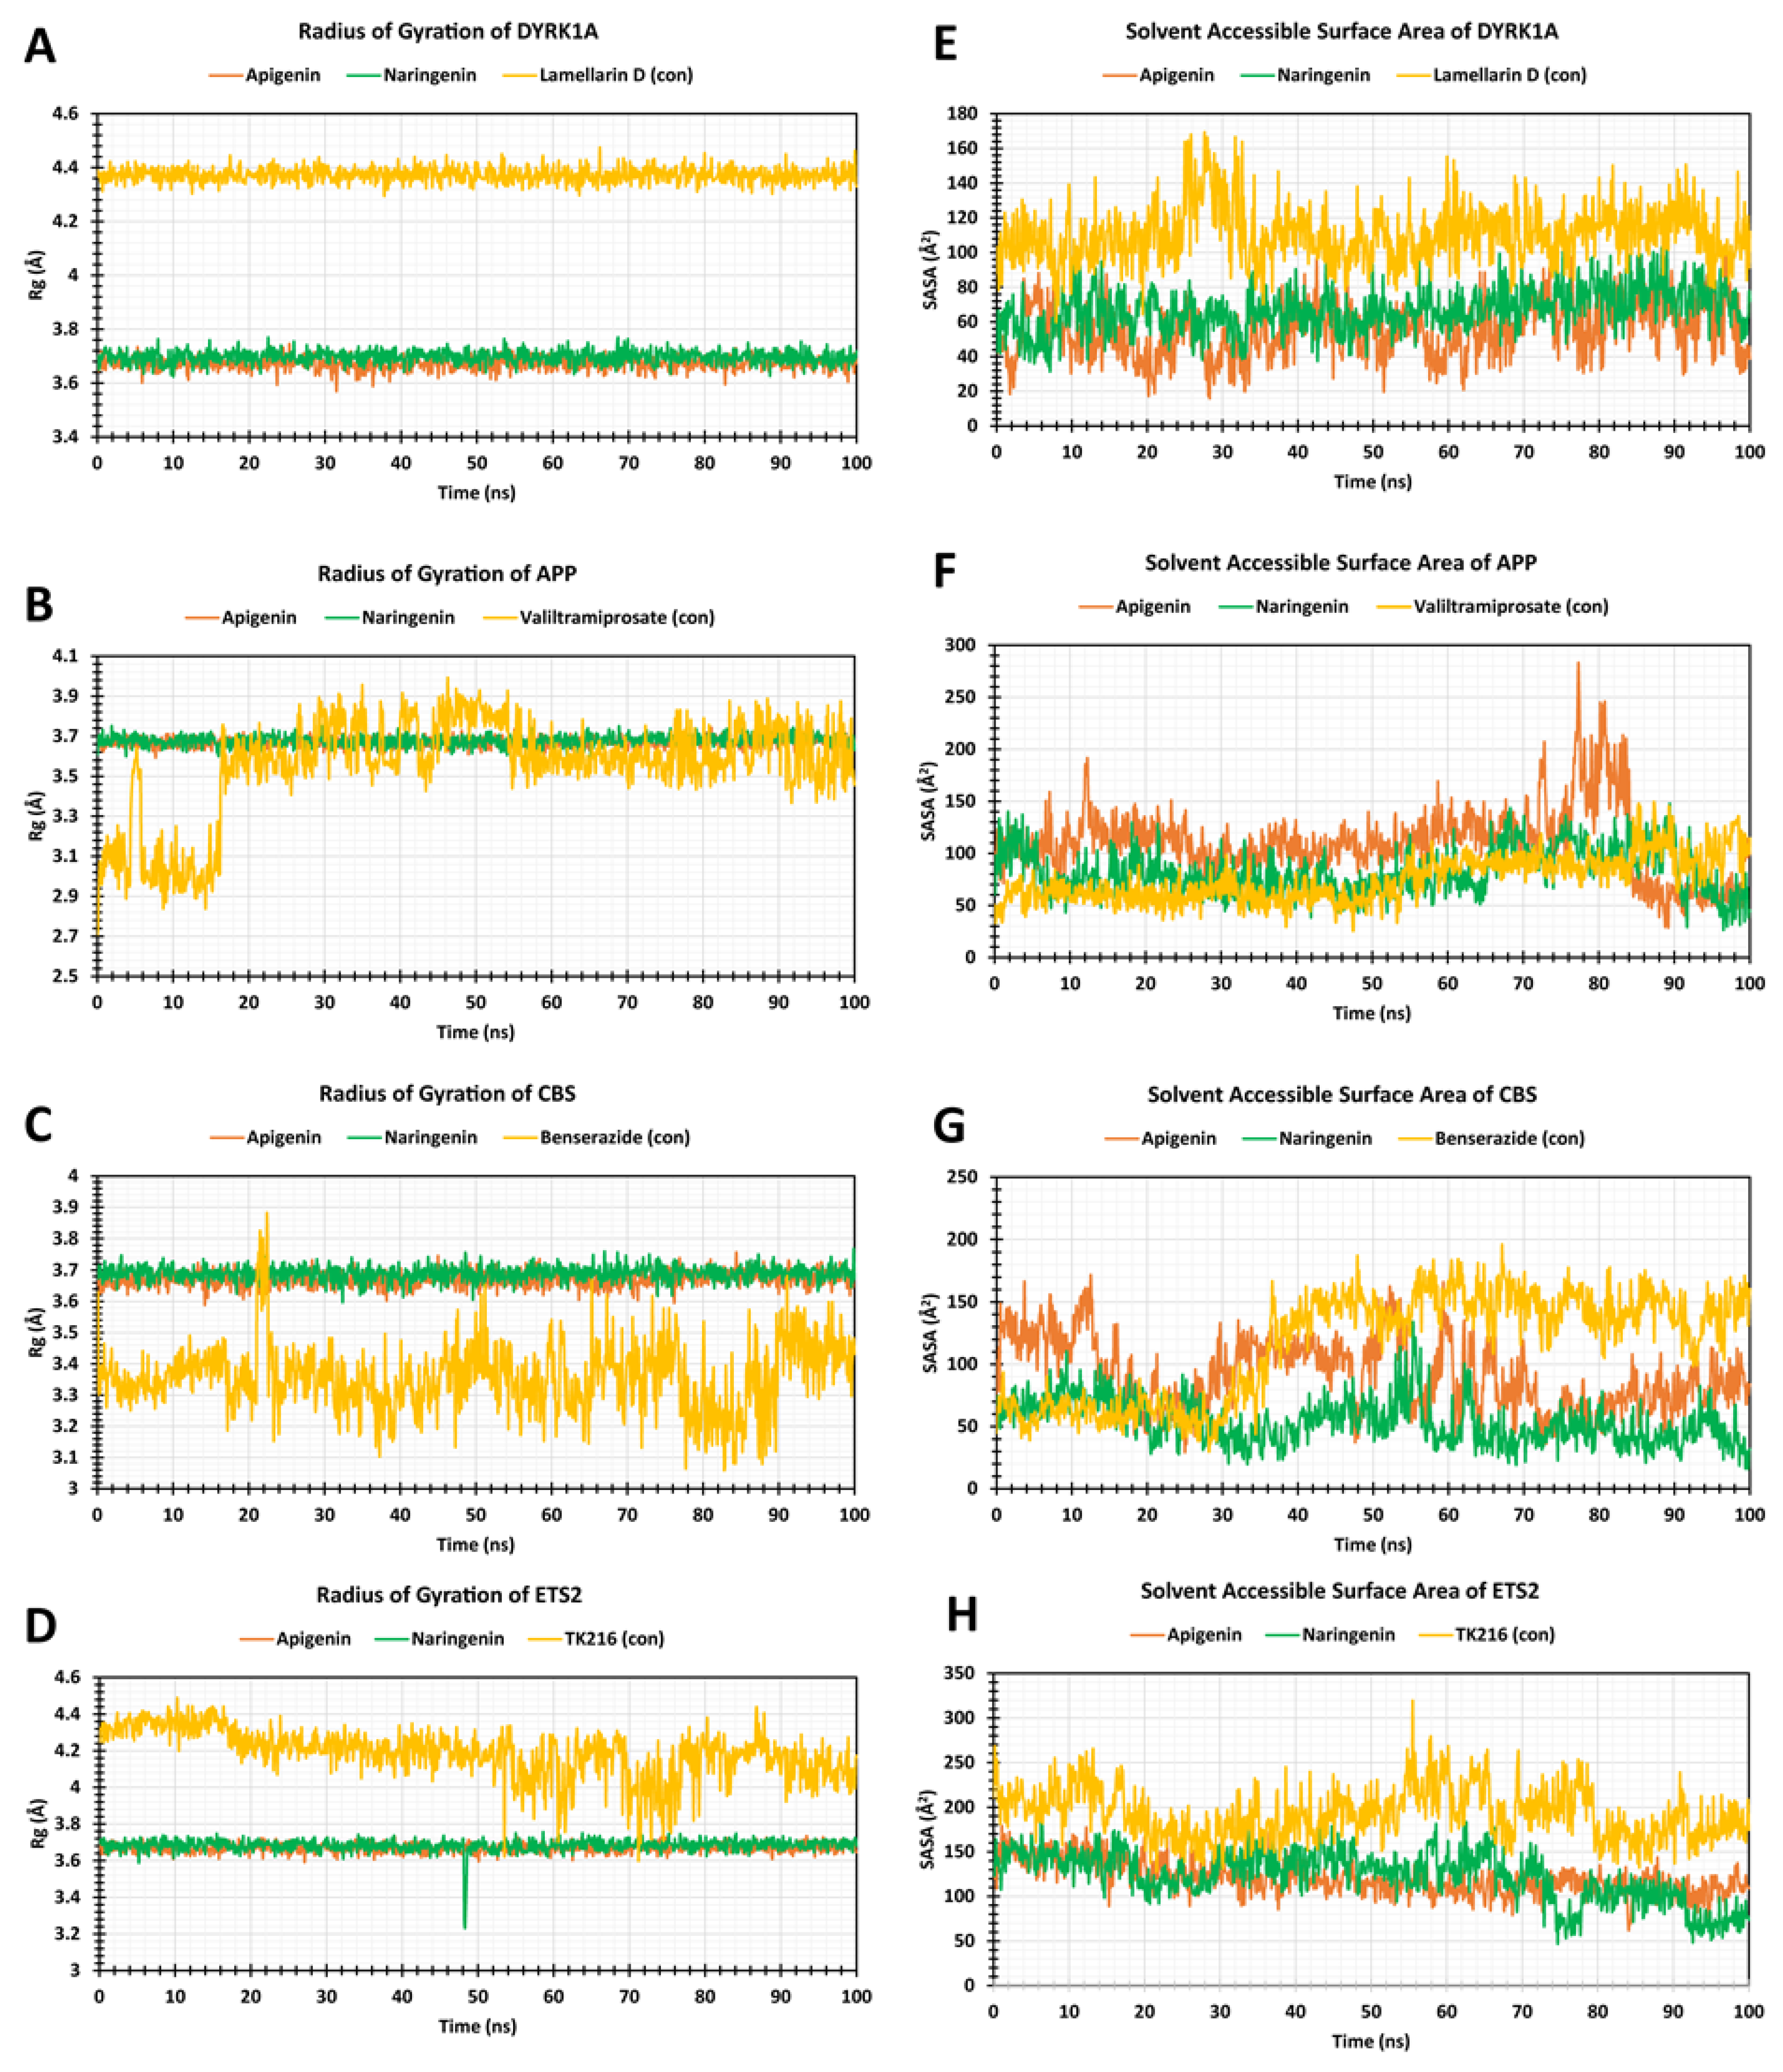
2.7. The Radius of Gyration (Rg)
2.8. Solvent-Accessible Surface Area
3. Discussion
4. Materials and Methods
4.1. Protein–Protein Interaction Analysis
4.2. Protein Preparation
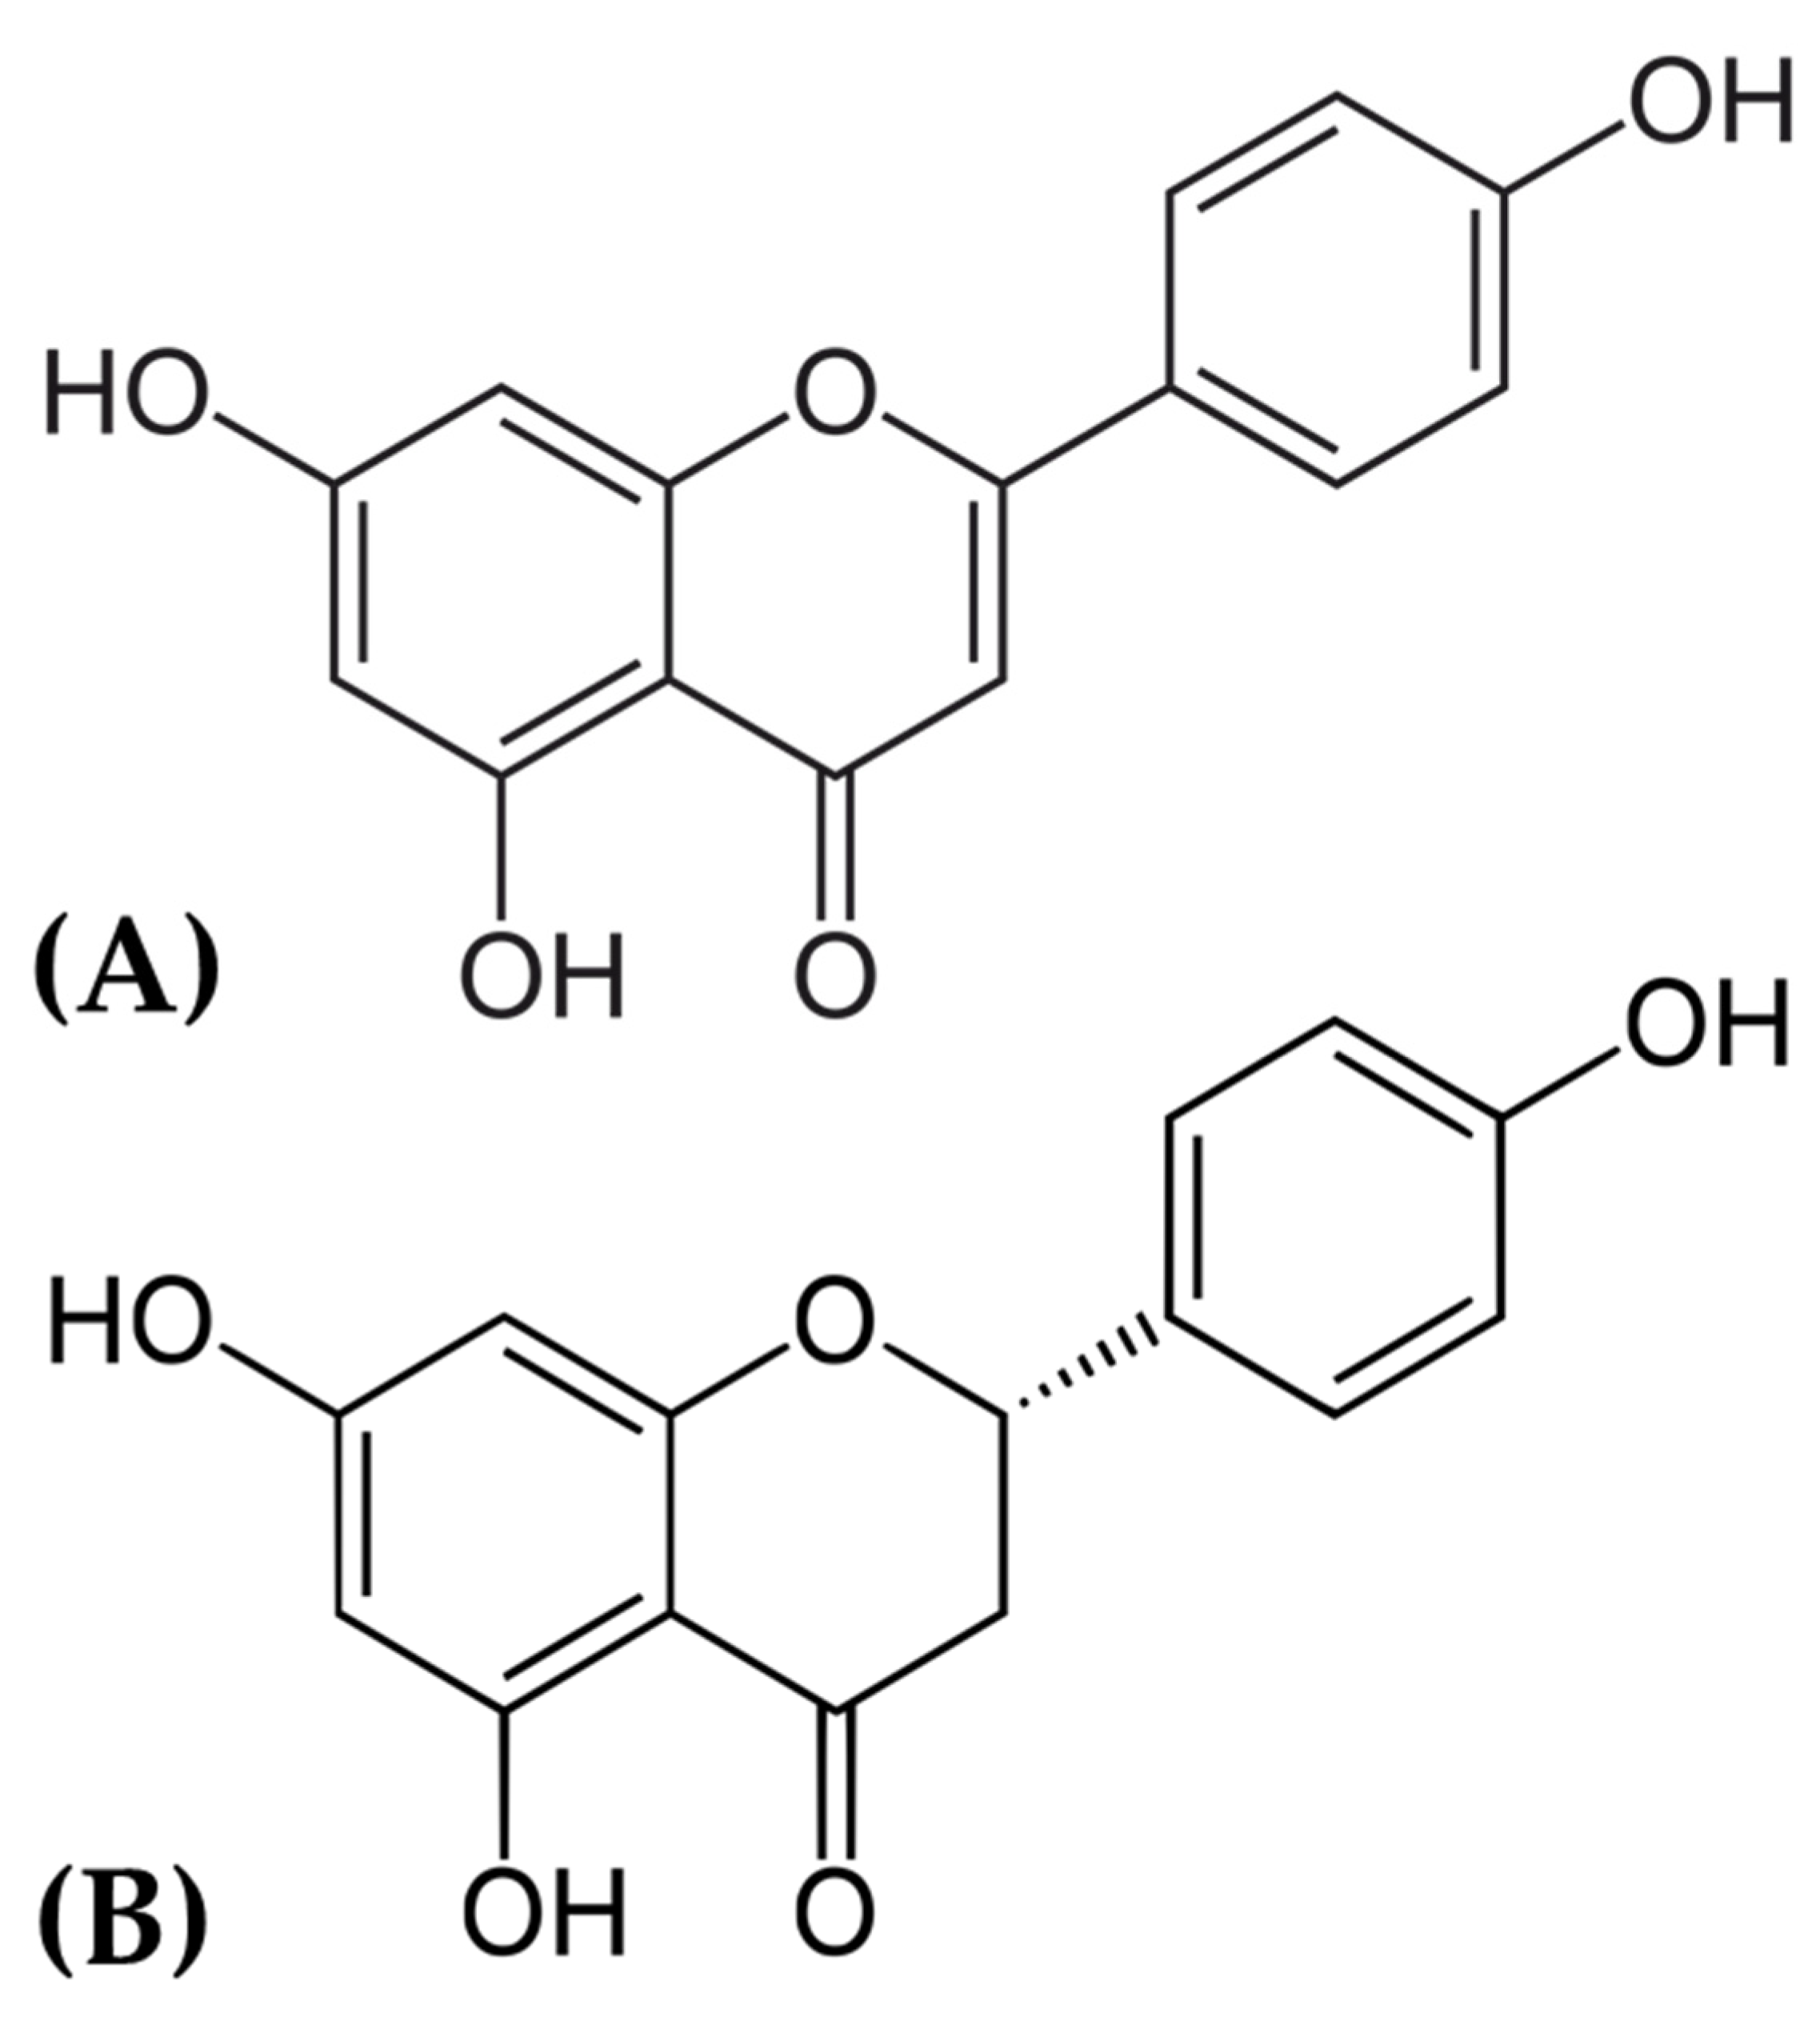
4.3. Ligand Retrieval and Preparation
4.4. Active Site Identification and Receptor Grid Generation
4.5. Molecular Docking
4.6. Molecular Dynamics Simulation
5. Conclusions
Supplementary Materials
Author Contributions
Funding
Institutional Review Board Statement
Informed Consent Statement
Data Availability Statement
Acknowledgments
Conflicts of Interest
Abbreviations
References
- Bull, M.J. Down Syndrome. N. Engl. J. Med. 2020, 382, 2344–2352. [Google Scholar] [CrossRef]
- Antonarakis, S.E.; Skotko, B.G.; Rafii, M.S.; Strydom, A.; Pape, S.E.; Bianchi, D.W.; Sherman, S.L.; Reeves, R.H. Down syndrome. Nat. Rev. Dis. Primers 2020, 6, 9. [Google Scholar] [CrossRef]
- Roizen, N.J.; Patterson, D. Down’s syndrome. Lancet 2003, 361, 1281–1289. [Google Scholar] [CrossRef] [PubMed]
- Queremel Milani, D.; Tadi, P. Genetics, Chromosome Abnormalities. [Updated 2023 April 24]. In StatPearls [Internet]; StatPearls Publishing: Treasure Island, FL, USA, 2024. Available online: https://www.ncbi.nlm.nih.gov/books/NBK557691/ (accessed on 25 December 2023).
- Chen, X.Q.; Xing, Z.; Chen, Q.D.; Salvi, R.J.; Zhang, X.; Tycko, B.; Mobley, W.C.; Yu, Y.E. Mechanistic Analysis of Age-Related Clinical Manifestations in Down Syndrome. Front. Aging Neurosci. 2021, 13, 700280. [Google Scholar] [CrossRef] [PubMed]
- Roizen, N.J. Chapter one-Overview of Health Issues among Persons with Down Syndrome. In International Review of Research in Mental Retardation; Urbano, R.C., Ed.; Academic Press: Cambridge, MA, USA, 2010; Volume 39, pp. 2–33. [Google Scholar]
- Moyer, A.J.; Fernandez, F.X.; Li, Y.; Klinedinst, D.K.; Florea, L.D.; Kazuki, Y.; Oshimura, M.; Reeves, R.H. Overexpression screen of chromosome 21 genes reveals modulators of Sonic hedgehog signaling relevant to Down syndrome. Dis. Model. Mech. 2023, 16, dmm049712. [Google Scholar] [CrossRef]
- Ruparelia, A.; Wiseman, F.; Sheppard, O.; Tybulewicz, V.L.; Fisher, E.M. Down syndrome and the molecular pathogenesis resulting from trisomy of human chromosome 21. J. Biomed. Res. 2010, 24, 87–99. [Google Scholar] [CrossRef]
- Buczynska, A.; Sidorkiewicz, I.; Kretowski, A.J.; Zbucka-Kretowska, M. The Role of Oxidative Stress in Trisomy 21 Phenotype. Cell Mol. Neurobiol. 2023, 43, 3943–3963. [Google Scholar] [CrossRef]
- Rondal, J.A. Down syndrome: A curative prospect? AIMS Neurosci. 2020, 7, 168–193. [Google Scholar] [CrossRef]
- Feki, A.; Hibaoui, Y. DYRK1A Protein, A Promising Therapeutic Target to Improve Cognitive Deficits in Down Syndrome. Brain Sci. 2018, 8, 187. [Google Scholar] [CrossRef]
- Selkoe, D.J.; Hardy, J. The amyloid hypothesis of Alzheimer’s disease at 25 years. EMBO Mol. Med. 2016, 8, 595–608. [Google Scholar] [CrossRef] [PubMed]
- Koklesova, L.; Mazurakova, A.; Samec, M.; Biringer, K.; Samuel, S.M.; Busselberg, D.; Kubatka, P.; Golubnitschaja, O. Homocysteine metabolism as the target for predictive medical approach, disease prevention, prognosis, and treatments tailored to the person. EPMA J. 2021, 12, 477–505. [Google Scholar] [CrossRef] [PubMed]
- Wolvetang, E.J.; Wilson, T.J.; Sanij, E.; Busciglio, J.; Hatzistavrou, T.; Seth, A.; Hertzog, P.J.; Kola, I. ETS2 overexpression in transgenic models and in Down syndrome predisposes to apoptosis via the p53 pathway. Hum. Mol. Genet. 2003, 12, 247–255. [Google Scholar] [CrossRef]
- Chandran, U.; Mehendale, N.; Patil, S.; Chaguturu, R.; Patwardhan, B. Network Pharmacology. Innov. Approaches Drug Discov. 2017, 127–164. [Google Scholar]
- Zhang, G.B.; Li, Q.Y.; Chen, Q.L.; Su, S.B. Network pharmacology: A new approach for chinese herbal medicine research. Evid. Based Complement. Alternat Med. 2013, 2013, 621423. [Google Scholar] [CrossRef]
- Li, L.; Yang, L.; Yang, L.; He, C.; He, Y.; Chen, L.; Dong, Q.; Zhang, H.; Chen, S.; Li, P. Network pharmacology: A bright guiding light on the way to explore the personalized precise medication of traditional Chinese medicine. Chin. Med. 2023, 18, 146. [Google Scholar] [CrossRef] [PubMed]
- Zhao, J.; Mo, C.; Shi, W.; Meng, L.; Ai, J. Network Pharmacology Combined with Bioinformatics to Investigate the Mechanisms and Molecular Targets of Astragalus Radix-Panax notoginseng Herb Pair on Treating Diabetic Nephropathy. Evid. Based Complement. Alternat Med. 2021, 2021, 9980981. [Google Scholar] [CrossRef]
- Kim, H.; Lee, K.S.; Kim, A.K.; Choi, M.; Choi, K.; Kang, M.; Chi, S.W.; Lee, M.S.; Lee, J.S.; Lee, S.Y.; et al. A chemical with proven clinical safety rescues Down-syndrome-related phenotypes in through DYRK1A inhibition. Dis. Model. Mech. 2016, 9, 839–848. [Google Scholar] [CrossRef]
- Rueda Revilla, N.; Martinez-Cue, C. Antioxidants in Down Syndrome: From Preclinical Studies to Clinical Trials. Antioxidants 2020, 9, 692. [Google Scholar] [CrossRef] [PubMed]
- Mamun, A.A.; Shao, C.; Geng, P.; Wang, S.; Xiao, J. Polyphenols Targeting NF-kappaB Pathway in Neurological Disorders: What We Know So Far? Int. J. Biol. Sci. 2024, 20, 1332–1355. [Google Scholar] [CrossRef]
- Anand, S.; Sowbhagya, R.; Ansari, M.A.; Alzohairy, M.A.; Alomary, M.N.; Almalik, A.I.; Ahmad, W.; Tripathi, T.; Elderdery, A.Y. Polyphenols and Their Nanoformulations: Protective Effects against Human Diseases. Life 2022, 12, 1639. [Google Scholar] [CrossRef]
- Grabska-Kobylecka, I.; Szpakowski, P.; Krol, A.; Ksiazek-Winiarek, D.; Kobylecki, A.; Glabinski, A.; Nowak, D. Polyphenols and Their Impact on the Prevention of Neurodegenerative Diseases and Development. Nutrients 2023, 15, 3454. [Google Scholar] [CrossRef]
- Mazzanti, G.; Di Giacomo, S. Curcumin and Resveratrol in the Management of Cognitive Disorders: What is the Clinical Evidence? Molecules 2016, 21, 1243. [Google Scholar] [CrossRef] [PubMed]
- Neumann, F.; Gourdain, S.; Albac, C.; Dekker, A.D.; Bui, L.C.; Dairou, J.; Schmitz-Afonso, I.; Hue, N.; Rodrigues-Lima, F.; Delabar, J.M.; et al. DYRK1A inhibition and cognitive rescue in a Down syndrome mouse model are induced by new fluoro-DANDY derivatives. Sci. Rep. 2018, 8, 2859. [Google Scholar] [CrossRef] [PubMed]
- Bellavite, P. Neuroprotective Potentials of Flavonoids: Experimental Studies and Mechanisms of Action. Antioxidants 2023, 12, 280. [Google Scholar] [CrossRef]
- Emran, T.B.; Islam, F.; Nath, N.; Sutradhar, H.; Das, R.; Mitra, S.; Alshahrani, M.M.; Alhasaniah, A.H.; Sharma, R. Naringin and Naringenin Polyphenols in Neurological Diseases: Understandings from a Therapeutic Viewpoint. Life 2022, 13, 99. [Google Scholar] [CrossRef]
- Arafah, A.; Rehman, M.U.; Mir, T.M.; Wali, A.F.; Ali, R.; Qamar, W.; Khan, R.; Ahmad, A.; Aga, S.S.; Alqahtani, S.; et al. Multi-Therapeutic Potential of Naringenin (4′,5,7-Trihydroxyflavonone): Experimental Evidence and Mechanisms. Plants 2020, 9, 1784. [Google Scholar] [CrossRef]
- Salehi, B.; Venditti, A.; Sharifi-Rad, M.; Kregiel, D.; Sharifi-Rad, J.; Durazzo, A.; Lucarini, M.; Santini, A.; Souto, E.B.; Novellino, E.; et al. The Therapeutic Potential of Apigenin. Int. J. Mol. Sci. 2019, 20, 1305. [Google Scholar] [CrossRef]
- Shilpa, V.S.; Shams, R.; Dash, K.K.; Pandey, V.K.; Dar, A.H.; Ayaz Mukarram, S.; Harsanyi, E.; Kovacs, B. Phytochemical Properties, Extraction, and Pharmacological Benefits of Naringin: A Review. Molecules 2023, 28, 5623. [Google Scholar] [CrossRef]
- Stabrauskiene, J.; Kopustinskiene, D.M.; Lazauskas, R.; Bernatoniene, J. Naringin and Naringenin: Their Mechanisms of Action and the Potential Anticancer Activities. Biomedicines 2022, 10, 1686. [Google Scholar] [CrossRef]
- Nouri, Z.; Fakhri, S.; El-Senduny, F.F.; Sanadgol, N.; Abd-ElGhani, G.E.; Farzaei, M.H.; Chen, J.T. On the Neuroprotective Effects of Naringenin: Pharmacological Targets, Signaling Pathways, Molecular Mechanisms, and Clinical Perspective. Biomolecules 2019, 9, 690. [Google Scholar] [CrossRef]
- Meng, X.Y.; Zhang, H.X.; Mezei, M.; Cui, M. Molecular docking: A powerful approach for structure-based drug discovery. Curr. Comput. Aided Drug Des. 2011, 7, 146–157. [Google Scholar] [CrossRef] [PubMed]
- Torres, P.H.M.; Sodero, A.C.R.; Jofily, P.; Silva-Jr, F.P. Key Topics in Molecular Docking for Drug Design. Int. J. Mol. Sci. 2019, 20, 4574. [Google Scholar] [CrossRef] [PubMed]
- Kapla, J.; Rodriguez-Espigares, I.; Ballante, F.; Selent, J.; Carlsson, J. Can molecular dynamics simulations improve the structural accuracy and virtual screening performance of GPCR models? PLoS Comput. Biol. 2021, 17, e1008936. [Google Scholar] [CrossRef] [PubMed]
- Hollingsworth, S.A.; Dror, R.O. Molecular Dynamics Simulation for All. Neuron 2018, 99, 1129–1143. [Google Scholar] [CrossRef] [PubMed]
- Baig, M.H.; Ahmad, K.; Rabbani, G.; Danishuddin, M.; Choi, I. Computer Aided Drug Design and its Application to the Development of Potential Drugs for Neurodegenerative Disorders. Curr. Neuropharmacol. 2018, 16, 740–748. [Google Scholar] [CrossRef]
- Aghajani, J.; Farnia, P.; Farnia, P.; Ghanavi, J.; Velayati, A.A. Molecular Dynamic Simulations and Molecular Docking as a Potential Way for Designed New Inhibitor Drug without Resistance. Tanaffos 2022, 21, 1–14. [Google Scholar]
- Challapa-Mamani, M.R.; Tomas-Alvarado, E.; Espinoza-Baigorria, A.; Leon-Figueroa, D.A.; Sah, R.; Rodriguez-Morales, A.J.; Barboza, J.J. Molecular Docking and Molecular Dynamics Simulations in Related to Leishmania donovani: An Update and Literature Review. Trop. Med. Infect. Dis. 2023, 8, 457. [Google Scholar] [CrossRef]
- Yu, W.; MacKerell, A.D., Jr. Computer-Aided Drug Design Methods. Methods Mol. Biol. 2017, 1520, 85–106. [Google Scholar] [CrossRef] [PubMed]
- Sliwoski, G.; Kothiwale, S.; Meiler, J.; Lowe, E.W., Jr. Computational methods in drug discovery. Pharmacol. Rev. 2014, 66, 334–395. [Google Scholar] [CrossRef]
- Vacca, R.A.; Valenti, D.; Caccamese, S.; Daglia, M.; Braidy, N.; Nabavi, S.M. Plant polyphenols as natural drugs for the management of Down syndrome and related disorders. Neurosci. Biobehav. Rev. 2016, 71, 865–877. [Google Scholar] [CrossRef]
- Guedj, F.; Sebrie, C.; Rivals, I.; Ledru, A.; Paly, E.; Bizot, J.C.; Smith, D.; Rubin, E.; Gillet, B.; Arbones, M.; et al. Green tea polyphenols rescue of brain defects induced by overexpression of DYRK1A. PLoS ONE 2009, 4, e4606. [Google Scholar] [CrossRef] [PubMed]
- Yang, Y.; Fan, X.; Liu, Y.; Ye, D.; Liu, C.; Yang, H.; Su, Z.; Zhang, Y.; Liu, Y. Function and inhibition of DYRK1A: Emerging roles of treating multiple human diseases. Biochem. Pharmacol. 2023, 212, 115521. [Google Scholar] [CrossRef] [PubMed]
- Laham, A.J.; Saber-Ayad, M.; El-Awady, R. DYRK1A: A down syndrome-related dual protein kinase with a versatile role in tumorigenesis. Cell. Mol. Life Sci. 2021, 78, 603–619. [Google Scholar] [CrossRef] [PubMed]
- Doran, E.; Keator, D.; Head, E.; Phelan, M.J.; Kim, R.; Totoiu, M.; Barrio, J.R.; Small, G.W.; Potkin, S.G.; Lott, I.T. Down Syndrome, Partial Trisomy 21, and Absence of Alzheimer’s Disease: The Role of APP. J. Alzheimer’s Dis. 2017, 56, 459–470. [Google Scholar] [CrossRef]
- O’Brien, R.J.; Wong, P.C. Amyloid precursor protein processing and Alzheimer’s disease. Annu. Rev. Neurosci. 2011, 34, 185–204. [Google Scholar] [CrossRef] [PubMed]
- Murphy, M.P.; LeVine, H., 3rd. Alzheimer’s disease and the amyloid-beta peptide. J. Alzheimer’s Dis. 2010, 19, 311–323. [Google Scholar] [CrossRef] [PubMed]
- Kobayashi, H.; Murata, M.; Kawanishi, S.; Oikawa, S. Polyphenols with Anti-Amyloid beta Aggregation Show Potential Risk of Toxicity Via Pro-Oxidant Properties. Int. J. Mol. Sci. 2020, 21, 3561. [Google Scholar] [CrossRef] [PubMed]
- Ono, K.; Yoshiike, Y.; Takashima, A.; Hasegawa, K.; Naiki, H.; Yamada, M. Potent anti-amyloidogenic and fibril-destabilizing effects of polyphenols in vitro: Implications for the prevention and therapeutics of Alzheimer’s disease. J. Neurochem. 2003, 87, 172–181. [Google Scholar] [CrossRef]
- Phan, H.T.T.; Samarat, K.; Takamura, Y.; Azo-Oussou, A.F.; Nakazono, Y.; Vestergaard, M.C. Polyphenols Modulate Alzheimer’s Amyloid Beta Aggregation in a Structure-Dependent Manner. Nutrients 2019, 11, 756. [Google Scholar] [CrossRef]
- Enokido, Y.; Suzuki, E.; Iwasawa, K.; Namekata, K.; Okazawa, H.; Kimura, H. Cystathionine beta-synthase, a key enzyme for homocysteine metabolism, is preferentially expressed in the radial glia/astrocyte lineage of developing mouse CNS. FASEB J. 2005, 19, 1854–1856. [Google Scholar] [CrossRef]
- Luzzi, S.; Cherubini, V.; Falsetti, L.; Viticchi, G.; Silvestrini, M.; Toraldo, A. Homocysteine, Cognitive Functions, and Degenerative Dementias: State of the Art. Biomedicines 2022, 10, 2741. [Google Scholar] [CrossRef]
- Maron, B.A.; Loscalzo, J. The treatment of hyperhomocysteinemia. Annu. Rev. Med. 2009, 60, 39–54. [Google Scholar] [CrossRef] [PubMed]
- Khurana, S.; Venkataraman, K.; Hollingsworth, A.; Piche, M.; Tai, T.C. Polyphenols: Benefits to the cardiovascular system in health and in aging. Nutrients 2013, 5, 3779–3827. [Google Scholar] [CrossRef] [PubMed]
- Michalska, M.; Gluba, A.; Mikhailidis, D.P.; Nowak, P.; Bielecka-Dabrowa, A.; Rysz, J.; Banach, M. The role of polyphenols in cardiovascular disease. Med. Sci. Monit. 2010, 16, RA110–RA119. [Google Scholar] [PubMed]
- Liu, X.; Zhang, C.; Zhang, Z.; Zhang, Z.; Ji, W.; Cao, S.; Cai, X.; Lei, D.; Pan, X. E26 Transformation-Specific Transcription Factor ETS2 as an Oncogene Promotes the Progression of Hypopharyngeal Cancer. Cancer Biother. Radiopharm. 2017, 32, 327–334. [Google Scholar] [CrossRef]
- Wolvetang, E.J.; Bradfield, O.M.; Hatzistavrou, T.; Crack, P.J.; Busciglio, J.; Kola, I.; Hertzog, P.J. Overexpression of the chromosome 21 transcription factor Ets2 induces neuronal apoptosis. Neurobiol. Dis. 2003, 14, 349–356. [Google Scholar] [CrossRef]
- Sharma, J.; Kumar Bhardwaj, V.; Singh, R.; Rajendran, V.; Purohit, R.; Kumar, S. An in-silico evaluation of different bioactive molecules of tea for their inhibition potency against non structural protein-15 of SARS-CoV-2. Food Chem. 2021, 346, 128933. [Google Scholar] [CrossRef]
- Samad, A.; Huq, M.A.; Rahman, M.S. Bioinformatics approaches identified dasatinib and bortezomib inhibit the activity of MCM7 protein as a potential treatment against human cancer. Sci. Rep. 2022, 12, 1539. [Google Scholar] [CrossRef]


| S. No. | Receptor Name | Docking Score (kcal/mol) | |||||
|---|---|---|---|---|---|---|---|
| Apigenin | Naringenin | Lamellarin D | Valiltramiprosate | Benserazide | TK216 | ||
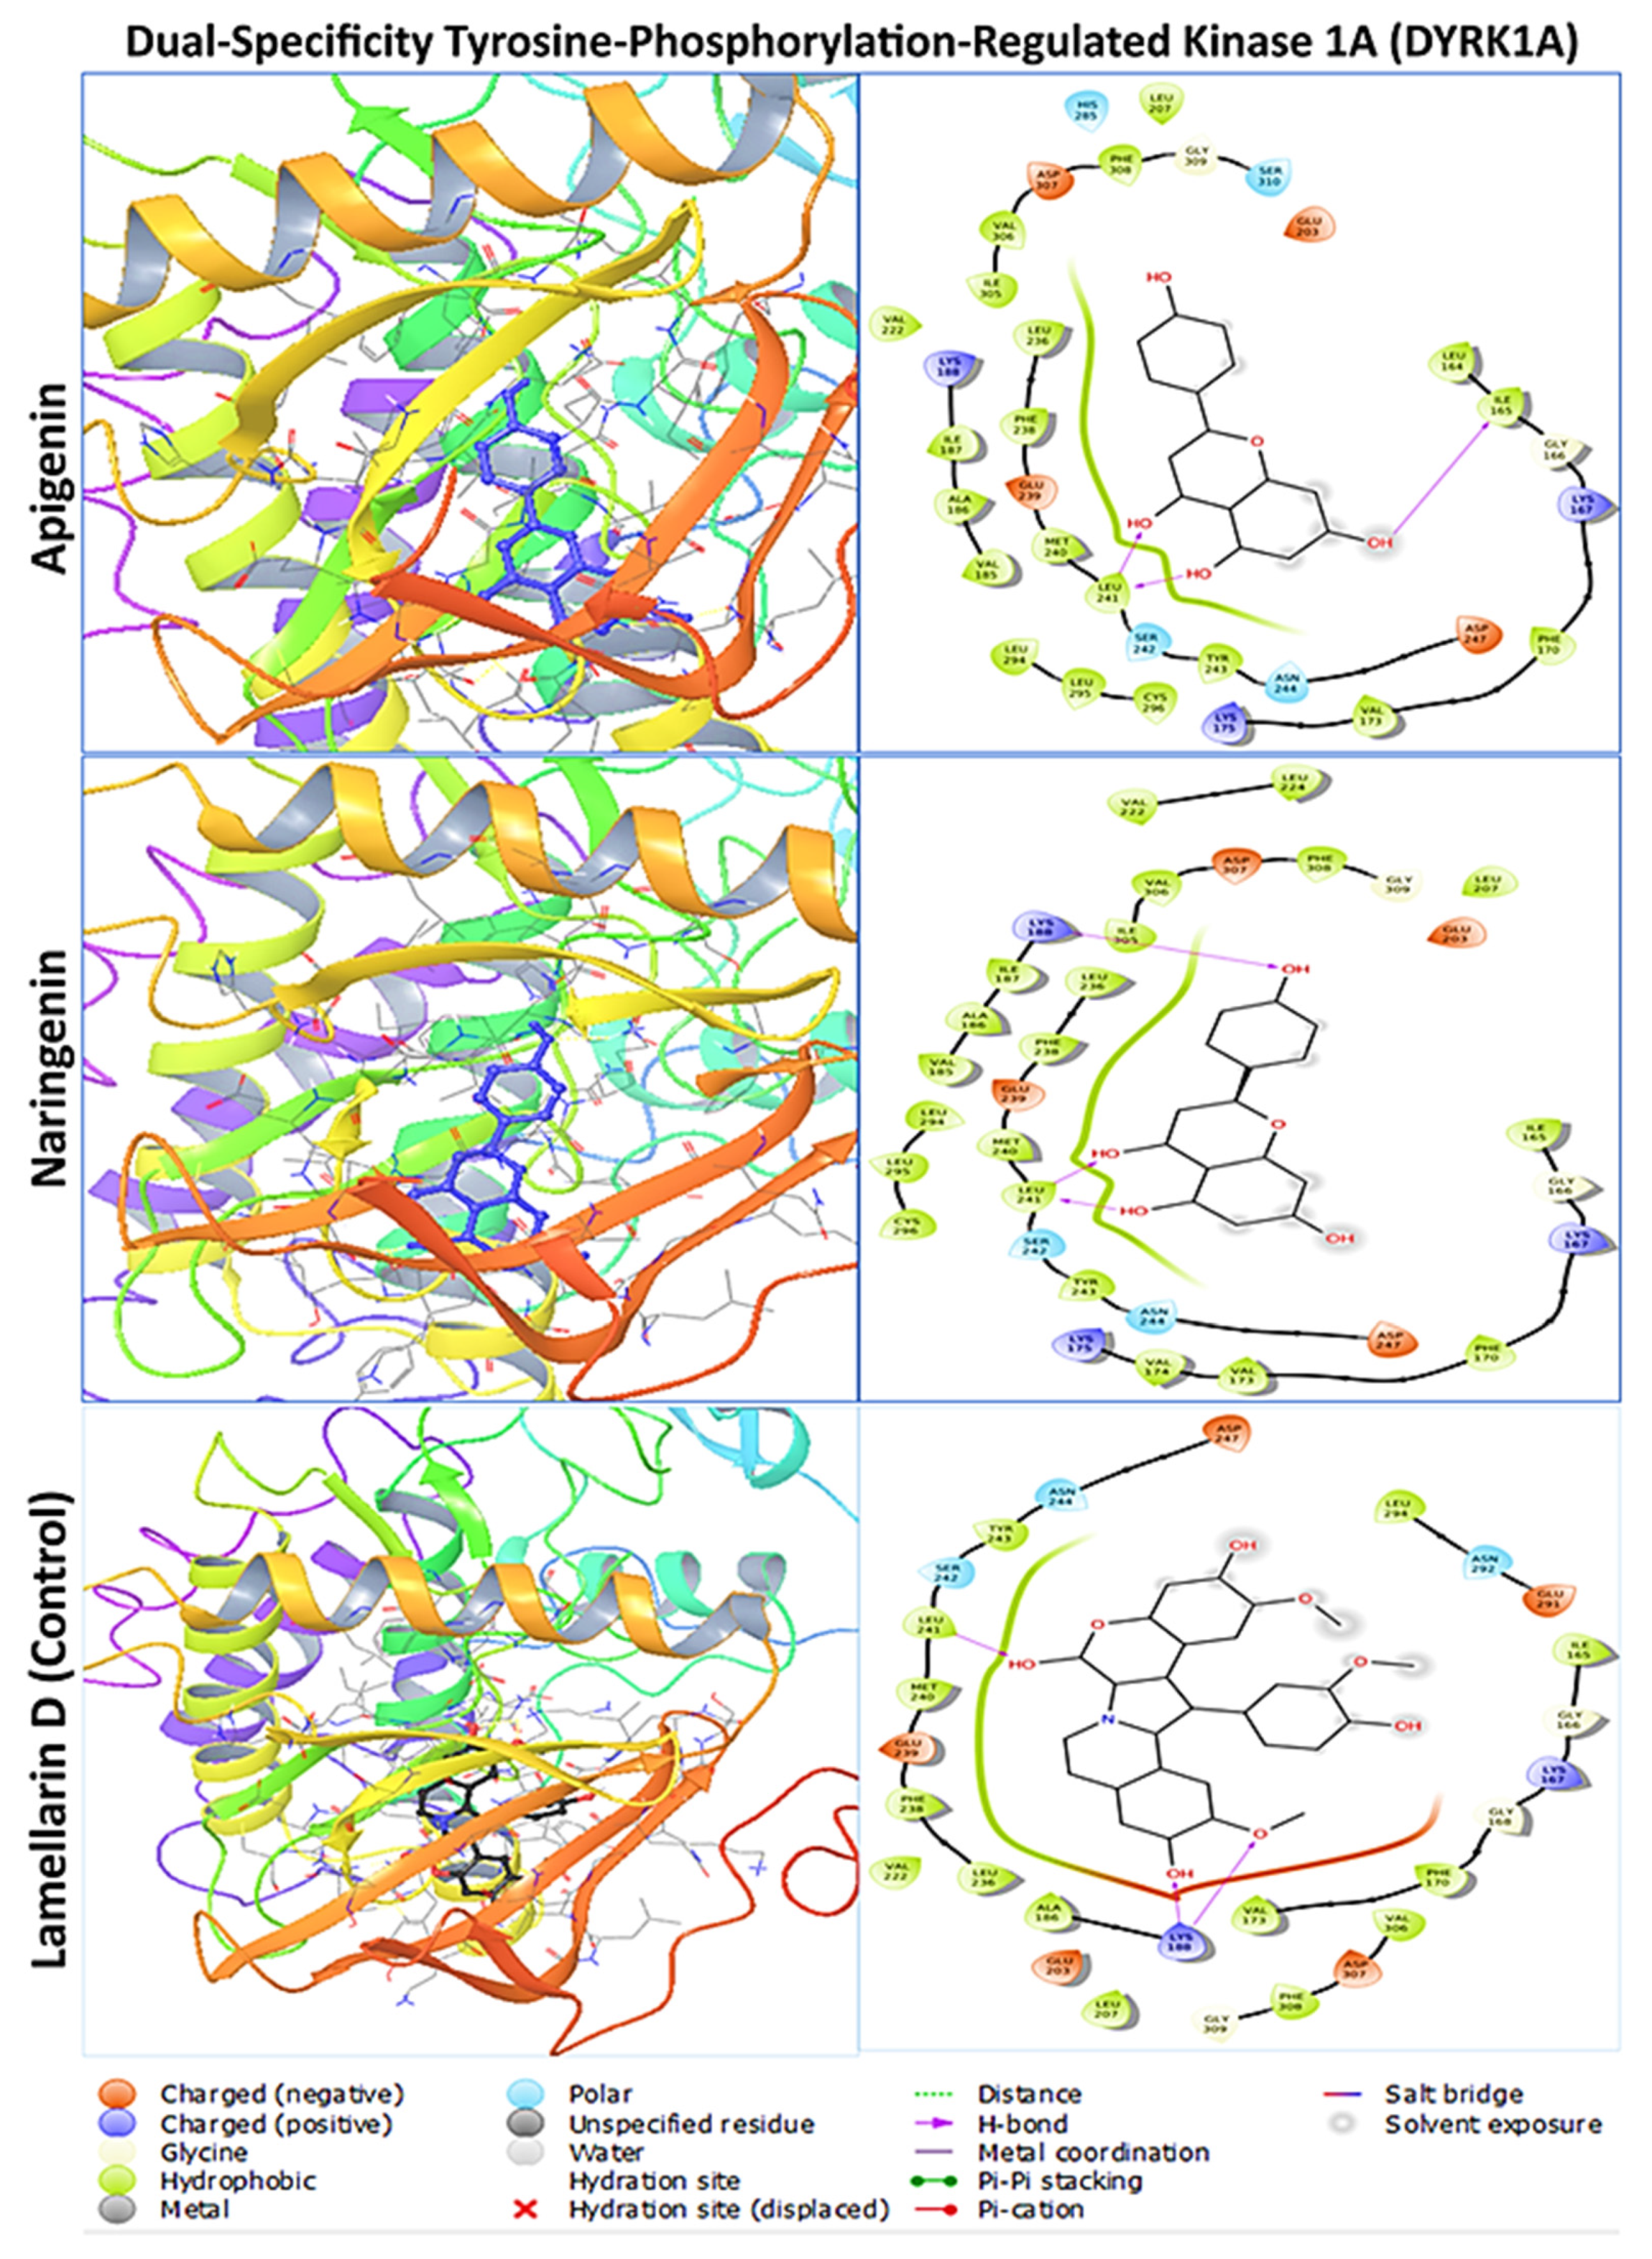
| 1 | DYRK1A | −9.2 | −9.3 | −8.9 | - | - | - |
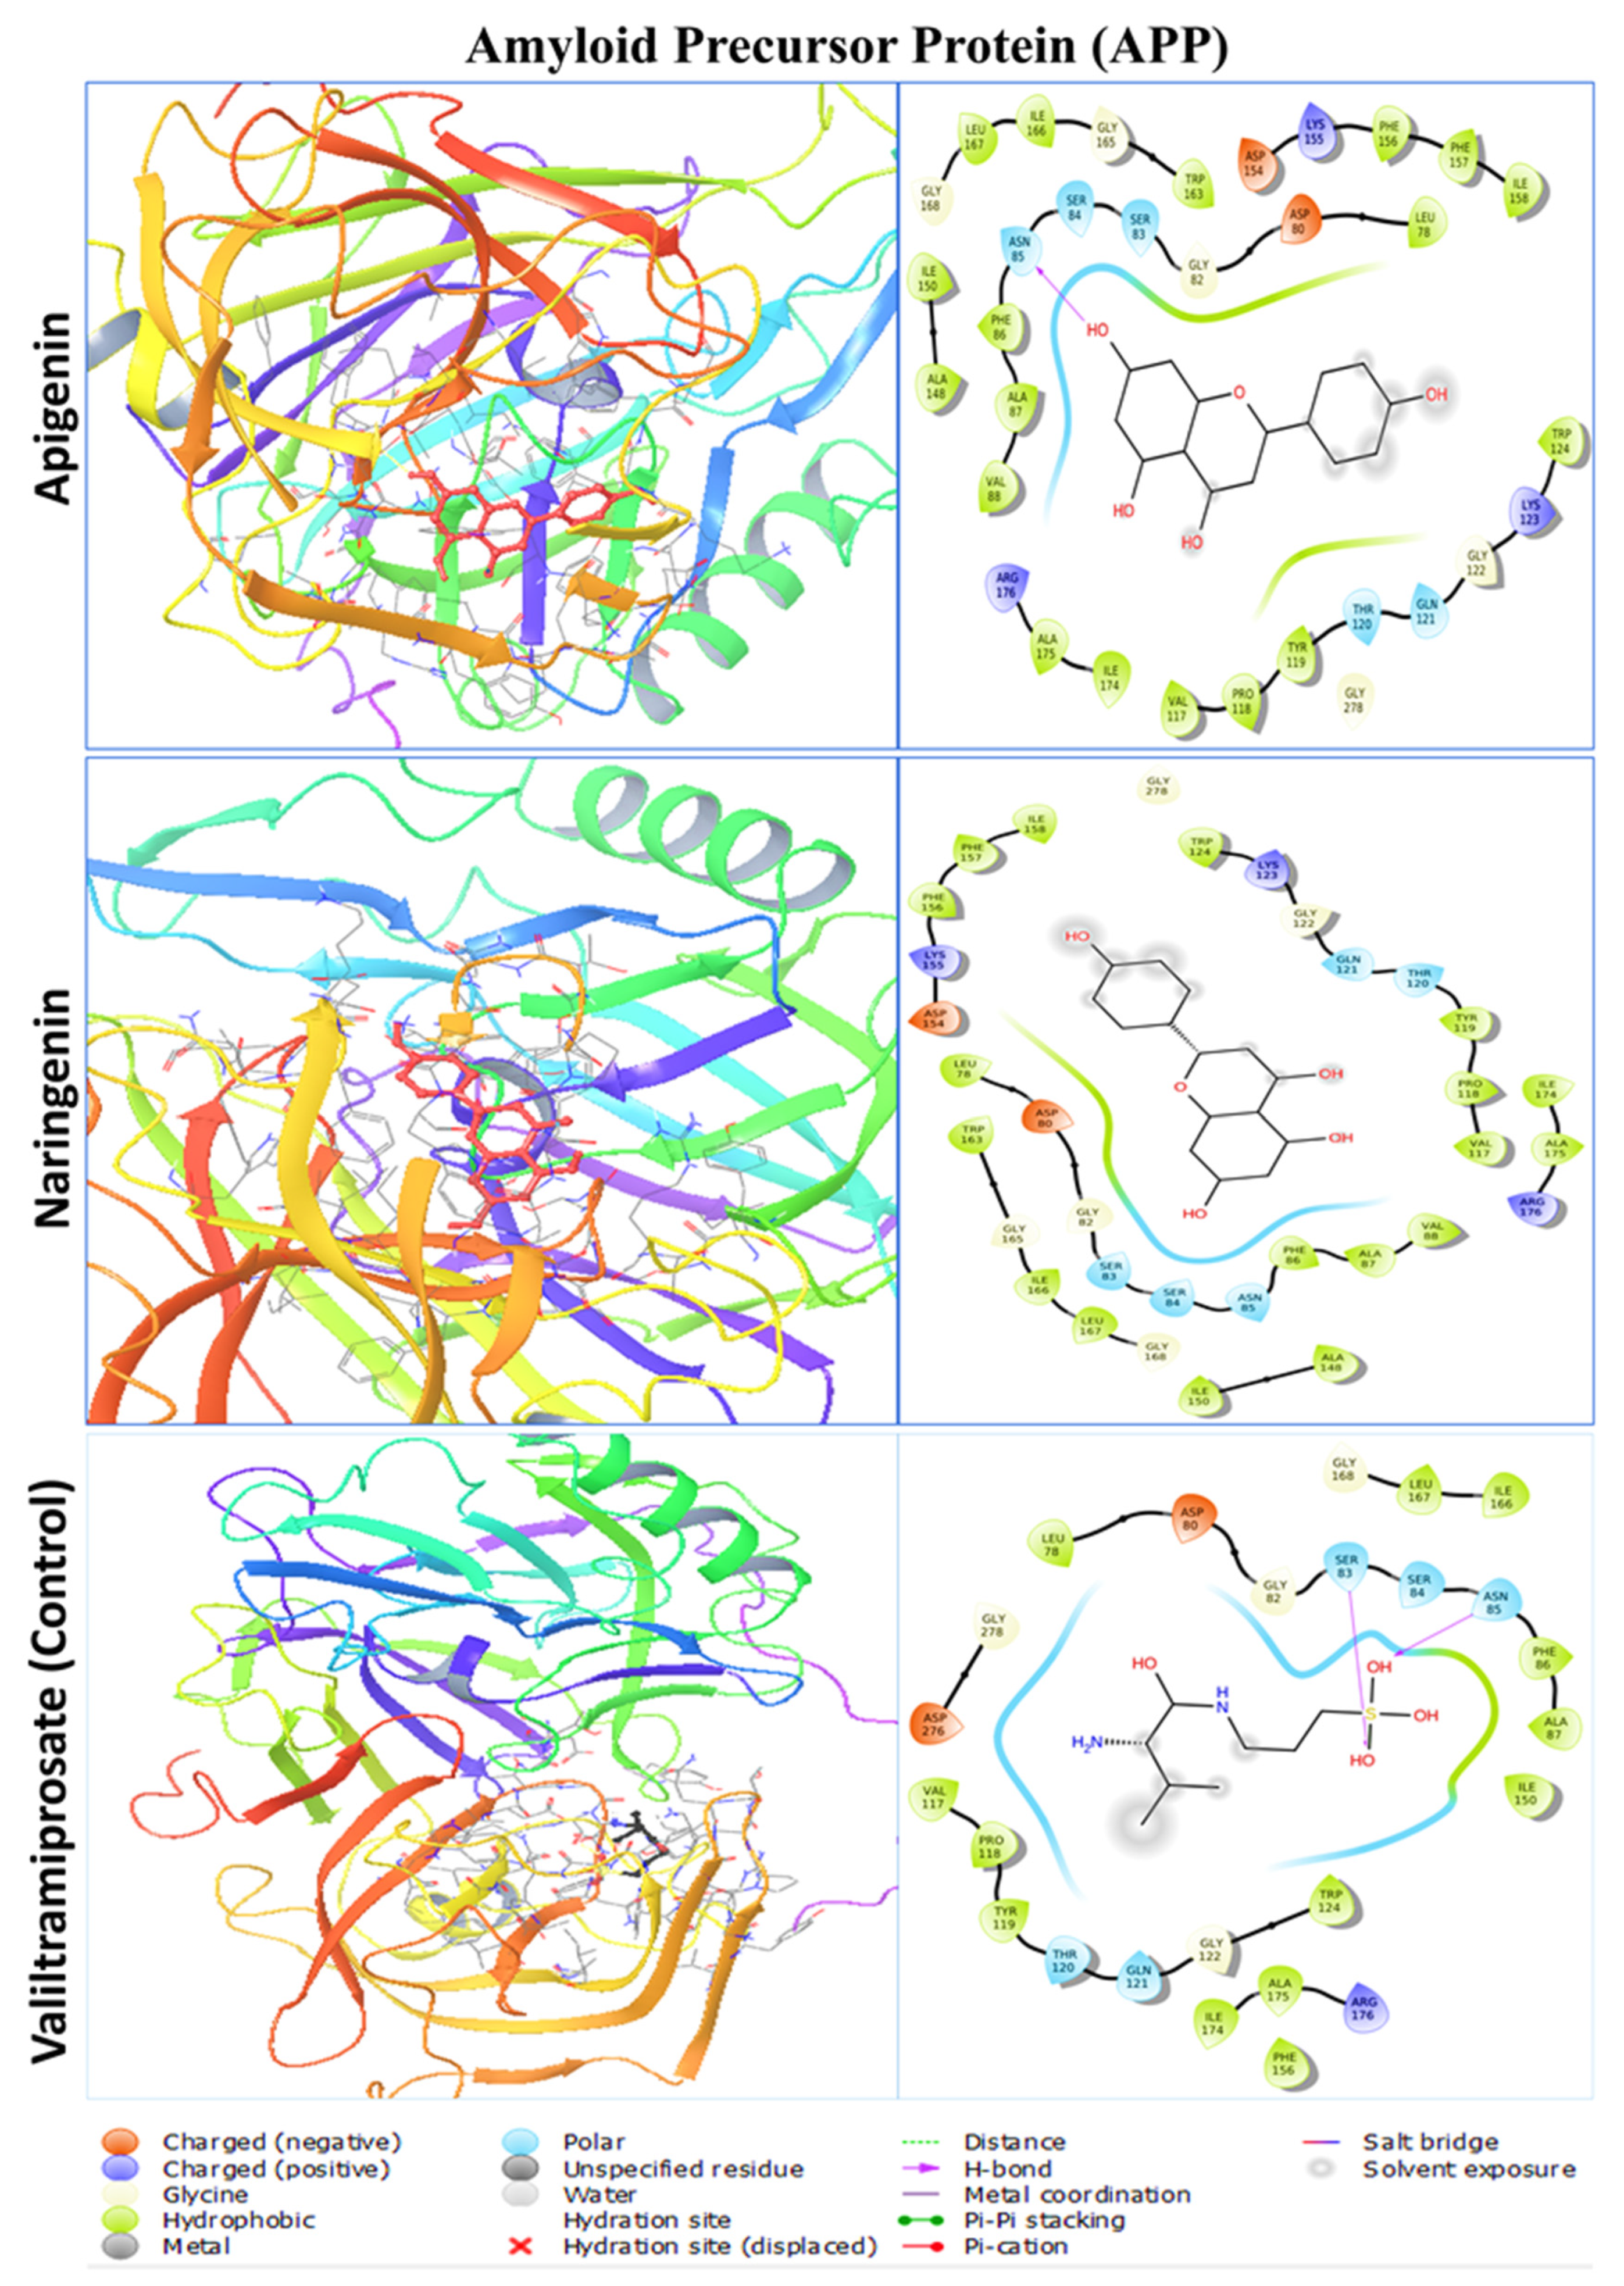
| 2 | APP | −8.8 | −8.6 | - | −5.5 | - | - |
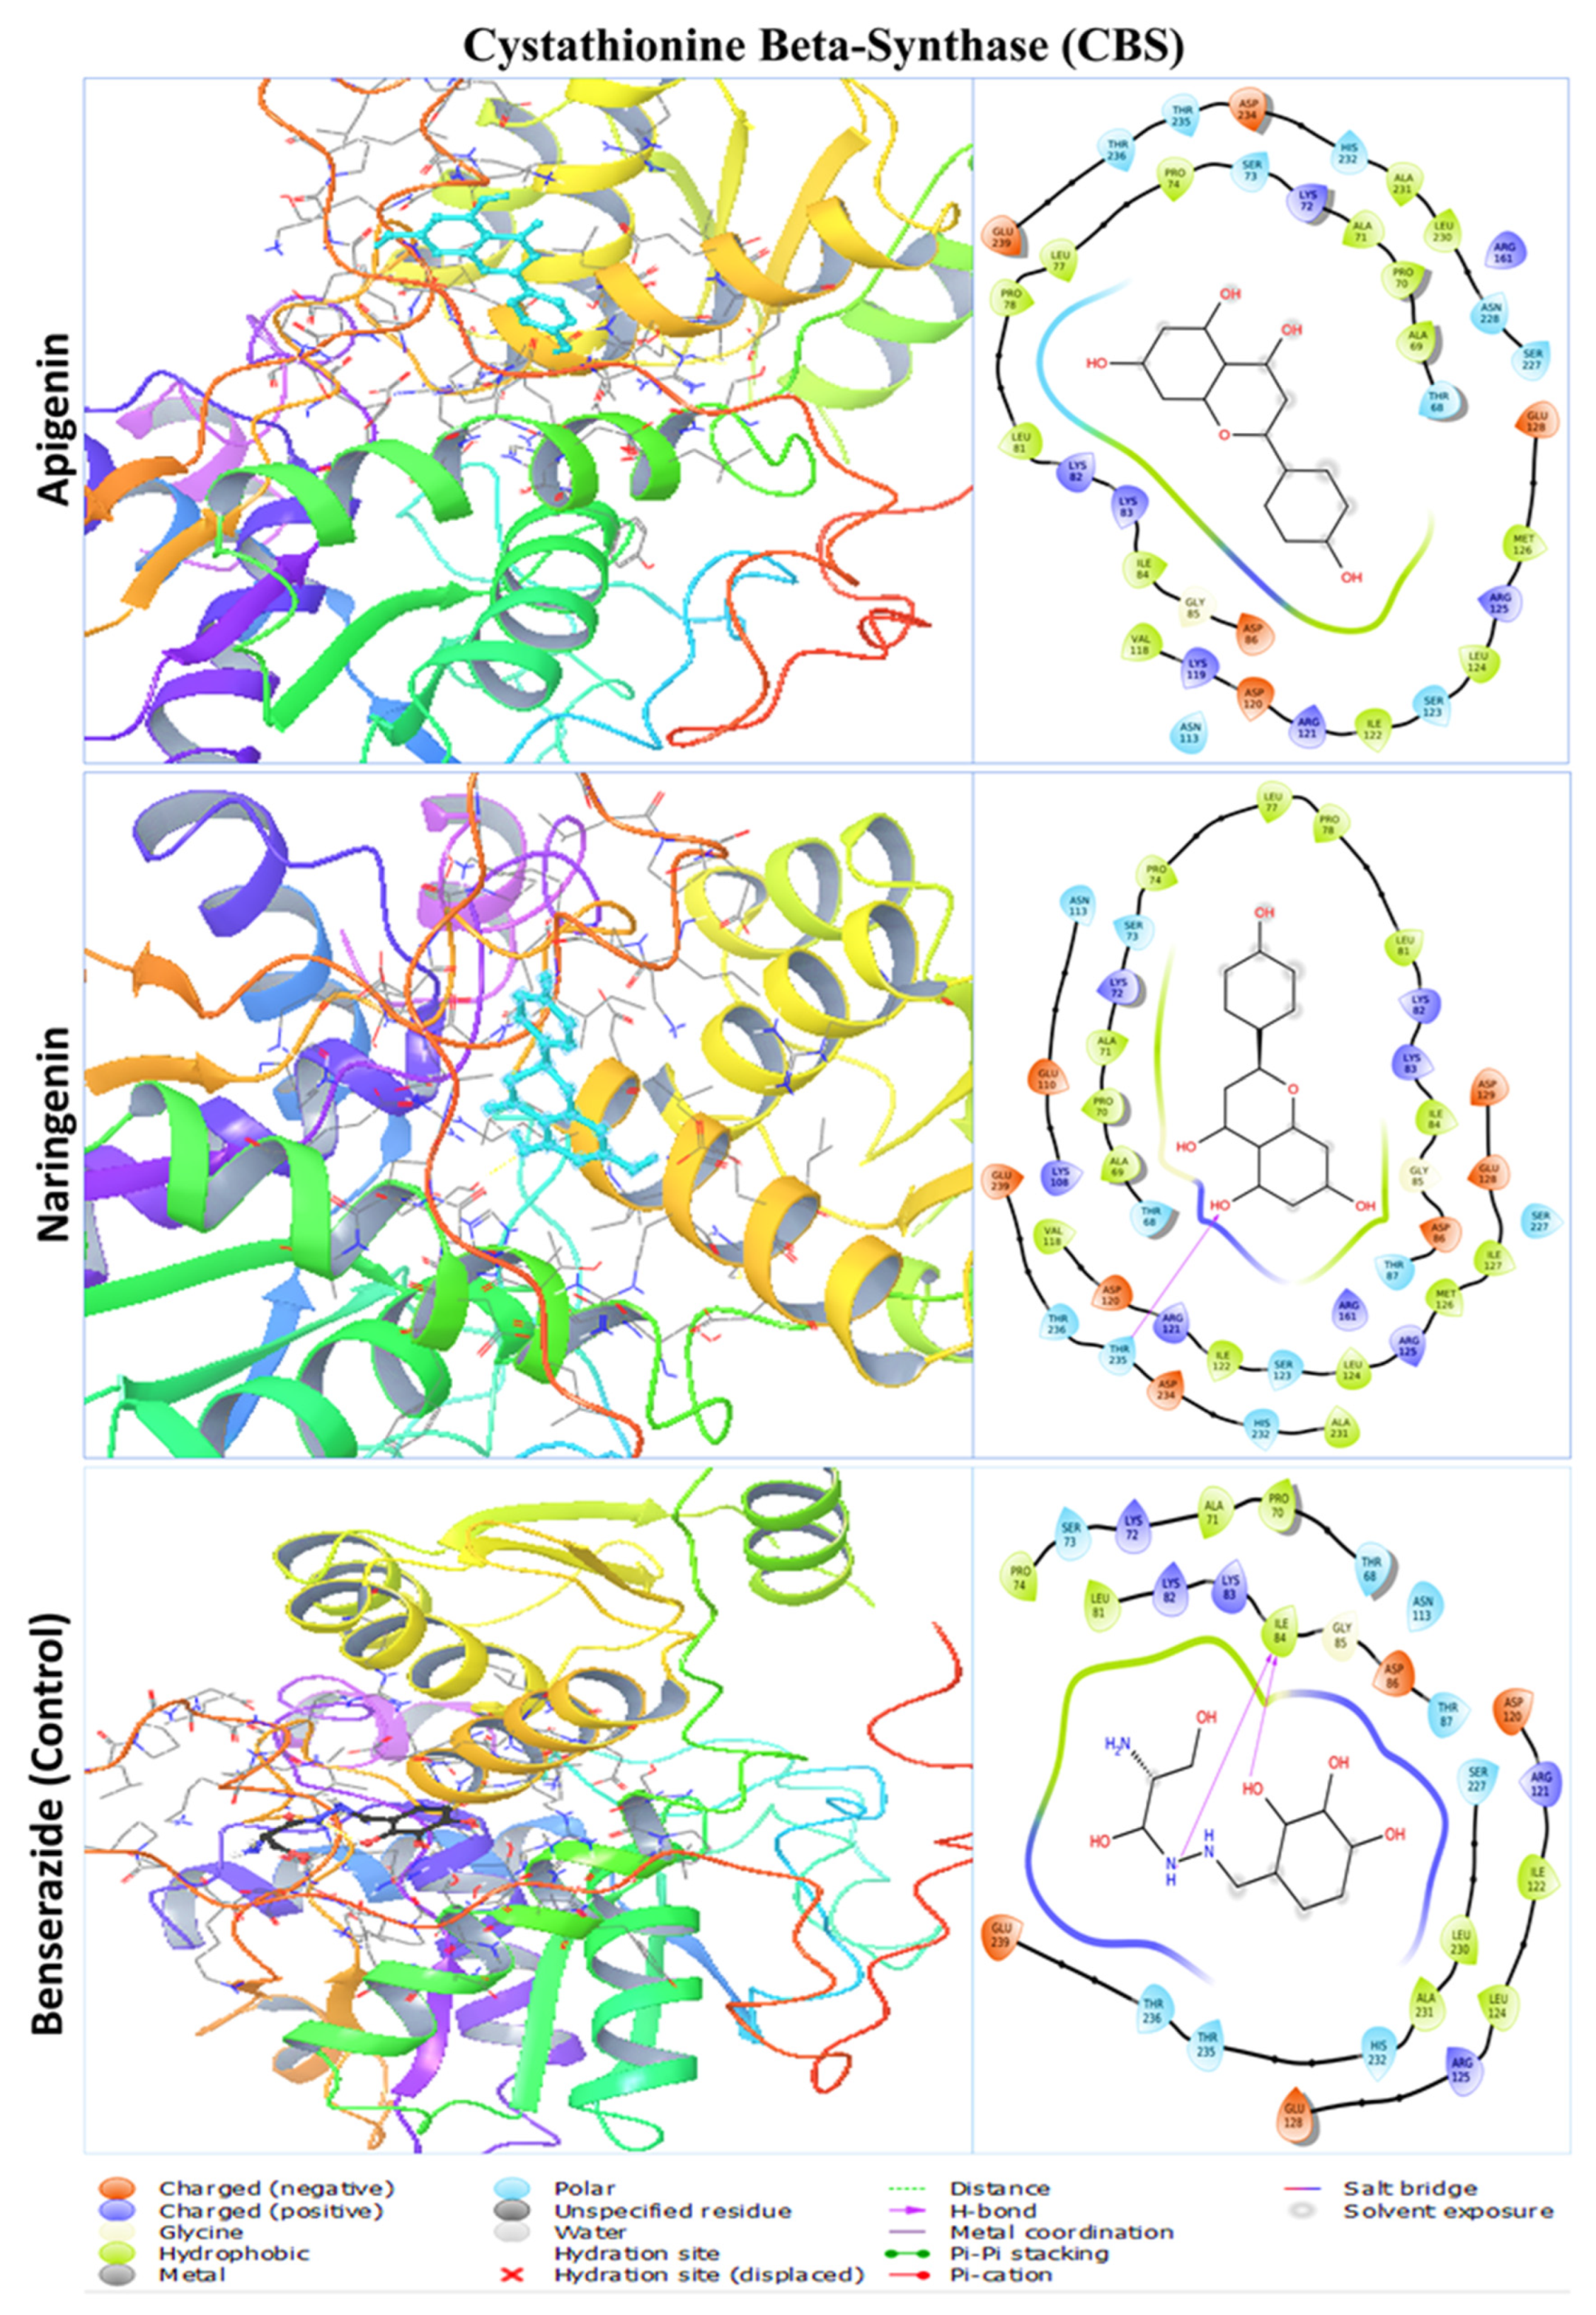
| 4 | CBS | −7.8 | −8.0 | - | - | −6.4 | - |
| 5 | ETS2 | −7.3 | −7.2 | - | - | - | −7.1 |
| Receptor | Compound Name | Interacting Bonds |
|---|---|---|
| DYRK1A (Dual-Specificity Tyrosine-Phosphorylation-Regulated Kinase 1A) | Apigenin | LEU164, ILE165, GLY166, LYS167, PHE170, VAL173, LYS175, VAL185, ALA186, ILE187, LYS188, GLU203, LEU207, VAL222, LEU236, PHE238, GLU239, MET240, LEU241, SER242, TYR243, ASN244, ASP247, HIS285, LEU294, LEU295, CYS296, ILE305, VAL306, ASP307, PHE308, GLY309, SER310 |
| Naringenin | ILE165, GLY166, LYS167, PHE170, VAL173, VAL174, LYS175, VAL185, ALA186, ILE187, LYS188, GLU203, LEU207, VAL222, LEU224, LEU236, PHE238, GLU239, MET240, LEU241, SER242, TYR243, ASN244, ASP247, LEU294, LEU295, CYS296, ILE305, VAL306, ASP307, PHE308, GLY309 | |
| Lamellarin D | ILE165, GLY166, LYS167, GLY168, PHE170, VAL173, ALA186, LYS188, GLU203, LEU207, VAL222, LEU236, PHE238, GLU239, MET240, LEU241, SER242, TYR243, ASN244, ASP247, GLU291, ASN292, LEU294, VAL306, ASP307, PHE308, GLY 309 | |
| APP (Amyloid Precursor Protein) | Apigenin | LEU78, ASP80, GLY82, SER83, SER84, ASN85, PHE86, ALA87, VAL88, VAL117, PRO118, TYR119, THR120, GLN121, GLY122, LYS123, TRP124, ALA148, ILE150, ASP154, LYS155, PHE156, PHE157, ILE158, TRP163, GLY165, ILE166, LEU167, GLY168, ILE174, ALA175, ARG176, GLY278. |
| Naringenin | LEU78, ASP80, GLY82, SER83, SER84, ASN85, PHE86, ALA87, VAL88, VAL117, PRO118, TYR119, THR120, GLN121, GLY122, LYS123, TRP124, ALA148, ILE150, ASP154, LYS155, PHE156, PHE157, ILE158, TRP163, GLY165, ILE166, LEU167, GLY168, ILE174, ALA175, ARG176, GLY278 | |
| Valiltramiprosate | LEU78, ASP80, GLY82, SER83, SER84, ASN85, PHE86, ALA87, VAL117, PRO118, TYR119, THR120, GLN121, GLY122, TRP124, ILE150, PHE156, ILE166, LEU167, GLY168, ILE174, ALA175, ARG176, ASP276, GLY278 | |
| CBS (Cystathionine Beta-Synthase) | Apigenin | THR68, ALA69, PRO70, ALA71, LYS72, SER73, PRO74, LEU77, PRO78, LEU81, LYS82, LYS83, ILE84, GLY85, ASP86, ASN113, VAL118, LYS119, ASP120, ARG121, ILE122, SER123, LEU124, ARG125, MET126, GLU128, ARG161, SER227, ASN228, LEU230, ALA231, HIS232, ASP234, THR235, THR236, GLY239 |
| Naringenin | THR68, ALA69, PRO70, ALA71, LYS72, SER73, PRO74, LEU77, PRO78, LEU81, LYS82, LYS83, ILE84, GLY85, ASP86, THR87, LYS108, GLU110, ASN113, VAL118, ASP120, ARG121, ILE122, SER123, LEU124, ARG125, MET126, ILE127, GLU128, ASP129, ARG161, SER227, ALA231, HIS232, ASP234, THR235, THR236, GLU239 | |
| Benserazide | THR68, PRO70, ALA71, LYS72, SER73, PRO74, LEU81, LYS82, LYS83, ILE84, GLY85, ASP86, THR87, ASN113, ASP120, ARG121, ILE122, LEU124, ARG125, GLU128, SER227, LEU230, ALA231, HIS232, THR235, THR236, GLU239 | |
| ETS2 (E26 Transformation-Specific Transcription Factor 2) | Apigenin | LEU369, LEU370, GLU371, LEU372, LEU373, HER374, ASP375, LYS376, SER377, CYS378, GLN379, SER380, PHE381, ILE382, SER383, TRP384, THR385, GLY386, ASP387, GLY388, GLU390, LYS392, PRO454, GLU455, LEU457, HIS458, ALA459, ILE460 |
| Naringenin | LEU369, LEU370, GLU371, LEU372, LEU373, HER374, ASP375, LYS376, SER377, CYS378, GLN379, SER380, PHE381, ILE382, SER383, TRP384, THR385, GLY386, ASP387, GLY388, GLU390, LYS392, PRO454, GLU455, LEU457, HIS458, ALA459, ILE460 | |
| TK216 | ALA355, THR358, GLY359, SER360, GLY361, PRO362, ILE363, GLA364, LEU365, TRP366, GLN367, PHE368, LEU369, LYS392, ALA400, TRP403, ARG406, LYS407, ASN408, LYS409, PRO410, LYS411, MET412, ASN413, TYR414, GLU415, LYS416, LEU417, SER418, ARG419, GLY420, LEU421, TYR423, TYR424, TYR425, ASP426, LYS427, ILE429, CYS444 |
Disclaimer/Publisher’s Note: The statements, opinions and data contained in all publications are solely those of the individual author(s) and contributor(s) and not of MDPI and/or the editor(s). MDPI and/or the editor(s) disclaim responsibility for any injury to people or property resulting from any ideas, methods, instructions or products referred to in the content. |
© 2024 by the authors. Licensee MDPI, Basel, Switzerland. This article is an open access article distributed under the terms and conditions of the Creative Commons Attribution (CC BY) license (https://creativecommons.org/licenses/by/4.0/).
Share and Cite
Amir, M.; Shafi, S.; Parveen, S.; Reshi, A.A.; Ahmad, A. Network Pharmacology Identifies Intersection Genes of Apigenin and Naringenin in Down Syndrome as Potential Therapeutic Targets. Pharmaceuticals 2024, 17, 1090. https://doi.org/10.3390/ph17081090
Amir M, Shafi S, Parveen S, Reshi AA, Ahmad A. Network Pharmacology Identifies Intersection Genes of Apigenin and Naringenin in Down Syndrome as Potential Therapeutic Targets. Pharmaceuticals. 2024; 17(8):1090. https://doi.org/10.3390/ph17081090
Chicago/Turabian StyleAmir, Mohd, Shabana Shafi, Shahida Parveen, Aijaz Ahmad Reshi, and Ajaz Ahmad. 2024. "Network Pharmacology Identifies Intersection Genes of Apigenin and Naringenin in Down Syndrome as Potential Therapeutic Targets" Pharmaceuticals 17, no. 8: 1090. https://doi.org/10.3390/ph17081090