

Computational Design and Optimization of Peptide Inhibitors for SIRT2

Abstract

1. Introduction
2. Results and Discussion
2.1. Peptide Modeling and Docking
2.2. MMGBSA for the Docked Complex of New Peptide
2.3. MD of Native Peptide and Modified Peptide (100 ns)
2.4. MM/GBSA
2.5. Energy Decomposition and Interaction
2.6. Combination Mutation, QSAR, and Clustering
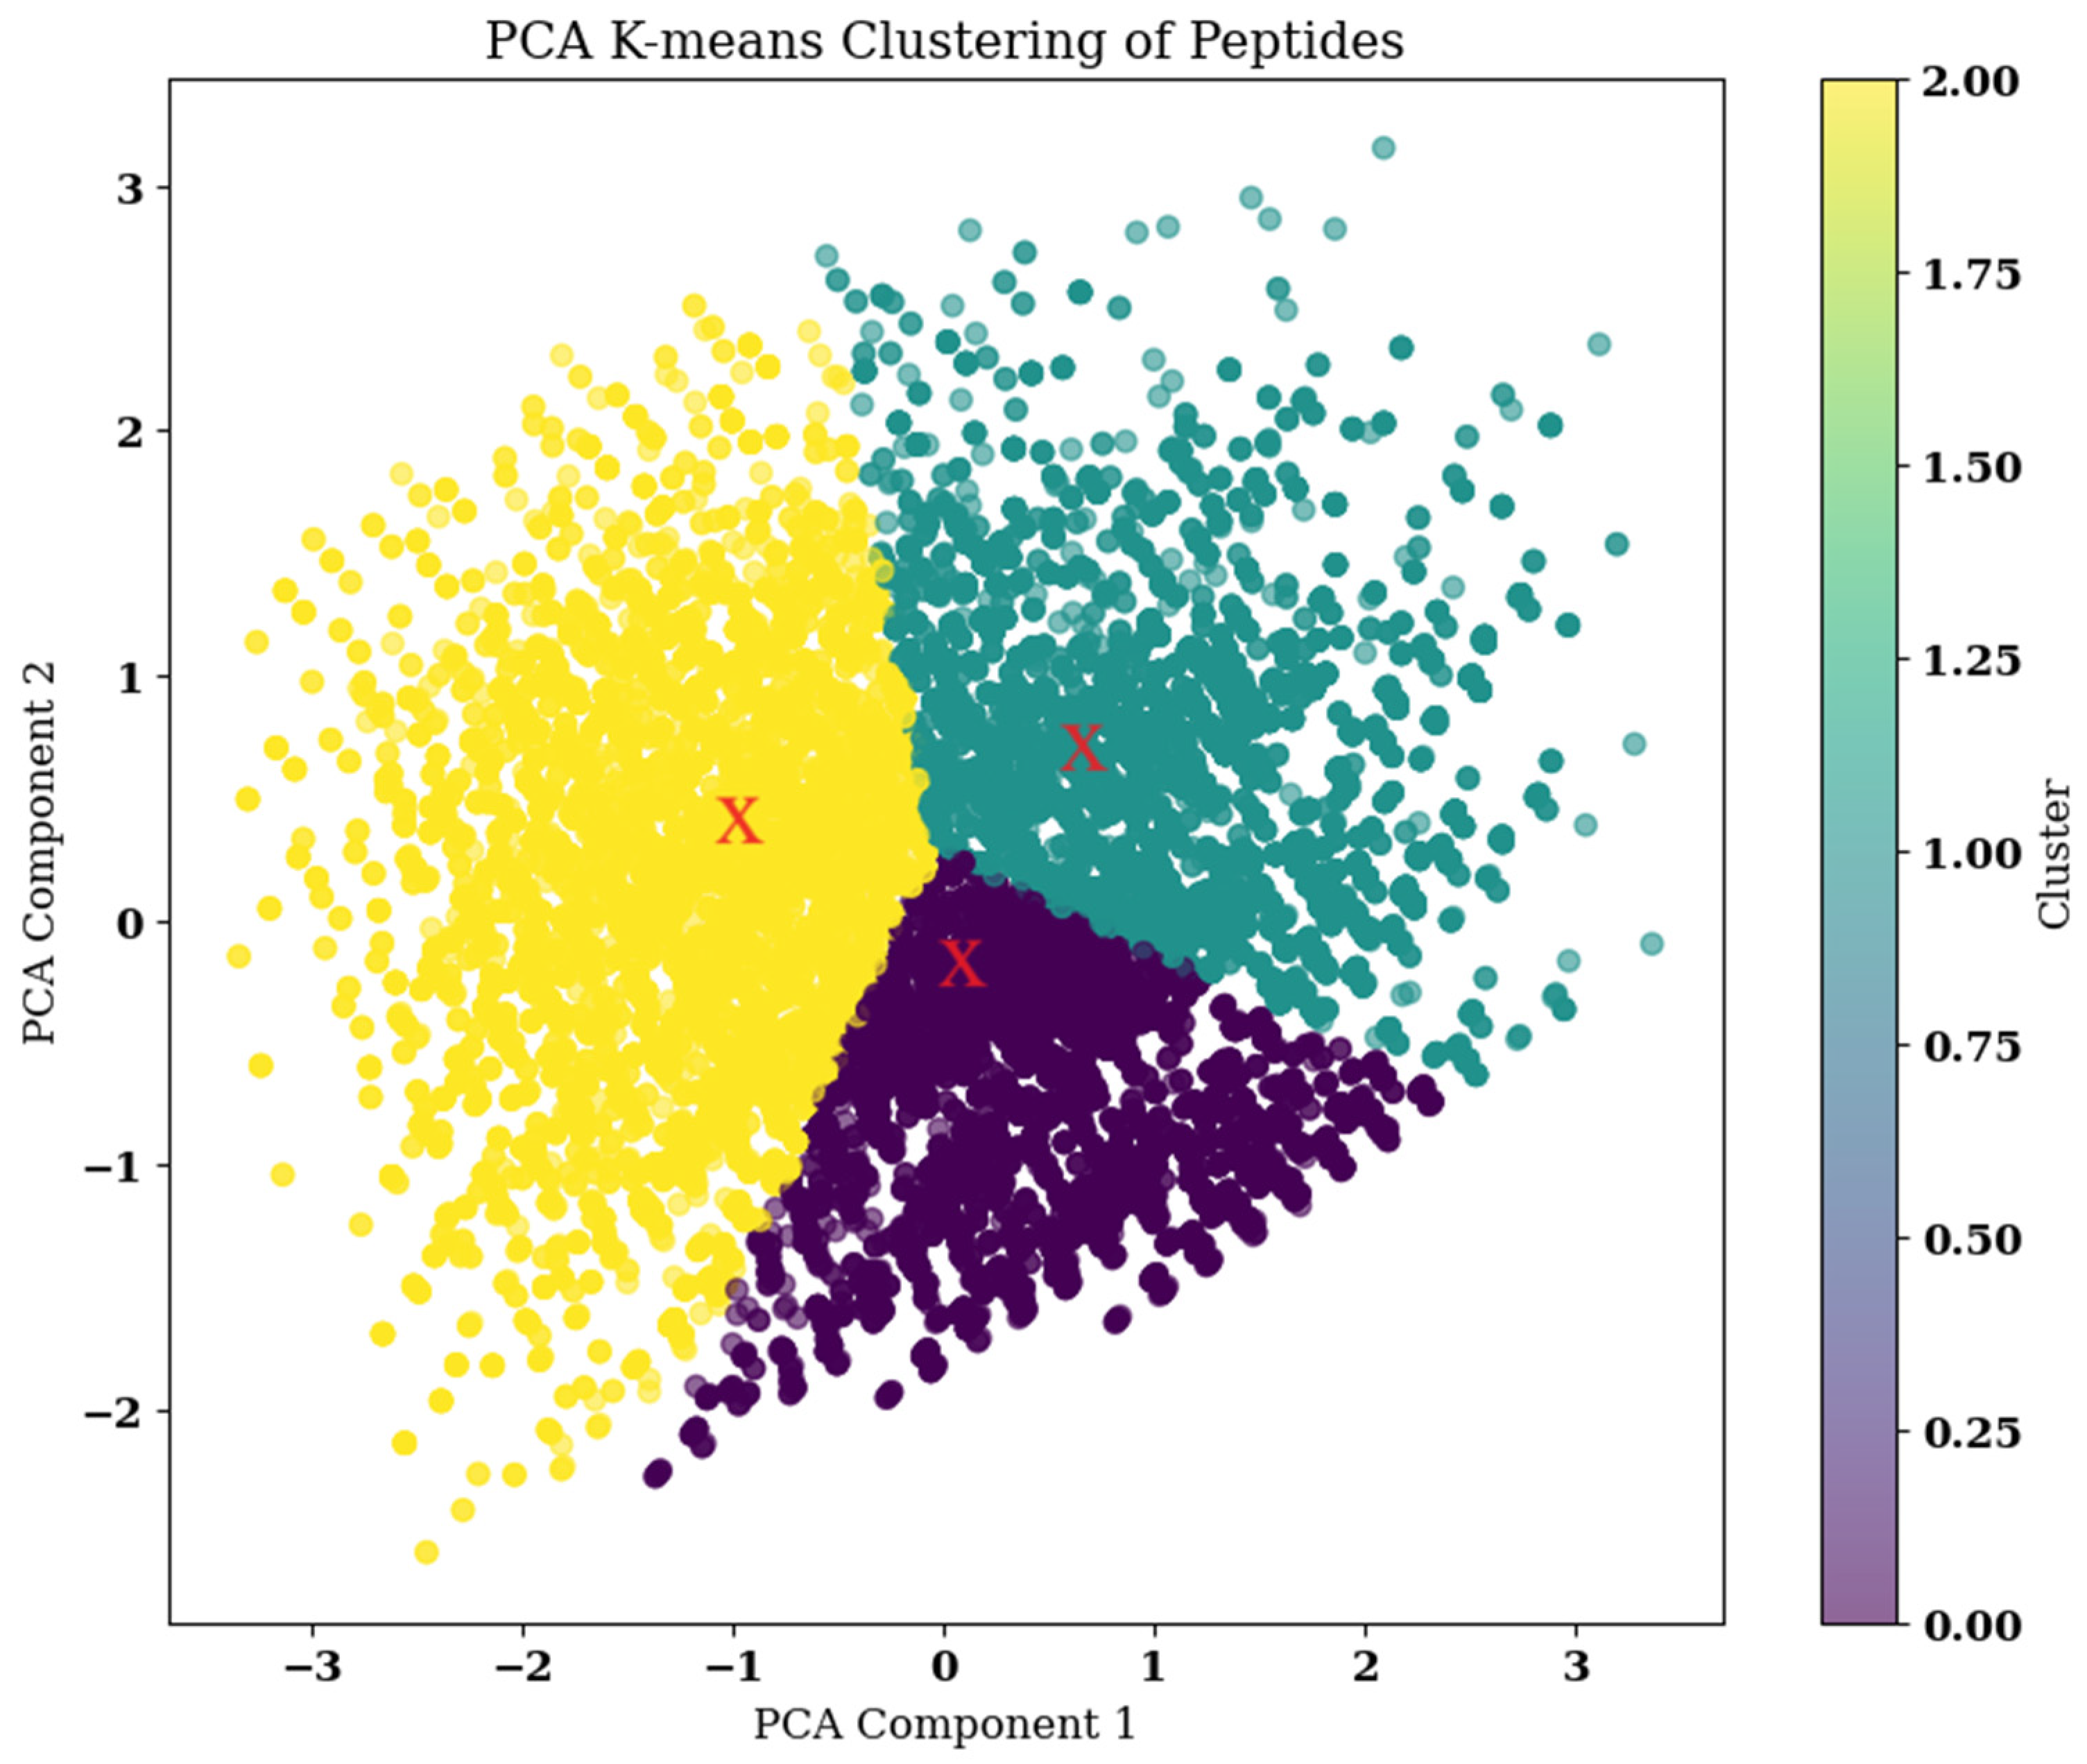
2.7. Clustering
2.8. Peptide Modeling and Docking
2.9. Molecular Dynamics Simulation
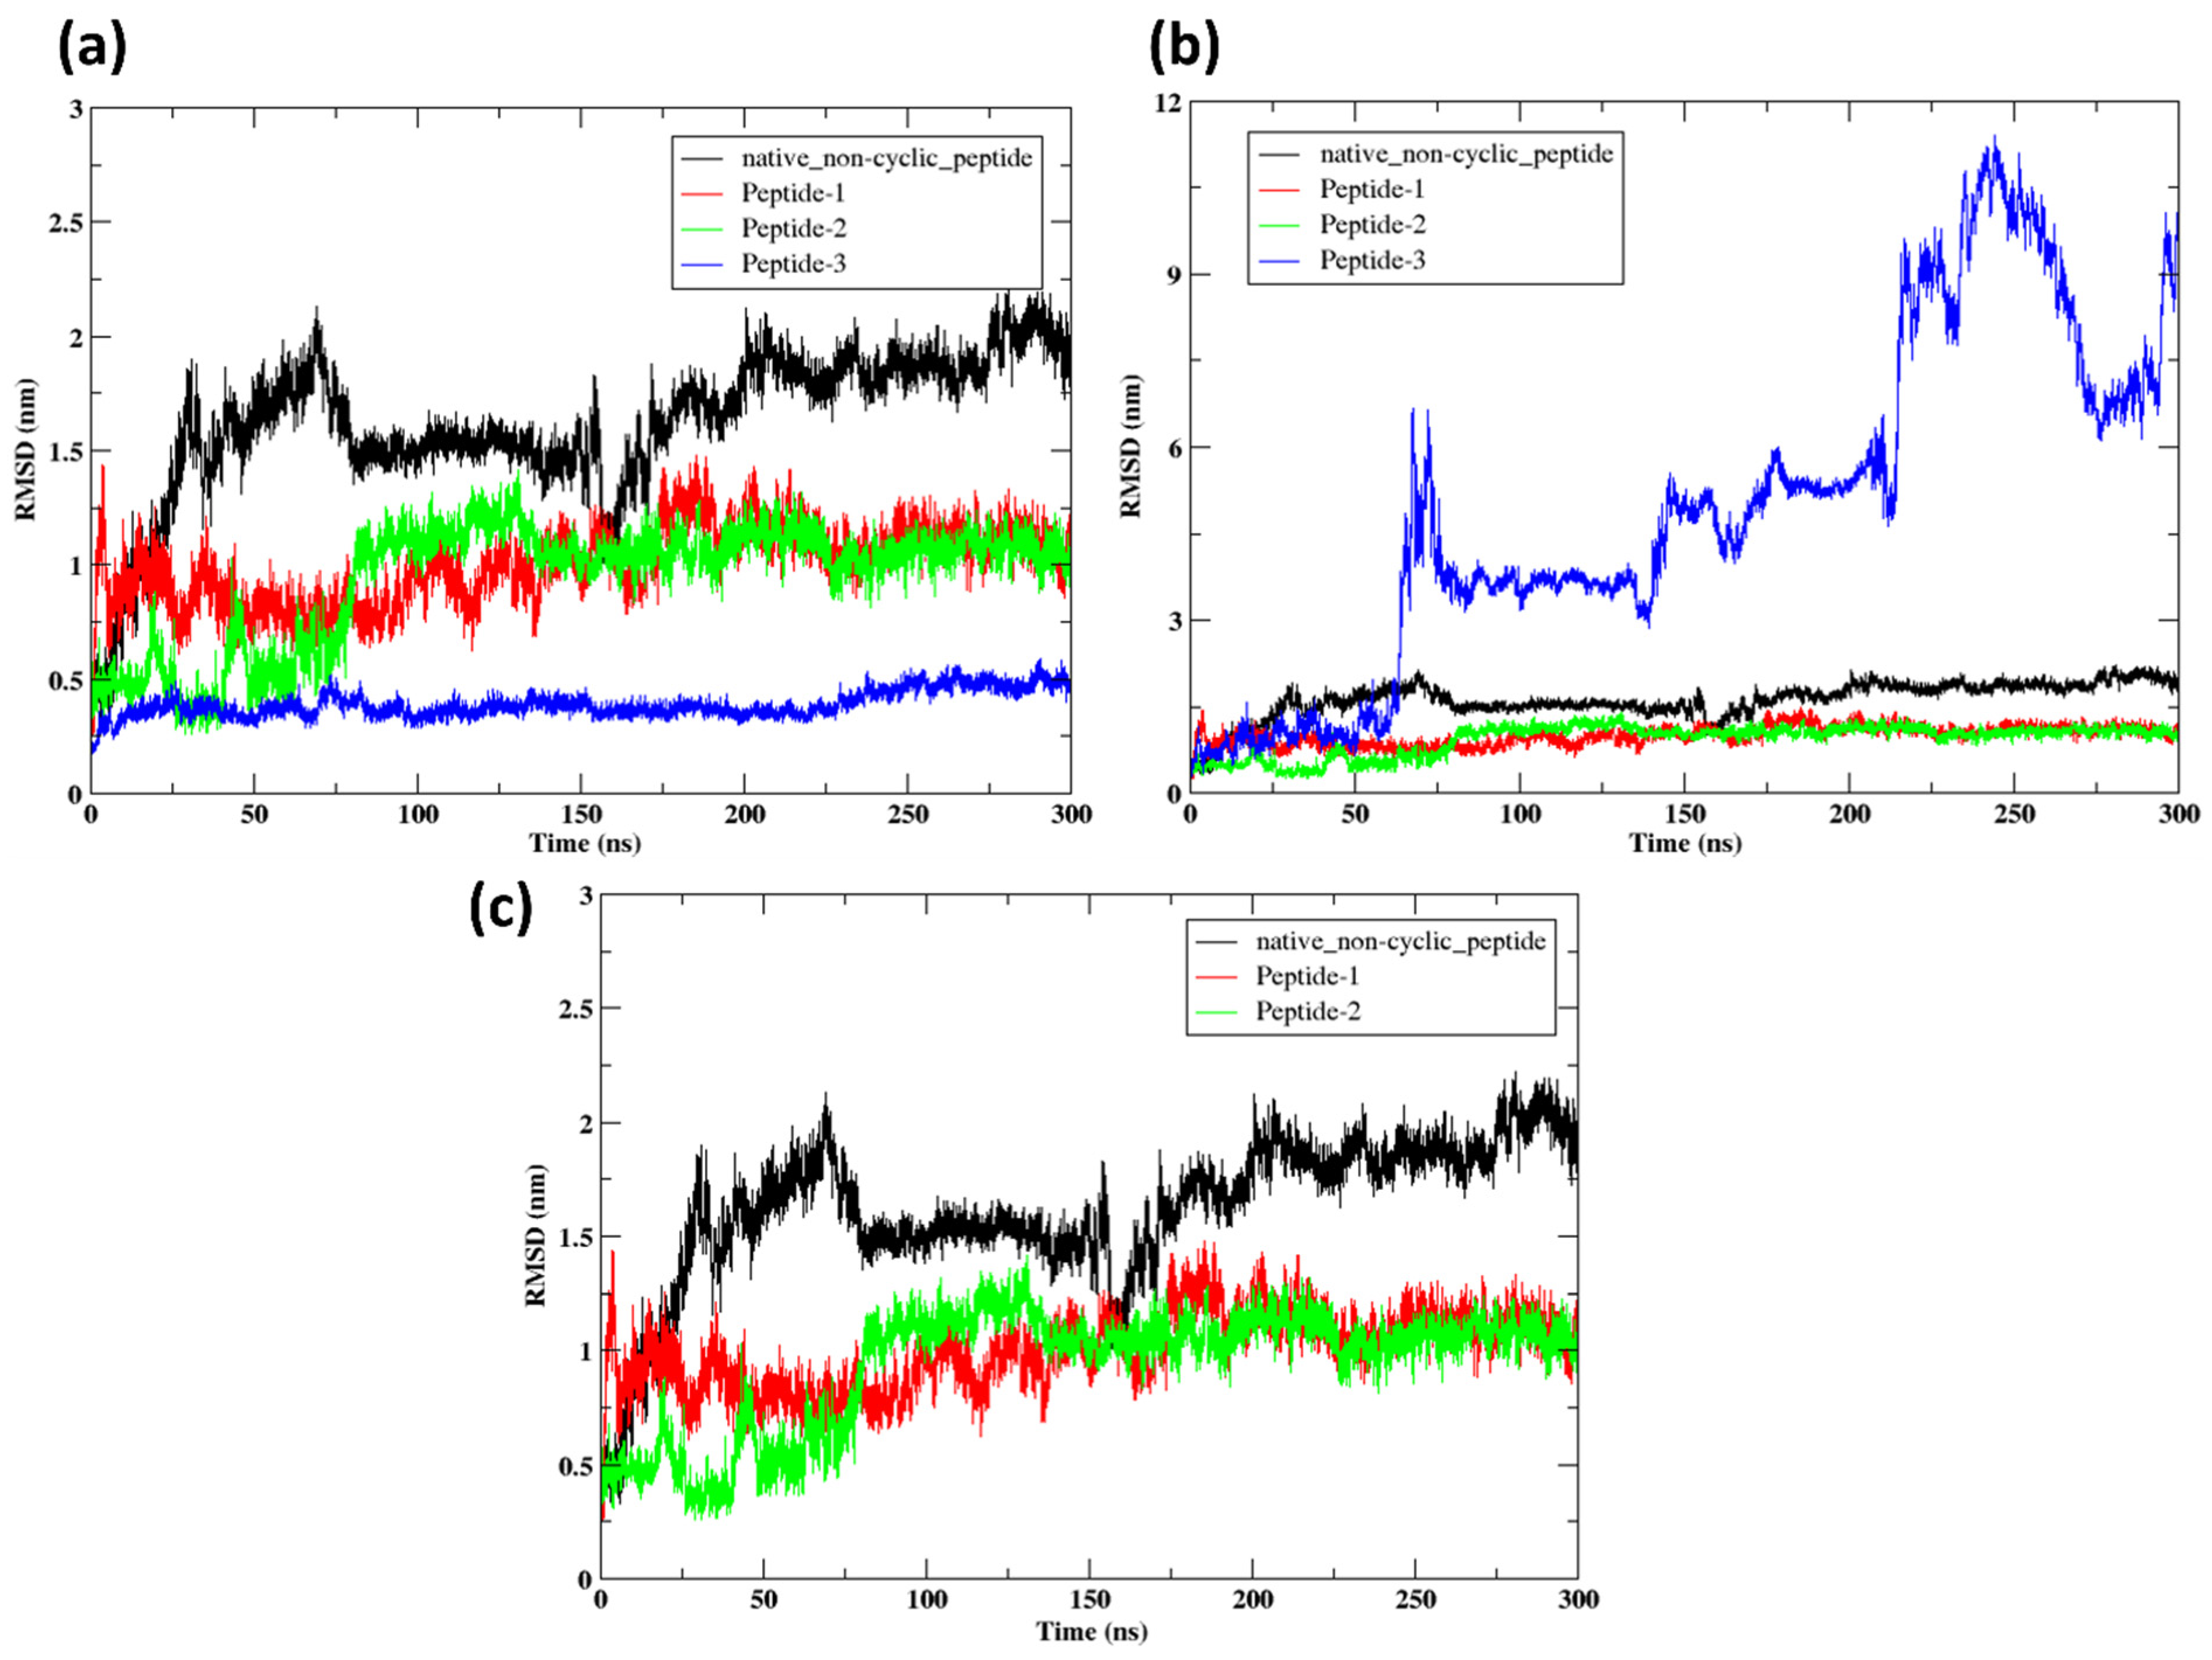
2.9.1. RMSD
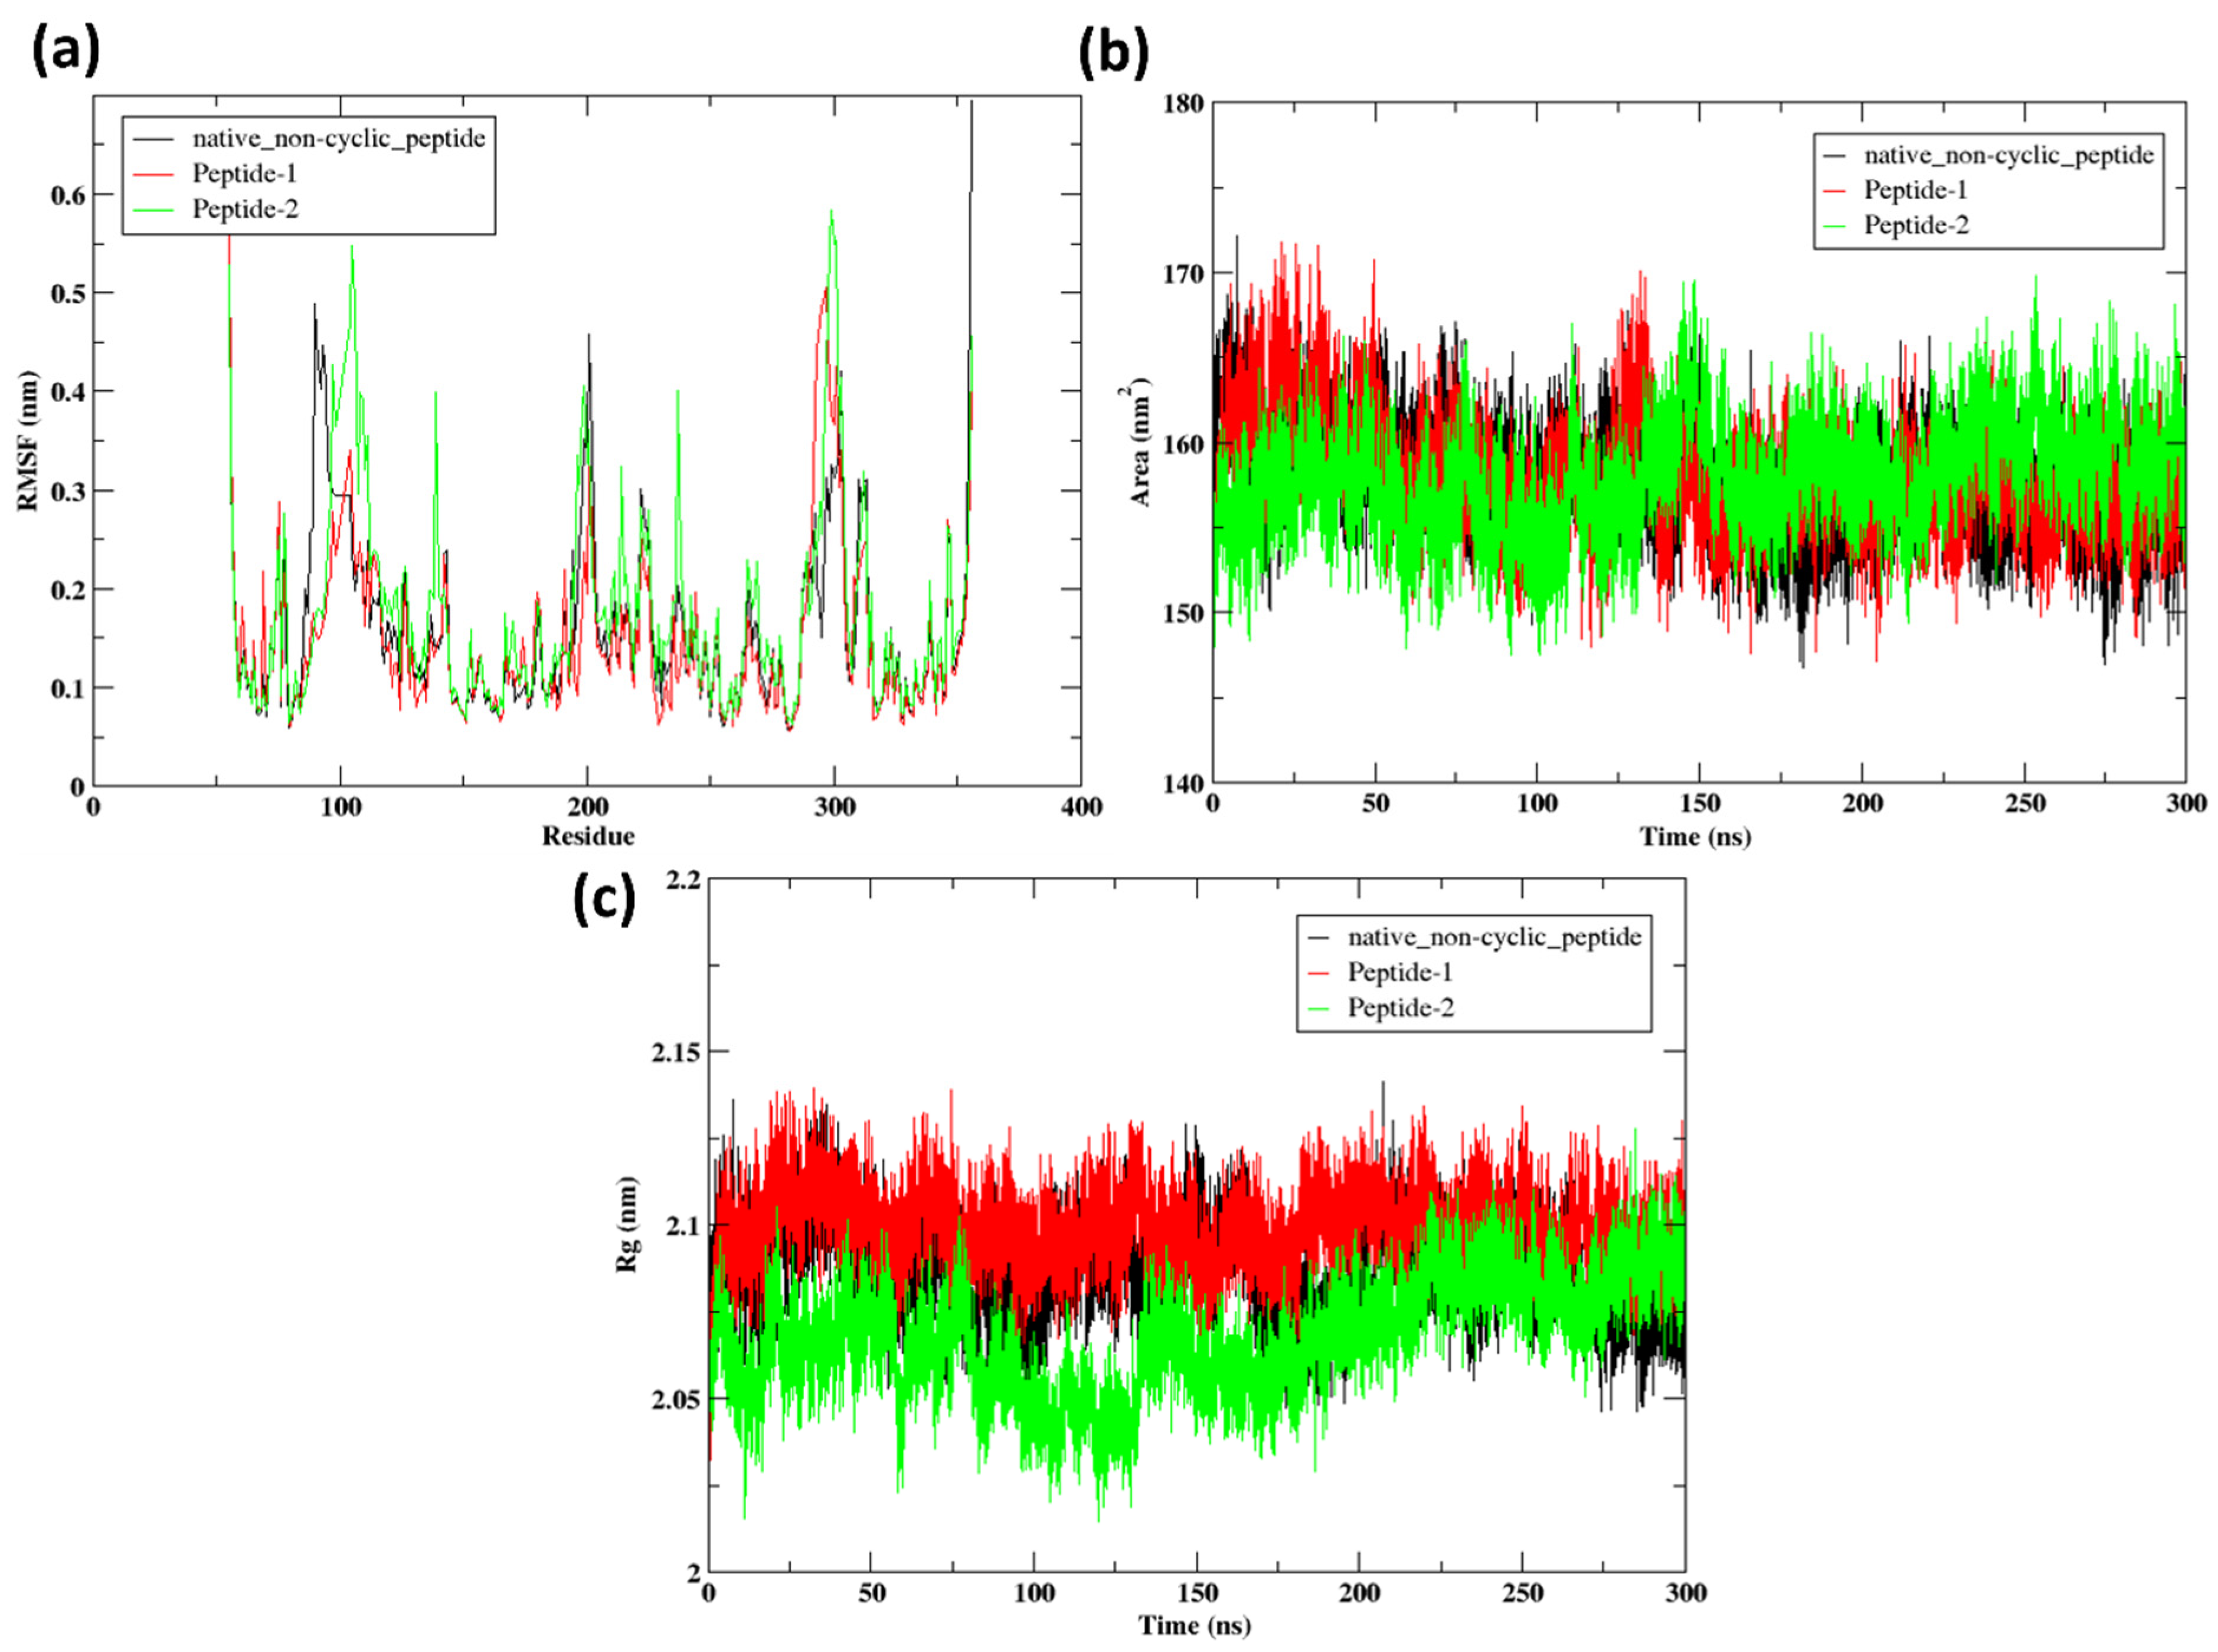
2.9.2. RMSF
2.9.3. SASA
2.9.4. Radius of Gyration
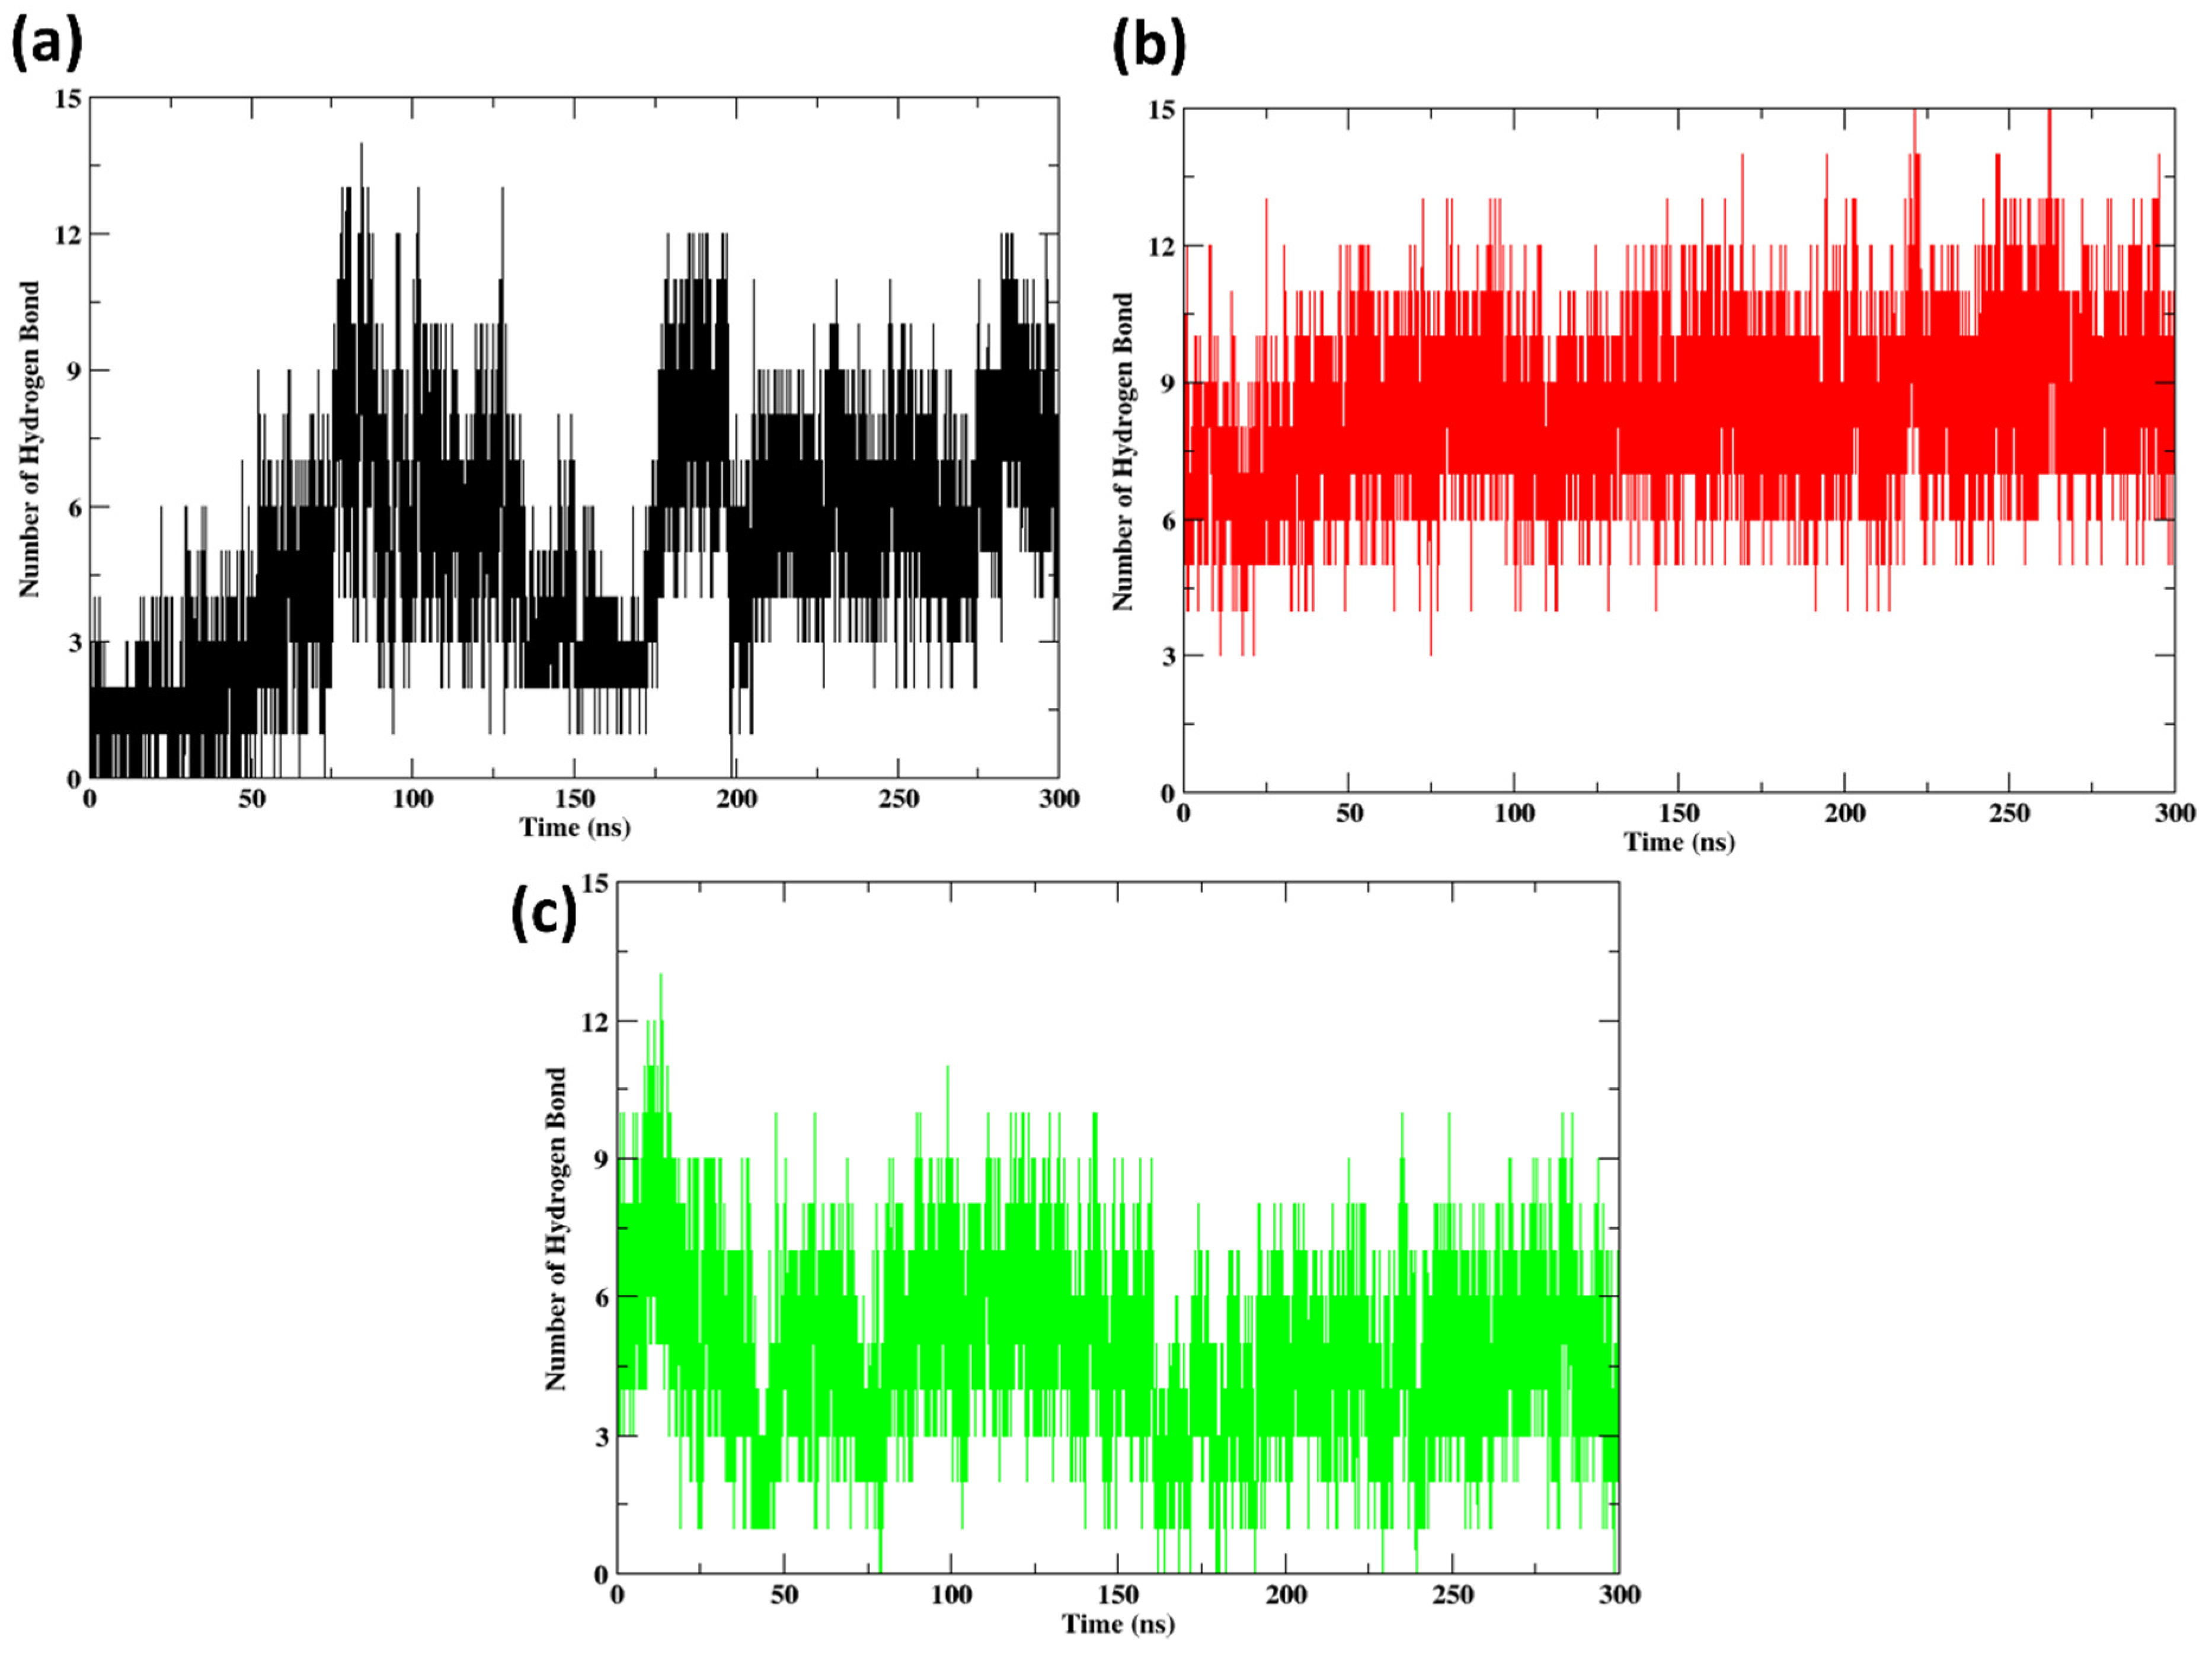
2.10. Hydrogen Bonds
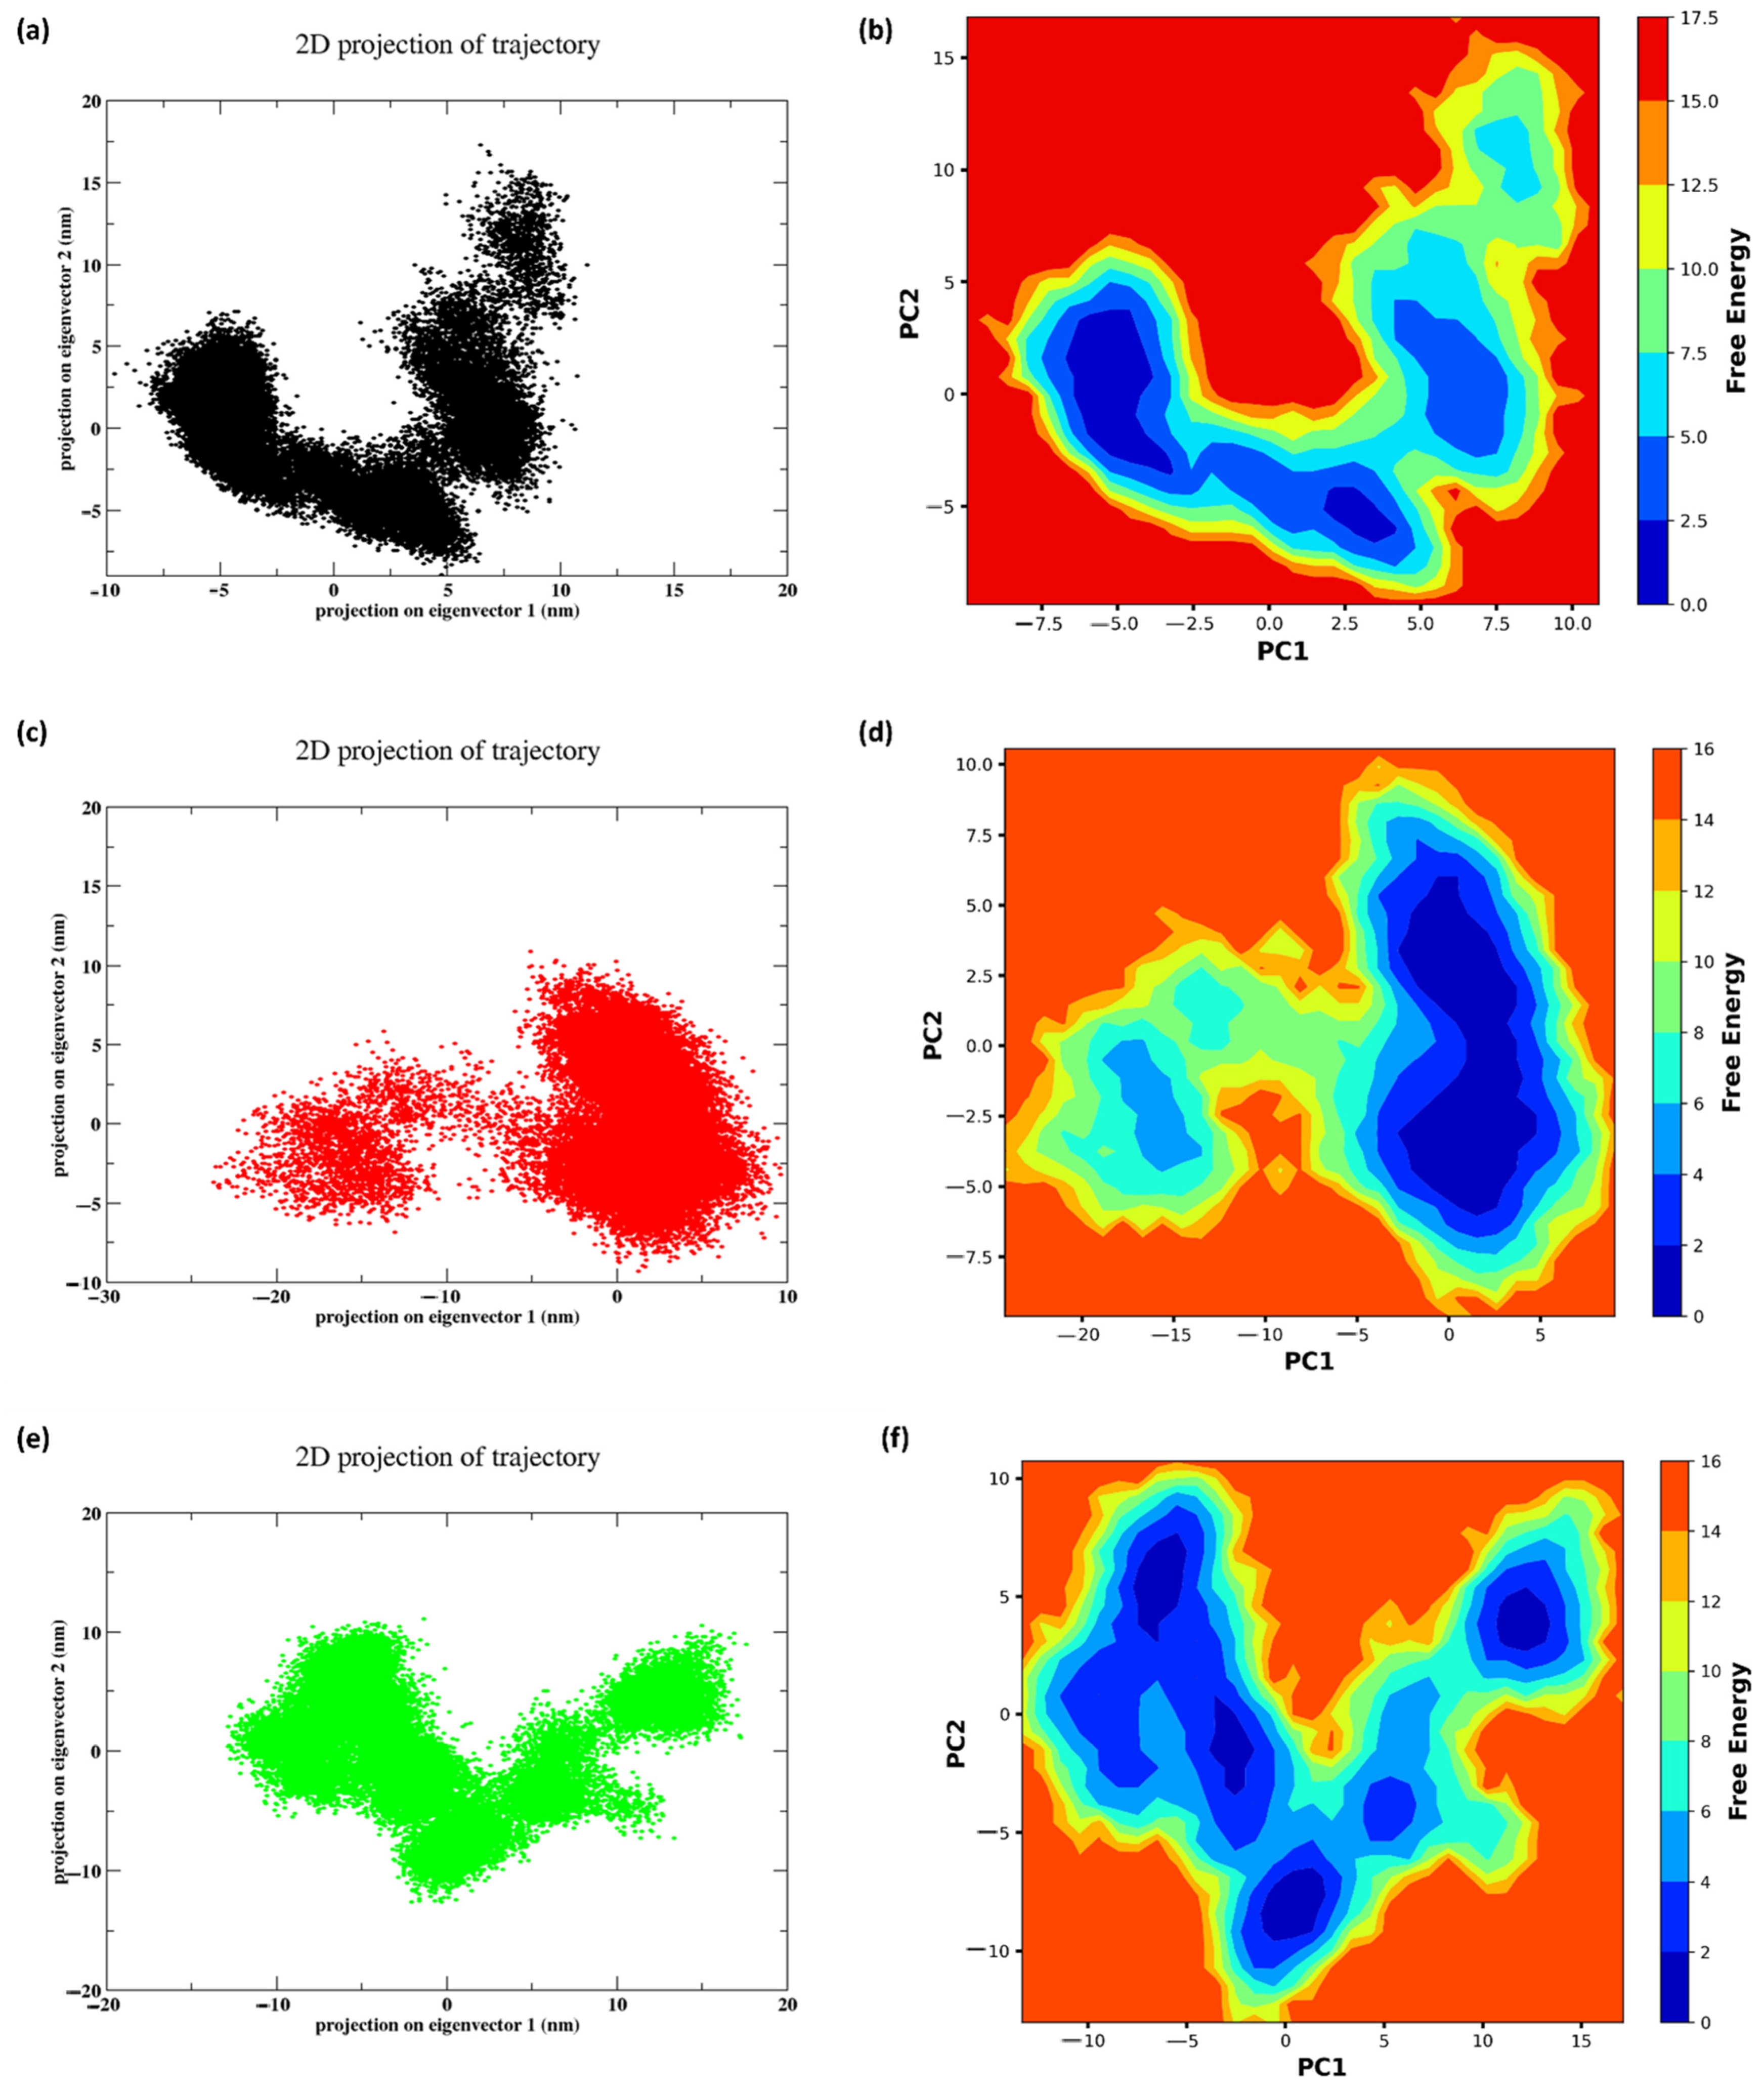
2.11. PCA and FEL
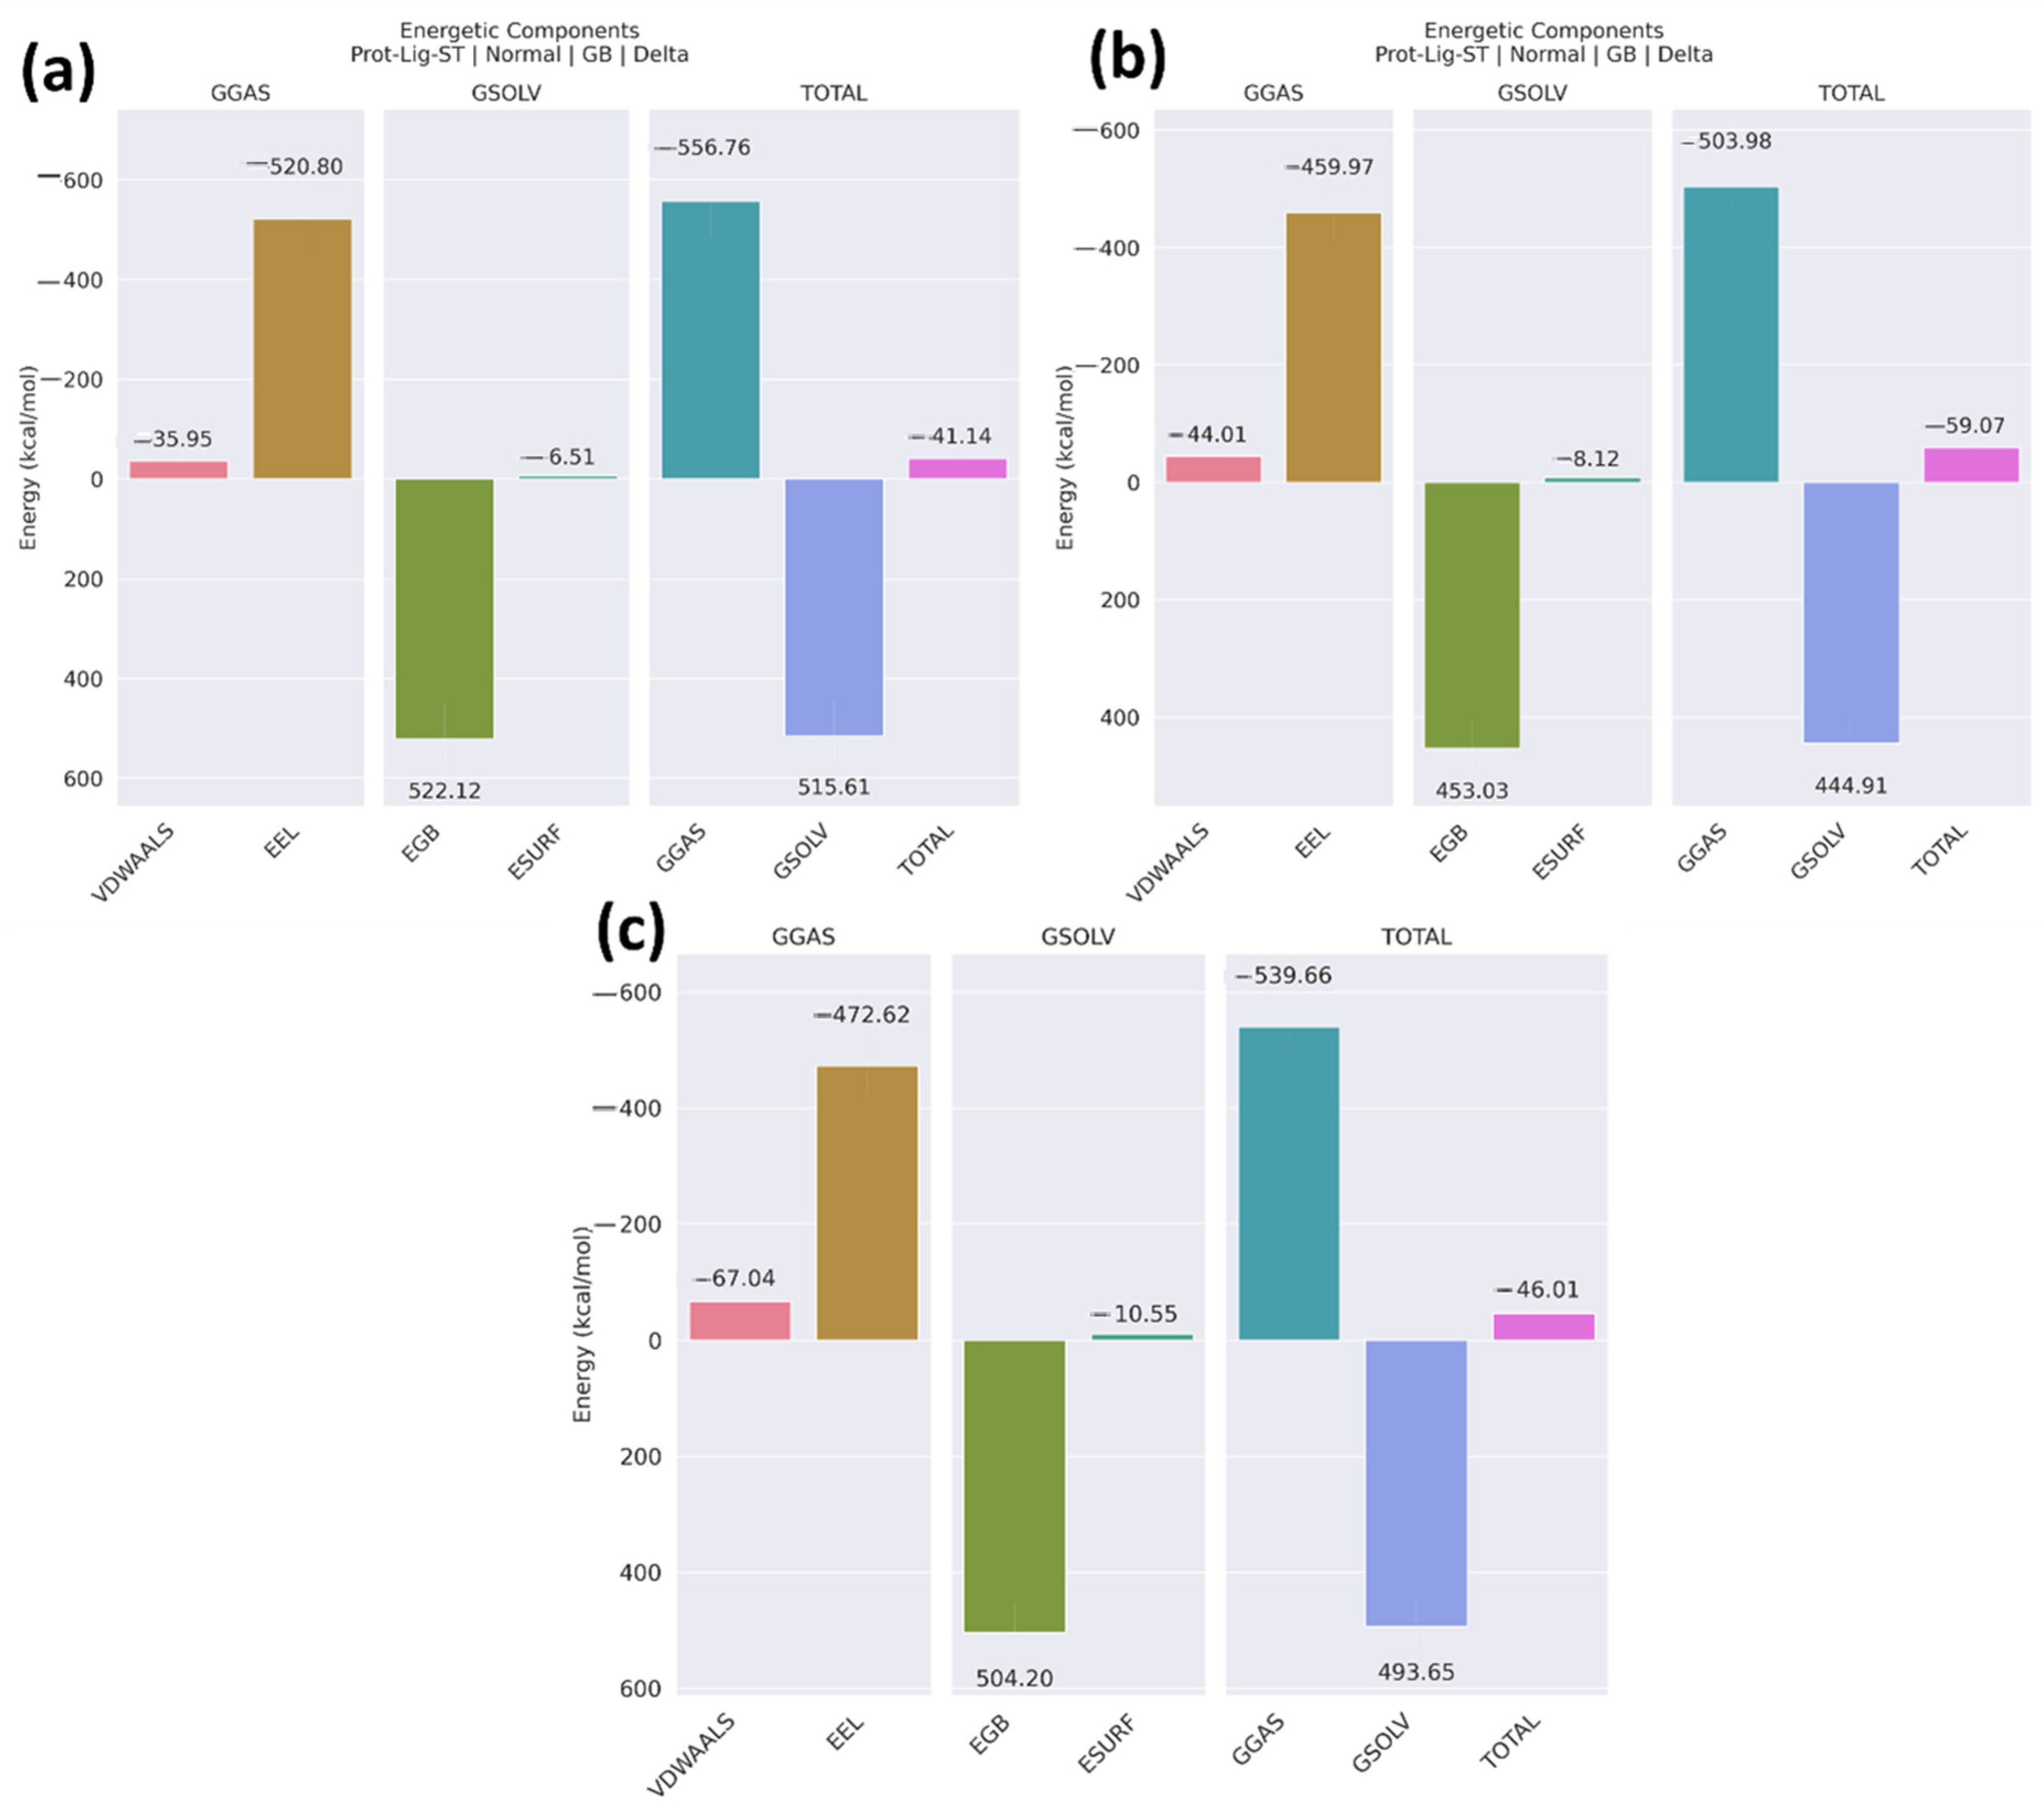
2.12. MM/GBSA
3. Methodology
3.1. Protein Structure
3.2. Native-Protein Peptide Docking
3.3. MMGBSA
3.4. Molecular Dynamics (MD) Simulation (100 ns)
3.5. Mutation and QSAR
3.6. Clustering
3.7. Peptide Modeling and Docking
3.8. Molecular Dynamics Simulation (300 ns)
3.9. PCA and FEL
3.10. MM/GBSA
4. Conclusions
Supplementary Materials
Author Contributions
Funding
Institutional Review Board Statement
Informed Consent Statement
Data Availability Statement
Conflicts of Interest
References
- Chen, X.; Lu, W.; Wu, D. Sirtuin 2 (SIRT2): Confusing Roles in the Pathophysiology of Neurological Disorders. Front. Neurosci. 2021, 15, 614107. [Google Scholar] [CrossRef]
- Yang, J.; Nicely, N.I.; Weiser, B.P. Effects of Dimerization on the Deacylase Activities of Human SIRT2. Biochemistry 2023, 62, 3383–3395. [Google Scholar] [CrossRef] [PubMed]
- de Oliveira, R.M.; Sarkander, J.; Kazantsev, A.G.; Outeiro, T.F. SIRT2 as a Therapeutic Target for Age-Related Disorders. Front. Pharmacol. 2012, 3, 82. [Google Scholar] [CrossRef] [PubMed]
- Liu, Y.; Zhang, Y.; Zhu, K.; Chi, S.; Wang, C.; Xie, A. Emerging Role of Sirtuin 2 in Parkinson’s Disease. Front. Aging Neurosci. 2020, 11, 372. [Google Scholar] [CrossRef]
- Donmez, G.; Outeiro, T.F. SIRT1 and SIRT2: Emerging Targets in Neurodegeneration. EMBO Mol. Med. 2013, 5, 344–352. [Google Scholar] [CrossRef] [PubMed]
- Saunders, L.R.; Verdin, E. Sirtuins: Critical Regulators at the Crossroads between Cancer and Aging. Oncogene 2007, 26, 5489–5504. [Google Scholar] [CrossRef]
- Sebastián, C.; Satterstrom, F.K.; Haigis, M.C.; Mostoslavsky, R. From Sirtuin Biology to Human Diseases: An Update. J. Biol. Chem. 2012, 287, 42444–42452. [Google Scholar] [CrossRef]
- Gomes, P.; Outeiro, T.F.; Cavadas, C. Emerging Role of Sirtuin 2 in the Regulation of Mammalian Metabolism. Trends Pharmacol. Sci. 2015, 36, 756–768. [Google Scholar] [CrossRef]
- Haigis, M.C.; Sinclair, D.A. Mammalian Sirtuins: Biological Insights and Disease Relevance. Annu. Rev. Pathol. Mech. Dis. 2010, 5, 253–295. [Google Scholar] [CrossRef]
- Haigis, M.C.; Guarente, L.P. Mammalian Sirtuins—Emerging Roles in Physiology, Aging, and Calorie Restriction. Genes Dev. 2006, 20, 2913–2921. [Google Scholar] [CrossRef]
- Finkel, T.; Deng, C.-X.; Mostoslavsky, R. Recent Progress in the Biology and Physiology of Sirtuins. Nature 2009, 460, 587–591. [Google Scholar] [CrossRef] [PubMed]
- Lagunas-Rangel, F.A. Current Role of Mammalian Sirtuins in DNA Repair. DNA Repair 2019, 80, 85–92. [Google Scholar] [CrossRef] [PubMed]
- Peck, B.; Chen, C.-Y.; Ho, K.-K.; Di Fruscia, P.; Myatt, S.S.; Coombes, R.C.; Fuchter, M.J.; Hsiao, C.-D.; Lam, E.W.-F. SIRT Inhibitors Induce Cell Death and P53 Acetylation through Targeting Both SIRT1 and SIRT2. Mol. Cancer Ther. 2010, 9, 844–855. [Google Scholar] [CrossRef]
- Park, S.; Chung, M.-J.; Son, J.-Y.; Yun, H.H.; Park, J.-M.; Yim, J.-H.; Jung, S.-J.; Lee, S.-H.; Jeong, K.-S. The Role of Sirtuin 2 in Sustaining Functional Integrity of the Liver. Life Sci. 2021, 285, 119997. [Google Scholar] [CrossRef] [PubMed]
- Spiegelman, N.A.; Price, I.R.; Jing, H.; Wang, M.; Yang, M.; Cao, J.; Hong, J.Y.; Zhang, X.; Aramsangtienchai, P.; Sadhukhan, S.; et al. Direct Comparison of SIRT2 Inhibitors: Potency, Specificity, Activity-Dependent Inhibition, and On-Target Anticancer Activities. ChemMedChem 2018, 13, 1890–1894. [Google Scholar] [CrossRef] [PubMed]
- Sundriyal, S.; Moniot, S.; Mahmud, Z.; Yao, S.; Di Fruscia, P.; Reynolds, C.R.; Dexter, D.T.; Sternberg, M.J.E.; Lam, E.W.-F.; Steegborn, C.; et al. Thienopyrimidinone Based Sirtuin-2 (SIRT2)-Selective Inhibitors Bind in the Ligand Induced Selectivity Pocket. J. Med. Chem. 2017, 60, 1928–1945. [Google Scholar] [CrossRef]
- Wang, Y.; Yang, J.; Hong, T.; Chen, X.; Cui, L. SIRT2: Controversy and Multiple Roles in Disease and Physiology. Ageing Res. Rev. 2019, 55, 100961. [Google Scholar] [CrossRef]
- Wójcik, P.; Berlicki, Ł. Peptide-Based Inhibitors of Protein–Protein Interactions. Bioorganic Med. Chem. Lett. 2016, 26, 707–713. [Google Scholar] [CrossRef]
- Yamagata, K.; Goto, Y.; Nishimasu, H.; Morimoto, J.; Ishitani, R.; Dohmae, N.; Takeda, N.; Nagai, R.; Komuro, I.; Suga, H.; et al. Structural Basis for Potent Inhibition of SIRT2 Deacetylase by a Macrocyclic Peptide Inducing Dynamic Structural Change. Structure 2014, 22, 345–352. [Google Scholar] [CrossRef]
- Berman, H.M.; Westbrook, J.; Feng, Z.; Gilliland, G.; Bhat, T.N.; Weissig, H.; Shindyalov, I.N.; Bourne, P.E. The Protein Data Bank. Nucleic Acids Res. 2000, 28, 235–242. [Google Scholar] [CrossRef]
- Lamiable, A.; Thévenet, P.; Rey, J.; Vavrusa, M.; Derreumaux, P.; Tufféry, P. PEP-FOLD3: Faster de Novo Structure Prediction for Linear Peptides in Solution and in Complex. Nucleic Acids Res. 2016, 44, W449–W454. [Google Scholar] [CrossRef] [PubMed]
- Yuan, S.; Chan, H.C.S.; Hu, Z. Using PyMOL as a Platform for Computational Drug Design. WIREs Comput. Mol. Sci. 2017, 7, e1298. [Google Scholar] [CrossRef]
- Yan, Y.; Zhang, D.; Zhou, P.; Li, B.; Huang, S.-Y. HDOCK: A Web Server for Protein–Protein and Protein–DNA/RNA Docking Based on a Hybrid Strategy. Nucleic Acids Res. 2017, 45, W365–W373. [Google Scholar] [CrossRef]
- Bauer, P.; Hess, B.; Lindahl, E. GROMACS 2022.4 Manual; GROMACS: Groningen, The Netherlands, 2022. [Google Scholar] [CrossRef]
- Huang, J.; MacKerell, A.D., Jr. CHARMM36 All-Atom Additive Protein Force Field: Validation Based on Comparison to NMR Data. J. Comput. Chem. 2013, 34, 2135–2145. [Google Scholar] [CrossRef]
- Vanommeslaeghe, K.; Hatcher, E.; Acharya, C.; Kundu, S.; Zhong, S.; Shim, J.; Darian, E.; Guvench, O.; Lopes, P.; Vorobyov, I.; et al. CHARMM General Force Field: A Force Field for Drug-like Molecules Compatible with the CHARMM All-Atom Additive Biological Force Fields. J. Comput. Chem. 2010, 31, 671–690. [Google Scholar] [CrossRef]
- Particle Mesh Ewald: An N⋅log(N) Method for Ewald Sums in Large Systems|The Journal of Chemical Physics|AIP Publishing. Available online: https://pubs.aip.org/aip/jcp/article-abstract/98/12/10089/461765/Particle-mesh-Ewald-An-N-log-N-method-for-Ewald?redirectedFrom=fulltext (accessed on 25 January 2024).
- Harrach, M.F.; Drossel, B. Structure and Dynamics of TIP3P, TIP4P, and TIP5P Water near Smooth and Atomistic Walls of Different Hydroaffinity. J. Chem. Phys. 2014, 140, 174501. [Google Scholar] [CrossRef]
- Hess, B.; Bekker, H.; Berendsen, H.J.C.; Fraaije, J.G.E.M. LINCS: A Linear Constraint Solver for Molecular Simulations. J. Comput. Chem. 1997, 18, 1463–1472. [Google Scholar] [CrossRef]
- Valdés-Tresanco, M.S.; Valdés-Tresanco, M.E.; Valiente, P.A.; Moreno, E. gmx_MMPBSA: A New Tool to Perform End-State Free Energy Calculations with GROMACS. J. Chem. Theory Comput. 2021, 17, 6281–6291. [Google Scholar] [CrossRef] [PubMed]
- Miller, B.R.I.; McGee, T.D., Jr.; Swails, J.M.; Homeyer, N.; Gohlke, H.; Roitberg, A.E. MMPBSA.Py: An Efficient Program for End-State Free Energy Calculations. J. Chem. Theory Comput. 2012, 8, 3314–3321. [Google Scholar] [CrossRef]
- Bussi, G.; Donadio, D.; Parrinello, M. Canonical Sampling through Velocity Rescaling. J. Chem. Phys. 2007, 126, 014101. [Google Scholar] [CrossRef]
- Martoňák, R.; Laio, A.; Parrinello, M. Predicting Crystal Structures: The Parrinello-Rahman Method Revisited. Phys. Rev. Lett. 2003, 90, 075503. [Google Scholar] [CrossRef] [PubMed]
- Wang, R.; Fang, X.; Lu, Y.; Yang, C.-Y.; Wang, S. The PDBbind Database: Methodologies and Updates. J. Med. Chem. 2005, 48, 4111–4119. [Google Scholar] [CrossRef]
- Mao, J.; Akhtar, J.; Zhang, X.; Sun, L.; Guan, S.; Li, X.; Chen, G.; Liu, J.; Jeon, H.-N.; Kim, M.S.; et al. Comprehensive Strategies of Machine-Learning-Based Quantitative Structure-Activity Relationship Models. iScience 2021, 24, 103052. [Google Scholar] [CrossRef] [PubMed]
- Asmare, M.M.; Nitin, N.; Yun, S.-I.; Mahapatra, R.K. QSAR and Deep Learning Model for Virtual Screening of Potential Inhibitors against Inosine 5’ Monophosphate Dehydrogenase (IMPDH) of Cryptosporidium parvum. J. Mol. Graph. Model. 2022, 111, 108108. [Google Scholar] [CrossRef] [PubMed]
- Sial, A.H.; Rashdi, S.Y.S.; Khan, A.H. Comparative Analysis of Data Visualization Libraries Matplotlib and Seaborn in Python. Int. J. 2021, 10, 277–281. [Google Scholar] [CrossRef]
- Bressert, E. SciPy and NumPy: An Overview for Developers; O’Reilly Media, Inc.: Sebastopol, CA, USA, 2012; ISBN 978-1-4493-6163-1. [Google Scholar]
- Pedregosa, F.; Varoquaux, G.; Gramfort, A.; Michel, V.; Thirion, B.; Grisel, O.; Blondel, M.; Prettenhofer, P.; Weiss, R.; Dubourg, V.; et al. Scikit-Learn: Machine Learning in Python. J. Mach. Learn. Res. 2011, 12, 2825–2830. [Google Scholar]
- Schratz, P.; Muenchow, J.; Iturritxa, E.; Richter, J.; Brenning, A. Hyperparameter Tuning and Performance Assessment of Statistical and Machine-Learning Algorithms Using Spatial Data. Ecol. Model. 2019, 406, 109–120. [Google Scholar] [CrossRef]
- Akiba, T.; Sano, S.; Yanase, T.; Ohta, T.; Koyama, M. Optuna: A Next-Generation Hyperparameter Optimization Framework. In Proceedings of the 25th ACM SIGKDD International Conference on Knowledge Discovery & Data Mining, Anchorage, AK, USA, 4–8 August 2019; pp. 2623–2631. [Google Scholar]
- Landrum, G. RDKit: Open-Source Cheminformatics. Release 2014.03.1. Zenodo 2014. [Google Scholar] [CrossRef]
- Wang, J.; Zhang, L.; Jia, L.; Ren, Y.; Yu, G. Protein-Protein Interactions Prediction Using a Novel Local Conjoint Triad Descriptor of Amino Acid Sequences. Int. J. Mol. Sci. 2017, 18, 2373. [Google Scholar] [CrossRef]
- Hunter, J.D. Matplotlib: A 2D Graphics Environment. Comput. Sci. Eng. 2007, 9, 90–95. [Google Scholar] [CrossRef]
- Berendsen, H.J.C.; van der Spoel, D.; van Drunen, R. GROMACS: A Message-Passing Parallel Molecular Dynamics Implementation. Comput. Phys. Commun. 1995, 91, 43–56. [Google Scholar] [CrossRef]
- Hess, B.; Kutzner, C.; van der Spoel, D.; Lindahl, E. GROMACS 4: Algorithms for Highly Efficient, Load-Balanced, and Scalable Molecular Simulation. J. Chem. Theory Comput. 2008, 4, 435–447. [Google Scholar] [CrossRef] [PubMed]
- Sgarbossa, A. Natural Biomolecules and Protein Aggregation: Emerging Strategies against Amyloidogenesis. Int. J. Mol. Sci. 2012, 13, 17121–17137. [Google Scholar] [CrossRef] [PubMed]


| Model | R2 on Training Set | R2 on Test Set |
|---|---|---|
| Random Forest | 0.934 | 0.672 |
| Ridge | 0.952 | −1.482 |
| GradientBoostingRegressor | 0.887 | 0.647 |
| XGBRegressor | 0.995 | 0.696 |
| Parameter | Peptide 1 | Peptide 2 | Peptide 3 |
|---|---|---|---|
| Molecular Weight | 1707.88 | 1869.15 | 1650.83 |
| Theoretical pI | 9.63 | 9.11 | 9.63 |
| Total Negatively Charged Residues (Asp + Glu) | 0 | 1 | 0 |
| Total Positively Charged Residues (Arg + Lys) | 3 | 3 | 3 |
| Total Number of Atoms | 230 | 252 | 223 |
| Aliphatic Index | 20.71 | 20.71 | 20.71 |
| Grand Average of Hydropathicity (GRAVY) | −1.579 | −1.229 | −1.357 |
| Compounds | VDWAALS | EEL | EGB | ESURF | GGAS | GSOLV | Total |
|---|---|---|---|---|---|---|---|
| Non-cyclic peptide | −35.95 ± 7.36 | −520.80 ± 68.37 | 522.12 ± 71.38 | −6.51 ± 0.86 | −556.76 ± 71.39 | 515.61 ± 76.78 | −41.14 ± 7.43 |
| Peptide 1 | −44.01 ± 5.65 | −459.97 ± 45.95 | 453.03 ± 45.51 | −8.12 ± 45.51 | −503.98 ± 46.37 | 444.91 ± 45.29 | −59.07 ± 6.33 |
| Peptide 2 | −67.04 ± 5.42 | −472.62 ± 54.15 | 504.20 ± 50.26 | −10.55 ± 0.77 | −539.66 ± 54.83 | 493.65 ± 49.87 | −46.01 ± 7.15 |
Disclaimer/Publisher’s Note: The statements, opinions and data contained in all publications are solely those of the individual author(s) and contributor(s) and not of MDPI and/or the editor(s). MDPI and/or the editor(s) disclaim responsibility for any injury to people or property resulting from any ideas, methods, instructions or products referred to in the content. |
© 2024 by the authors. Licensee MDPI, Basel, Switzerland. This article is an open access article distributed under the terms and conditions of the Creative Commons Attribution (CC BY) license (https://creativecommons.org/licenses/by/4.0/).
Share and Cite
Alkhatabi, H.A.; Naemi, F.M.A.; Alsolami, R.; Alatyb, H.N. Computational Design and Optimization of Peptide Inhibitors for SIRT2. Pharmaceuticals 2024, 17, 1120. https://doi.org/10.3390/ph17091120
Alkhatabi HA, Naemi FMA, Alsolami R, Alatyb HN. Computational Design and Optimization of Peptide Inhibitors for SIRT2. Pharmaceuticals. 2024; 17(9):1120. https://doi.org/10.3390/ph17091120
Chicago/Turabian StyleAlkhatabi, Heba A., Fatmah M. A. Naemi, Reem Alsolami, and Hisham N. Alatyb. 2024. "Computational Design and Optimization of Peptide Inhibitors for SIRT2" Pharmaceuticals 17, no. 9: 1120. https://doi.org/10.3390/ph17091120
APA StyleAlkhatabi, H. A., Naemi, F. M. A., Alsolami, R., & Alatyb, H. N. (2024). Computational Design and Optimization of Peptide Inhibitors for SIRT2. Pharmaceuticals, 17(9), 1120. https://doi.org/10.3390/ph17091120