
Systems Biology-Driven Discovery of Host-Targeted Therapeutics for Oropouche Virus: Integrating Network Pharmacology, Molecular Docking, and Drug Repurposing
 , ,
, ,  ,
,  ,
, 
Abstract
: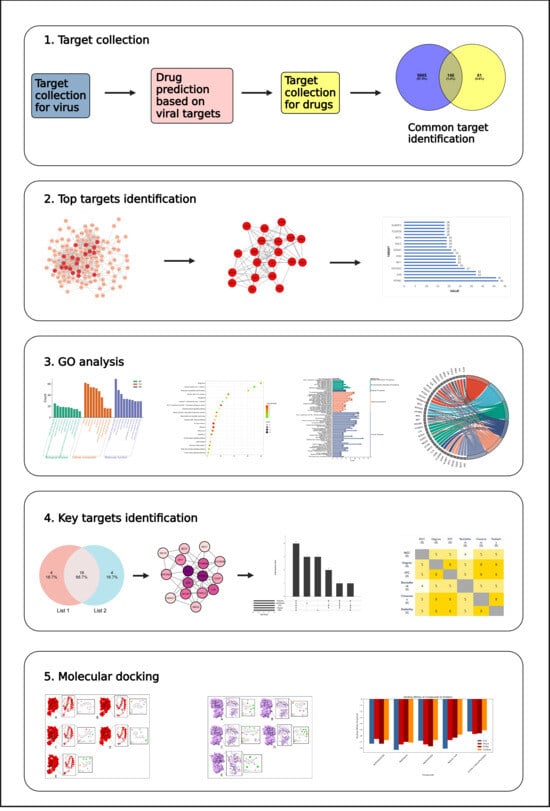
1. Introduction
2. Results
2.1. Targets for Virus
2.2. Drug Prediction
2.3. Compound Selection
2.4. Target Collection for Compounds
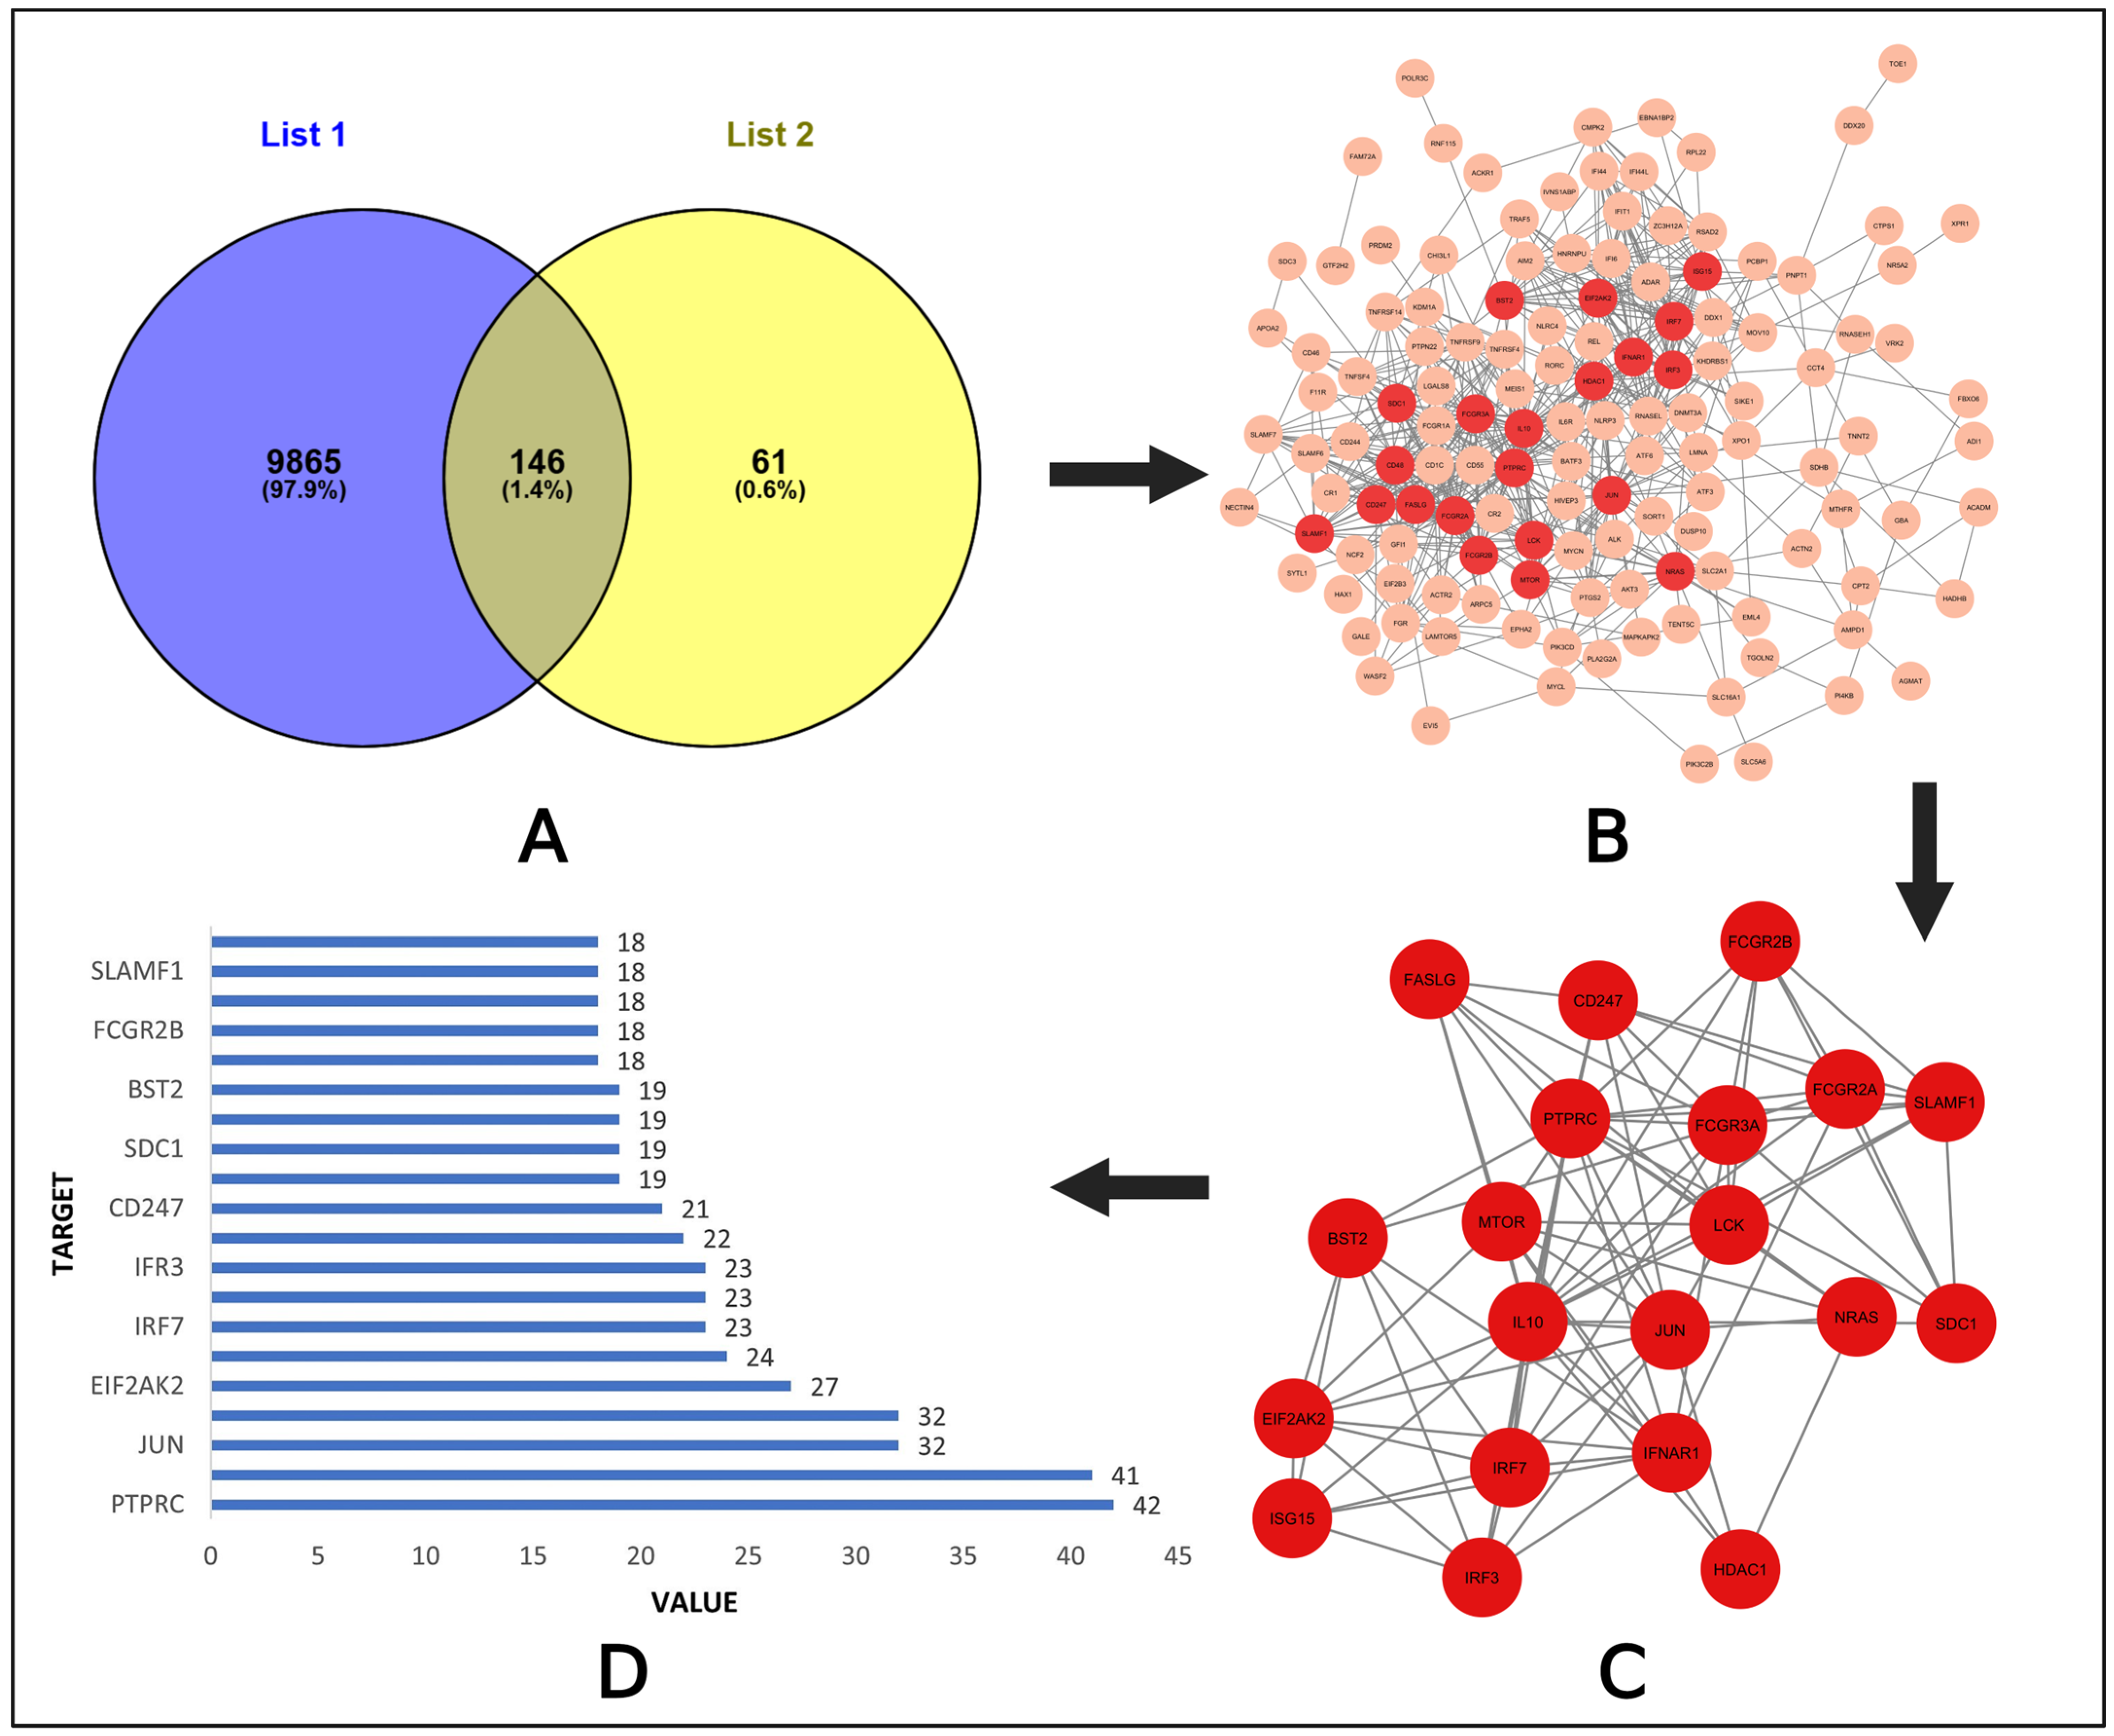
2.5. PPI Network Analysis
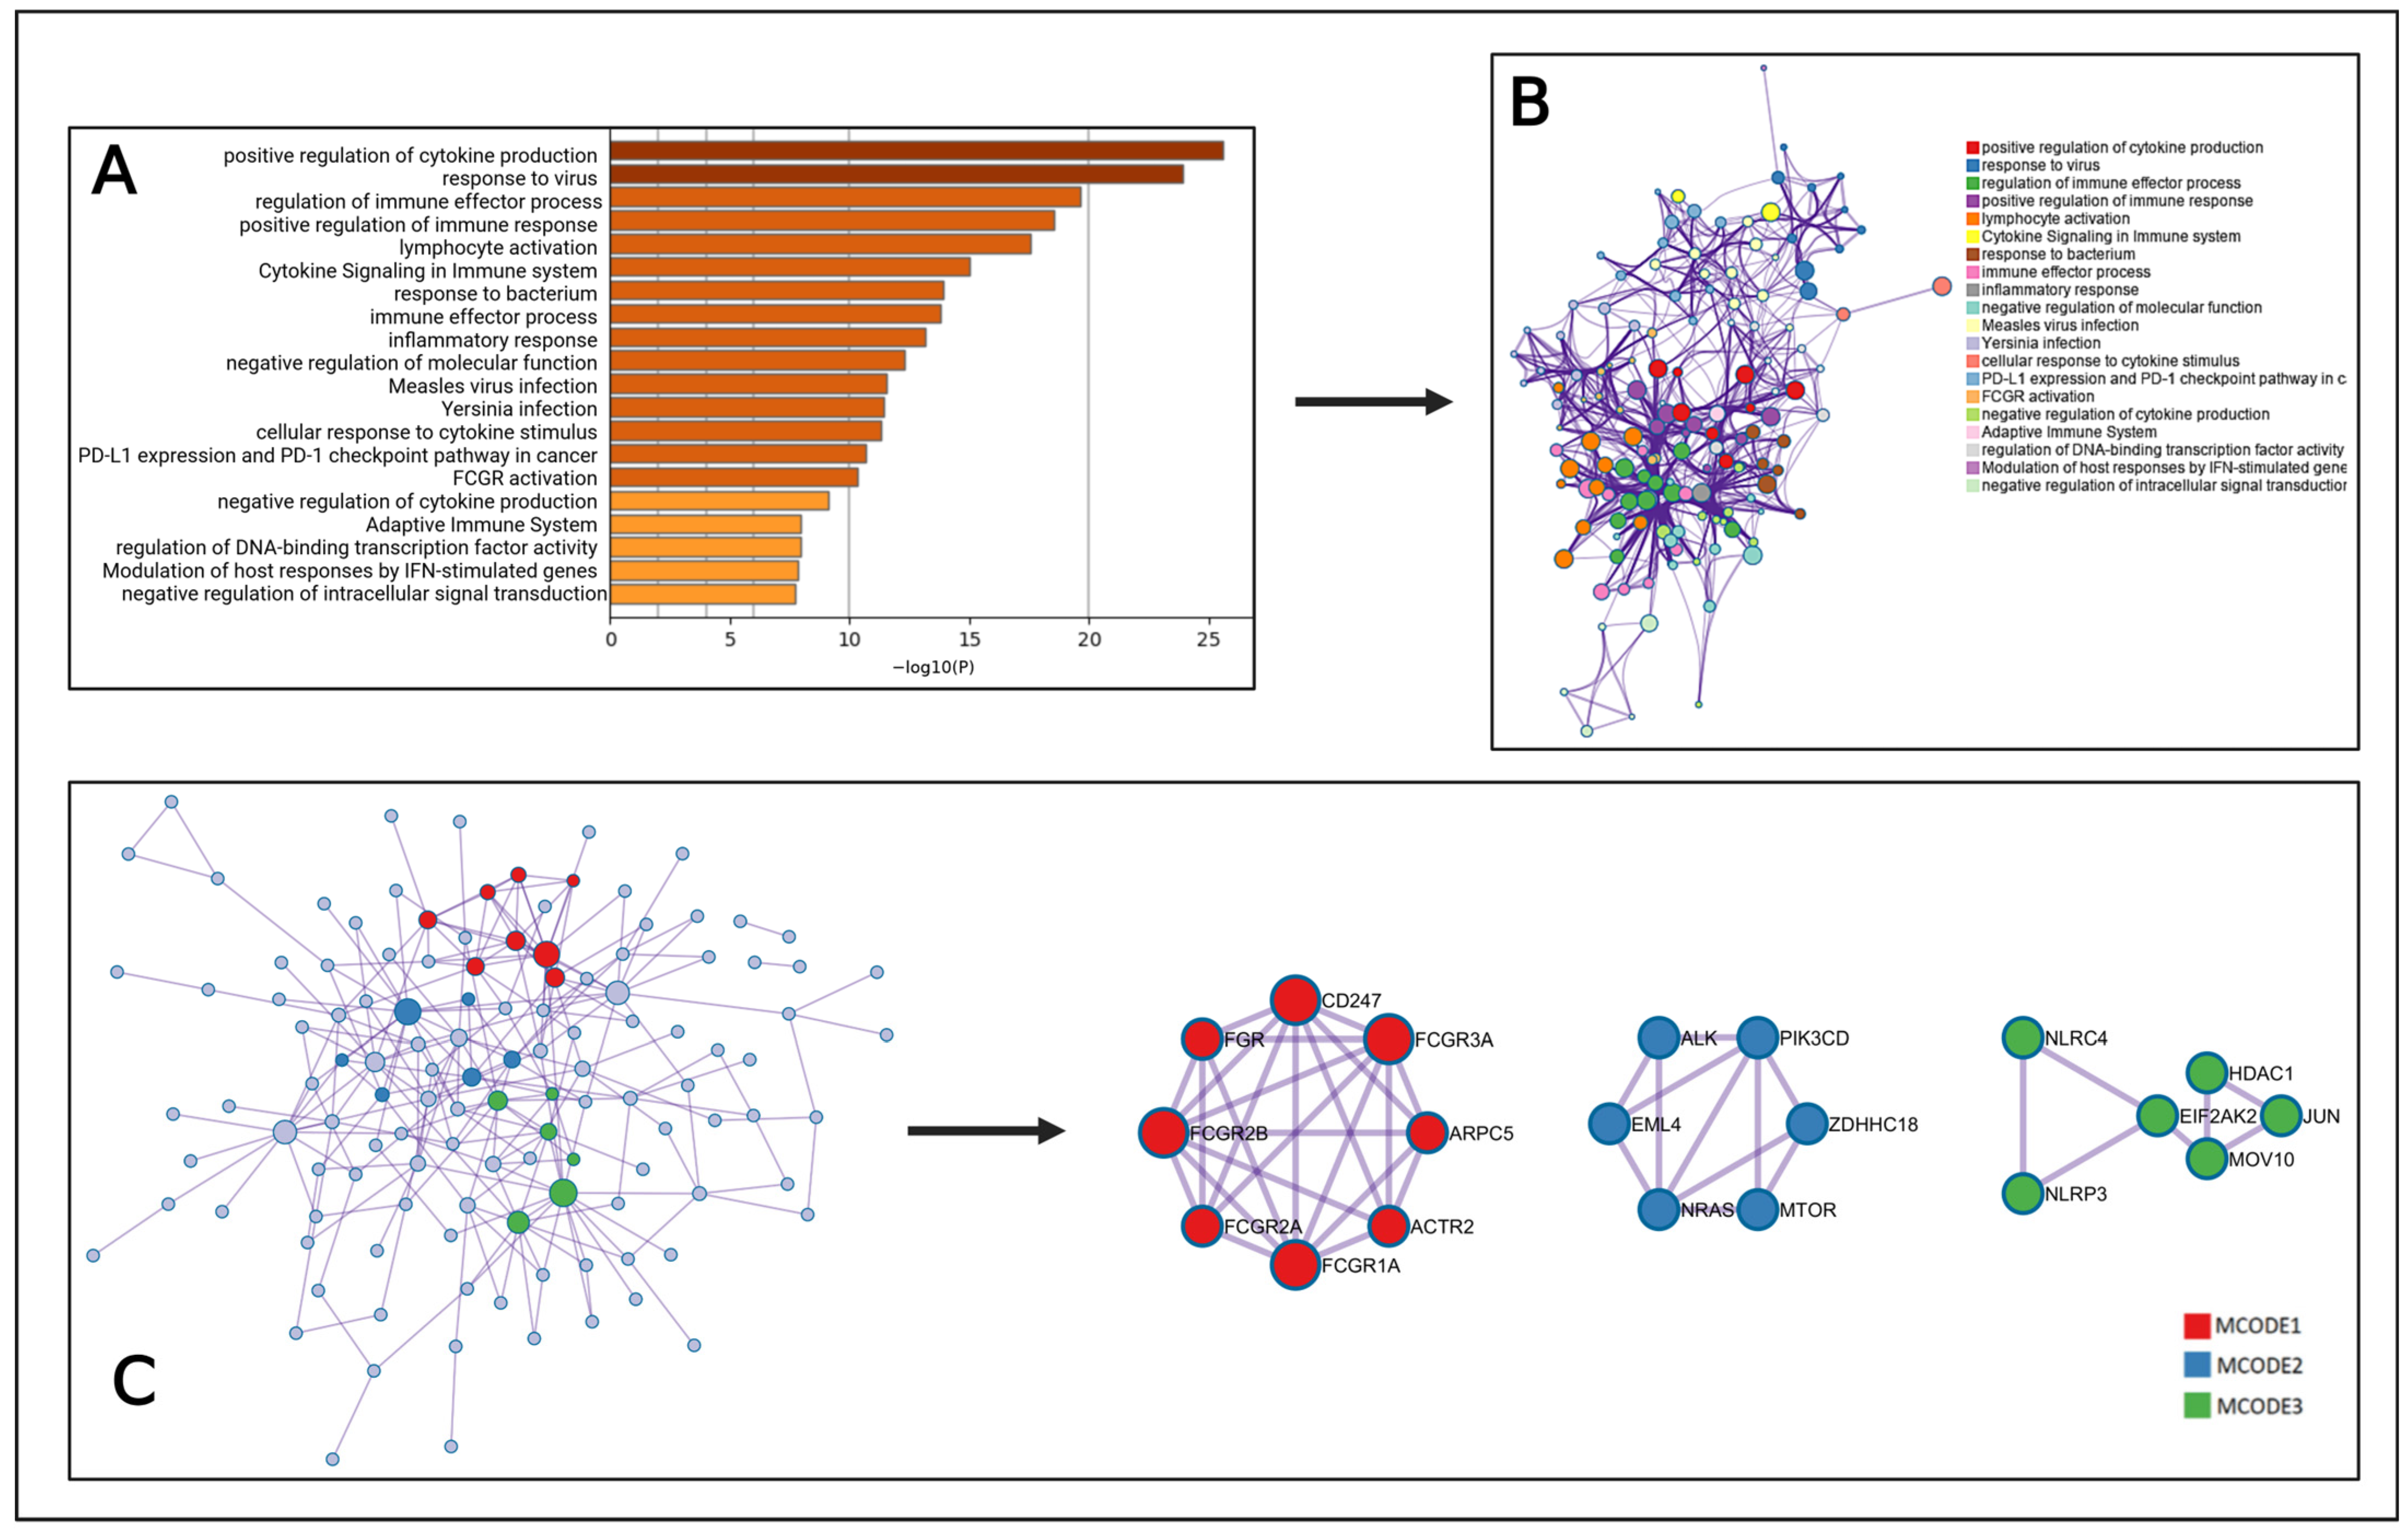
2.6. MCODE Analysis
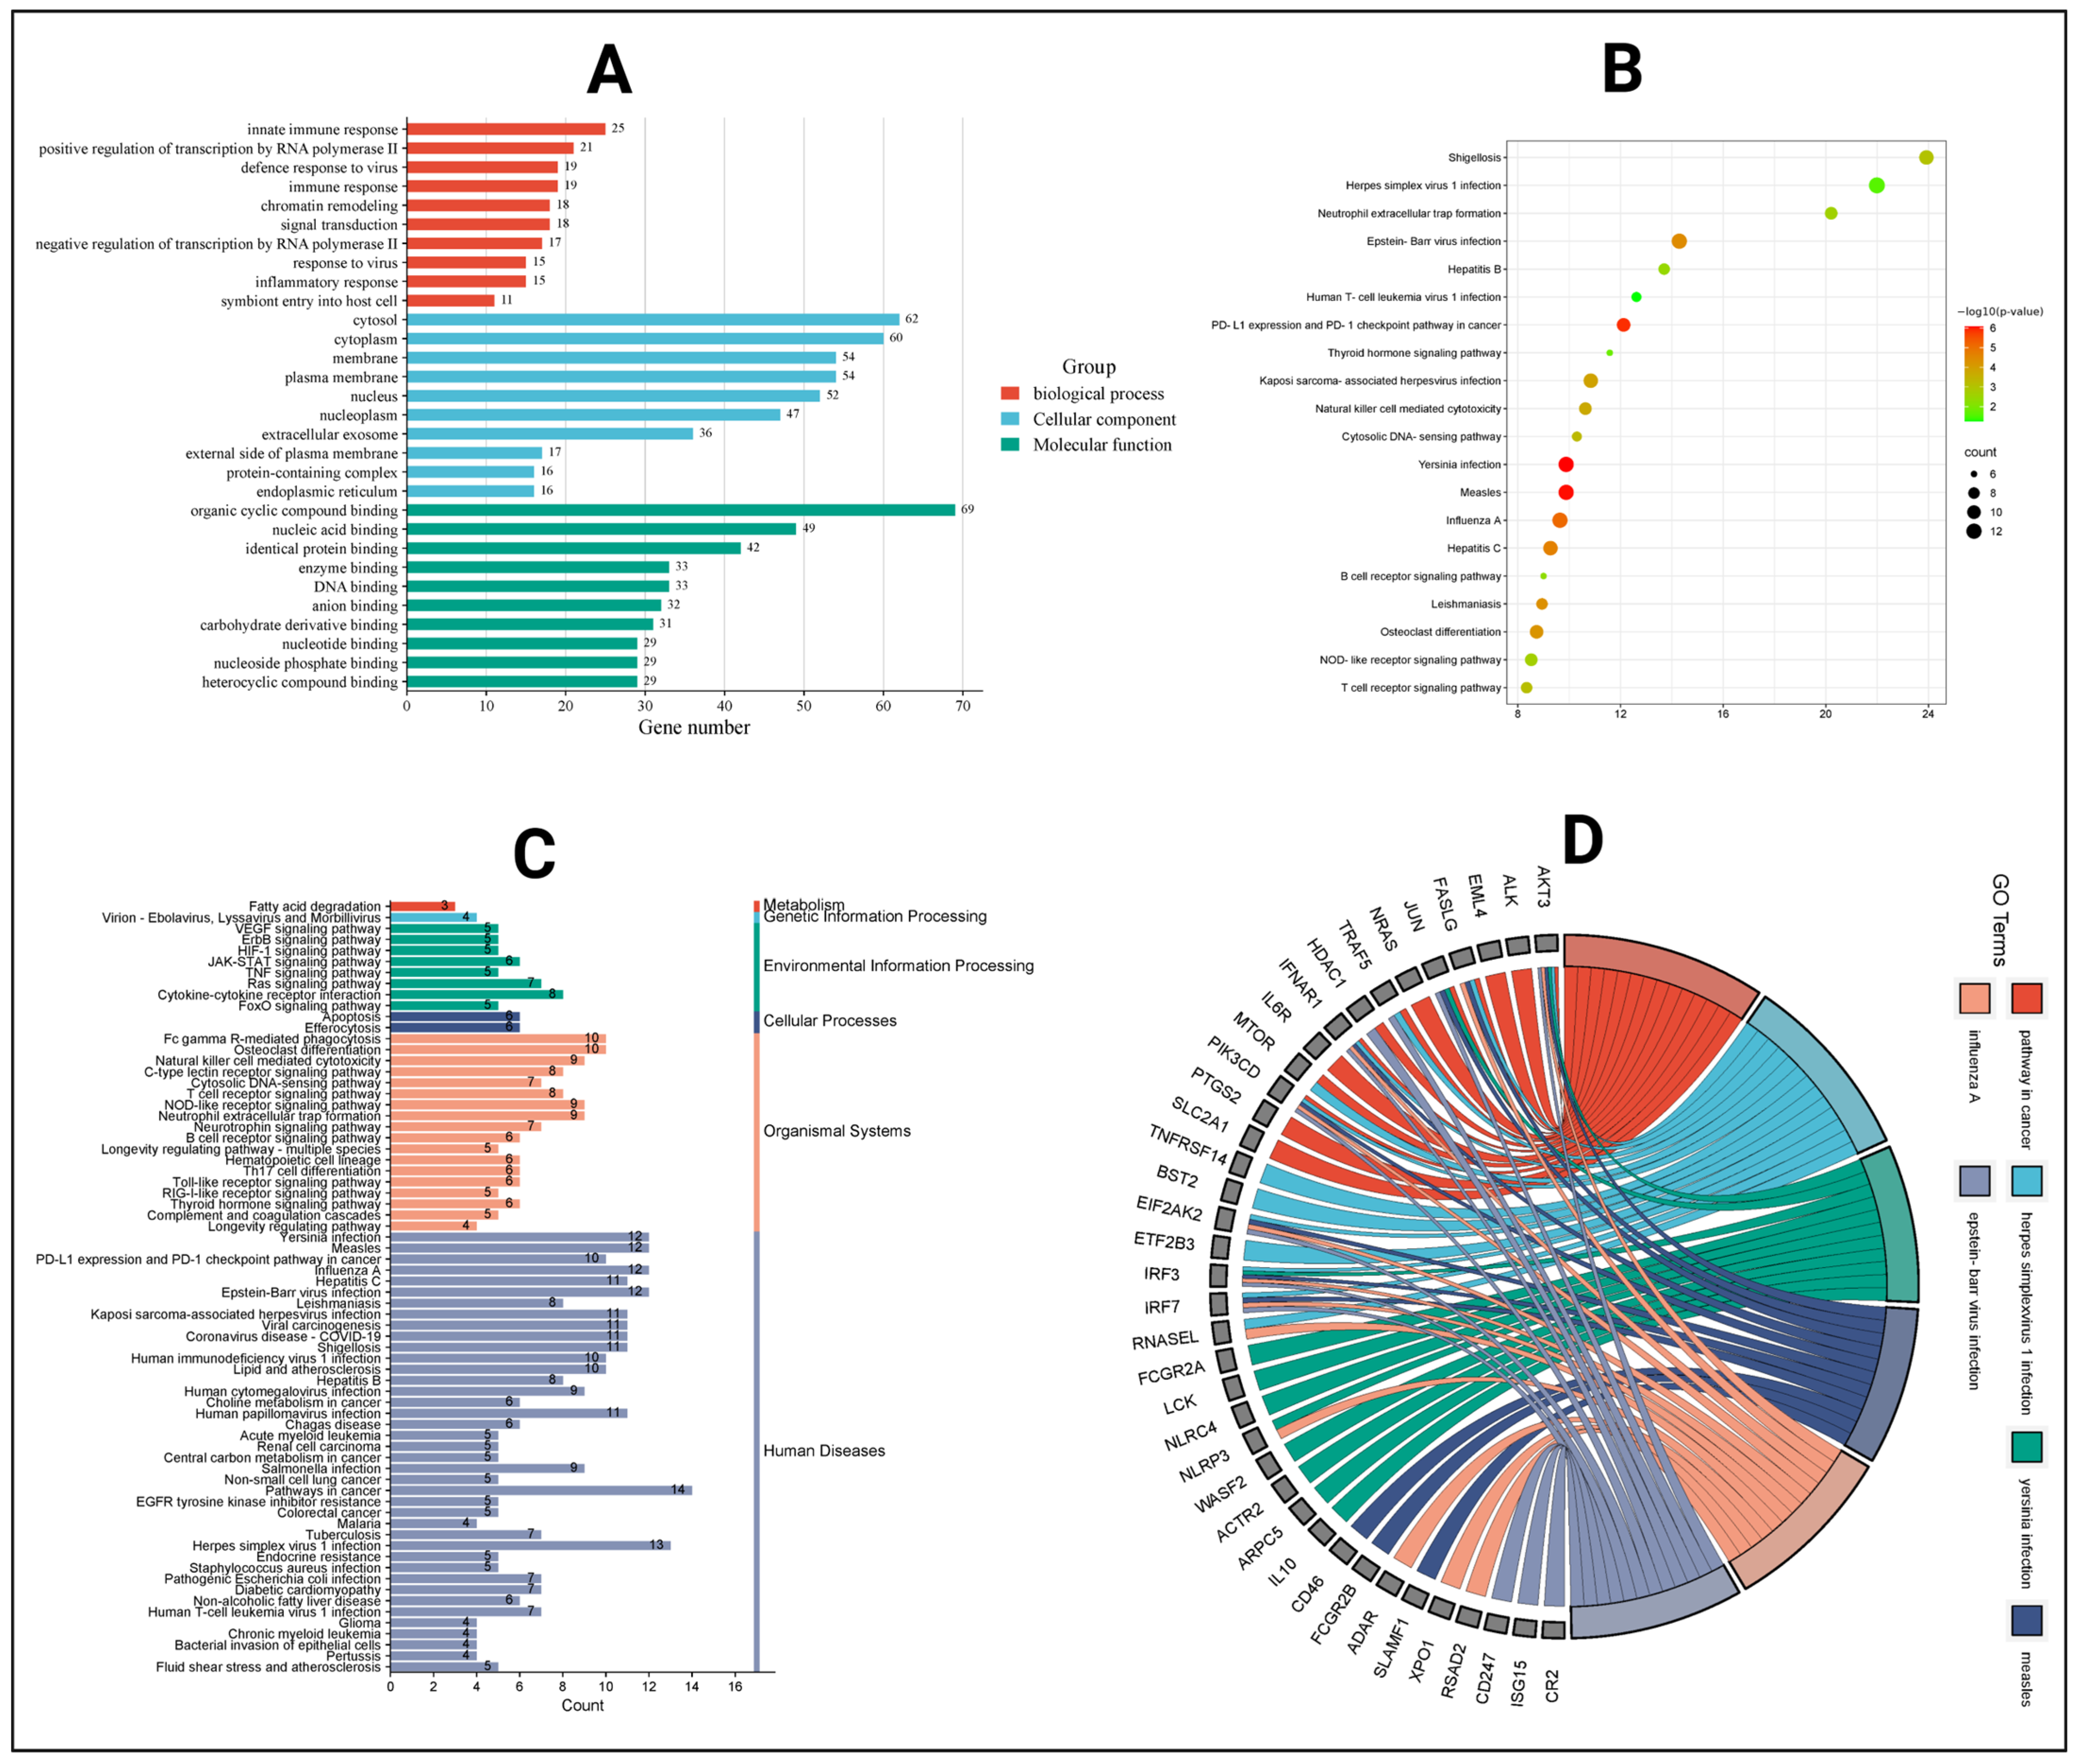
2.7. Gene Ontology and KEGG Pathway Analysis
2.8. Target to Pathway Network
2.9. Key Target Identification
2.10. Docking Result
3. Discussion
4. Materials and Methods
4.1. Target Identification for Oropouche Virus
4.2. Identified Drugs
4.3. Selected Compounds
4.4. Target Gene Identification for Selected Compounds
4.5. Intersection of Targets
4.6. Protein–Protein Interaction Network
4.7. Analysis by MCODE
4.8. Gene Ontology Analysis
4.9. Compound–Pathway–Target Interaction Network
4.10. Identified Key Targets
4.11. Use of Positive Control Inhibitors
4.11.1. Using Positive Controls
4.11.2. Selection of Positive Control Inhibitors
- FASLG (Fas Ligand): One promising inhibitor for FASLG is ONL1204, a small peptide antagonist of the Fas receptor. It has demonstrated neuroprotective effects in models of glaucoma, reducing neuroinflammation and preventing axon degeneration [67].
- FCGR3A (Fc gamma receptor IIIa): The inhibitor BI-1206 was selected for FCGR3A based on its a monoclonal antibody that blocks Fc gamma receptor IIIa to enhance immune responses in cancer therapy [68].
- IL10 (Interleukin 10): A well-characterized positive control inhibitor for IL10 (Interleukin-10) is JTE-607, which selectively inhibits inflammatory cytokine synthesis, including IL10 [69].
- PTPRC (Protein Tyrosine Phosphatase Receptor Type C): A well-characterized positive control inhibitor for PTPRC (CD45) is CD45 Inhibitor VI, also known as 2-(4-Acetylanilino)-3-chloronaphthoquinone. It is a chloronaphthoquinone compound that potently inhibits PTPRC tyrosine phosphatase activity in a non-substrate-competitive and irreversible manner [70].
4.12. Molecular Docking
4.12.1. Protein and Compound Preparation
4.12.2. Identification of Binding Site and Grid Box for Protein
4.13. Alternative Docking
5. Conclusions
Supplementary Materials
Author Contributions
Funding
Institutional Review Board Statement
Informed Consent Statement
Data Availability Statement
Conflicts of Interest
References
- Zhang, Y.; Liu, X.; Wu, Z.; Feng, S.; Lu, K.; Zhu, W.; Sun, H.; Niu, G. Oropouche virus: A neglected global arboviral threat. Virus Res. 2024, 341, 199318. [Google Scholar] [CrossRef] [PubMed]
- Travassos Da Rosa, J.F.; De Souza, W.M.; De Paula Pinheiro, F.; Figueiredo, M.L.; Cardoso, J.F.; Acrani, G.O.; Teixeira Nunes, M.R. Oropouche Virus: Clinical, Epidemiological, and Molecular Aspects of a Neglected Orthobunyavirus. Am. J. Trop. Med. Hyg. 2017, 96, 1019–1030. [Google Scholar] [CrossRef] [PubMed]
- de Armas Fernández, J.R.; Peña García, C.E.; Acosta Herrera, B.; Betancourt Plaza, I.; Gutiérrez de la Cruz, Y.; Resik Aguirre, S.; Kourí Cardellá, V.; Guzmán Tirado, M.G. Report of an unusual association of Oropouche Fever with Guillain-Barré syndrome in Cuba, 2024. Eur. J. Clin. Microbiol. Infect. Dis. 2025, 43, 2233–2237. [Google Scholar] [CrossRef]
- Carpenter, S.; Groschup, M.H.; Garros, C.; Felippe-Bauer, M.L.; Purse, B.V. Culicoides biting midges, arboviruses and public health in Europe. Antivir. Res. 2013, 100, 102–113. [Google Scholar] [CrossRef]
- Gräf, T.; Delatorre, E.; do Nascimento Ferreira, C.; Rossi, A.; Santos, H.G.G.; Pizzato, B.R.; Nascimento, V.; Souza, V.; de Lima, G.B.; Dezordi, F.Z.; et al. Expansion of Oropouche virus in non-endemic Brazilian regions: Analysis of genomic characterisation and ecological drivers. Lancet Infect. Dis. 2024, 25, 379–389. [Google Scholar] [CrossRef] [PubMed]
- Tortosa, F.; Castillo, G.G.; Izcovich, A.; Luz, K.; dos Santos, T.; Gonzalez-Escobar, G.; Ragusa, M.A.; Gresh, L.; Mendez-Rico, J.A.; Reveiz, L. Revisión sistemática viva de las manifestaciones clínicas de la fiebre de Oropouche: Claves para diferenciarla del dengue y otras arbovirosis. Rev. Panam. Salud Publica 2024, 48, e136. [Google Scholar] [CrossRef]
- Elliott, R.M. Orthobunyaviruses: Recent genetic and structural insights. Nat. Rev. Microbiol. 2014, 12, 673–685. [Google Scholar] [CrossRef]
- Bonifay, T.; Le Turnier, P.; Epelboin, Y.; Carvalho, L.; De Thoisy, B.; Djossou, F.; Duchemin, J.B.; Dussart, P.; Enfissi, A.; Lavergne, A.; et al. Review on Main Arboviruses Circulating on French Guiana, An Ultra-Peripheric European Region in South America. Viruses 2023, 15, 1268. [Google Scholar] [CrossRef]
- Akingbola, A.; Adegbesan, A.; Ojo, O.; Ezendu, A.; Shekoni, M. The rising concern of Oropouche fever: A call for enhanced surveillance and research in emerging arboviral threats. Infect. Dis. 2024, 56, 1015–1019. [Google Scholar] [CrossRef]
- Jiao, Y.; Shi, C.; Sun, Y. The Use of Xuanbai Chengqi Decoction on Monkeypox Disease through the Estrone-Target AR Interaction. Front Microbiol 2023, 14, 1234817. [Google Scholar] [CrossRef]
- Peinado, R.d.S.; Eberle, R.J.; Arni, R.K.; Coronado, M.A. A Review of Omics Studies on Arboviruses: Alphavirus, Orthobunyavirus and Phlebovirus. Viruses 2022, 14, 2194. [Google Scholar] [CrossRef] [PubMed]
- Moreira, F.R.R.; Dutra, J.V.R.; de Carvalho, A.H.B.; Reis, C.R.; Rios, J.S.H.; de Oliveira Ribeiro, M.; Arruda, M.B.; Alvarez, P.; Souza, R.P.; Voloch, C.; et al. Oropouche virus genomic surveillance in Brazil. Lancet Infect. Dis. 2024, 24, e664–e666. [Google Scholar] [CrossRef] [PubMed]
- Rocha, R.F.; Del Sarto, J.L.; Marques, R.E.; Costa, V.V.; Teixeira, M.M. Host target-based approaches against arboviral diseases. Biol. Chem. 2018, 399, 203–217. [Google Scholar] [CrossRef]
- Fang, J.; Wu, Q.; Ye, F.; Cai, C.; Xu, L.; Gu, Y.; Wang, Q.; Liu, A.L.; Tan, W.; Du, G.H. Network-Based Identification and Experimental Validation of Drug Candidates Toward SARS-CoV-2 via Targeting Virus–Host Interactome. Front. Genet. 2021, 12, 728960. [Google Scholar] [CrossRef]
- Krishnamurthy, N.; Grimshaw, A.A.; Axson, S.A.; Choe, S.H.; Miller, J.E. Drug repurposing: A systematic review on root causes, barriers and facilitators. BMC Health Serv. Res. 2022, 22, 970. [Google Scholar] [CrossRef]
- Pantsar, T.; Poso, A. Binding Affinity via Docking: Fact and Fiction. Molecules 2018, 23, 1899. [Google Scholar] [CrossRef]
- Bhutkar, M.; Singh, V.; Dhaka, P.; Tomar, S. Virus-host protein-protein interactions as molecular drug targets for arboviral infections. Front. Virol. 2022, 2, 959586. [Google Scholar] [CrossRef]
- Huang, Y.J.S.; Higgs, S.; Vanlandingham, D.L. Arbovirus-mosquito vector-host interactions and the impact on transmission and disease pathogenesis of arboviruses. Front. Microbiol. 2019, 10, 434047. [Google Scholar] [CrossRef]
- Wilson, E.B.; Brooks, D.G. The Role of IL-10 in Regulating Immunity to Persistent Viral Infections. In Negative Co-Receptors and Ligands; Springer: Berlin/Heidelberg, Germany, 2010; pp. 39–65. [Google Scholar] [CrossRef]
- Tsai, T.T.; Chuang, Y.J.; Lin, Y.S.; Wan, S.W.; Chen, C.L.; Lin, C.F. An emerging role for the anti-inflammatory cytokine interleukin-10 in dengue virus infection. J. Biomed. Sci. 2013, 20, 40. [Google Scholar] [CrossRef]
- Al Barashdi, M.A.; Ali, A.; McMullin, M.F.; Mills, K. Protein tyrosine phosphatase receptor type C (PTPRC or CD45). J. Clin. Pathol. 2021, 74, 548–552. [Google Scholar] [CrossRef]
- Toor, S.M.; Saleh, R.; Sasidharan Nair, V.; Taha, R.Z.; Elkord, E. T-cell responses and therapies against SARS-CoV-2 infection. Immunology 2021, 162, 30–43. [Google Scholar] [CrossRef]
- Brockman, M.A.; Kwon, D.S.; Tighe, D.P.; Pavlik, D.F.; Rosato, P.C.; Sela, J.; Porichis, F.; Le Gall, S.; Waring, M.T.; Moss, K.; et al. IL-10 is up-regulated in multiple cell types during viremic HIV infection and reversibly inhibits virus-specific T cells. Blood 2009, 114, 346–356. [Google Scholar] [CrossRef] [PubMed]
- Morens, D.M.; Fauci, A.S. Emerging Pandemic Diseases: How We Got to COVID-19. Cell 2020, 182, 1077–1092. [Google Scholar] [CrossRef] [PubMed]
- Song, D.H.; Garcia, G.; Situ, K.; Chua, B.A.; Hong, M.L.O.; Do, E.A.; Ramirez, C.M.; Harui, A.; Arumugaswami, V.; Morizono, K. Development of a blocker of the universal phosphatidylserine- and phosphatidylethanolamine-dependent viral entry pathways. Virology 2021, 560, 17–33. [Google Scholar] [CrossRef]
- Khanam, A.; Gutiérrez-Barbosa, H.; Lyke, K.E.; Chua, J.V. Immune-Mediated Pathogenesis in Dengue Virus Infection. Viruses 2022, 14, 2575. [Google Scholar] [CrossRef] [PubMed]
- Mellor, J.D.; Brown, M.P.; Irving, H.R.; Zalcberg, J.R.; Dobrovic, A. A critical review of the role of Fc gamma receptor polymorphisms in the response to monoclonal antibodies in cancer. J. Hematol. Oncol. 2013, 6, 1. [Google Scholar] [CrossRef]
- BIOVIA Discovery Studio|Dassault Systèmes n.d. Available online: https://www.3ds.com/products/biovia/discovery-studio (accessed on 6 April 2025).
- Kaba, B.; Pinet, N.; Lelandais, G.; Sigayret, A.; Berry, A. Clustering Gene Expression Data Using Graph Separators. In Silico Biol. 2007, 7, 433–452. [Google Scholar] [CrossRef]
- Wu, G.; Robertson, D.H.; Brooks, C.L.; Vieth, M. Detailed analysis of grid-based molecular docking: A case study of CDOCKER—A CHARMm-based MD docking algorithm. J. Comput. Chem. 2003, 24, 1549–1562. [Google Scholar] [CrossRef]
- Brooks, B.R.; Brooks, C.L.; Mackerell, A.D.; Nilsson, L.; Petrella, R.J.; Roux, B.; Won, Y.; Archontis, G.; Bartels, C.; Boresch, S.; et al. CHARMM: The biomolecular simulation program. J. Comput. Chem. 2009, 30, 1545–1614. [Google Scholar] [CrossRef]
- Yang, J.; Roy, A.; Zhang, Y. Protein–ligand binding site recognition using complementary binding-specific substructure comparison and sequence profile alignment. Bioinformatics 2013, 29, 2588–2595. [Google Scholar] [CrossRef]
- Laskowski, R.A.; Jabłońska, J.; Pravda, L.; Vařeková, R.S.; Thornton, J.M. PDBsum: Structural summaries of PDB entries. Protein Sci. 2018, 27, 129–134. [Google Scholar] [CrossRef] [PubMed]
- Pino-Lagos, K.; Benson, M.J.; Noelle, R.J. Retinoic Acid in the Immune System. Ann. N. Y. Acad. Sci. 2008, 1143, 170–187. [Google Scholar] [CrossRef]
- Morita, T.; Miyakawa, K.; Jeremiah, S.S.; Yamaoka, Y.; Sada, M.; Kuniyoshi, T.; Yang, J.; Kimura, H.; Ryo, A. All-trans retinoic acid exhibits antiviral effect against SARS-CoV-2 by inhibiting 3CLpro activity. Viruses 2021, 13, 1669. [Google Scholar] [CrossRef]
- Prado, M.B.; Adiao, K.J.B. Methotrexate in generalized myasthenia gravis: A systematic review. Acta Neurol. Belg. 2023, 123, 1679–1691. [Google Scholar] [CrossRef] [PubMed]
- Chen, Y.T.; Chang, Y.H.; Pathak, N.; Tzou, S.C.; Luo, Y.C.; Hsu, Y.C.; Li, T.N.; Lee, J.Y.; Chen, Y.C.; Huang, Y.W.; et al. Methotrexate inhibition of SARS-CoV-2 entry, infection and inflammation revealed by bioinformatics approach and a hamster model. Front. Immunol. 2022, 13, 1080897. [Google Scholar] [CrossRef]
- Volpe, E.; Sambucci, M.; Battistini, L.; Borsellino, G. Fas-fas ligand: Checkpoint of t cell functions in multiple sclerosis. Front. Immunol. 2016, 7, 217466. [Google Scholar] [CrossRef]
- Coënon, L.; Villalba, M. From CD16a Biology to Antibody-Dependent Cell-Mediated Cytotoxicity Improvement. Front. Immunol. 2022, 13, 913215. [Google Scholar] [CrossRef] [PubMed]
- Nussinov, R.; Tsai, C.J. Allostery in disease and in drug discovery. Cell 2013, 153, 293–305. [Google Scholar] [CrossRef]
- Mobley, D.L.; Dill, K.A. Binding of Small-Molecule Ligands to Proteins: “What You See” Is Not Always “What You Get”. Structure 2009, 17, 489–498. [Google Scholar] [CrossRef]
- Henzler-Wildman, K.; Kern, D. Dynamic personalities of proteins. Nature 2007, 450, 964–972. [Google Scholar] [CrossRef]
- Hopkins, A.L.; Groom, C.R.; Alex, A. Ligand efficiency: A useful metric for lead selection. Drug Discov. Today 2004, 9, 430–431. [Google Scholar] [CrossRef]
- Cheng, A.C.; Coleman, R.G.; Smyth, K.T.; Cao, Q.; Soulard, P.; Caffrey, D.R.; Salzberg, A.C.; Huang, E.S. Structure-based maximal affinity model predicts small-molecule druggability. Nat. Biotechnol. 2007, 25, 71–75. [Google Scholar] [CrossRef] [PubMed]
- Shoichet, B.K.; Kobilka, B.K. Structure-based drug screening for G-protein-coupled receptors. Trends Pharmacol. Sci. 2012, 33, 268–272. [Google Scholar] [CrossRef] [PubMed]
- Naderi, M.; Lemoine, J.M.; Govindaraj, R.G.; Kana, O.Z.; Feinstein, W.P.; Brylinski, M. Binding site matching in rational drug design: Algorithms and applications. Brief. Bioinform. 2019, 20, 2167–2184. [Google Scholar] [CrossRef] [PubMed]
- Çınaroğlu, S.S.; Timuçin, E. Insights into an alternative benzofuran binding mode and novel scaffolds of polyketide synthase 13 inhibitors. J. Mol. Model. 2019, 25, 130. [Google Scholar] [CrossRef]
- Rai, H.; Barik, A.; Singh, Y.P.; Suresh, A.; Singh, L.; Singh, G.; Nayak, U.Y.; Dubey, V.K.; Modi, G. Molecular Docking, Binding Mode Analysis, Molecular Dynamics, and Prediction of ADMET/Toxicity Properties of Selective Potential Antiviral Agents against SARS-CoV-2 Main Protease: An Effort toward Drug Repurposing to Combat COVID-19. Mol. Divers. 2021, 25, 1905–1927. [Google Scholar] [CrossRef]
- Owliaee, I.; Khaledian, M.; Shojaeian, A.; Madanchi, H.; Yarani, R.; Boroujeni, A.K.; Shoushtari, M. Antimicrobial Peptides Against Arboviruses: Mechanisms, Challenges, and Future Directions. Probiotics Antimicrob. Proteins 2025. [Google Scholar] [CrossRef]
- Hamosh, A.; Scott, A.F.; Amberger, J.S.; Bocchini, C.A.; McKusick, V.A. Online Mendelian Inheritance in Man (OMIM), a knowledgebase of human genes and genetic disorders. Nucleic Acids Res. 2005, 33, D514–D517. [Google Scholar] [CrossRef]
- Darif, D.; Hammi, I.; Kihel, A.; El Idrissi Saik, I.; Guessous, F.; Akarid, K. The pro-inflammatory cytokines in COVID-19 pathogenesis: What goes wrong? Microb. Pathog. 2021, 153, 104799. [Google Scholar] [CrossRef]
- Kuleshov, M.V.; Jones, M.R.; Rouillard, A.D.; Fernandez, N.F.; Duan, Q.; Wang, Z.; Koplev, S.; Jenkins, S.L.; Jagodnik, K.M.; Lachmann, A.; et al. Enrichr: A comprehensive gene set enrichment analysis web server 2016 update. Nucleic Acids Res. 2016, 44, W90–W97. [Google Scholar] [CrossRef]
- Yoo, M.; Shin, J.; Kim, J.; Ryall, K.A.; Lee, K.; Lee, S.; Jeon, M.; Kang, J.; Tan, A.C. DSigDB: Drug signatures database for gene set analysis. Bioinformatics 2015, 31, 3069–3071. [Google Scholar] [CrossRef] [PubMed]
- Daina, A.; Michielin, O.; Zoete, V. SwissADME: A free web tool to evaluate pharmacokinetics, drug-likeness and medicinal chemistry friendliness of small molecules. Sci. Rep. 2017, 7, 42717. [Google Scholar] [CrossRef] [PubMed]
- Schwede, T.; Kopp, J.; Guex, N.; Peitsch, M.C. SWISS-MODEL: An automated protein homology-modeling server. Nucleic Acids Res. 2003, 31, 3381–3385. [Google Scholar] [CrossRef]
- Davis, A.P.; Grondin, C.J.; Johnson, R.J.; Sciaky, D.; Wiegers, J.; Wiegers, T.C.; Mattingly, C.J. Comparative Toxicogenomics Database (CTD): Update 2021. Nucleic Acids Res 2021, 49, D1138–D1143. [Google Scholar] [CrossRef]
- Apweiler, R.; Bairoch, A.; Bougueleret, L.; Altairac, S.; Amendolia, V.; Auchincloss, A.; Argoud-Puy, G.; Axelsen, K.; Baratin, D.; Blatter, M.C.; et al. The Universal Protein Resource (UniProt) 2009. Nucleic Acids Res. 2009, 37, D169–D174. [Google Scholar] [CrossRef]
- Dogan, B.; Gumusoglu, E.; Ulgen, E.; Sezerman, O.U.; Gunel, T. Integrated bioinformatics analysis of validated and circulating miRNAs in ovarian cancer. Genomics Inform. 2022, 20, e20. [Google Scholar] [CrossRef] [PubMed]
- Szklarczyk, D.; Kirsch, R.; Koutrouli, M.; Nastou, K.; Mehryary, F.; Hachilif, R.; Gable, A.L.; Fang, T.; Doncheva, N.T.; Pyysalo, S.; et al. The STRING database in 2023: Protein–protein association networks and functional enrichment analyses for any sequenced genome of interest. Nucleic Acids Res. 2023, 51, D638–D646. [Google Scholar] [CrossRef]
- Chin, C.H.; Chen, S.H.; Wu, H.H.; Ho, C.W.; Ko, M.T.; Lin, C.Y. cytoHubba: Identifying hub objects and sub-networks from complex interactome. BMC Syst. Biol. 2014, 8, S11. [Google Scholar] [CrossRef]
- Bader, G.D.; Hogue, C.W.V. An automated method for finding molecular complexes in large protein interaction networks. BMC Bioinform. 2003, 4, 2. [Google Scholar] [CrossRef]
- Sherman, B.T.; Hao, M.; Qiu, J.; Jiao, X.; Baseler, M.W.; Lane, H.C.; Imamichi, T.; Chang, W. DAVID: A web server for functional enrichment analysis and functional annotation of gene lists (2021 update). Nucleic Acids Res. 2022, 50, W216–W221. [Google Scholar] [CrossRef]
- Lex, A.; Gehlenborg, N.; Strobelt, H.; Vuillemot, R.; Pfister, H. UpSet: Visualization of intersecting sets. IEEE Trans. Vis. Comput. Graph. 2014, 20, 1983–1992. [Google Scholar] [CrossRef] [PubMed]
- Elkhalifa, A.E.O.; Al-Shammari, E.; Kuddus, M.; Adnan, M.; Sachidanandan, M.; Awadelkareem, A.M.; Qattan, M.Y.; Khan, M.I.; Abduljabbar, S.I.; Sarwar Baig, M.; et al. Structure-Based Multi-Targeted Molecular Docking and Dynamic Simulation of Soybean-Derived Isoflavone Genistin as a Potential Breast Cancer Signaling Proteins Inhibitor. Life 2023, 13, 1739. [Google Scholar] [CrossRef] [PubMed]
- Bhatt, R.; Wang, A.; Durrant, J.D. Teaching old docks new tricks with machine learning enhanced ensemble docking. Sci. Rep. 2024, 14, 20722. [Google Scholar] [CrossRef]
- Torres, P.H.M.; Sodero, A.C.R.; Jofily, P.; Silva, F.P., Jr. Key Topics in Molecular Docking for Drug Design. Int. J. Mol. Sci. 2019, 20, 4574. [Google Scholar] [CrossRef]
- Krishnan, A.; Kocab, A.J.; Zacks, D.N.; Marshak-Rothstein, A.; Gregory-Ksander, M. A small peptide antagonist of the Fas receptor inhibits neuroinflammation and prevents axon degeneration and retinal ganglion cell death in an inducible mouse model of glaucoma. J. Neuroinflam. 2019, 16, 184. [Google Scholar] [CrossRef]
- Jiang, V.C.; Liu, Y.; Jordan, A.; Leeming, A.; McIntosh, J.; Huang, S.; Zhang, R.; Cai, Q.; Chen, Z.; Li, Y.; et al. Targeting FcγRIIB by antagonistic antibody BI-1206 improves the efficacy of rituximab-based therapies in aggressive mantle cell lymphoma. J. Hematol. Oncol. 2022, 15, 42. [Google Scholar] [CrossRef] [PubMed]
- Kakutani, M.; Takeuchi, K.; Waga, I.; Iwamura, H.; Wakitani, K. JTE-607, a novel inflammatory cytokine synthesis inhibitor without immunosuppression, protects from endotoxin shock in mice. Inflamm. Res. 1999, 48, 461–468. [Google Scholar] [CrossRef]
- Perron, M.D.; Chowdhury, S.; Aubry, I.; Purisima, E.; Tremblay, M.L.; Uri Saragovi, H. Allosteric noncompetitive small molecule selective inhibitors of CD45 tyrosine phosphatase suppress T-cell receptor signals and inflammation in vivo. Mol. Pharmacol. 2014, 85, 553–563. [Google Scholar] [CrossRef]
- Goddard, T.D.; Huang, C.C.; Meng, E.C.; Pettersen, E.F.; Couch, G.S.; Morris, J.H.; Ferrin, T.E. UCSF ChimeraX: Meeting modern challenges in visualization and analysis. Protein Sci. 2018, 27, 14–25. [Google Scholar] [CrossRef]
- Pettersen, E.F.; Goddard, T.D.; Huang, C.C.; Meng, E.C.; Couch, G.S.; Croll, T.I.; Morris, J.H.; Ferrin, T.E. UCSF ChimeraX: Structure visualization for researchers, educators, and developers. Protein Sci. 2021, 30, 70–82. [Google Scholar] [CrossRef]
- O’Boyle, N.M.; Morley, C.; Hutchison, G.R. Pybel: A Python wrapper for the OpenBabel cheminformatics toolkit. Chem. Cent. J. 2008, 2, 5. [Google Scholar] [CrossRef] [PubMed]
- Vázquez-Jiménez, L.K.; Juárez-Saldivar, A.; Gómez-Escobedo, R.; Delgado-Maldonado, T.; Méndez-Álvarez, D.; Palos, I.; Bandyopadhyay, D.; Gaona-Lopez, C.; Ortiz-Pérez, E.; Nogueda-Torres, B.; et al. Ligand-Based Virtual Screening and Molecular Docking of Benzimidazoles as Potential Inhibitors of Triosephosphate Isomerase Identified New Trypanocidal Agents. Int. J. Mol. Sci. 2022, 23, 10047. [Google Scholar] [CrossRef]
- Al Noman, A.; Dev Sharma, P.; Jahin Mim, T.; Al Azad, M.; Sharma, H. Molecular docking and ADMET analysis of coenzyme Q10 as a potential therapeutic agent for Alzheimer’s disease. Aging Pathobiol. Ther. 2024, 6, 170–182. [Google Scholar] [CrossRef]
- Srinivasan, S.; Sadasivam, S.K.; Gunalan, S.; Shanmugam, G.; Kothandan, G. Application of docking and active site analysis for enzyme linked biodegradation of textile dyes. Environ. Pollut. 2019, 248, 599–608. [Google Scholar] [CrossRef] [PubMed]
- Naveed, M.; Salah Ud Din, M.; Aziz, T.; Javed, T.; Miraj Khan, S.; Naveed, R.; Ali Khan, A.; Alharbi, M. Comparative analysis among the degradation potential of enzymes obtained from Escherichia coli against the toxicity of sulfur dyes through molecular docking. Z. Naturforschung 2024, 79, 221–234. [Google Scholar] [CrossRef]
- Wang, S.; Jiang, J.H.; Li, R.Y.; Deng, P. Docking-based virtual screening of TβR1 inhibitors: Evaluation of pose prediction and scoring functions. BMC Chem. 2020, 14, 52. [Google Scholar] [CrossRef] [PubMed]
- Alhawarri, M.B.; Dianita, R.; Rawa, M.S.A.; Nogawa, T.; Wahab, H.A. Potential Anti-Cholinesterase Activity of Bioactive Compounds Extracted from Cassia grandis L.f. and Cassia timoriensis DC. Plants 2023, 12, 344. [Google Scholar] [CrossRef]
- Grünberg, R.; Nilges, M.; Leckner, J. Flexibility and Conformational Entropy in Protein-Protein Binding. Structure 2006, 14, 683–693. [Google Scholar] [CrossRef]
- Spassov, D.S. Binding Affinity Determination in Drug Design: Insights from Lock and Key, Induced Fit, Conformational Selection, and Inhibitor Trapping Models. Int. J. Mol. Sci. 2024, 25, 7124. [Google Scholar] [CrossRef]
- Kim, T.; Zhen, J.; Lee, J.; Bauer, R.; Lee, C.; Kwon, B.O.; Chae, K.H.; Hong, S.; Giesy, J.P.; Chang, G.S.; et al. Influence of ligand’s directional configuration, chrysenes as model compounds, on the binding activity with aryl hydrocarbon receptor. Sci. Rep. 2020, 10, 13821. [Google Scholar] [CrossRef]
- Grosdidier, A.; Zoete, V.; Michielin, O. SwissDock, a protein-small molecule docking web service based on EADock DSS. Nucleic Acids Res. 2011, 39, W270–W277. [Google Scholar] [CrossRef] [PubMed]
- Bugnon, M.; Röhrig, U.F.; Goullieux, M.; Perez, M.A.S.; Daina, A.; Michielin, O.; Zoete, V. SwissDock 2024: Major enhancements for small-molecule docking with Attracting Cavities and AutoDock Vina. Nucleic Acids Res. 2024, 52, W324–W332. [Google Scholar] [CrossRef] [PubMed]


| Name | Weight | H-Bond Acceptor | H-Bond Donor | TPSA | MlogP |
|---|---|---|---|---|---|
| 3-Azido-3-deoxythymidine | 267.24 g/mol | 7 | 2 | 134.07 | −1.25 |
| Retinoic Acid | 300.44 g/mol | 2 | 1 | 37.30 | - |
| Methotrexate | 454.44 g/mol | 9 | 5 | 210.54 | −1.13 |
| Deptropine | 333.47 g/mol | 2 | 0 | 12.47 | −4.12 |
| Acetohexamide | 324.40 g/mol | 4 | 2 | 100.72 | 1.12 |
| Color | MCODE | GO | Description | log10(p) |
|---|---|---|---|---|
| Red | MCODE_1 | R-HSA-2029480 | Fc-gamma receptor (FCGR)-dependent phagocytosis | −17.9 |
| Red | MCODE_1 | R-HSA-2029481 | FCGR activation | −17.3 |
| Red | MCODE_1 | GO:0038094 | Fc-gamma receptor signaling pathway | −16.3 |
| Blue | MCODE_2 | hsa05235 | PD-L1 expression and PD-1 checkpoint pathway in cancer | −11.9 |
| Blue | MCODE_2 | WP4255 | Non-small cell lung cancer | −9.4 |
| Blue | MCODE_2 | hsa05223 | Non-small cell lung cancer | −9.3 |
| Green | MCODE_3 | R-HSA-3700989 | Transcriptional regulation by TP53 | −6.9 |
| Green | MCODE_3 | R-HSA-9700026 | Signaling by ALK in cancer | −6.7 |
| Green | MCODE_3 | R-HSA-9725370 | Signaling by ALK fusions and activated point mutants | −6.7 |
| Compound Name and CID | Protein Name and Binding Affinity | |||||||
|---|---|---|---|---|---|---|---|---|
| PyRx | SwissDock | PyRx | SwissDock | PyRx | SwissDock | PyRx | SwissDock | |
| IL10 | FASLG | PTPRC | FCGR3A | |||||
| Acetohexamide, CID: 1989 | −7.3 kcal/mol | −7.3 kcal/mol | −6.5 kcal/mol | −6.8 kcal/mol | −7.3 kcal/mol | −7.1 kcal/mol | −6.7 kcal/mol | −7.0 kcal/mol |
| Deptropine, CID: 203911 | −8.3 kcal/mol | −7.0 kcal/mol | −7.4 kcal/mol | −6.9 kcal/mol | −7.0 kcal/mol | −6.4 kcal/mol | −7.1 kcal/mol | −6.8 kcal/mol |
| Methotrexate, CID: 126941 | −6.8 kcal/mol | −7.8 kcal/mol | −7.4 kcal/mol | −7.4 kcal/mol | −7.7 kcal/mol | −7.4 kcal/mol | −6.7 kcal/mol | −8.1 kcal/mol |
| Retinoic Acid, CID: 449171 | −8.1 kcal/mol | −7.4 kcal/mol | −6.7 kcal/mol | −7.1 kcal/mol | −6.3 kcal/mol | −7.1 kcal/mol | −5.8 kcal/mol | −6.9 kcal/mol |
| 3-Azido-3-deoxythymidine, CID: 5726 | −5.3 kcal/mol | −6.8 kcal/mol | −5.7 kcal/mol | −6.8 kcal/mol | −5.6 kcal/mol | −6.8 kcal/mol | −5.1 kcal/mol | −6.7 kcal/mol |
| Compound Name and CID | Protein Name | Interaction Between Protein and Compound | Binding Affinity |
|---|---|---|---|
| 2-(4-Acetylanilino)-3-chloronaphthoquinone; CID: 781109 | PTPRC | PTPRC + 2-(4-Acetylanilino)-3-chloronaphthoquinone | −7.3 kcal/mol |
| JTE-607; CID: 9938544 | IL10 | IL10 + JTE-607 | −6.7 kcal/mol |
| BI-1206; CID: 170872117 | FCGR3A | FCGR3A + BI-1206 | −6.5 kcal/mol |
| ONL1204; CID: 122677428 | FASLG | FASLG + ONL1204 | −7.7 kcal/mol |
Disclaimer/Publisher’s Note: The statements, opinions and data contained in all publications are solely those of the individual author(s) and contributor(s) and not of MDPI and/or the editor(s). MDPI and/or the editor(s) disclaim responsibility for any injury to people or property resulting from any ideas, methods, instructions or products referred to in the content. |
© 2025 by the authors. Licensee MDPI, Basel, Switzerland. This article is an open access article distributed under the terms and conditions of the Creative Commons Attribution (CC BY) license (https://creativecommons.org/licenses/by/4.0/).
Share and Cite
Dev Sharma, P.; Alhudhaibi, A.M.; Al Noman, A.; Abdallah, E.M.; Taha, T.H.; Sharma, H. Systems Biology-Driven Discovery of Host-Targeted Therapeutics for Oropouche Virus: Integrating Network Pharmacology, Molecular Docking, and Drug Repurposing. Pharmaceuticals 2025, 18, 613. https://doi.org/10.3390/ph18050613
Dev Sharma P, Alhudhaibi AM, Al Noman A, Abdallah EM, Taha TH, Sharma H. Systems Biology-Driven Discovery of Host-Targeted Therapeutics for Oropouche Virus: Integrating Network Pharmacology, Molecular Docking, and Drug Repurposing. Pharmaceuticals. 2025; 18(5):613. https://doi.org/10.3390/ph18050613
Chicago/Turabian StyleDev Sharma, Pranab, Abdulrahman Mohammed Alhudhaibi, Abdullah Al Noman, Emad M. Abdallah, Tarek H. Taha, and Himanshu Sharma. 2025. "Systems Biology-Driven Discovery of Host-Targeted Therapeutics for Oropouche Virus: Integrating Network Pharmacology, Molecular Docking, and Drug Repurposing" Pharmaceuticals 18, no. 5: 613. https://doi.org/10.3390/ph18050613
APA StyleDev Sharma, P., Alhudhaibi, A. M., Al Noman, A., Abdallah, E. M., Taha, T. H., & Sharma, H. (2025). Systems Biology-Driven Discovery of Host-Targeted Therapeutics for Oropouche Virus: Integrating Network Pharmacology, Molecular Docking, and Drug Repurposing. Pharmaceuticals, 18(5), 613. https://doi.org/10.3390/ph18050613