


Abstract
Background/Objectives: LC–MS/MS-based Multi-Attribute Method (MAM) workflows are increasingly used to characterize biotherapeutic proteins using peptide mapping and site-specific monitoring of critical quality attributes (CQAs). Sample preparation can impact foulant carryover, digestion efficiency, host cell protein (HCP) detection, and can induce artifactual chemical modifications. Herein, we compared a published National Institute for Bioprocessing Research and Training (NIBRT) MAM workflow with the S-Trap™ MAM Kit using NISTmAb RM 8671 with and without foulants. Methods: Both bottom-up workflows used tryptic digestion, performed in solution for NIBRT and on-trap for the S-Trap™ MAM Kit. Matched samples were prepared with or without added foulants from a panel of 42 bioprocess-relevant contaminants including salts, buffers, surfactants, stabilizers, and excipients. LC–MS/MS analysis compared peptide-mapping performance, foulant carryover, sequence coverage, HCP detection and background signals, as well as preparation-induced modifications, in particular deamidation. Protein recovery and complementary Tryp-N™ digestion were also evaluated. Results: Compared with the NIBRT workflow, the S-Trap™ MAM Kit had higher NISTmAb protein recovery (92.3% versus 48.4%); both workflows yielded full sequence coverage given matched peptide input. The S-Trap™ workflow produced greater total LC–MS signal from non-product proteins like HCPs. Under the conditions evaluated, signals corresponding to polysorbate-80, Brij-35, PEG-8000 and other contaminants were not detected following S-Trap™ preparation. Lower measured deamidation at the evaluated NISTmAb sites was observed using the kit and Tryp-N™ provided complementary peptide-mapping coverage. Conclusions: The S-Trap™ MAM Kit offers several advantages for NISTmAb sample preparation: higher recovery, greater LC-MS signal from non-product proteins like HCPs, lower overall deamidation, and no detectable signals from the examined surfactant and polymer foulants under the conditions evaluated. The standardized, plate-based workflow offers a promising approach for biotherapeutic MAM sample preparation. Broader applicability and suitability for use in quality-control require further product-specific qualification or validation. Data are available via ProteomeXchange with identifier PXD086642.
1. Introduction
Monoclonal antibodies (mAbs) are the largest class of biotherapeutics, with broad biotechnological and clinical applications in oncology, inflammatory and immune-mediated diseases, infectious diseases, and targeted therapeutic delivery. In oncology, mAbs are widely used as targeted therapeutics because of their high specificity, affinity, prolonged serum half-life, and ability to engage immune effector functions [1]. Antibody engineering has further expanded mAb application with antibody-drug conjugates for selective delivery of cytotoxic payloads to tumors [2], and bispecific antibodies to simultaneously engage multiple therapeutic targets or immune-cell pathways [3]. Monoclonal antibody-based biologics can also modulate inflammatory signaling, including TNF-targeted therapies for inflammatory and rheumatic diseases [4], and have application in infectious disease, directly targeting pathogens or their toxins [5]. The first monoclonal antibody (mAb), muromonab-CD3, was approved by the United States Food and Drug Administration (FDA) in 1986 to treat acute renal allograft rejection. In 2021, dostarlimab-gxly (Jemperli), an anti-PD-1 monoclonal antibody initially approved for mismatch repair-deficient recurrent or advanced endometrial cancer, became the 100th FDA-approved monoclonal antibody product [6]. By the end of 2024, 159 antibody-based biologics had received FDA approval, including IgG-based antibodies, antibody fragments, Fc-fusion or Fc-based proteins, antibody-drug conjugates, and bispecific antibodies [7]. Fifteen antibody-based biologics were approved in 2024 alone, representing approximately 32% of the 47 new molecular entities approved that year [7]. This broader antibody-based category included engineered molecules such as sotatercept-csrk (Winrevair), an activin receptor type IIA-Fc fusion protein used in pulmonary arterial hypertension [8], and nogapendekin alfa inbakicept-pmln (Anktiva), an IL-15-based immunocytokine complex developed for BCG-unresponsive non-muscle-invasive bladder cancer [9]. Such engineered biologics necessitate robust, high-throughput analytical characterization [10]. The multi-attribute method (MAM) applies high-resolution mass spectrometry to the analysis of biologics. MAM enables the simultaneous analysis of multiple critical quality attributes (CQAs), significantly reducing the need for multiple orthogonal assays [11,12,13,14]. Monitored CQAs can include, among others, sequence variants, drug antibody conjugation ratios (DARs) and post-translational modifications such as glycosylation, oxidation and deamidation, as well as host cell protein (HCP) burden; each is important for ensuring the safety, efficacy and stability of biopharmaceutical products [13,15,16,17]. Consolidating these measurements into a single workflow can substantially improve quality control (QC) processes [11,12,13,14].
Traditionally, bespoke MAM protocols have been developed and validated separately for each individual biologic. Although effective, this approach is time-consuming, slows method transfer and results in disparate, product-specific implementation and quality control procedures. Recent studies have emphasized that broader implementation of MAM requires robust, reproducible, and standardized analytical workflows suitable for routine quality-control environments [14,18]. Sample-preparation variability and preparation-induced artifacts can directly affect measured product quality attributes [19,20]; broader adoption of MAM therefore requires tightly controlled and reproducible sample-preparation workflows that maintain its analytical advantages while minimizing and standardizing both method development and routine application. Standardized sample-preparation approaches can reduce procedural variation during MAM development. The S-Trap™ MAM Kit is a plate-based sample-preparation workflow designed to support detergent-assisted denaturation, protein trapping, washing, and on-trap digestion. In the present study, its performance was evaluated with NISTmAb RM 8671, with and without selected added formulation- and process-related foulants. Such a general-purpose workflow must be compatible with diverse sample matrices, efficiently remove foulants at all stages of biologic manufacturing, minimize preparation-induced artifacts, and provide highly reproducible sample preparation. To address this need, we developed the S-Trap™ MAM Kit as a standardized, automation-compatible sample-preparation platform intended for use across biotherapeutic manufacturing stages, from raw bioreactor harvests to final drug products.
The S-Trap™ MAM workflow begins with protein solubilization and denaturation in a sodium dodecyl sulfate (SDS)-containing solution, followed by reduction, alkylation, protein trapping, and washing to remove detergents and other potentially interfering sample components. Proteolytic digestion is subsequently performed on-trap under defined conditions, providing a standardized approach to peptide generation for LC–MS/MS analysis. The workflow incorporates controlled preparation steps intended to limit sample-handling variability and preparation-induced chemical modifications, including deamidation. Its 96-well plate format also supports integration with automated liquid-handling systems, offering a practical framework for streamlined MAM sample preparation.
In this study, using NISTmAb RM 8671, we compared the ProtiFi S-Trap™ MAM Kit with a well-established in-solution tryptic digestion protocol developed by the National Institute for Bioprocessing Research and Training (NIBRT), which uses Bio-Spin P-6 size exclusion buffer exchange. Comparative analyses were performed both in the absence and presence of 42 formulation-relevant foulants including excipients, salts, surfactants, stabilizers, detergents, flocculants, precipitants and process related contaminants. Performance was evaluated at both the sequence coverage and CQA levels to determine foulant tolerance, processing stability, and artifactual processing-induced chemical changes like deamidation. We also evaluated Tryp-N™ digestion as a complementary approach to trypsin [21] for improving NISTmAb sequence coverage under the conditions examined.
2. Results
2.1. Comparison of NISTmAb Peptide Modifications Between Sample Preparation Workflows
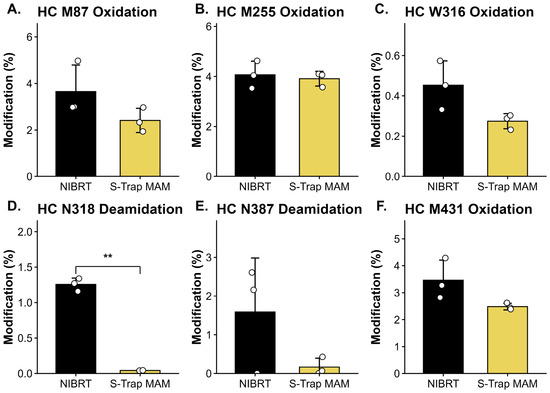
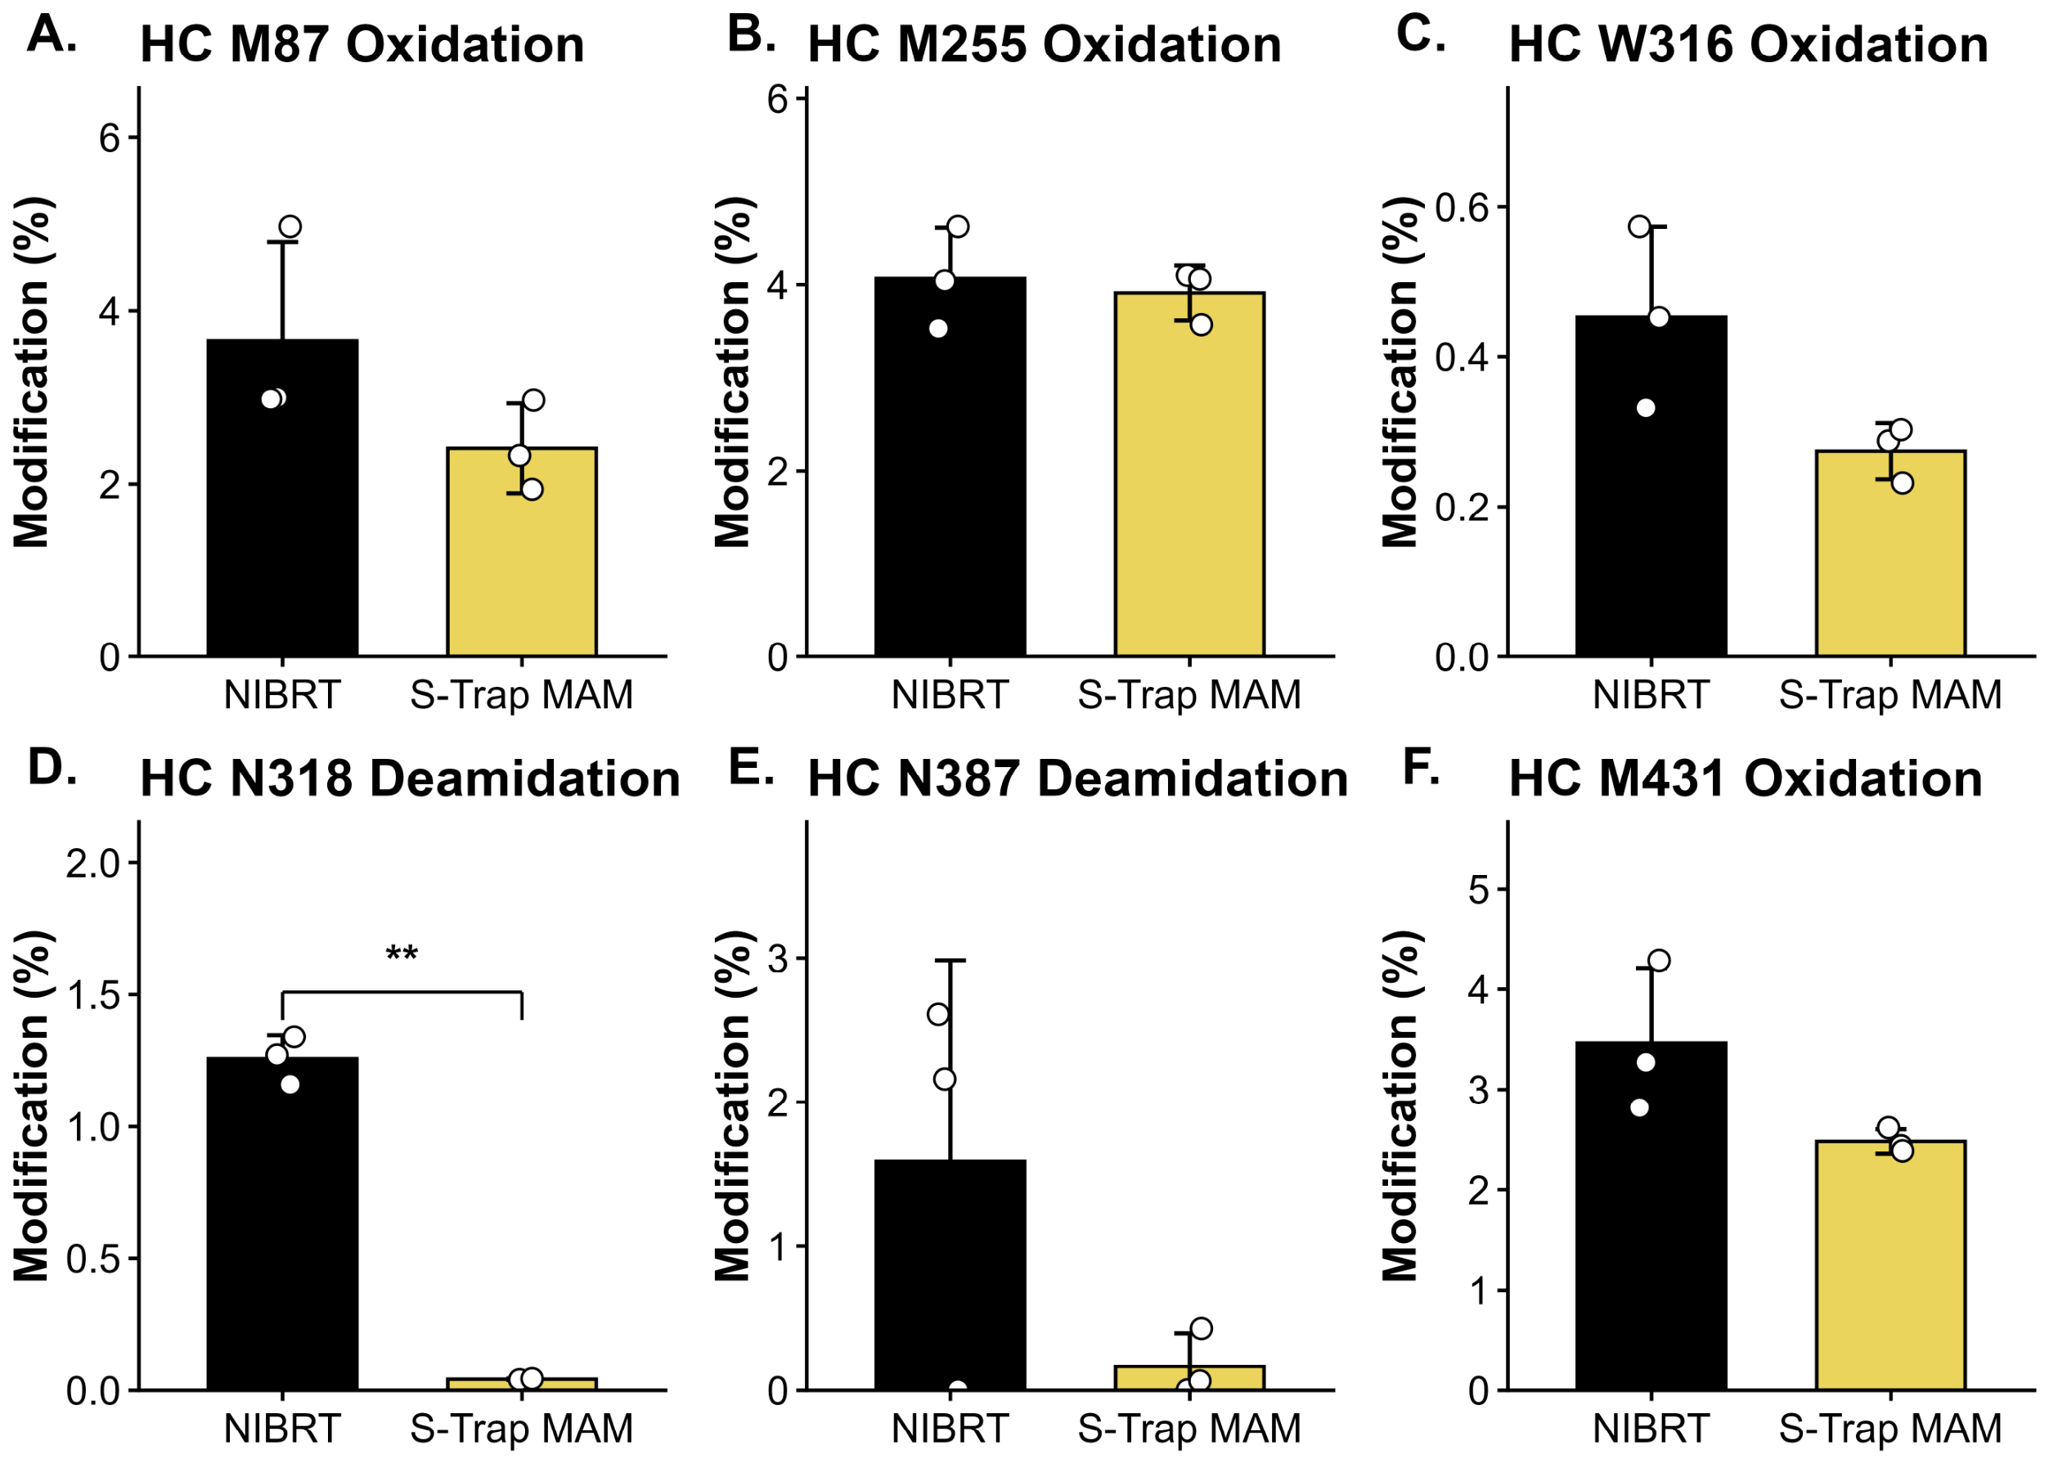
NISTmAb samples were processed using the NIBRT and S-Trap™ MAM workflows, and peptide-level post-translational modifications (PTMs) and sequence coverage were assessed using Byos (Protein Metrics). Both workflows achieved 100% heavy- and light-chain sequence coverage (Figure S1). Six consistently detected and quantified heavy-chain modification sites, representing common, chemically distinct monoclonal antibody modifications, were selected for focused critical quality attribute (CQA) comparison: methionine oxidation (M87, M255, and M431), tryptophan oxidation (W316), and asparagine deamidation (N318 and N387) (Figure 1).
Figure 1.
Selected peptide-level critical quality attributes measured following NIBRT and S-Trap™ MAM sample preparation. Residue-specific peptide-level critical quality attributes (CQAs) influenced by sample preparation were evaluated. Representative heavy-chain modifications are shown for M87 oxidation (A), M255 oxidation (B), W316 oxidation (C), N318 deamidation (D), N387 deamidation (E), and M431 oxidation (F). NIBRT and S-Trap™ MAM values were measured in triplicate and identified using the PTM workflow in Byos. Bars represent mean values, error bars represent standard deviation, and individual points represent replicate measurements. Statistical comparisons between NIBRT and S-Trap™ MAM were performed independently for each modification site using two-sided unpaired Welch’s t-tests. Significance was defined as p < 0.05 and is indicated as ** p < 0.01.
Mean modification levels were lower with S-Trap™ MAM at all six sites. The most pronounced relative reduction occurred at N318 deamidation, decreasing from 1.3% with NIBRT to <0.1% with S-Trap™ MAM (Figure 1D and Figure S5). N387 deamidation (tryptic peptide GFYPSDIAVEWESNGQPENNYK) also decreased substantially (1.6% vs. 0.2%; Figure 1E and Figure S6). Smaller reductions were observed for M87 oxidation (3.7% vs. 2.4%), W316 oxidation (0.5% vs. 0.3%), and M431 oxidation (3.5% vs. 2.5%), whereas levels of M255 oxidation were comparable (4.1% vs. 3.9%). These results demonstrate site-specific differences in modification levels between preparation workflows.
Cysteine-capping efficiency was also evaluated (Figure S3). Compared with NIBRT, S-Trap™ MAM yielded significantly lower uncapped cysteine levels at heavy-chain C22, C147, C203, C223, C264, C370 and C428, and light-chain C23, C133 and C193 (approximately 0–17% versus 2–25%, respectively). Uncapped light-chain C87 was not detected with S-Trap™ MAM, compared with approximately 14% for NIBRT. Light-chain C213 showed a similar trend (16% versus 28%), although the difference was not statistically significant. Two heavy-chain sites deviated from this pattern: C232 was comparable (12% versus 10% uncapped), whereas C324 showed substantially higher levels with S-Trap™ MAM (22% versus <1%). These site-specific differences may reflect variations in denaturation conditions, reduction and cysteine-derivatization reagents (tris(2-carboxyethyl)phosphine (TCEP) and methyl methanethiosulfonate (MMTS) versus dithiothreitol (DTT) and iodoacetic acid (IAA)), and digestion conditions. The simultaneous alteration of multiple parameters precludes determination of their individual effects.
Additionally, dethiomethylation of heavy-chain M255 (loss of the methionine methylthio group, –SCH3) was detected at 0.5–0.6% in NIBRT samples prepared with iodoacetic acid (IAA) but was not detected with S-Trap™ MAM (Figure S2). This modification has previously been associated with iodine-containing reagents [22].
S-Trap™ MAM preparation showed lower percentages of uncapped species at most examined cysteine sites, similar levels at C232, and higher levels at C324. Because the workflows differ in multiple ways, the exact effect of any preparation step in isolation cannot be established. Site-specific chemical environments may also contribute.
2.2. Comparison of Surfactant and Polymer Foulant Carryover Between Sample Preparation Workflows
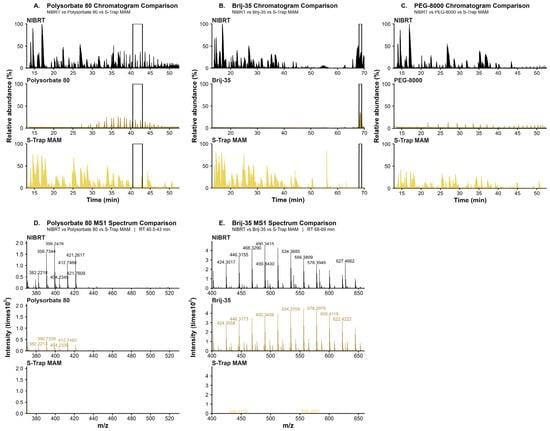
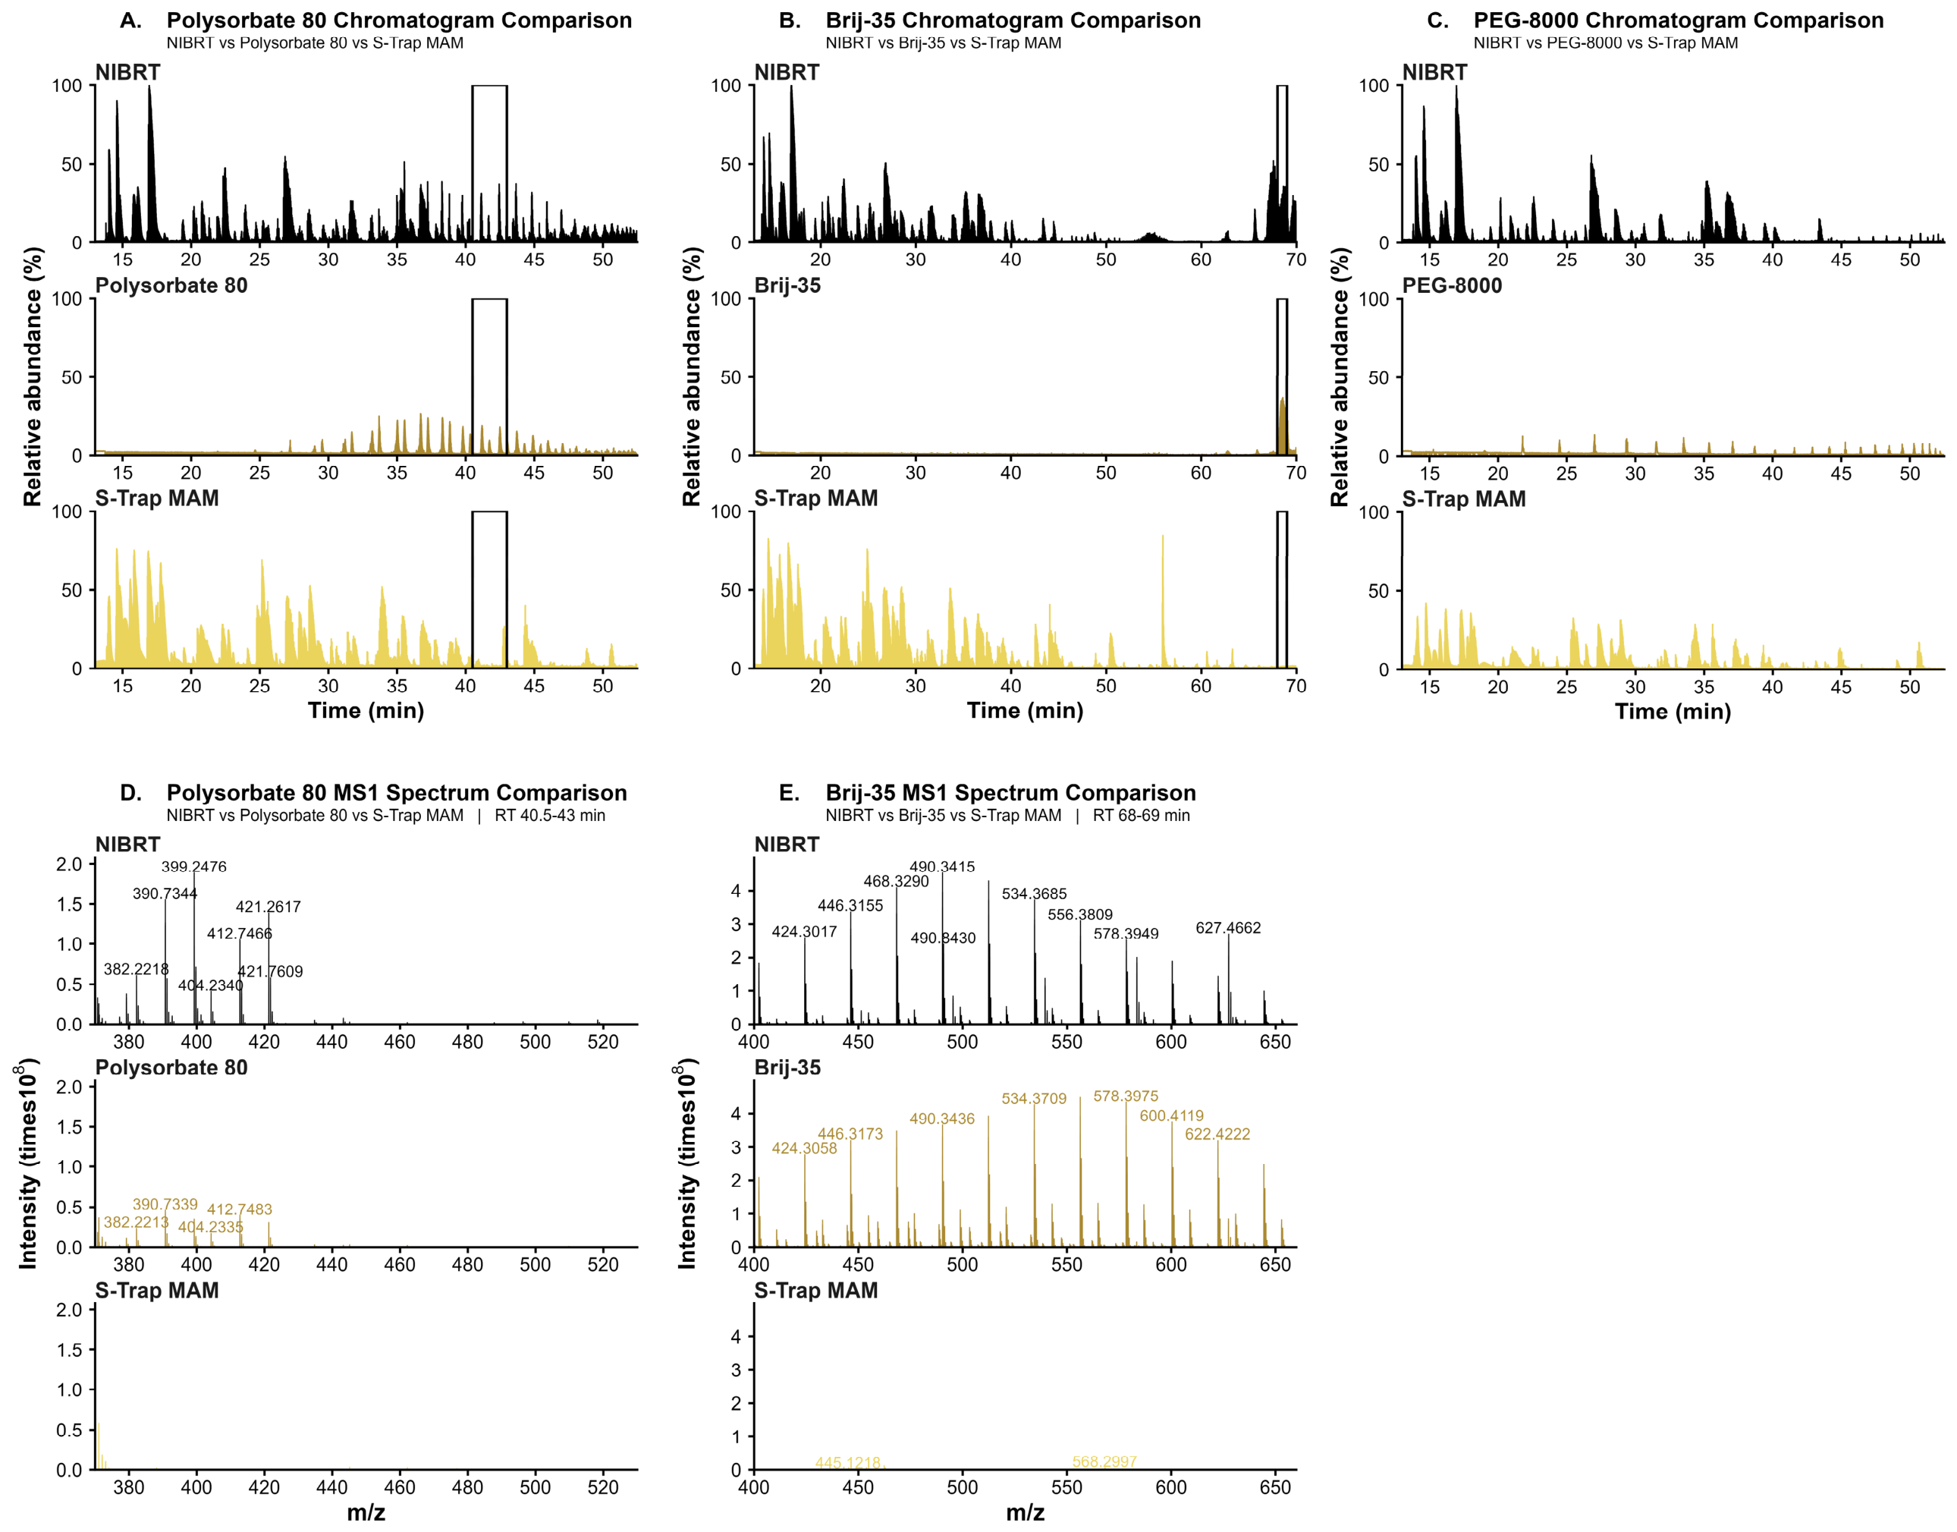
To evaluate the removal of formulation- and process-derived foulants, processed samples containing a panel of foulants in combination groups (Table S1) were analyzed by LC-MS/MS. Polysorbate-80 (Figure 2A,D), Brij-35 (Figure 2B,E), and PEG-8000 (Figure 2C) generated distinct MS1 features that were quantified by MS1 base peak intensities (BPI). Consistent with the performance of desalting columns being dependent on the molecular weight of foulants or their micelles, the NIBRT protocol was unable to fully remove all three foulants. Co-elution of such components with sample peptides can impact quantification through ion suppression, changes to chromatographic separation and retention time shifts, among other mechanisms. Under the LC–MS/MS conditions evaluated, no signals from the examined surfactant and polymer foulants were detected following S-Trap™ MAM preparation, in contrast to the NIBRT workflow. These findings are consistent with efficient foulant removal by S-Trap™ MAM; the exact level of removal was not quantified.
Figure 2.
Comparison of detectable surfactant and polymer foulant signals following NIBRT and S-Trap™ MAM sample preparation. Normalized base peak intensity (BPI) chromatograms are shown for polysorbate-80 (A), Brij-35 (B), and PEG-8000 (C), with foulant-only references shown in the middle panels and samples processed using NIBRT (top) and the S-Trap™ MAM Kit (bottom). Corresponding representative MS1 spectra are shown for polysorbate-80 (D) and Brij-35 (E). Each workflow/foulant condition was prepared in triplicate (n = 3 independent sample preparations per condition). The chromatograms and spectra shown are from a single representative replicate; concordant profiles were observed across the remaining replicates. Spectral intensities are shown as raw intensity. Under the LC–MS/MS conditions evaluated, signals corresponding to polysorbate-80, Brij-35, and PEG-8000 were not detected following S-Trap™ MAM sample preparation, in contrast to the detectable signals observed following the NIBRT workflow.
2.3. Recovery of NISTmAb and HCPs
To assess the impact of sample preparation methodology on NISTmAb recovery and non-product protein detection, NISTmAb samples were prepared using both workflows and analyzed by LC-MS/MS. Peptide and protein identifications were obtained using a database containing NISTmAb and mouse proteome sequences in Byos (Protein Metrics). Protein recovery measured by Bicinchoninic Acid (BCA) assay was 92.3% of input protein for the S-Trap™ MAM workflow compared with 48.4% for the NIBRT workflow (Figure S4). Peptide injection amounts were subsequently matched between workflows for LC-MS/MS analyses.
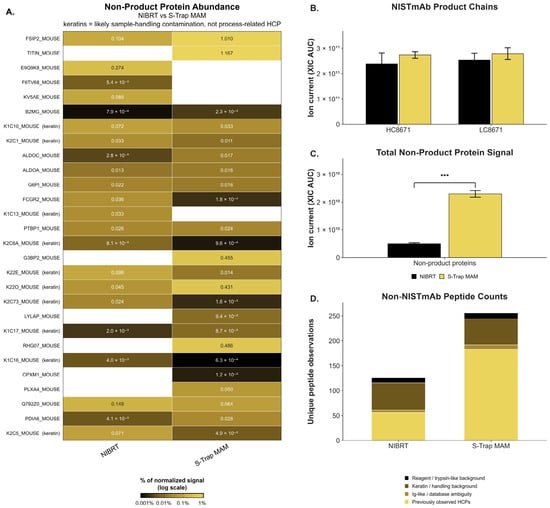
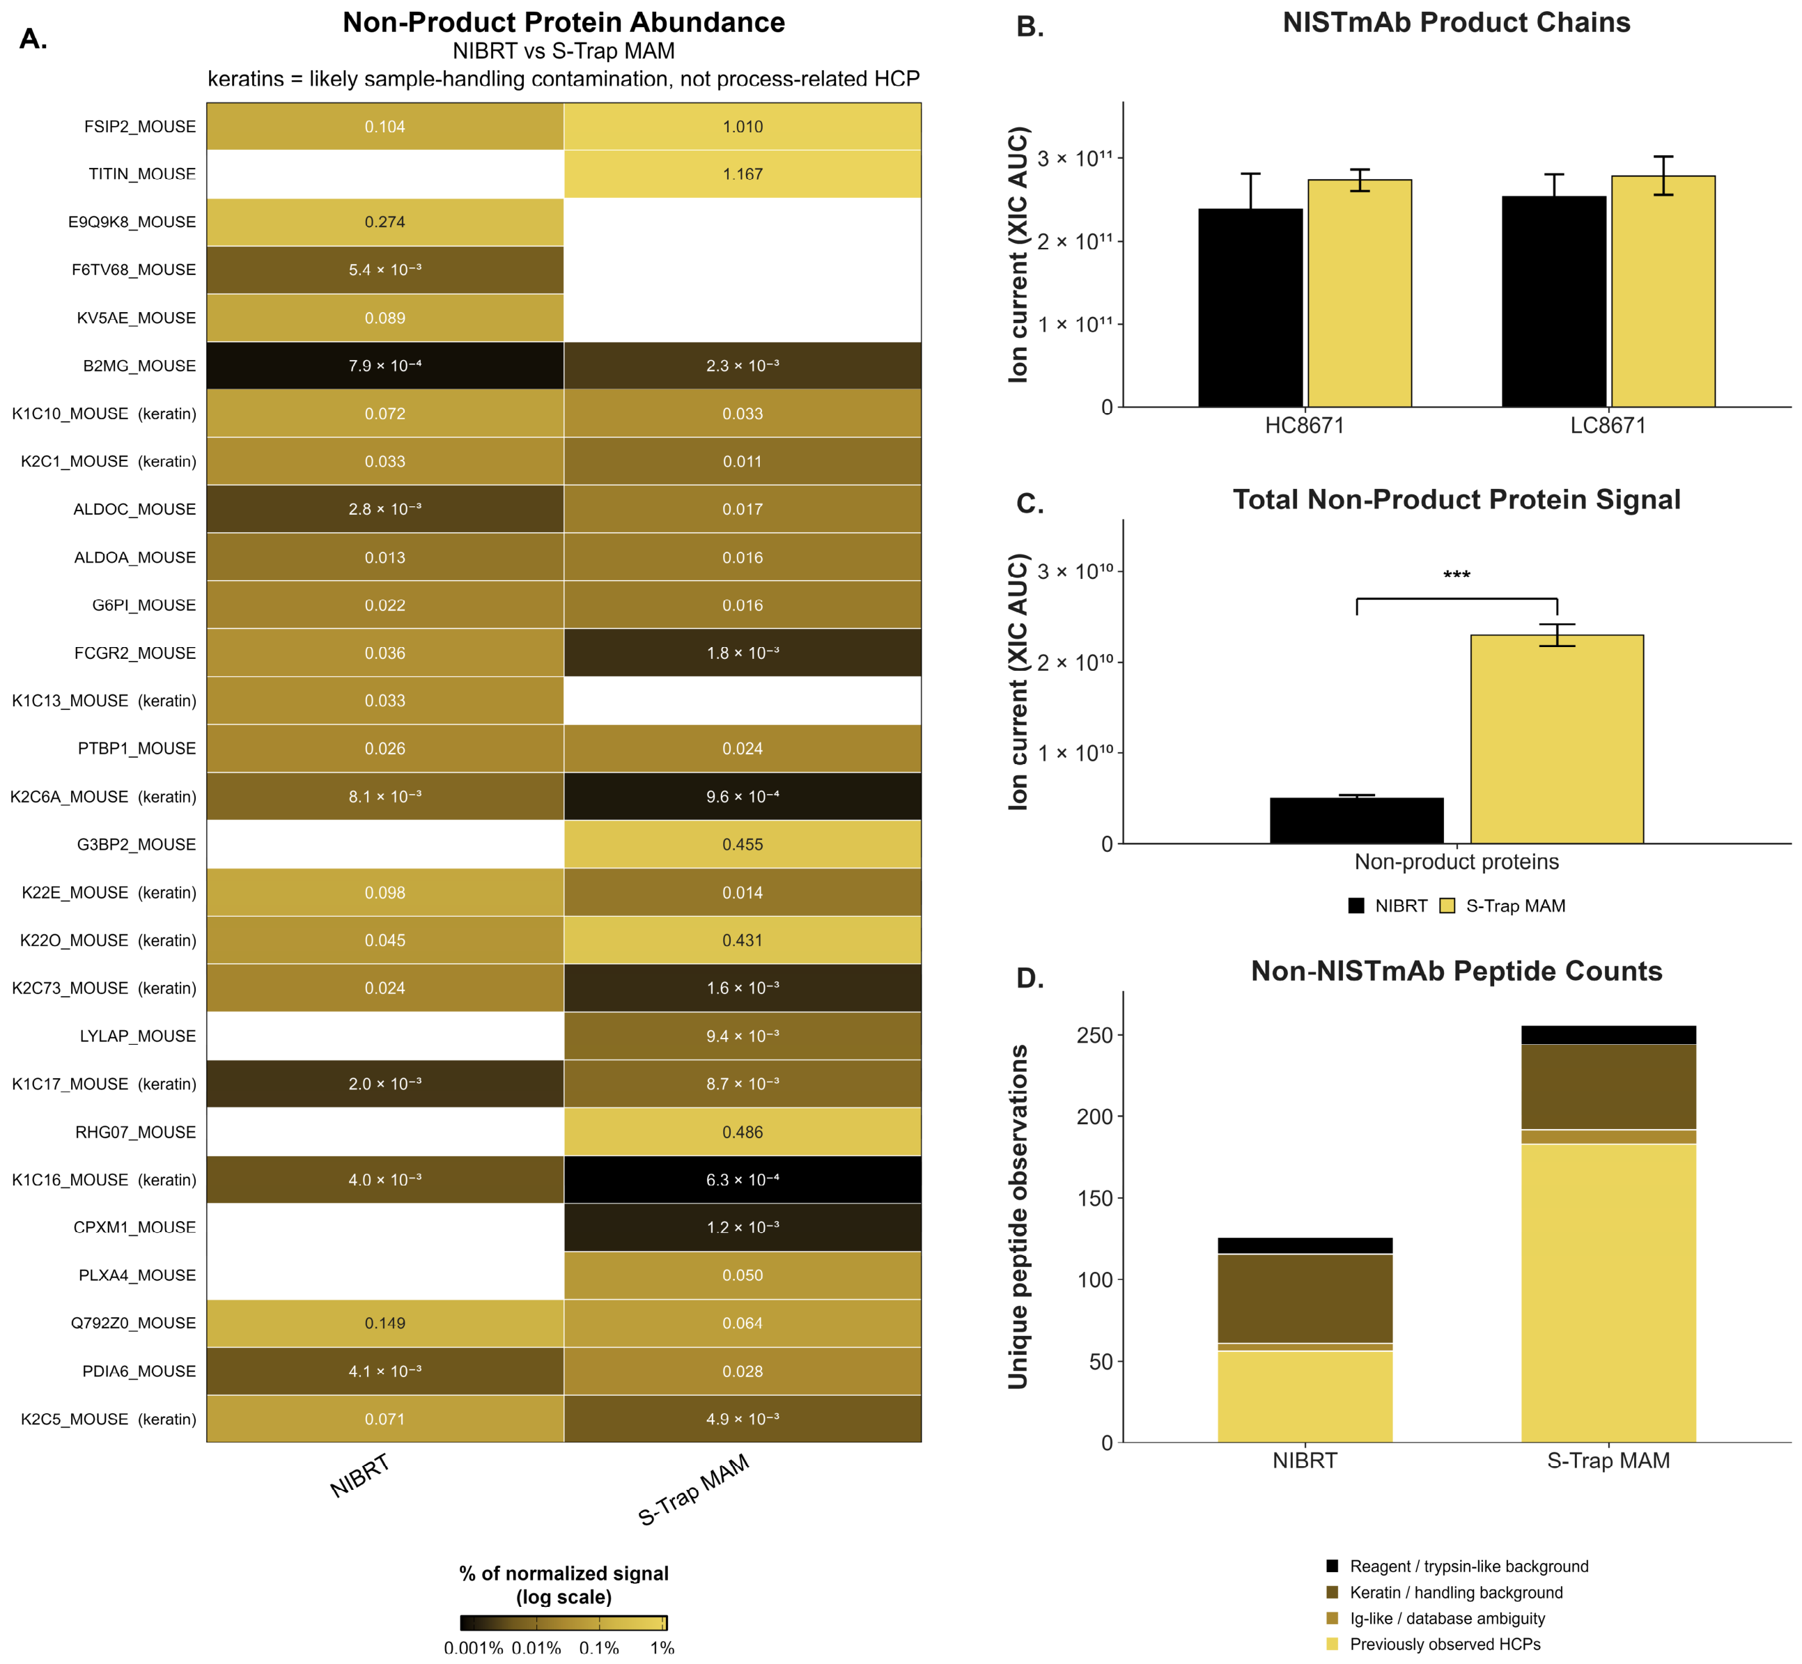
Non-product protein detection varied by workflow: with matched amount of input peptide, some proteins were detected exclusively or at higher abundance with S-Trap™ MAM and others with NIBRT (Figure 3A). Summed XIC peak areas for NISTmAb heavy and light chains were similar, with modestly higher mean signals for S-Trap™ MAM (Figure 3B). However, the summed protein-level XIC area under the curve (AUC) across non-NISTmAb protein entries in the selected samples was significantly higher with S-Trap™ MAM (Figure 3C).
Figure 3.
Comparison of NISTmAb product and non-product protein detection following S-Trap™ MAM and NIBRT sample preparation. (A) Relative abundance of non-product proteins in the normalized protein-abundance output, expressed as percent normalized signal on a logarithmic scale. Values represent mean normalized signals from three independent preparations per workflow (n = 3). (B) Summed extracted ion chromatogram (XIC) peak areas of NISTmAb heavy-chain (HC) and light-chain (LC) peptides. (C) Total non-product protein signal per sample, calculated as the summed XIC area under the curve (AUC) across 48 non-NISTmAb protein entries detected in at least one of the six selected samples. For panels B and C, bars represent means and error bars indicate standard deviations (SD) from three independent preparations per workflow (n = 3). (D) Charge-state-deduplicated non-NISTmAb peptide observations from the peptide-level output, classified as expected host-cell proteins (HCPs), immunoglobulin-like or database-ambiguous assignments, keratin/handling background, or reagent/trypsin-like background. Observations were pooled from three S-Trap™ MAM and two NIBRT samples and evaluated descriptively. Only statistically significant comparisons are annotated (*** p < 0.001).
At the peptide level, 256 charge-state-deduplicated non-NISTmAb peptide observations were identified in the pooled S-Trap™ MAM peptide-level output compared with 126 in the pooled NIBRT output (Figure 3D). These observations were categorized as expected HCPs, Ig-like or database-ambiguous assignments, keratin/handling background, or reagent/trypsin-like background. Because Panel D summarizes pooled peptide observations from three S-Trap™ MAM samples and two NIBRT samples, these counts were evaluated descriptively rather than as an inferential comparison of peptide-detection efficiency between workflows. Overall, the S-Trap™ MAM workflow produced higher protein recovery and greater summed non-product protein signal under the conditions evaluated.
2.4. Tryp-N™ Digestion Improves NISTmAb Sequence Coverage
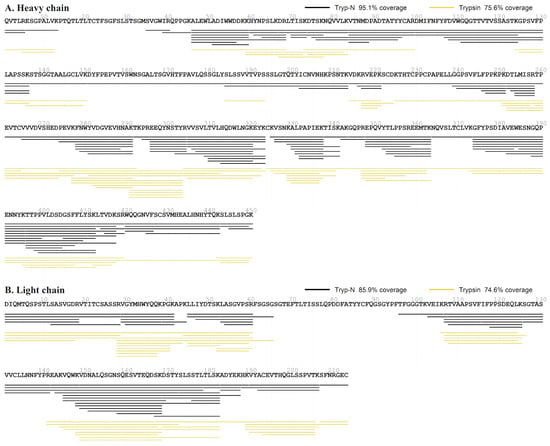
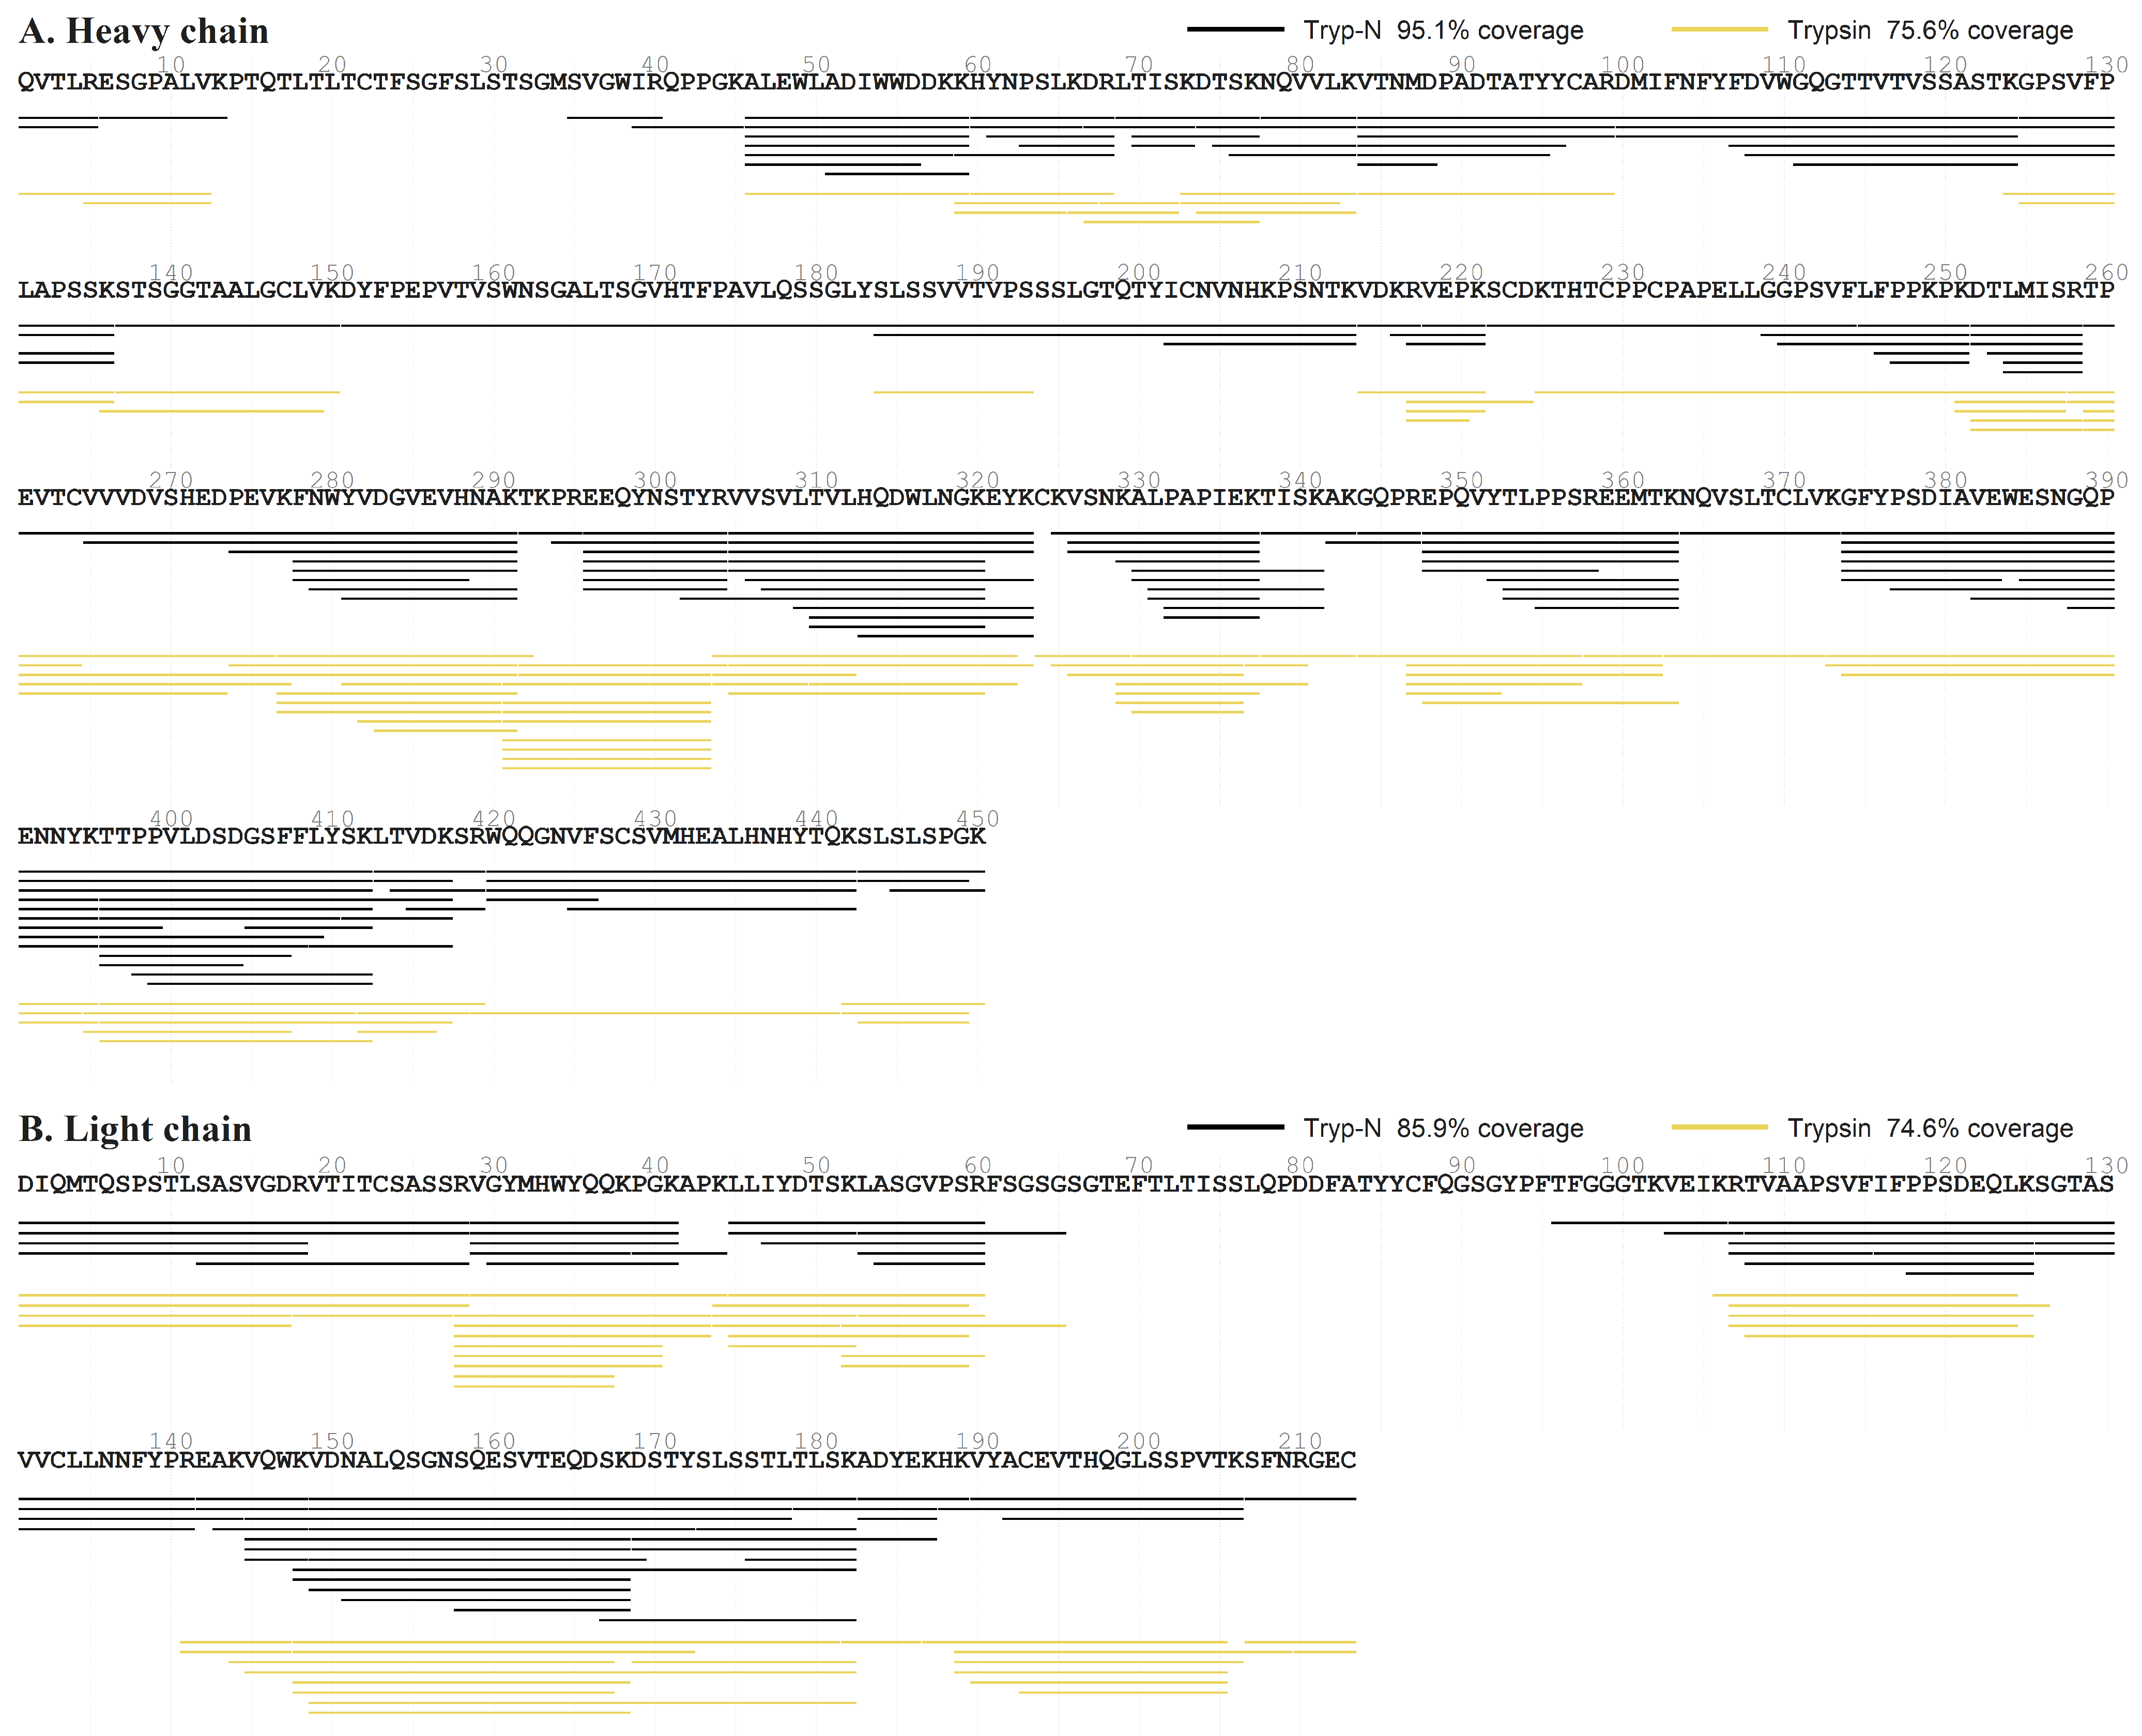
To evaluate complementary proteolytic strategies for NISTmAb peptide mapping, trypsin and Tryp-N™ were compared under the peptide-ladder digestion conditions described in Section 4.7. Following digestion for 1 h at 37 °C with trypsin or 55 °C with Tryp-N™, peptide mapping was performed using Byos. Under these conditions, Tryp-N™ generated more extensive sequence coverage, achieving 95.1% coverage of the 450-amino-acid heavy chain and 85.9% coverage of the 213-amino-acid light chain, compared with 75.6% and 74.6%, respectively, for trypsin. These findings demonstrate the potential of Tryp-N™ to provide complementary peptide coverage and improve sequence characterization under the evaluated digestion conditions (Figure 4).
Figure 4.
Comparison of NISTmAb sequence coverage following Tryp-N™ and trypsin peptide-ladder digestion. NISTmAb RM 8671 was digested with Tryp-N™ or trypsin under the peptide-ladder conditions described in Section 4.7 and analyzed by LC–MS/MS. Peptide mapping was performed using Byos with nonspecific digestion settings. Heavy- and light-chain sequence coverage was 95.1% and 85.9%, respectively, with Tryp-N™ (black lines), compared with 75.6% and 74.6% with trypsin (yellow/gold lines).
3. Discussion
Here we compared two MAM sample preparation workflows and observed several differences. In-solution digestion protocols are inherently susceptible to interference from formulation excipients and process-related surfactants [23] as desalting columns may not efficiently remove these compounds. Indeed, the P-6 desalting column has a molecular weight cutoff of 6 kDa, smaller than the ~8 kDa average molecular weight of PEG-8000 or the micelles of Brij-35 (48–49 kDa) or polysorbate-80 (111–127 kDa) [24,25,26,27,28]. The column would thus not be expected to remove such foulants, potentially leading to ion suppression, interference with quantification, introduction of extraneous material into the mass spectrometer, and increase analytical variability. Accordingly, polysorbate-80, Brij-35, and PEG-8000 were selected as representative foulants to compare the workflows systematically. Surfactants are prevalent in antibody formulations: Peng et al. identified them in 92.9% of 141 marketed monoclonal antibody formulations [29]; Wang et al. reported polysorbates 20 and 80 in 94% of antibody drugs [30]; and Wuchner et al. found that 93% of surveyed biotechnology companies used polysorbate 80 in their biopharmaceutical product portfolios [31]. Compared with the NIBRT workflow, S-Trap™ MAM preparation resulted in no detectable corresponding LC–MS/MS signals for polysorbate-80, Brij-35, or PEG-8000 under the conditions evaluated (Figure 2). These findings are consistent with previous reports describing the removal of interfering polymeric surfactants using S-Trap™ technology [32], while the absence of detectable signals does not establish complete or quantitative removal.
Deamidation is a well-established analytical artifact during sample preparation and is influenced by factors such as pH, temperature, incubation time, and the local structural and chemical environment. In NISTmAb, N318 and N387 are the sites most affected by preparation-induced deamidation [33,34]. Both contain the Asn-Gly (NG) motif, which is particularly susceptible to deamidation [35]. Sinha et al. demonstrated that deamidation of N387 within GFYPSDIAVEWESNGQPENNYK was approximately 30-fold slower in intact Fc than in the corresponding synthetic peptide [36]. Digestion removes this higher-order structural protection, potentially allowing extensive deamidation of NG-containing peptides [35]. Digestion time, temperature [34,35], and buffer pH [34] strongly influence this process. For example, lowering the digestion-buffer pH during automated high-temperature peptide mapping of trastuzumab reduced heavy-chain N318 deamidation by up to 80% [34]. Under the conditions tested, S-Trap™ MAM preparation yielded lower measured deamidation than NIBRT preparation at N318 (<0.1% versus 1.3%) and N387 (0.2% versus 1.6%). Deamidation is challenging to detect and quantify because of its small mass shift (0.984 Da) and co-elution with unmodified peptides; Protein Metrics Byos 6.0 software was used to deconvolve the deamidated peptide signals. Because overall protein recovery differed between workflows (92.3% versus 48.4%), differential formation or recovery of modified and unmodified species could contribute to the observed differences.
Host cell proteins (HCPs) are process-related impurities routinely monitored during biopharmaceutical manufacturing. LC-MS/MS methods such as MAM can detect multiple low-abundance non-product proteins, complementing conventional immunoassays [37,38]. Under the conditions evaluated, S-Trap™ MAM produced greater summed non-product protein XIC signal and a broader set of non-NISTmAb peptide observations than NIBRT (Figure 3). These included expected HCPs, Ig-like or database-ambiguous assignments, keratin-associated background, and reagent- or trypsin-associated proteins. Differences may reflect protein losses during desalting, denaturation efficiency, or peptide recovery. Previous studies similarly reported increased peptide and protein identifications with S-Trap-based preparation compared with in-solution digestion [39,40]. Under the conditions evaluated, S-Trap™ MAM yielded higher summed LC–MS signal from non-product proteins and a broader set of detected peptides than the NIBRT workflow. This comparative study did not establish analytical sensitivity, absolute HCP abundance, or limits of detection and quantification. Differences in protein and peptide recovery may have contributed to the observed results.
Tryp-N™, a thermostable metalloprotease, cleaves N-terminal to lysine and arginine, complementing trypsin cleavage C-terminal to the same residues [41]. This positions the positively charged peptide N-terminus and an N-terminal basic residue together, producing a strong b-ion series complementary to the dominant y-ion series of tryptic peptides. This fragmentation complementarity is particularly valuable for de novo sequencing, analyzing otherwise poorly fragmenting regions, and independently confirming modification sites [41,42]. Tryp-N™ can also generate overlapping peptide ladders of varying lengths to obtain extensive sequence coverage (Figure 4). These ladders can be produced reproducibly by collecting digestion aliquots at different times and quenching with ethylenediaminetetraacetic acid (EDTA), or by varying enzyme-to-substrate ratios at a fixed digestion time. Combining Tryp-N™ and trypsin digests has been shown to increase both protein and peptide coverage compared with either protease alone, including in S-Trap™ workflows [43].
The 96-well plate format of the S-Trap™ MAM Kit is compatible with automated liquid-handling platforms and provides a standardized approach to higher-throughput sample preparation. This design offers potential advantages for streamlining MAM workflows and reducing manual handling compared with conventional tube-based preparation. Operational benefits and suitability for routine quality-control implementation depend on the application and equipment. Several practical limitations should also be considered. The S-Trap™ MAM Kit accommodates a defined protein input range of 10–250 µg, which may restrict its applicability to samples outside this range. Additionally, depending on the consumables and desalting columns used, the cost of the kit-based workflow may exceed that of conventional in-solution digestion.
This study compared two sample-preparation workflows using NISTmAb RM 8671 and was not designed to qualify or validate an analytical procedure for GMP/QC application. Establishing suitability for a specific product and intended application would require further assessment of relevant performance characteristics, including intermediate precision, robustness, analytical sensitivity (LOD/LOQ), calibration, and analyte-specific quantitative recovery pursuant to ICH Q14 and Q2(R2).
4. Materials and Methods
4.1. Experimental Design
NISTmAb Reference Material 8671 (NISTmAb RM 8671; National Institute of Standards and Technology [NIST], Gaithersburg, MD, USA), a humanized IgG1κ monoclonal antibody, was utilized as the model therapeutic antibody for all workflow comparisons. Matched NISTmAb samples were processed using either the established National Institute for Bioprocessing Research and Training (NIBRT) in-solution Multi-Attribute Method (MAM) workflow or the ProtiFi S-Trap™ MAM Kit (ProtiFi LLC, Fairport, NY, USA) workflow. Samples were prepared with or without a 42-component foulant panel representative of formulation- and process-related foulants encountered in biologics manufacturing. Each combination of workflow and foulant condition was prepared in triplicate. Digests were analyzed by LC–MS/MS to compare NISTmAb sequence coverage, peptide-level CQAs, protein recovery, non-product protein signal, and detectable carryover of selected added foulants across the evaluated preparation conditions.
4.2. Materials
NISTmAb Reference Material 8671 (NISTmAb RM 8671; National Institute of Standards and Technology [NIST], Gaithersburg, MD, USA; RM 8671), a humanized IgG1κ monoclonal antibody, was used for all workflow comparisons. The NIBRT workflow employed guanidine hydrochloride (GuHCl; Bio Basic Inc., Markham, ON, Canada; Cat. No. GB0242), Tris hydrochloride (Tris-HCl; Bio Basic Inc., Markham, ON, Canada; Cat. No. TB0103), dithiothreitol (DTT; Spectrum Chemical, New Brunswick, NJ, USA; Cat. No. DI185), iodoacetic acid (IAA; Sigma-Aldrich, St. Louis, MO, USA; Cat. No. I4386-10G), sodium hydroxide (NaOH; Sigma-Aldrich, St. Louis, MO, USA; Cat. No. 221465-500G), trifluoroacetic acid (TFA; Thermo Fisher Scientific, Waltham, MA, USA; Cat. No. 85183), Optima™ LC/MS-grade formic acid (FA; Fisher Chemical, Fair Lawn, NJ, USA; Cat. No. A117-50), Optima™ LC/MS-grade water (Fisher Chemical, Fair Lawn, NJ, USA; Cat. No. W6-4), HPLC gradient-grade acetonitrile (ACN; Sigma-Aldrich, St. Louis, MO, USA; Cat. No. 34851-4L), and trypsin from bovine pancreas (Sigma-Aldrich, St. Louis, MO, USA; Cat. No. T1426-50MG). Bio-Spin® P-6 Gel Columns in Tris buffer (Bio-Rad Laboratories, Hercules, CA, USA; Cat. No. 7326227) were used for desalting and buffer exchange. The S-Trap™ MAM Kit (ProtiFi LLC, Fairport, NY, USA) contained the reagents used for lysis (10% sodium dodecyl sulfate, SDS), reduction (tris(2-carboxyethyl)phosphine, TCEP), alkylation (methyl methanethiosulfonate, MMTS), acidification, binding/washing, digestion, and elution, together with the S-Trap™ MAM 96-well Turbo Mini Plate. Protein recovery was determined using the Pierce™ BCA Protein Assay Kit (Thermo Fisher Scientific, Waltham, MA, USA; Cat. No. 23225).
4.3. Foulant-Challenged NISTmAb Samples
Matched NISTmAb samples were prepared with or without a 42-component foulant panel representative of formulation- and process-related foulants encountered in biologics manufacturing (Table S1). Foulants were introduced before sample preparation. Each combination of workflow and foulant condition was prepared in triplicate. Samples were processed using either the NIBRT in-solution digestion workflow or the ProtiFi S-Trap™ MAM Kit workflow.
4.4. NIBRT In-Solution MAM Sample Preparation Workflow
The NIBRT workflow was performed as previously described [14]. Briefly, NISTmAb samples were chaotrope denatured, reduced, alkylated, buffer exchanged and digested in-solution with trypsin. Samples were diluted with 7.0 M guanidine hydrochloride (GuHCl) and 100 mM Tris, pH 8.3, to denature proteins. For reduction, 10 µL of sample was combined with 90 µL of 7.0 M guanidine-HCl and 100 mM Tris, pH 8.3, and DTT was added to a final concentration of 10 mM. Samples were mixed thoroughly and incubated for 30 min at room temperature. Reduced samples were alkylated with iodoacetic acid (IAA) added to a final concentration of 20 mM and incubated for 20 min at room temperature in the dark. Alkylation was quenched by adding DTT to a final concentration of 11 mM. Samples were buffer-exchanged using Bio-Spin P-6 gel columns equilibrated with 50 mM Tris, pH 7.9. Centrifugation steps were performed using a SORVALL® Super T 21 refrigerated tabletop superspeed centrifuge (Kendro Laboratory Products, Newtown, CT, USA). Columns were conditioned by centrifugation and washed 3× with 50 mM Tris before applying the alkylated sample. Buffer-exchanged samples were collected by centrifugation. Trypsin was reconstituted in LC–MS-grade water to 1 mg/mL and added to the buffer-exchanged protein sample at an enzyme-to-substrate ratio of 1:10 (w/w). Digestion was performed at 37 °C for 30 min with gentle shaking. Reactions were quenched by adding a 1:10 ratio (relative to the digestion volume) of a stock solution of 10% FA; acidification was confirmed using Fisherbrand™ pH test paper, pH 0–14 (Fisher Scientific Company LLC, Pittsburgh, PA, USA; Cat. No. 13-640-508 Digested samples were dried by vacuum centrifugation using a Savant SpeedVac® Plus SC110A centrifugal vacuum concentrator (Savant Instruments, Inc., Holbrook, NY, USA) and reconstituted in 5% LC–MS-grade acetonitrile/0.1% formic acid LC–MS loading buffer before LC–MS analysis.
4.5. ProtiFi S-Trap™ MAM Kit Sample Preparation Workflow
In the ProtiFi S-Trap™ MAM Kit workflow, NISTmAb samples were exposed to detergent-based denaturation, reduction, alkylation, protein trapping, washing and in-plate digestion. For each sample, 5 µL of 10 mg/mL NISTmAb was mixed with 20 µL of LC–MS-grade water and 25 µL of 2× Lysis Solution, which contains SDS. The solution was fully mixed by brief vortexing or sonication. Reduction was carried out by addition of 2.2 µL of Reductant (TCEP), followed by brief vortexing and incubation at 21 °C for 10 min. Alkylation was performed by adding 2.2 µL of Alkylator (MMTS), with subsequent brief vortexing and incubation at 21 °C for 10 min. Acidification was achieved by addition of 5.4 µL of Acidifier, followed by brief vortexing, and the pH was verified to be less than 1 using Fisherbrand™ pH test paper, pH 0–14 (Fisher Scientific Company LLC, Pittsburgh, PA, USA; Cat. No. 13-640-508). Acidified samples were combined with 358.7 µL of Binding/Wash Solution, prepared with LC–MS-grade methanol according to the kit protocol, and mixed thoroughly.
Samples were transferred to an S-Trap™ MAM 96-well Turbo Mini Plate placed above a 2.0 mL 96-well collection plate. Proteins were immobilized by centrifugation at 2000× g for 2 min using a SORVALL® Super T 21 refrigerated tabletop superspeed centrifuge (Kendro Laboratory Products, Newtown, CT, USA), and complete passage of the solution through each well was confirmed visually. The trapped proteins were washed with 200 µL of Binding/Wash Solution and centrifuged at 2000× g for 2 min; this washing step was repeated 2 additional times (total of 3) with the flow-through discarded after each wash. Following the washing steps, the S-Trap™ MAM plate was transferred to a 1.0 mL 96-well collection plate for digestion and elution. Trypsin was diluted in TruPROT™ Solution to a final digestion volume of 30 µL and added to each well at an enzyme-to-substrate ratio of 1:10 (w/w). Plates were loosely covered to minimize evaporative loss and incubated at 37 °C for 30 min in a humidified incubator without agitation. After digestion, peptides were eluted by sequential addition of 20 µL of TruPROT™ Solution and 20 µL of Elution Solution, followed by centrifugation at 2000× g. Final eluates were dried by vacuum centrifugation using a Savant SpeedVac® Plus SC110A centrifugal vacuum concentrator (Savant Instruments, Inc., Holbrook, NY, USA) and reconstituted in 5% LC–MS-grade acetonitrile with 0.1% formic acid prior to LC–MS analysis.
NISTmAb peptide digests were analyzed by nano-flow LC–MS/MS, similarly to a protocol described by NIBRT [44], using a Dionex UltiMate 3000 RSLCnano system (Thermo Fisher Scientific, Germering, Germany) coupled to a Q Exactive HF Orbitrap mass spectrometer equipped with a Nanospray Flex ion source (Thermo Fisher Scientific, Bremen, Germany). Peptides were separated on a ReproSil Saphir 100 C18 column (1.5 µm particle size, 100 Å pore size, 250 mm × 75 µm ID; Dr. Maisch HPLC GmbH, Ammerbuch, Germany; Part No. ra115.9e.pt250.075.0001), using mobile phase A (0.1% FA in water) and mobile phase B (ACN containing 0.1% FA). Unless otherwise specified, 2 ug of peptide digest was injected and separated over a 75-min gradient from 1% to 65% mobile phase B at a flow rate of 350 nL/min. MS acquisition was performed from 5 to 75 min. Data-dependent MS/MS acquisition was performed in positive mode. Full MS scans were acquired at a resolution of 60,000 over an m/z range of 200–2000 with an automatic gain control target of 3 × 10⁶. Precursor ions were isolated using a 1.8 m/z isolation window and fragmented by higher-energy collisional dissociation (HCD) at 27% normalized collision energy. MS/MS scans were acquired at a resolution of 30,000 with an automatic gain control target of 2 × 10⁵, a maximum injection time of 120 ms, and a fixed first mass of m/z 150.
4.6. Mass Spectrometry Data Analysis
Peptide identification and CQA characterization were performed using the PTM workflow in Byos® version 6.1 (Protein Metrics, LLC, Cupertino, CA, USA). Searches against the NISTmAb sequence specified fully tryptic digestion with up to two missed cleavages. Variable modifications included N and Q deamidation, M and W oxidation, succinimide formation, N-terminal pyroglutamate formation, C-terminal lysine clipping, and lysine glycation (Table S2). Cysteine carboxymethylation (NIBRT) and methylthiolation (S-Trap™ MAM Kit) were set as fixed modifications, except for cysteine-capping efficiency analysis, where they were variable. Modifications were identified from MS/MS spectra and quantified by integration of extracted ion chromatograms (XICs); all such spectra underwent manual review. Site-specific modification percentages were calculated using the Byos All Peptide PTM Quant report, which pools modified and unmodified peptides containing the residue of interest, regardless of digestion specificity. Peptide identifications required a minimum score of 150 and precursor mass error within ±5 ppm (Table S3). Adducts and in-source-generated ions were excluded. Host cell proteins (HCPs) were analyzed using the Byos HCP workflow against a database of the mouse proteome, digestion enzymes, and common contaminants. For the NISTmAb proteolytic ladder, both trypsin and Tryp-N™ (ProtiFi LLC, Fairport, NY, USA; Cat. No. K001-TRYPN-0010ug) datasets were searched with nonspecific digestion settings; Tryp-N™ cleavage specificity was defined as N-terminal to lysine and arginine.
4.7. Proteolytic Peptide Ladder Generation
To improve sequence coverage and assess protease compatibility in the ProtiFi S-Trap™ MAM Kit workflow, a proteolytic NISTmAb peptide ladder was generated using trypsin and ProtiFi Tryp-N™ NISTmAb samples were digested with each protease at protease-to-protein ratios of 1:200, 1:100, 1:50, 1:25, and 1:10. Trypsin digests were incubated for 1 h at 37 °C, and Tryp-N™ digests were incubated for 1 h at 55 °C. Digests from the latter conditions were pooled and analyzed by LC–MS.
4.8. Statistical Analysis
Quantitative data are presented as individual replicate measurements with the mean ± standard deviation (SD) unless otherwise indicated. CQA analyses, foulant-challenge experiments, cysteine-capping analyses, and Tryp-N™/trypsin digestion experiments were performed in triplicate (n = 3 independent sample preparations per condition) unless otherwise indicated. Protein-recovery measurements were performed using four independent sample preparations per workflow (n = 4). Replicate counts for other analyses are specified here and in figure legends. Statistical comparisons between the NIBRT and S-Trap™ MAM workflows were performed using two-sided unpaired Welch’s t-tests, which do not assume equal variance between groups. Each predefined CQA modification site and each cysteine residue in capping analysis was evaluated independently. Sites containing fewer than two measured replicates for either workflow were not subjected to statistical testing, and measurements reported as not detected (ND) were not converted to zero.
Protein recovery was compared between workflows using four independent sample preparations per workflow (n = 4; Figure S4). M255 dethiomethylation was evaluated using two measurements per workflow (n = 2; Figure S2). S-Trap™ MAM samples with no detectable dethiomethylated peptide signal were assigned ND for graphical and statistical analyses. For Figure 3B and Figure 3C, ion currents were calculated by summing peptide ion currents for the NISTmAb heavy chain, light chain, and non-product proteins, respectively, after collapsing duplicate precursor charge-state observations within each sample. Three independent samples per workflow (n = 3) were compared using separate two-sided, unpaired Welch’s t-tests for each category. Relative abundance in Figure 3A was evaluated descriptively using three S-Trap™ MAM samples and three NIBRT samples. Non-NISTmAb peptide observations in Figure 3D were counted after collapsing duplicate precursor charge-state observations within each sample and were evaluated descriptively without inferential statistical testing.
Statistical significance was defined as p < 0.05, with significance indicated as p < 0.05 (*), p < 0.01 (**), p < 0.001 (***), and p < 0.0001 (****). Exact p-values were retained in the statistical output tables, and non-significant comparisons were not annotated in the figures. p-values were not adjusted for multiple comparisons. Foulant-removal chromatograms and spectra, sequence-coverage analyses, non-NISTmAb peptide counts, and heatmap-based relative abundance comparisons were evaluated descriptively, not subjected to inferential statistical testing.
Statistical analyses and figure generation were performed in R version 4.6.0 (R Foundation for Statistical Computing, Vienna, Austria) using RStudio Desktop version 2026.09.0+174 (Posit Software, PBC, Boston, MA, USA). ChatGPT (OpenAI, San Francisco, CA, USA) was used to assist with the generation and refinement of R code for figure preparation and formatting. All code was reviewed and executed by the authors in RStudio, and all figures were generated from experimental data collected and analyzed by the authors.
5. Conclusions
We compared the NIBRT in-solution and S-Trap™ MAM Kit sample-preparation workflows using NISTmAb RM 8671 with and without added foulants. Both workflows yielded complete NISTmAb sequence coverage with matched peptide input. Under the conditions evaluated, S-Trap™ MAM showed higher measured protein recovery (92.3% versus 48.4%), greater summed non-product protein LC–MS signal, and lower levels of monitored peptide modifications. LC–MS/MS signals for polysorbate-80, Brij-35, and PEG-8000 were not detected following S-Trap™ MAM preparation; the exact level of removal was not established. Complementary Tryp-N™ digestion increased sequence coverage relative to trypsin in the separate digestion comparison. Differences in overall recovery and other workflow variables may contribute to the observed modification and non-product protein profiles. Broader product applicability, analytical sensitivity, intermediate precision, robustness, and suitability for routine GMP/QC use were not established and require product- and application-specific evaluation.
Supplementary Materials
The following supporting information can be downloaded at: https://www.mdpi.com/article/10.3390/ph19111750/s1, Figure S1: Sequence coverage of NISTmAb following NIBRT and S-Trap™ MAM sample preparation; Figure S2: M255 dethiomethylation following NIBRT and S-Trap™ MAM sample preparation; Figure S3: Comparison of uncapped cysteine levels following NIBRT and S-Trap™ MAM sample preparation; Table S1: Foulants added to NISTmAb at the indicated concentrations prior to cleanup using either the published NIBRT workflow or the S-Trap™ MAM workflow. Figure S4: Recovery of antibody using NIBRT and S-Trap™ MAM workflows. Figure S5: XICs for N318 containing peptide. Figure S6: XICs for N387 are deamidated and not modified from the PENNYK peptide as viewed in PTM by Byos. Table S2: Modifications used in the PTM analysis in Byos for peptide mapping of NISTmAb. Table S3: Search and quantitation parameters for the Byonic and biologic nodes search parameters for the PTM workflow used to quantify CQAs.
Author Contributions
Conceptualization, J.P.W., S.W.; methodology, J.P.W.; investigation, T.S., A.S.; data curation, A.S., T.S.; initial draft preparation, T.S., A.S.; review and editing, A.S., T.S., J.P.W.; visualization, A.S., T.S.; supervision, J.P.W. All authors have read and agreed to the published version of the manuscript.
Funding
This research received no external funding.
Institutional Review Board Statement
Not applicable.
Informed Consent Statement
Not applicable.
Data Availability Statement
The original contributions presented in this study are included in the article and Supplementary Materials. The mass spectrometry proteomics data have been deposited to the ProteomeXchange Consortium via the PRIDE partner repository with the dataset identifier PXD086642 and 10.6019/PXD086642. Further inquiries can be directed at the corresponding author.
Acknowledgments
During the preparation of this manuscript, the authors used ChatGPT (GPT-6, OpenAI, San Francisco, CA, USA) for the generation and refinement of R code for the preparation and formatting of figures based on data collected by the authors, as well as for general manuscript and reference formatting. All R code was reviewed and run by the authors in RStudio, and all figures were generated from the authors’ experimental data using the resulting R scripts. All resulting figures and manuscript formatting were subsequently reviewed and approved by the authors.
Conflicts of Interest
John P. Wilson, Sandra Wilson, Alia Sagatova, and Tyler Scherzi are employed by ProtiFi LLC. The authors acknowledge this potential conflict of interest. The study was conducted in accordance with rigorous scientific standards, and the experimental design, data collection, analysis, and interpretation were performed with scientific integrity. The authors stand by the accuracy and validity of the results presented.
Abbreviations
The following abbreviations are used in this manuscript:
| ACN | Acetonitrile |
| BCA | Bicinchoninic acid |
| BPI | Base peak intensity |
| CQA | Critical quality attribute |
| DAR | Drug-to-antibody ratio |
| DTT | Dithiothreitol |
| FA | Formic acid |
| Fc | Fragment crystallizable |
| FDA | United States Food and Drug Administration |
| GuHCl | Guanidine hydrochloride |
| HCD | Higher-energy collisional dissociation |
| HCP | Host cell protein |
| IAA | Iodoacetic acid |
| IgG | Immunoglobulin G |
| LC–MS/MS | Liquid chromatography–tandem mass spectrometry |
| mAb | Monoclonal antibody |
| MAM | Multi-Attribute Method |
| MMTS | Methyl methanethiosulfonate |
| MS | Mass spectrometry |
| MS1 | First-stage mass spectrometry |
| MS2 | Second-stage mass spectrometry |
| NaOH | Sodium hydroxide |
| NIBRT | National Institute for Bioprocessing Research and Training |
| NISTmAb | National Institute of Standards and Technology monoclonal antibody |
| PEG | Polyethylene glycol |
| PTM | Post-translational modification |
| QC | Quality control |
| RM | Reference Material |
| SDS | Sodium dodecyl sulfate |
| TCEP | Tris(2-carboxyethyl)phosphine |
| TFA | Trifluoroacetic acid |
| Tris | Tris(hydroxymethyl)aminomethane |
| XIC | Extracted ion chromatograms |
References
- Zinn, S.; Vazquez-Lombardi, R.; Zimmermann, C.; Sapra, P.; Jermutus, L.; Christ, D. Advances in antibody-based therapy in oncology. Nat. Cancer 2023, 4, 165–180. [Google Scholar] [CrossRef] [Scilit] [PubMed]
- Tsuchikama, K.; Anami, Y.; Ha, S.Y.Y.; Yamazaki, C.M. Exploring the next generation of antibody–drug conjugates. Nat. Rev. Clin. Oncol. 2024, 21, 203–223. [Google Scholar] [CrossRef] [Scilit] [PubMed]
- Klein, C.; Brinkmann, U.; Reichert, J.M.; Kontermann, R.E. The present and future of bispecific antibodies for cancer therapy. Nat. Rev. Drug Discov. 2024, 23, 301–319. [Google Scholar] [CrossRef] [Scilit] [PubMed]
- Siegmund, D.; Wajant, H. TNF and TNF receptors as therapeutic targets for rheumatic diseases and beyond. Nat. Rev. Rheumatol. 2023, 19, 576–591. [Google Scholar] [CrossRef] [Scilit] [PubMed]
- Kharga, K.; Kumar, L.; Patel, S.K.S. Recent Advances in Monoclonal Antibody-Based Approaches in the Management of Bacterial Sepsis. Biomedicines 2023, 11, 765. [Google Scholar] [CrossRef] [Scilit] [PubMed]
- Mullard, A. FDA approves 100th monoclonal antibody product. Nat. Rev. Drug Discov. 2021, 20, 491–495. [Google Scholar] [CrossRef] [Scilit] [PubMed]
- Strohl, W.R. Structure and function of therapeutic antibodies approved by the US FDA in 2024. Antib. Ther. 2025, 8, 197–237. [Google Scholar] [CrossRef] [Scilit] [PubMed]
- Hoeper, M.M.; Badesch, D.B.; Ghofrani, H.A.; Gibbs, J.S.R.; Gomberg-Maitland, M.; McLaughlin, V.V.; Preston, I.R.; Souza, R.; Waxman, A.B.; Grünig, E.; et al. Phase 3 trial of sotatercept for treatment of pulmonary arterial hypertension. N. Engl. J. Med. 2023, 388, 1478–1490. [Google Scholar] [CrossRef] [Scilit] [PubMed]
- Chamie, K.; Chang, S.S.; Kramolowsky, E.; Gonzalgo, M.L.; Agarwal, P.K.; Bassett, J.C.; Bjurlin, M.; Cher, M.L.; Clark, W.; Cowan, B.E.; et al. IL-15 superagonist NAI in BCG-unresponsive non-muscle-invasive bladder cancer. NEJM Evid. 2023, 2, EVIDoa2200167. [Google Scholar] [CrossRef] [Scilit] [PubMed]
- Graf, T.; Heinrich, K.; Grunert, I.; Wegele, H.; Haberger, M.; Bulau, P.; Leiss, M. Recent advances in LC–MS based characterization of protein-based bio-therapeutics—Mastering analytical challenges posed by the increasing format complexity. J. Pharm. Biomed. Anal. 2020, 186, 113251. [Google Scholar] [CrossRef] [Scilit] [PubMed]
- Rogers, R.S.; Nightlinger, N.S.; Livingston, B.; Campbell, P.; Bailey, R.; Balland, A. Development of a quantitative mass spectrometry multi-attribute method for characterization, quality control testing and disposition of biologics. mAbs 2015, 7, 881–890. [Google Scholar] [CrossRef] [Scilit] [PubMed]
- Rogstad, S.; Yan, H.; Wang, X.; Powers, D.; Brorson, K.; Damdinsuren, B.; Lee, S. Multi-attribute method for quality control of therapeutic proteins. Anal. Chem. 2019, 91, 14170–14177. [Google Scholar] [CrossRef] [Scilit] [PubMed]
- Guan, X.; Eris, T.; Zhang, L.; Ren, D.; Ricci, M.S.; Thiel, T.; Goudar, C.T. A high-resolution multi-attribute method for product characterization, process characterization, and quality control of therapeutic proteins. Anal. Biochem. 2022, 643, 114575. [Google Scholar] [CrossRef] [Scilit] [PubMed]
- Millán-Martín, S.; Jakes, C.; Carillo, S.; Rogers, R.; Ren, D.; Bones, J. Comprehensive multi-attribute method workflow for biotherapeutic characterization and current good manufacturing practices testing. Nat. Protoc. 2023, 18, 1056–1089. [Google Scholar] [CrossRef] [Scilit] [PubMed]
- Gupta, S.; Jiskoot, W.; Schöneich, C.; Rathore, A.S. Oxidation and deamidation of monoclonal antibody products: Potential impact on stability, biological activity, and efficacy. J. Pharm. Sci. 2022, 111, 903–918. [Google Scholar] [CrossRef] [Scilit] [PubMed]
- Reusch, D.; Tejada, M.L. Fc glycans of therapeutic antibodies as critical quality attributes. Glycobiology 2015, 25, 1325–1334. [Google Scholar] [CrossRef] [Scilit] [PubMed]
- Huang, Y.; Molden, R.; Hu, M.; Qiu, H.; Li, N. Toward unbiased identification and comparative quantification of host cell protein impurities by automated iterative LC-MS (HCP-AIMS) for therapeutic protein development. J. Pharm. Biomed. Anal. 2021, 200, 114069. [Google Scholar] [CrossRef] [Scilit] [PubMed]
- Pohl, T.; Gervais, A.; Dirksen, E.H.C.; D’Alessio, V.; Bechtold-Peters, K.; Burkitt, W.; Cao, L.; Greven, S.; Lennard, A.; Li, X.; et al. Technical considerations for the implementation of the multi-attribute-method by mass spectrometry in a quality control laboratory. Eur. J. Pharm. Biopharm. 2023, 188, 231–242. [Google Scholar] [CrossRef] [Scilit] [PubMed]
- Oyugi, M.; Wang, X.; Yang, X.; Wu, D.; Rogstad, S. Method validation and new peak detection for the liquid chromatography-mass spectrometry multi-attribute method. J. Pharm. Biomed. Anal. 2023, 234, 115564. [Google Scholar] [CrossRef] [Scilit] [PubMed]
- Hashii, N.; Obata, C.; Okada, M.; Nakamura, S.; Fukazawa, K.; Watanabe, S.; Ishii-Watabe, A. Multi-attribute method analysis of therapeutic monoclonal antibodies using an automated sample preparation system. J. Pharm. Biomed. Anal. 2025, 253, 116542. [Google Scholar] [CrossRef] [Scilit] [PubMed]
- Sargautis, D.; Thiede, B. LC-MS peptide mapping of monoclonal antibodies using the mirror proteases trypsin and Tryp-N. J. Pharm. Biomed. Anal. 2026, 272, 117361. [Google Scholar] [CrossRef] [Scilit] [PubMed]
- Müller, T.; Winter, D. Systematic evaluation of protein reduction and alkylation reveals massive unspecific side effects by iodine-containing reagents. Mol. Cell. Proteom. 2017, 16, 1173–1187. [Google Scholar] [CrossRef] [Scilit] [PubMed]
- Rao, V.A.; Kim, J.J.; Patel, D.S.; Rains, K.; Estoll, C.R. A comprehensive scientific survey of excipients used in currently marketed, therapeutic biological drug products. Pharm. Res. 2020, 37, 200. [Google Scholar] [CrossRef] [Scilit] [PubMed]
- Braun, A.C.; Ilko, D.; Merget, B.; Gieseler, H.; Germershaus, O.; Holzgrabe, U.; Meinel, L. Predicting Critical Micelle Concentration and Micelle Molecular Weight of Polysorbate 80 Using Compendial Methods. Eur. J. Pharm. Biopharm. 2015, 94, 559–568. [Google Scholar] [CrossRef] [Scilit] [PubMed]
- Becher, P. Nonionic Surface-Active Compounds IV. Micelle Formation by Polyoxyethylene Alkanols and Alkyl Phenols in Aqueous Solution. J. Colloid Sci. 1961, 16, 49–56. [Google Scholar] [CrossRef] [Scilit]
- Woodhead, J.L. A Thermodynamic Study of Self-Association in β-Casein and Brij 35 Solutions. Ph.D. Thesis, Massey University, Auckland, New Zealand, 1978. Available online: https://digitalnz.org/records/30242319/a-thermodynamic-study-of-self-association-in-b-casein-and-brij-35-solutions (accessed on 31 October 2026).
- Sigma-Aldrich. Brij® L23 (Brij 35), Product P1254. Technical Product Specifications: Average Micellar Molecular Weight 48,000 g/mol. Available online: https://www.sigmaaldrich.com/US/en/product/sial/p1254 (accessed on 10 March 2025).
- Thermo Fisher Scientific. Brij™-35, 30% Solution, Product 20150. Technical Product Specifications: Micelle Molecular Weight 49,000 g/mol. Available online: https://www.thermofisher.com/order/catalog/product/20150 (accessed on 25 February 2025).
- Peng, Y.; Lyu, L.; Chen, S.; Ning, B.; Li, C.; Wu, C.Y.; Hu, Y. Monoclonal antibody formulations: A quantitative analysis of marketed products and patents. Mabs 2025, 17, 2580696. [Google Scholar] [CrossRef] [Scilit] [PubMed]
- Wang, S.S.; Yan, Y.S.; Ho, K. US FDA-approved therapeutic antibodies with high-concentration formulation: Summaries and perspectives. Antib. Ther. 2021, 4, 262–272. [Google Scholar] [CrossRef] [Scilit] [PubMed]
- Wuchner, K.; Yi, L.; Chery, C.; Nikels, F.; Junge, F.; Crotts, G.; Rinaldi, G.; Starkey, J.A.; Bechtold-Peters, K.; Shuman, M.; et al. Industry Perspective on the Use and Characterization of Polysorbates for Biopharmaceutical Products Part 1: Survey Report on Current State and Common Practices for Handling and Control of Polysorbates. J. Pharm. Sci. 2022, 111, 1280–1291. [Google Scholar] [CrossRef] [Scilit] [PubMed]
- Zacchi, L.F.; Recinos, D.R.; Otte, E.; Aitken, C.; Hunt, T.; Sandford, V.; Lee, Y.Y.; Schulz, B.L.; Howard, C.B. S-Trap eliminates cell culture media polymeric surfactants for effective proteomic analysis of mammalian cell bioreactor supernatants. J. Proteome Res. 2020, 19, 2149–2158. [Google Scholar] [CrossRef] [Scilit] [PubMed]
- Mouchahoir, T.; Schiel, J.E. Development of an LC-MS/MS Peptide Mapping Protocol for the NISTmAb. Anal. Bioanal. Chem. 2018, 410, 2111–2126. [Google Scholar] [CrossRef] [Scilit] [PubMed]
- Millán-Martín, S.; Jakes, C.; Carillo, S.; Buchanan, T.; Guender, M.; Kristensen, D.B.; Sloth, T.M.; Ørgaard, M.; Cook, K.; Bones, J. Inter-Laboratory Study of an Optimised Peptide Mapping Workflow Using Automated Trypsin Digestion for Monitoring Monoclonal Antibody Product Quality Attributes. Anal. Bioanal. Chem. 2020, 412, 6833–6848. [Google Scholar] [CrossRef] [Scilit] [PubMed]
- Krokhin, O.V.; Antonovici, M.; Ens, W.; Wilkins, J.A.; Standing, K.G. Deamidation of -Asn-Gly- Sequences during Sample Preparation for Proteomics: Consequences for MALDI and HPLC-MALDI Analysis. Anal. Chem. 2006, 78, 6645–6650. [Google Scholar] [CrossRef] [Scilit] [PubMed]
- Sinha, S.; Zhang, L.; Duan, S.; Williams, T.D.; Vlasak, J.; Ionescu, R.; Topp, E.M. Effect of Protein Structure on Deamidation Rate in the Fc Fragment of an IgG1 Monoclonal Antibody. Protein Sci. 2009, 18, 1573–1584. [Google Scholar] [CrossRef] [Scilit] [PubMed]
- Rogers, R.S.; Abernathy, M.; Richardson, D.D.; Rouse, J.C.; Sperry, J.B.; Swann, P.; Wypych, J.; Yu, C.; Zang, L.; Deshpande, R. A view on the importance of “multi-attribute method” for measuring purity of biopharmaceuticals and improving overall control strategy. AAPS J. 2018, 20, 7. [Google Scholar] [CrossRef] [Scilit] [PubMed]
- Yu, L.X.; Amidon, G.; Khan, M.A.; Hoag, S.W.; Polli, J.; Raju, G.K.; Woodcock, J. Understanding pharmaceutical quality by design. AAPS J. 2014, 16, 771–783. [Google Scholar] [CrossRef] [Scilit] [PubMed]
- Ludwig, K.R.; Schroll, M.M.; Hummon, A.B. Comparison of in-solution, FASP, and S-Trap based digestion methods for bottom-up proteomic studies. J. Proteome Res. 2018, 17, 2480–2490. [Google Scholar] [CrossRef] [Scilit] [PubMed]
- Bang, G.; Lee, H.; Kim, H.; Han, E.H.; Park, Y.H.; Kim, J.Y. Comparison of protein characterization using in solution S-Trap digestion methods for proteomics. Biochem. Biophys. Res. Commun. 2022, 589, 197–203. [Google Scholar] [CrossRef] [Scilit] [PubMed]
- Wilson, J.P.; Ipsaro, J.J.; Del Giudice, S.N.; Turna, N.S.; Gauss, C.M.; Dusenbury, K.H.; Marquart, K.; Rivera, K.D.; Pappin, D.J. Tryp-N: A Thermostable Protease for the Production of N-terminal Argininyl and Lysinyl Peptides. J. Proteome Res. 2020, 19, 1459–1469. [Google Scholar] [CrossRef] [Scilit] [PubMed]
- Huesgen, P.F.; Lange, P.F.; Rogers, L.D.; Solis, N.; Eckhard, U.; Kleifeld, O.; Goulas, T.; Gomis-Rüth, F.X.; Overall, C.M. LysargiNase Mirrors Trypsin for Protein C-terminal and Methylation-Site Identification. Nat. Methods 2015, 12, 55–58. [Google Scholar] [CrossRef] [Scilit] [PubMed]
- Hawksworth, J.I.; Denolf, L.; Timmerman, E.; Gevaert, K. Increasing the Overall Proteome Coverage by Combining Protein Digestion by Tryp-N and Trypsin. In Mass Spectrometry-Based Proteomics; Gevaert, K., Ed.; Methods in Molecular Biology; Humana: New York, NY, USA, 2023; Volume 2718, pp. 1–10. [Google Scholar] [CrossRef] [Scilit] [PubMed]
- Millán-Martín, S.; Mulligan, A.; Füssl, L.; Carillo, S.; Bones, J. High-sensitivity MAM to support early-stage activities during biotherapeutic development. J. Chromatogr. A 2026, 1774, 466862. [Google Scholar] [CrossRef] [Scilit] [PubMed]
Disclaimer/Publisher’s Note: The statements, opinions and data contained in all publications are solely those of the individual author(s) and contributor(s) and not of MDPI and/or the editor(s). MDPI and/or the editor(s) disclaim responsibility for any injury to people or property resulting from any ideas, methods, instructions or products referred to in the content. |
© 2026 by the authors. Licensee MDPI, Basel, Switzerland. This article is an open access article distributed under the terms and conditions of the Creative Commons Attribution (CC BY) license.