
A Tale of Shaheen’s Cyclone Consequences in Al Khaboura City, Oman


Department of Plant Science, College of Agriculture and Marine Science, Sultan Qaboos University, Muscat 1234, Oman
Water 2022, 14(3), 340; https://doi.org/10.3390/w14030340
Submission received: 30 November 2021
/
Revised: 13 January 2022
/
Accepted: 19 January 2022
/
Published: 24 January 2022
(This article belongs to the Special Issue Climate Model Projections: Sea-Level Rise and Impacts on Coastal Defense Decision-Making)
Abstract
:Natural hazards due to climate change have become the new norm in our cities. These events show the vulnerabilities of our cities to extreme conditions, mainly displayed as flash wadi flooding as a result of a short duration of intensive and eroded its shoreline along the coast, resulting in huge impacts, including human losses and urban and infrastructural damages. This study used the urban flood risk mitigation model through an open-source tool—Integrated Evaluation of Ecosystem Services and Trade-off (InVEST)—to estimate the amount of runoff due to two extreme rainfall events for each watershed considered. We used a digital shoreline analysis system (DSAS) to quantify the Al Khaboura shoreline erosion as a result of Shaheen’s storm surge. With the DSAS, the model showed that, during the short period of the event, the Al Khaboura coastal line was eroded by 16.33 m/y, representing 7.82% of its coastal line, up to a maximum erosion distance of 1428.5 m. The weighted linear regression showed the average mean rate of shoreline change of 6.79 m/y. These models could provide a clear picture of the city vulnerability to allow us to propose a corrective measure for interventions at local and regional scales.
1. Introduction
The threat of climate change on natural and human societies is obvious around the world. The impacts of sea-level rise (SLR), storms, and floods are known in affecting low-lying coastal zones, and they are anticipated to increase in the future [1]. This increase is associated with tremendous environmental and socioeconomic destruction, such as disturbance of developed areas and loss of ecosystem services [2]. The change in temperature for air and the ocean, the ice and snow melting, and the increase in sea levels are major factors of climate change impact on human and the environment [3]. The adverse impact of climate change has been observed around the world through the increase in temperatures, sea-level rise, frequent rainfall episodes, frequent storm tides, heat stress, and inundating damages [4]. Therefore, consequences of climate change, such as frequent and high magnitude extreme events, have touched millions of people worldwide [5]. Such consequences include land loss, reduction in crop production, disturbed aquatic ecosystems, and people displacement [6,7].
Concerns about coastal vulnerability have increased as increasing extreme events due to climate change are observed [8]. Flooding and storm surges are among the most occurring and destructive natural hazards that result in tremendous damage to infrastructure and the environment [9]. For instance, in the United States, between 2007 and 2015, more than 28,000 flash flood events reportedly resulted in loss of human lives and properties [10]. According to Munich [11], flooding between 1980 and 2018 caused over US $1 trillion in damages worldwide. Hurricanes, typhoons, and cyclones were among the most costly natural hazards, resulting in US $225 billion worldwide. For example, Hurricane Katrina in 2005, considered one of the most costly natural disasters of all time, cost the insurance sector over US $60 billion. Hurricanes Harvey, Irma, and Maria in 2017 cost the insurance company over US $90 billion within four weeks [12].
Approximately 24% of the world’s beaches are exposed to erosion at about 0.5 m/year, and 16% to more than 1 m/year [13]. Coastal erosion can be defined as the retreat of the coastline due to sea invasion resulting in the loss of beaches, land, and habitat [14]. Coastal erosion occurs as a consequence of various processes, both natural processes (SLR and storm surge) and human influences [15]. For example, the Vishakhapatnam coast of Andhra Pradesh, India, showed coastal changes that were influenced by both natural and human activities [16]. In Bangladesh, Mahmud et al. [17] used EPR, WLR, and LRR calculated by a digital shoreline analysis system (DSAS) to compute Lower Meghna River channel erosion due to climate change and human interference. Coastal erosion has become a critical issue in low-lying shore areas, whether rural or urbanized [18]. According to Masselink et al. [19], the strength of coastal erosion is a result of the high intensity and frequent recurrence of extreme events, and SLR has made coastal areas vulnerable and sensitive to these events. Toimil et al. [20] demonstrated that coastal erosion and nourishment of the San Lorenzo shoreline slowed recovery after storm surges and waves that could increase erosion risk. A study done by the natural reserve of Bellocchio, Italy, emphasized the potential of using a dune system as a solution in reducing disasters under current and projected sea level rise scenarios as it reduced coastal erosion, increased the sedimentary budget, and decreased habitat loss [21]. This indicates the significance of preserving the dune system within the coastal area and the magnitude of loss that could happen because coastal erosion is dangerous. In 2017, Hurricane Maria along the coast of Ocean Park, Puerto Rico, resulted in damages estimated at up to $94 billion and caused devastating destruction to the coastline of the island and coastal erosion reaching 1.8 m high [22]. The coast of Vendée, France, has been exposed to various high intensity winter storms, such as Lothar and Martin (1999), Johanna (2008), Xynthia (2010), and Joachim (2011), which resulted in changes in the coastal morphogen [19]. The frequent exposure to these events emphasizes coastal vulnerability and fragility as dunes retreat, the marine ecosystem is affected, and human lives are affected too [23].
In Asia, floods have become common natural disasters owing to the surge in frequency and intensity of flood events [24]. In 2019, 49% of the disaster events and 44% of the deaths on the continent can be attributed to flood events. Asia has had the highest impact of flooding, with 40% of the disaster events, 45% of the deaths, and 74% impact on population [25]. Flooding disasters due to flash floods and coastal floods influence the sustainability, resiliency, and economic development of impacted areas [26]. Extreme rainfall and hurricanes are likely to intensify in East, Southeast, and South Asia. In the Middle East, the precipitation patterns are projected to increase considerably during winter (December, January, and February) [27]. A significant amount of rainfall events are projected to occur from fewer rainfall events, as currently observed [28]. These extreme precipitations can easily overburden the urban infrastructure and environment of Middle Eastern countries, such as Qatar and Oman [29,30].
Al Ruheili and Boluwade [31] indicated that cyclone Kyarr contributed to coastal erosion along the coastal zone of Al Batinah, with an erosion rate of about 40 m/year between 2018 and 2019. The average erosion rate of the Al Batinah coastal area between 2017 and 2020 was 9 m/year, representing 85% of the area. Another study noted that low-elevated areas have a high vulnerability to extreme cyclonic events and SLR; as the majority of Oman’s inhabitants and infrastructure are located along the low elevation areas, the vulnerability is high, especially in the Al-Batinah plain [32]. The sedimentary nature of the Al-Batinah region also makes the coastline highly vulnerable to coastal erosion [33].
As IPCC 2013 projected an escalation in storm intensity and frequency globally, evidence of these events already exists in Oman Governances, such as Gonu, Phet, Mekunu, and Shaheen. As stated by Hereher et al. [34], the eastern side of Oman is susceptible to cyclones and sea level rise. Although, the northern part of Oman is vulnerable to tsunami wave’s inundation, for instance, historically, the northern part of Oman such as the Al-Batinah plain is most exposed area to SLR impacts and storm surges [35]. Therefore, there is a need to alter the current planning practices in Oman to mitigate natural hazard risks and to reduce vulnerabilities for societies, infrastructure, and new developmental projects.
There are two main goals of this study: to use the urban flood risk mitigation model to map and visualize runoff and retention for the study area and to evaluate the usability of the InVEST model for urban planning, as well as to model coastal erosion along the Al Khaboura shoreline as a consequence of the Shaheen cyclone in October 2021, using remote sensing, GIS, and DSAS tools. These models help in accounting for and quantifying coastal damages due to storm surges and will provide insights for designing appropriate responses to mitigate runoff impacts on Al Khaboura city. This research provides an approach to the country about the value of integrating science and modeling in producing informed future urban and development decisions. The previous urban planning practices in the country were done in an ad-hoc manner that showed the vulnerability and risk for communities and infrastructure after each storm or cyclonic event [36]. This approach could be practiced and applied in the neighboring Gulf countries to achieve sustainable and resilient cities in face of climate change consequences.
This study used two models to look at the effect of Shaheen’s consequences along Al Khaboura’s shoreline and the urban flood risk mitigation model to help in investigating the damage to shoreline and inland area. The output of this study has the potential to inform decisions makers in thinking about a smart solution to avoid future damage and destruction.
2. Materials and Methods
2.1. Study Area
History of tropical cyclones over Al Batinah: Between 1880 and 1898, five tropical cyclones appeared in the Oman Sea that directly or indirectly affected the Al Batinah region. The 1890 tropical cyclone resulted in a rainfall of 286 mm, as recorded at the Muscat rainfall station within 24 h. The cyclone resulted in about 727 human losses, and thousands of date trees were uprooted and carried away by the floods [37]. The Shaheen cyclone track showed similarity to the 1890 tropical cyclone track in the Oman Sea [38]. The northern part of Oman, including the Al Batinah region, was hit by several cyclones in recent times including Gonu in June 2007, Phet in June 2010, and Kyarr in October 2019 [39].
Shaheen cyclone: Cyclone Shaheen developed from the remnant of the tropical cyclone Gulab (Bay of Bengal). East of India was hit by Gulab, and after the landfall, the cyclone continued its movement westward and weakened into a low-pressure area centered over the Gujarat region. However, the cyclone progressed through the Indian lands and re-intensified over the Arabian Sea [35]. Between 1 and 4 October 2021, cyclones Gulab and Shaheen made a landfall in the Al Batinah region. The cyclone is considered the second strongest tropical cyclone that has occurred in the Al Batinah region since 1890 [38]. The cyclone was categorized as a category-1 cyclone with a mean wind speed of 75 knots, as measured at Said Bin Sultan Naval Base [38]. Upon the cyclone’s arrival, torrential rains caused by the cyclone’s eyewall resulted in heavy rain. The impact of the cyclone was observed from Al Musonah to Saham (Figure 1).
The Al Suwaiq rainfall station recorded rainfall amounting to 294 mm between 2 and 4 October 2021. Al Khaboura city was also later affected by heavy rainfall and high wind speed [38], and the Al Khaboura rainfall station was flooded. According to the Ministry of Agricultural Fisheries Wealth and Water Resources Authority, the maximum rainfall accumulation was 465 mm and 430 mm in Al-Khaboura and Al Suwaiq rainfall stations, respectively [40]. According to Civil Aviation Authority (2021) [38], the maximum rainfall rate is anticipated to be around 76 and 55 mm/hour during the cyclone, as recorded by the Al Suwaiq rainfall station on 3 October 2021. The heavy rain led to flash flooding that caused more than 12 casualties and urban and infrastructural destruction at private and public properties, including houses, farms, transport infrastructures, electricity, and water supplies. For example, 66,000 buildings were destroyed, of which 67,000 were residential and 22,000 were commercial buildings, in Al Khaboura, Al Suwaiq, and Al Musanah [41]. Further, 362,000 people were affected. An increase in water levels over wetland areas was reported, and owing to the inland flooding and storm surge, the area was heavily eroded (Figure 2).
Al Khaboura is located in North Al Batinah, with inhabitants estimated at around 78,775 in 2020 [42]. On the west, the Al Batinah plain faces the Gulf of Oman and extends for about 300 km. The Al Batinah plain is located at the base of the Western Hajar Mountains [43]. The Al Batinah plain features a gentle slope with a contour line of 5 m just a few kilometers from the coast, with sandy beaches that comprise about 90% of its beaches [44] (Figure 3). The coastal plain of Al Batinah consist of many deltas that are drain from mountainous areas [45]. Because of this, Al Batinah Plain is considered vulnerable to SLR due to climate change, as it is threatened by frequent cyclones and extreme storms, such as Gonu in 2007, Phet in 2010, and Kyar in 2019 [44].
Al Batinah Plain features a large density population and cultivated land in the country [31]. Al Batinah Plain is the second most populated area in Oman after the capital Muscat. The plain has experienced rapid population expansion and developmental activities, such as concentrated urbanization, water desalination, power production plants, harbors, refinery, venues for coastal tourism, ports, infrastructure development, agricultural development, and industrial facilities [44].
2.2. Model and Input Data
The urban flood risk mitigation model is one of the developed software InVEST (Integrated Valuation of Ecosystem Services and Tradeoffs), version 3.9.1, added to Natural Capital Project’s tools (https://naturalcapitalproject.stanford.edu/software/invest (accessed on 10 October 2021)). This model looks at the influence of built-up footprint and green areas on the ecosystem services conveyed by natural capital in the urban context [46]. Kadaverugu et al. [47] indicated that the model shows the ability of cities to minimize the runoff process due to extreme natural events (as Shaheen cyclone) to restrain potential flooding. As rainfall depth is the measure of rain total for a given storm event, this study used two different rainfall intensity values in mm. The model integrated rainfall within a watershed to evaluate the runoff discharge occurring at the following watersheds: Wadi Al Hawasinah, Wadi Mashin and Wadi Shafan, and Al Mayha-Mabrah-Al Hajir System. We used a storm of 5 and 15 min rainfall for 15 returning periods with an intensity of 121.1 and 213.8 mm in the North Al Batinah region [48]. For instance, the influence of green spaces in mitigating flooding was examined in Hyderabad metropolitan city, and the results showed that 44–50% of the rainfall was obstructed by green urban areas and open spaces [47]. In the current study, to produce a runoff surface, both land use type and soil characteristics of the flood-prone areas were considered in the model. For each pixel, the output of the model indicated the runoff reduction (i.e., the amount of retained runoff per pixel compared with the storm volumes) [49].
The urban flood risk mitigation model inputs (Figure 4) were as follows:
- Watershed, which represented the areas of interest. A vector shapefile developed within ArcGIS 10.8.1 delineating the study site used.
- Numeric value of rainfall depth of a single extreme rainfall event (mm) of a selected storm event. These data obtained from literature [48] and the value of rainfall depth were inserted into the model as a variable.
- Land cover map obtained from the Ministry of Housing and Urban Development (http://www.housing.gov.om (accessed on 15 October 2021)). Land cover map was inserted as a variable at the model. Land use data helped to identify the permeability of each land cover class; as a result, a biophysical table was produced for each class of land cover map in association with the hydrologic soil group (HSG) for each class.
- Soil hydrological group roster was obtained from Global Hydrologic Soil Groups Ross et al. [50] (https://daac.ornl.gov/SOILS/guides/Global_Hydrologic_Soil_Group.html (accessed on 15 October 2021). These data were used to explore the land-texture and its infiltration coefficient following the Soil Taxonomy classification criteria to examine soil conductivity.
- Biophysical table, user-created to include the corresponding value of each land use class in association with HSGs and its association with runoff curve number (CN) (Table 1).
The amount of rainfall value in this model is in mm. Rosenzweig et al. [51] stated that the model does not consider the spatial temporality of the rainfall events. The model considers the start of flooding as the point when saturation is reached in the soil (saturated hydraulic conductivity). The interaction between land use and soil features through the curve number (CN) approach helps in evaluating runoff within the urban context [52]. The urban flood risk mitigation-InVEST model was used the CN method, which could be considered a useful tool in determining runoff in the watershed. The model uses soil hydraulic conductivity and land-use data.
Various studies have used the CN method to estimate runoff within the urban context. For instance, a study conducted in in Amol city, Iran, used CN in predicting flood-prone areas. The CN was used as one of the parameters in predicting runoff, and the output of their study helped in creating flood risk reduction guidelines for the city [53]. Small watersheds within urban areas, such as Shenzhen city in southern China, have been evaluated using the CN method [54]. Despite the limitations of the need for adjustment to fit the complex natural environment in other countries, CN is the most implemented method in estimating surface runoff, and researchers could adjust according to their context for optimal results [55].
2.3. Data Input
Coastal change rate: This study obtained three scenes from SENTINEL-2A and SENTINEL-2B images from the Earth Explorer website (http://www.earthexplorer.usgs.gov (accessed on 16 October 2021) for the study timeframe (Table 2). The images were geometrically and radiometrically corrected to UTM zone 40 using ArcGIS 10.8.1 and ENVI 5.3 software.
Digitization for the study area shoreline was done using ArcGIS 10.8.1. The digitized shoreline was validated with the field survey conducted at an interval between 20 and 30 m of the Al Khaboura coast on 22 October 2021 Trimble® TDC150 GNSS handheld receiver, providing maximum productivity and positioning accuracy on the field (https://geospatial.trimble.com (22 October 2022)).
The digital shoreline analysis system (DSAS), version 5.1, was developed by the United States Geological Society. DSAS works within the Esri geographic information system (ArcGIS) software. The software calculates rate-of-change statistics for time series data of vector shoreline [56,57]. DSAS create transects that are perpendicular to the baseline at the specified user spacing along the shoreline [16,29]. A theoretical baseline omits transects at a specified distance from the latest shoreline of the study and, subsequently, computes the convergence of every coastline with each transect [56]. This study created a theoretical baseline at 1800 m distance using geographic information system (GIS) 10.8.1 for both onshore and offshore shorelines. DSAS then documented the rate of change for the shoreline through calculating the distance between the baseline and the shoreline locations. This study had about 437 transects that were placed perpendicular to the baseline at 20 m intervals [16] along the coastline, and the uncertainty of the reported rate was considered with a confidence interval (ECI) of 95%. The statistics table created as an outcome of DSAS including all calculated distances created, such as end point rate (EPR), linear regression rate (LRR), weighted linear regression (WLR), and net shoreline movement (NSM), as well as statistical data used in this study to record coastline changes (Figure 5).
3. Results and Discussions
3.1. Estimated Runoff Distribution
The runoff process of both flow retention and volume of surface runoff was provided as an output of the InVEST model for four watersheds (Figure 6). Table 1 shows the model’s output for each of the four watersheds in the area of North Al Batinah, Oman. Indices on runoff retention and runoff in percentage, the absolute volume of retained water in cube meters, the relative values of runoff retention volume, and runoff volume per extension of each basin (cube meters/hectare) for each watershed are shown in Table 2. All the values are provided for two rain events: 121.1 and 213.8 mm (5 and 15 min duration) intensity for a 25-year return period [52].
In terms of runoff retention index with a 121.1 mm rainfall event, three watersheds showed a similar retention capacity value of 38% (Wadi Shafan, Al Mayha-Mabrah-Al Hajir System, and Wadi Mashin). By comparison, the highest value of retention was 44% of a basin (Wadi Al Hawasinah) (Table 1). With 213.8 mm of rain intensity, a similar pattern was observed as with the 121.1 mm intensity. The lowest and highest retention values were 25% and 29%, respectively, belonging to the same watersheds as stated above. The model also calculated the absolute value of total runoff retention volume in cubic meters: the watershed of Wadi Shafan showed the highest amount of about 559 million m3, whereas the Al Mayha-Mabrah-Al Hajir System watershed showed the lowest value of retention of about 204 million m3 (Table 1). The absolute value of flood volume is proportional to the watershed’s dimension, as it denotes the cumulative runoff retention volume. Although the Al Mayha-Mabrah-Al Hajir System is the biggest watershed with an area of 145,030 ha, it showed the lowest flood volume discharge. This could be related to environmental factors and characteristics, such as having the largest bare land consisting of sandy soil, while the smallest watershed is Wadi Mashin, with an area of 27,459 ha.
The model output showed that the highest retention volume per hectare value (529.61 m3/ha) was in the Wadi Al Hawasinah watershed, while the runoff volume per hectare has the lowest value equal to 674.12 m3/ha. This indicates the performance effectiveness of each watershed. Table 1 illustrates the relative retention capacity (cube meters) and relative runoff (cube meters) per hectare. Wadi Al Hawasinah watershed showed the lowest runoff index (56% or 71%), which suggests that the volume in relation to 121.1 mm (or 213.8 mm) rain events could not be retained by the soil. This confirmed the disastrous destruction that took place in the Al Khaboura city during Shaheen cyclone. The city is located within the Wadi Al Hawasinah, Wadi Mashin, and Wadi Shafan watersheds, and during the cyclone, the area was immensely disturbed and resulted in huge infrastructural damage due to flash wadi flooding and storm surge (Figure 7).
By contrast, for the 121.1 mm rainfall intensity, the Wadi Mashin and Wadi Shafan watersheds had the lowest runoff retention volumes of 460.39 and 461.44 m3/ha, respectively. Both watersheds performed weakly in retaining volume, although the runoff volume per hectare was not the same.
A spatial distribution of the runoff volume (m3), calculated per area (ha) for the four watersheds at the 121.1 mm rainfall intensity, is shown in Figure 8. The red color shows the largest amount of runoff per ha, while the blue color shows the lowest amount of runoff per ha. By observing the spatial distribution of the runoff volume per hectare for the four watersheds and others, it is obvious how this relative index highlights the non-functioning situation, especially for the Wadi Al Hawasinah watershed.
Overall, the output of this model showed the distribution of runoff retention capacity for each watershed for rainfall events of 121.1 and 213.8 mm. The study demonstrated the influence of land cover on runoff distribution. For example, a portion of the Al Mayha-Mabrah-Al Hajir System is featured by the B soil hydrologic group (moderately low runoff (50–90% sand and 10–20% clay) [58]. As in most places in Oman, clay is rare in this watershed. The output of the model exhibited a spatial distribution per pixel of the runoff retention index to overcome this limitation. These outputs help in visualizing and identifying the need for an increase in the retention capacity to expand resilience to flash floods. Figure 9 shows the runoff retention index per pixel by considering the 121.1 mm rainfall intensity for the Wadi Al Hawasinah watershed.
In this study area, the runoff retention index ranged from 0 (low retention) to 0.6 (high retention) and was overlayed to the building footprint. The urban district with residential, governmental, and commercial activities showed values of 0.6% of runoff retention capacity, while some industrial sites showed a low retention capacity.
3.1.1. Watershed Resilience to Flash Flood
Urban flood risk mitigation-InVEST output estimated runoff retention spatially, which can support strategies and solutions to reduce runoff for specific sites. The spatial distribution of runoff and the estimate of the volume of water that flows during both rainfall intensities are vital for city resilience to flash floods. The model ranked resilience to flash floods based on five classes at the watershed level. Low resilience refers to high values of runoff from rainfall events, while high resilience refers to smaller runoff values (Figure 8). Many researchers have considered urban planning as a tool to help mitigate and reduce flooding by minimizing or mitigating the impact of extreme rainfall events [59]. For instance, implementing green infrastructure can provide an alternative approach toward sustainable cities in mitigating flood hazards in urban areas [60].
The Al Khaboura case and the amount of damage associated with the Shaheen cyclone is a good example of poor urban planning and topographical factors that led to the flooding damage. The runoff retention map in Figure 10 shows that the upstream area has a low resiliency, in addition to the availability of dams that overtopped during Shaheen, which created a high destruction to the area. The city planner could improve their urban planning practices and learn a lesson from Shaheen’s aftermath to avoid future consequences for this city and other cities in Oman.
3.1.2. Al Kahboura Shoreline Erosion
Many studies have used DSAS (EPR, WLR, and LRR) to quantify shoreline erosion and deposition patterns.
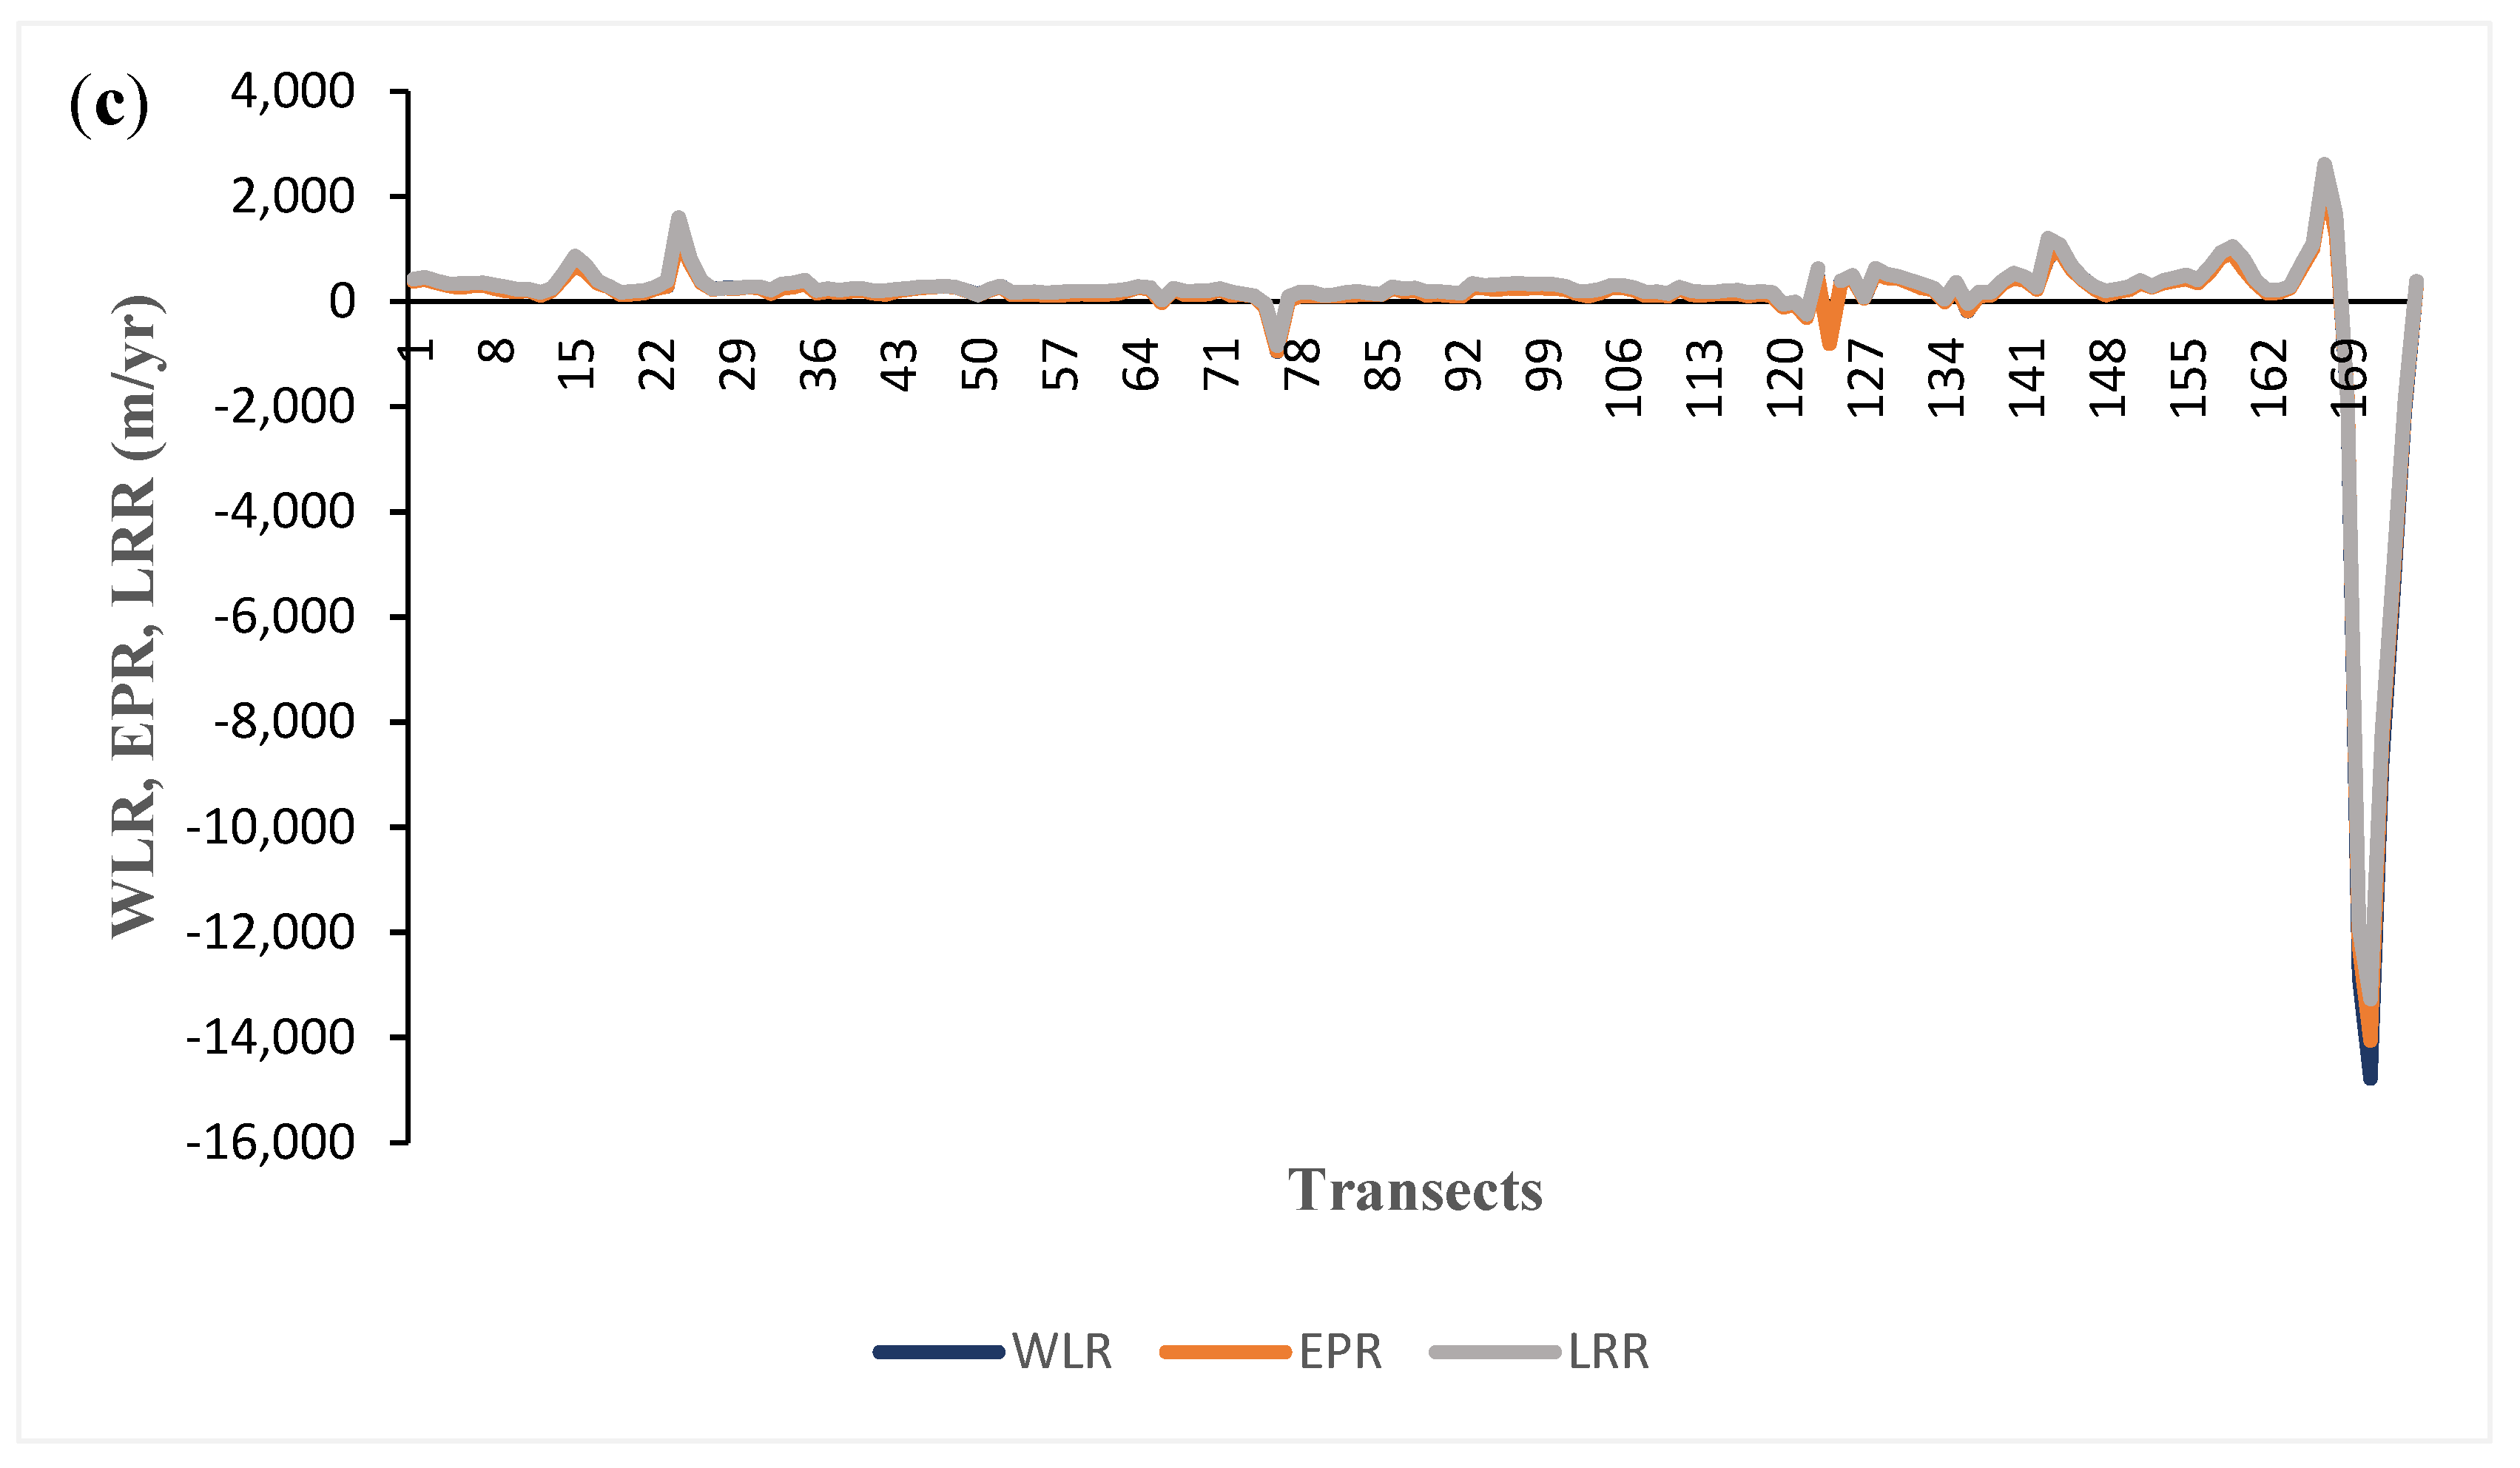
Here, we computed coastal erosion due to the Shaheen cyclone in October 2021 along part of the Al Khaboura shoreline using the DSAS tool. The results showed a geomorphological alteration of the shoreline in some parts of Khaboura’s shoreline. After applying the DSAS tool, 437 transects were used to compute shoreline changes in the study area. The rate of shoreline change for the Al Khaboura coast has been utilized using LRR [16] (Figure 11). Erosion was observed in 29 transects representing 6.68% of the Al Khaoura shoreline, while accretion was detected in 405 transects representing 93.32%. A 66% statistically significant accretion took place on the Al Khaoura shoreline. EPR indicates the mean rate of shoreline change (m/y); an average rate of −16.33 m/y was recorded in this study. However, this study only focused on 2021 Shaheen cyclonic events in a short period from September to November 2021. These observations prove that extreme events contribute to and accelerate coastal erosion [29,31]. The results also showed that the shoreline was eroded by 7.82% and had a sediment deposition of 92.18%. The maximum erosion distance was −1428.5 m, while the maximum accretion distance was 225.05 m, as shown by NSM. WLR indicates the mean rate of shoreline change (m/y), with an average rate of 6.79 m/y recorded in this study. Erosion was observed in 33 transects representing 7.6% of the Al Khaoura shoreline, whereas accretion was detected in 401 transects representing 92.4% of the shoreline, with a 17.3% statistically significant accretion taking place in the Al Khaoura shoreline. The maximum value of accretion was 2429.6 m/yr. This indicated that a huge amount of sediments was transported by flash wadi flooding to the downstream area. This is significant because it indicates the power of streams in nourishing and enriching the downstream area, especially if there is no dam constructed within the watershed. In a study led by dos Santos et al. [61] on the Madeira River in southwestern Brazilian Amazon, the diversity of palms was reduced by 61.3% owing to the construction of the Jirau reservoir, which blocked sediment transport along the river banks.
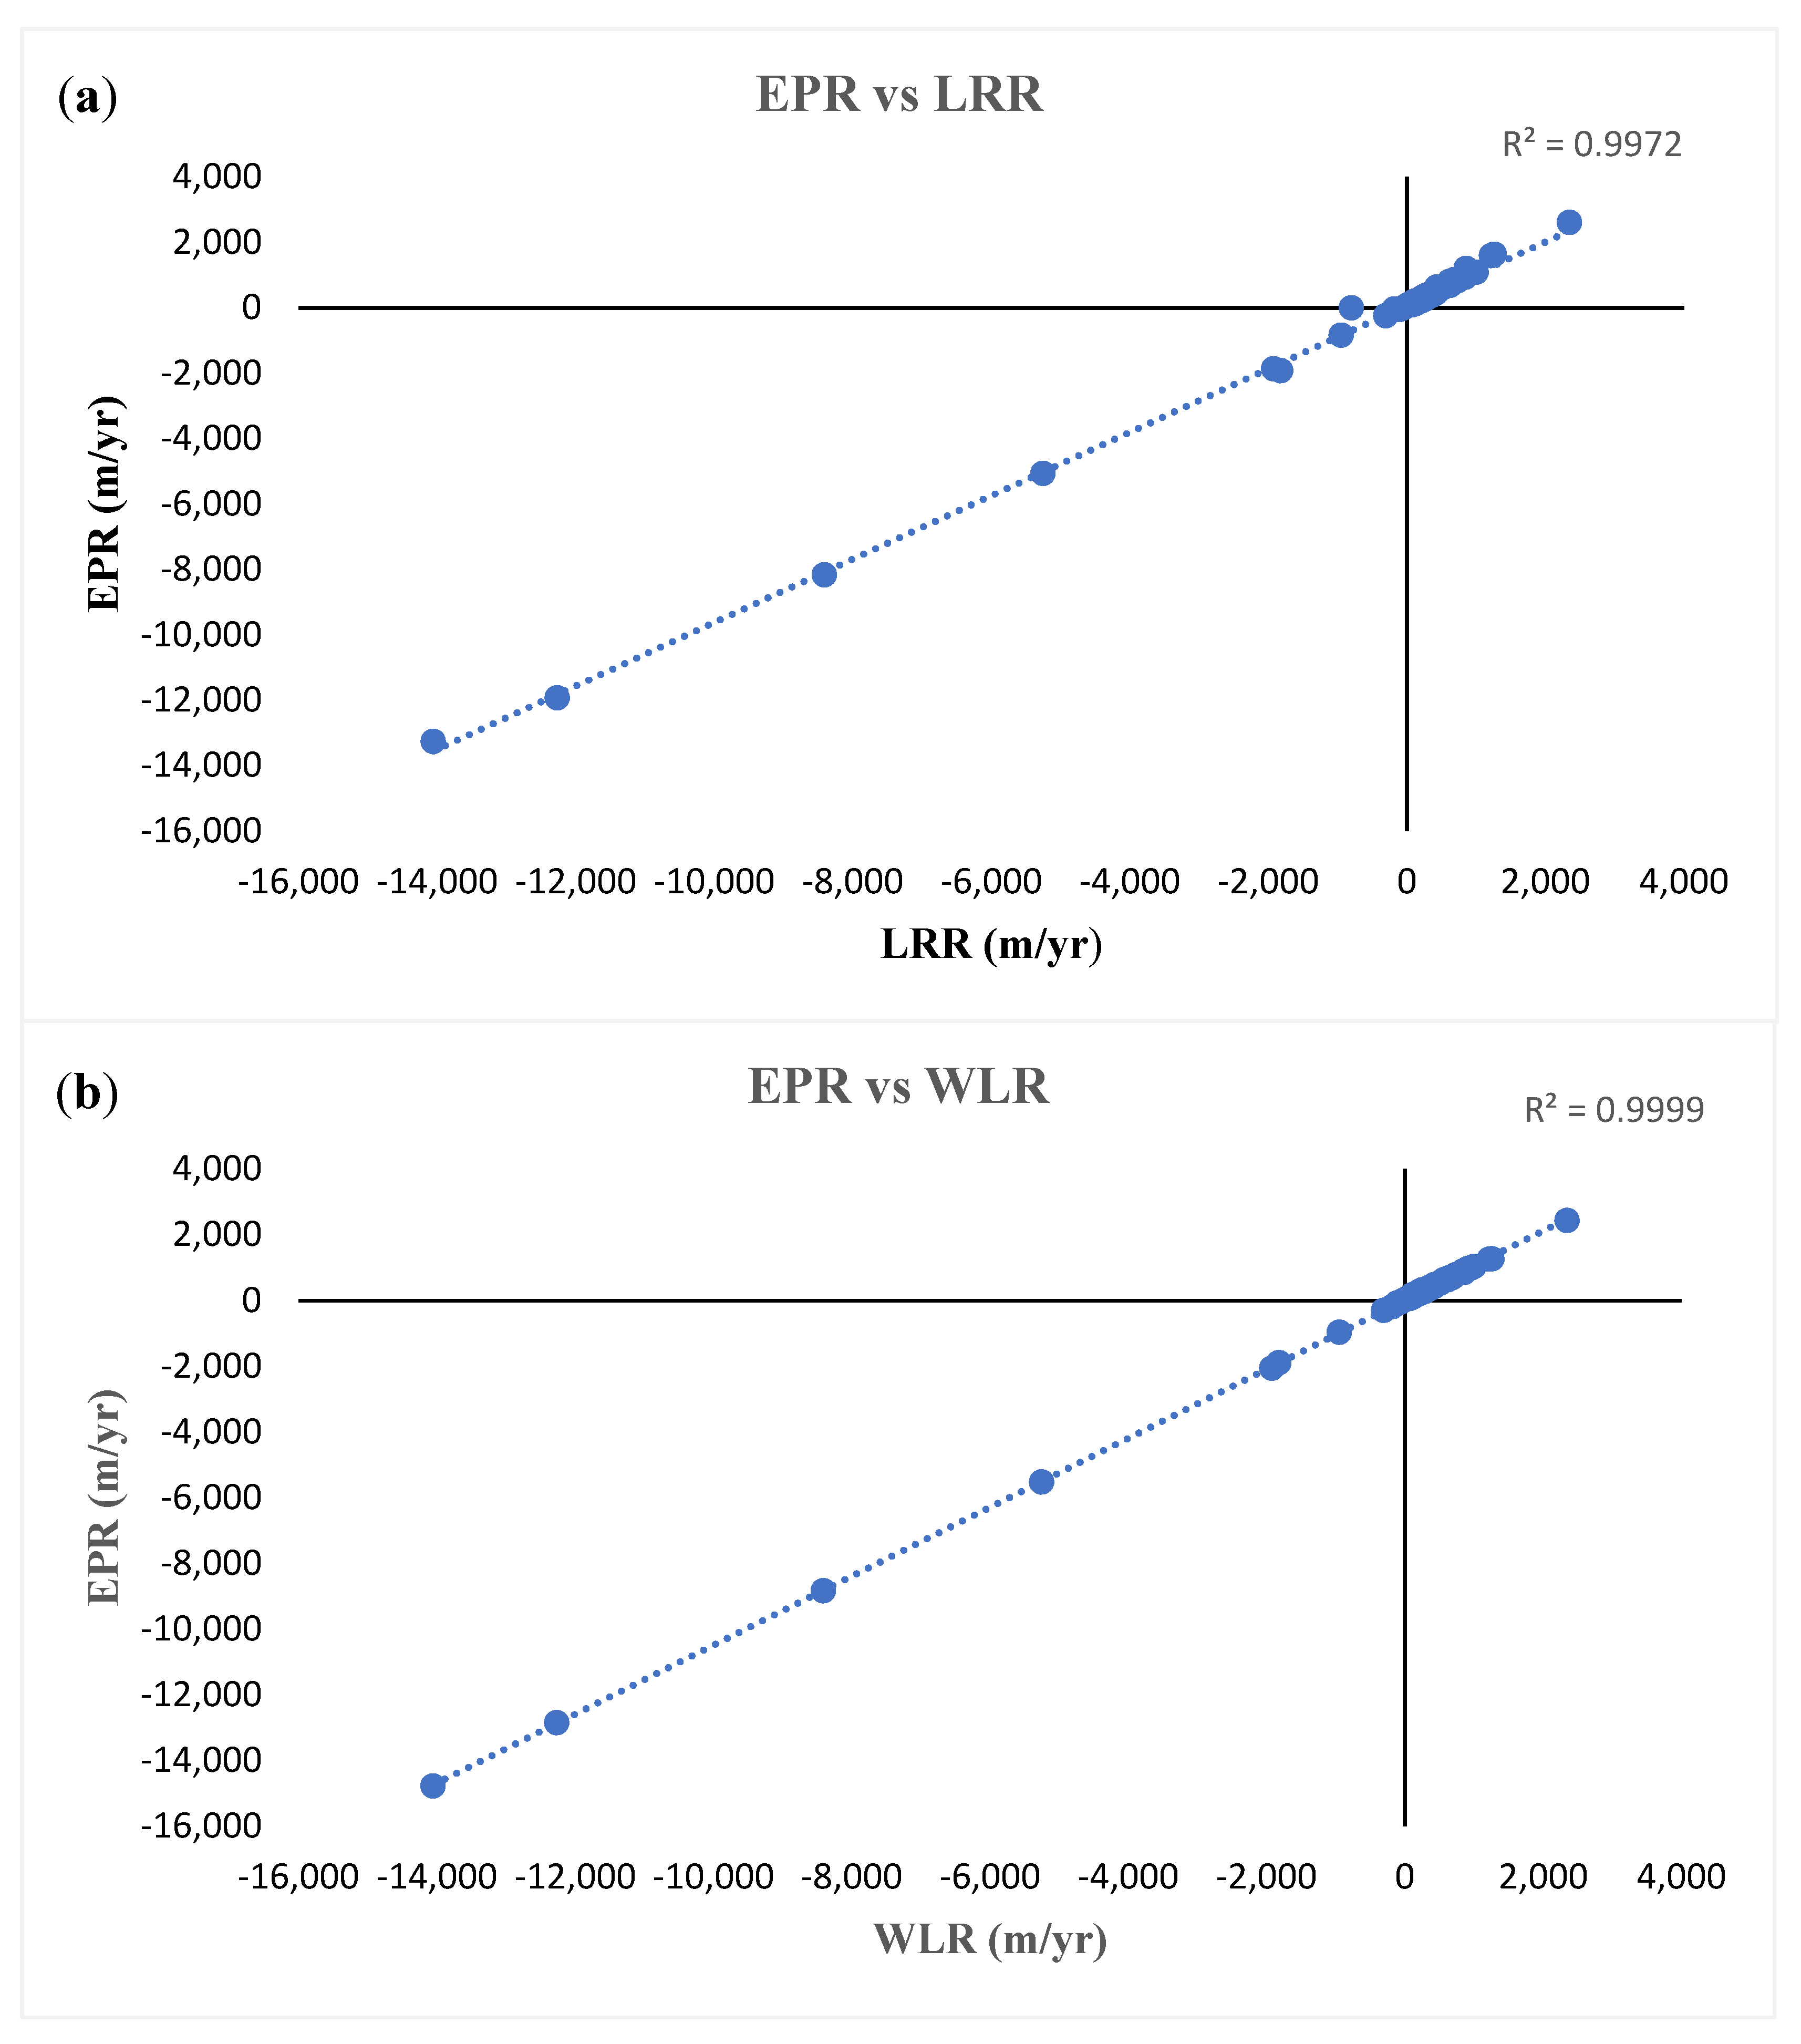
The values of EPR, LRR, and WLR suggest similar outcomes for the Al Khaboura shoreline. These statistical metrics showed that a huge amount of sediment deposition has occurred during the short timeframe of the Shaheen event. The R-squared values for EPR versus LRR and EPR versus WLR illustrated a strong correlation between the dependent and independent variables, recorded as 0.991 and 0.994, respectively (Figure 12). The wetland area showed a significant amount of erosion based on the three metrics—EPR, LRR, and WLR. Therefore, some protection efforts should be made along the Al Khaboura coastal line to reduce coastal erosion and wetland and habitat losses. Many studies have documented the benefits of marsh and wetland areas in protecting the coastal area from erosion, such as the green shore implemented in Qualicum Bay, Vancouver Island [62]. An integrated coastal zone management could serve as a good tool in balancing environmental, economic, social, and recreational goals in an effort to accomplish sustainability for current and future generations [63,64]. This is because armoring shoreline and beach nourishment are costly processes proven to be short-term solutions; they are not capable of protecting the coastal area from erosion due to human and natural phenomena, as in the case of North Carolina beaches [65,66].
4. Conclusions
This research examined the aftermath of Shaheen in Al Khaboura city using DSAS to quantify shoreline erosion. We also employed urban flood risk mitigation-InVEST, representing a first attempt to adopt the InVEST flood model as a tool to inform and guide urban planning to manage and mitigate flash flood events due to extreme rainfall in a complex urban area.
The findings of this study could help raise awareness by providing applied knowledge around the InVEST model employment in planning. The DSAS and InVEST models provided spatially explicit runoff and erosion estimates that enabled us to analyze and evaluate watershed vulnerabilities to flash flooding and coastal erosion at the watershed level. With the integration of land use and soil hydrological conductivity maps, we could assess the runoff within the model.
The study also showed the consequences of storm surge owing to the extreme events of the Shaheen cyclone (short period) on the Al Khaboura shoreline, which recorded an average erosion rate of 16.33 m/y and accretion for 6.68% of its coastal line due to sedimentation transport from wadi flash flooding. The model output could be used by coastal engineers, planners, and coastal zone management authorities to develop appropriate management plans and coastal zone regulations to mitigate damage and destruction from such events with similar geographic conditions.
In general, both the InVEST and DSAS models performed well and could be considered a useful tool for urban planners to define adaptive strategies for both coastal and inland planning to manage flash wadi flooding and storm surge events in urban cities. However, an in-depth evaluation of hydrological aspects and other factors in the context of climate change adaptation should be considered in future urban vulnerability analyses.
Author Contributions
This research was solely written, conceptualize and analyzed by the author A.M.A. All authors have read and agreed to the published version of the manuscript.
Funding
This research received no funding.
Informed Consent Statement
Not applicable.
Data Availability Statement
Data availability will provided on a reasonable request.
Conflicts of Interest
There is no conflict of interest.
References
- [IPCC] International Panel on Climate Change. Summary for policymakers. In Climate Change 2013: The Physical Science Basis. Contribution of Working Group I to the Fifth Assessment Report of the Intergovernmental Panel on Climate Change; Stocker, T.F., Qin, D., Plattner, G.-K., Tignor, M., Eds.; Cambridge University: Cambridge, UK, 2013; pp. 1–30. [Google Scholar] [CrossRef]
- [IPCC] International Panel on Climate Change. Climate change: Impacts, adaptation, and vulnerability. Part A: Global and sectoral aspects. In Contribution of Working Group II to the Fifth Assessment Report of the Intergovernmental Panel on Climate Change; Field, C.B., Barros, V.R., Dokken, D.J., Eds.; Cambridge University: Cambridge, UK, 2014; p. 1150. [Google Scholar]
- Gissi, E.; Manea, E.; Mazaris, A.D.; Fraschetti, S.; Almpanidou, V.; Bevilacqua, S.; Katsanevakis, S. A review of the combined effects of climate change and other local human stressors on the marine environment. Sci. Total Environ. 2021, 755, 142564. [Google Scholar] [CrossRef] [PubMed]
- Fan, X.; Miao, C.; Duan, Q.; Shen, C.; Wu, Y. Future climate change hotspots under different 21st century warming scenarios. Earths Future 2021, 96, e2021EF002027. [Google Scholar] [CrossRef]
- Allen, M.; Dube, O.P.; Solecki, W.; Aragón-Durand, F.; Cramer, W.; Humphreys, S.; Mulugetta, Y. Global Warming of 1.5 °C. An IPCC Special Report on the Impacts of Global Warming of 1.5 °C above Pre-Industrial Levels and Related Global Greenhouse Gas Emission Pathways, in the Context of Strengthening the Global Response to the Threat of Climate Change, Sustainable Development, and Efforts to Eradicate Poverty. Sustainable Development, and Efforts to Eradicate Poverty. 2018. Available online: https://www.ipcc.ch/site/assets/uploads/sites/2/2019/05/SR15_Citation.pdf (accessed on 10 November 2021).
- Kundu, S.K.; Santhanam, H. A report on the impacts of cyclone Yaas over a fish landing center vulnerable to cyclonic storms and natural hazards–Talsari, Northern Odisha. Local Environ. 2021, 26, 1043–1050. [Google Scholar] [CrossRef]
- Fernando, N.; Amaratunga, D.; Haigh, R.; Wise, B.; Prasanna, J.; Jayasinghe, N. Life two years after relocation: Status quo of natural hazard induced displacement and relocation in Kegalle, Sri Lanka. In Multi-Hazard Early Warning and Disaster Risks; Springer: Berlin/Heidelberg, Germany, 2021; pp. 3–25. [Google Scholar]
- Luo, S.; Cai, F.; Liu, H.; Lei, G.; Qi, H.; Su, X. Adaptive measures adopted for risk reduction of coastal erosion in the People’s Republic of China. Ocean Coast. Manag. 2015, 103, 134–145. [Google Scholar] [CrossRef]
- Špitalar, M.; Gourley, J.J.; Lutoff, C.; Kirstetter, P.E.; Brilly, M.; Carr, N. Analysis of flash flood parameters and human impacts in the US from 2006 to 2012. J. Hydrol. 2014, 519, 863–870. [Google Scholar] [CrossRef]
- Alipour, A.; Ahmadalipour, A.; Moradkhani, H. Assessing flash flood hazard and damages in the southeast United States. J. Flood Risk Manag. 2020, 13, e12605. [Google Scholar] [CrossRef]
- Munich, R.E. NatCatSERVICE. 2020. Available online: https://natcatservice.munichre.com/ (accessed on 12 November 2021).
- Cannon, C.; Gotham, K.F.; Lauve-Moon, K.; Powers, B. The climate change double whammy: Flood damage and the determinants of flood insurance coverage, the case of post-Katrina New Orleans. Clim. Risk Manag. 2020, 27, 100–210. [Google Scholar] [CrossRef]
- Luijendijk, A.; Hagenaars, G.; Ranasinghe, R.; Baart, F.; Donchyts, G.; Aarninkhof, S. The state of the world’s beaches. Sci. Rep. 2018, 8, 6641. [Google Scholar] [CrossRef]
- Coca-Domínguez, O.; Ricaurte-Villota, C. Validation of the hazard and vulnerability analysis of coastal erosion in the Caribbean and pacific coast of Colombia. J. Mar. Sci. Eng. 2019, 7, 260. [Google Scholar] [CrossRef] [Green Version]
- Abel, N.; Gorddard, R.; Harman, B.; Leitch, A.; Langridge, J.; Ryan, A.; Heyenga, S. Sea level rise, coastal development and planned retreat: Analytical framework, governance principles and an Australian case study. Environ. Sci. Policy 2011, 14, 279–288. [Google Scholar] [CrossRef]
- Baig, M.R.I.; Ahmad, I.A.; Shahfahad; Tayyab, M.; Rahman, A. Analysis of shoreline changes in Vishakhapatnam coastal tract of Andhra Pradesh, India: An application of digital shoreline analysis system (DSAS). Ann. GIS 2020, 26, 361–376. [Google Scholar] [CrossRef]
- Mahmud, M.I.; Mia, A.J.; Islam, M.A.; Peas, M.H.; Farazi, A.H.; Akhter, S.H. Assessing bank dynamics of the Lower Meghna River in Bangladesh: An integrated GIS-DSAS approach. Arab. J. Geosci. 2020, 13, 602. [Google Scholar] [CrossRef]
- Martínez, C.; Contreras-López, M.; Winckler, P.; Hidalgo, H.; Godoy, E.; Agredano, R. Coastal erosion in central Chile: A new hazard? Ocean Coast. Manag. 2018, 156, 141–155. [Google Scholar] [CrossRef]
- Masselink, G.; Castelle, B.; Scott, T.; Dodet, G.; Suanez, S.; Jackson, D.; Floc’h, F. Extreme wave activity during 2013/2014 winter and morphological impacts along the Atlantic coast of Europe. Geophys. Res. Lett. 2016, 43, 2135–2143. [Google Scholar] [CrossRef]
- Toimil, A.; Losada, I.J.; Hinkel, J.; Nicholls, R.J. Using quantitative dynamic adaptive policy pathways to manage climate change-induced coastal erosion. Clim. Risk Manag. 2021, 33, 100–342. [Google Scholar] [CrossRef]
- Fernández-Montblanc, T.; Duo, E.; Ciavola, P. Dune reconstruction and revegetation as a potential measure to decrease coastal erosion and flooding under extreme storm conditions. Ocean Coast. Manag. 2020, 188, 105075. [Google Scholar] [CrossRef]
- Mendez-Tejeda, R.; Pérez-Valentín, K.A.; Barreto-Orta, M. Impact of extreme weather events on the beaches of Puerto Rico: The case of ocean park, San Juan. Am. J. Mar. Sci. 2020, 8, 1–5. [Google Scholar] [CrossRef]
- Robin, N.; Billy, J.; Castelle, B.; Hesp, P.; Laporte-Fauret, Q.; Lerma, A.N.; Michalet, R. Beach-dune recovery from the extreme 2013-2014 storms erosion at Truc Vert Beach, Southwest France: New insights from ground-penetrating radar. J. Coast. Res. 2020, 95, 588–592. [Google Scholar] [CrossRef]
- Takeuchi, K.; Chavoshian, A.; Simonovic, S.P. Floods: From risk to opportunity. J. Flood Risk Manag. 2018, 11, e12046. [Google Scholar] [CrossRef] [Green Version]
- Centre for Research on the Epidemiology of Disasters. Natural Disasters 2019: Now Is the Time to Not Give Up. Brussels: CRED. 2020. Available online: https://www.cred.be/publications (accessed on 9 November 2021).
- Al Ruheili, A.; Dahm, R.; Radke, J. Wadi flood impact assessment of the 2002 cyclonic storm in Dhofar, Oman under present and future sea level conditions. J. Arid. Environ. 2019, 165, 73–80. [Google Scholar] [CrossRef]
- IPCC. Summary for policymakers. In Climate Change 2021: The Physical Science Basis. Contribution of Working Group I to the Sixth Assessment Report of the Intergovernmental Panel on Climate Change; Masson-Delmotte, V., Zhai, P., Pirani, A., Connors, S.L., Péan, C., Berger, S., Caud, N., Chen, Y., Goldfarb, L., Gomis, M.I., et al., Eds.; Cambridge University Press: Cambridge, UK, 2021; in press. [Google Scholar]
- IPCC. Climate Change and Land: An IPCC Special Report on Climate Change, Desertification, Land Degradation, Sustainable Land Management, Food Security, and Greenhouse Gas Fluxes in Terrestrial Ecosystems; Shukla, P.R., Skea, J., Buendia, E.C., Masson-Delmotte, V., Pörtner, H.-O., Roberts, D.C., Zhai, P., Slade, R., Connors, S., van Diemen, R., et al., Eds.; 2019; in press; Available online: https://spiral.imperial.ac.uk/bitstream/10044/1/76618/2/SRCCL-Full-Report-Compiled-191128.pdf (accessed on 20 November 2021).
- Salimi, M.; Al-Ghamdi, S.G. Climate change impacts on critical urban infrastructure and urban resiliency strategies for the Middle East. Sustain. Cities Soc. 2020, 54, 101948. [Google Scholar] [CrossRef]
- Al Ruheili, A.; Radke, J. Visualization of 2002 storm surge along the coast of Dhofar, case study of Oman. Environ. Dev. Sustain. 2018, 22, 501–517. [Google Scholar] [CrossRef]
- Al Ruheili, A.M.; Boluwade, A. Quantifying coastal shoreline erosion due to climatic extremes using remote-sensed estimates from Sentinel-2A data. Environ. Processes 2018, 8, 1121–1140. [Google Scholar] [CrossRef]
- Hereher, M.E. Assessment of infrastructure vulnerability to tsunamis upon the coastal zone of Oman using GIS. Geosciences 2020, 10, 175. [Google Scholar] [CrossRef]
- Kwarteng, A.Y.; Al-Hatrushi, S.M.; Illenberger, W.K.; McLachlan, A.; Sana, A.; Al-Buloushi, A.S.; Hamed, K.H. Beach erosion along Al Batinah coast, Sultanate of Oman. Arab. J Geosci. 2016, 9, 85. [Google Scholar] [CrossRef]
- Hereher, M.; Al-Awadhi, T.; Al-Hatrushi, S.; Charabi, Y.; Mansour, S.; Al-Nasiri, N.; El-Kenawy, A. Assessment of the coastal vulnerability to sea level rise: Sultanate of Oman. Environ. Earth Sci. 2020, 79, 369. [Google Scholar] [CrossRef]
- Al-Sariri, T. Coastal Zone and Climate Change Management in Oman. Ph.D. Thesis, University of Surrey, Guildford, UK, 2014. [Google Scholar]
- Richthofen, A.V. A Critical Reconstruction of Modern Urban Settlement Patterns in Muscat and Al Batinah Based on Military Maps. J. Oman Stud. 2018, 19, 85–100. [Google Scholar] [CrossRef]
- Membery, D. Monsoon tropical cyclones: Part 2. Weather 2002, 57, 246–255. [Google Scholar] [CrossRef]
- Civil Aviation Authority (CAA). Directorate General of Meteorology; Preliminary Report on Tropical Cyclone 1–4 October 2021; Department of Research and Development: Muscat, Oman, 2021.
- Tyagi, A.; Bandyopadhyay, B.K.; Mohapatra, M.; Goel, S.; Kumar, N.; Mazumdar, A.B.; Khole, M. A Report on the Super Cyclonic Storm “GONU” during 1–7 June 2007; India Meteorological Department, Government of India: New Delhi, India, 2011; p. 82.
- Al Slami, K.A. Shaheen Cyclone [Oman News]. Sultanate of Oman, TV. 2021. Available online: https://wwitv.com/tv_channels/52.htm (accessed on 4 October 2021).
- Al Nassriya, Z. Solidarity Eases Impacts of Shaheen. 2021. Available online: https://www.omanobserver.om/article/1109858/oman/community/solidarity-eases-impact-of-shaheen (accessed on 21 November 2021).
- National Center for Statistical Information (NCSI). Census 2020. Available online: https://www.ncsi.gov.om/Elibrary/LibraryContentDoc/bar_final%20pop%20new%20copy_74cdfa39-1584-4195-ae46-226bf73742b7.pdf (accessed on 19 November 2021).
- Al-Hatrushi, S.M. Monitoring of the shoreline change using remote sensing and GIS: A case study of Al Hawasnah tidal inlet, Al Batinah coast, Sultanate of Oman. Arab. J. Geosci. 2013, 6, 1479–1484. [Google Scholar] [CrossRef]
- Al-Hatrushi, S.; Ramadan, E.; Charabi, Y. Application of geo-processing model for a quantitative assessment of coastal exposure and sensitivity to sea level rise in the Sultanate of Oman. Am. J. Clim. Chang. 2015, 4, 379. [Google Scholar] [CrossRef] [Green Version]
- Lotfy, A. Using GIS and remote sensing to map coastline changes of Wedam Alsahel area, Batinah, Oman between 1998 and 2008. In Proceedings of the 33rd Asian Conference on Remote Sensing, Pattaya, Thailand, 26–30 November 2012. [Google Scholar]
- Hamel, P.; Guerry, A.D.; Polasky, S.; Han, B.; Douglass, J.A.; Hamann, M.; Daily, G.C. Mapping the benefits of nature in cities with the InVEST software. Npj Urban Sustain. 2021, 1, 25. [Google Scholar] [CrossRef]
- Kadaverugu, A.; Rao, C.N.; Viswanadh, G.K. Quantification of flood mitigation services by urban green spaces using InVEST model: A case study of Hyderabad city, India. Model Earth Syst. Environ. 2021, 7, 589–602. [Google Scholar] [CrossRef]
- Al-Lmalkiyah, S.H. Development of Regional Intensity-Duration-Frequency (idf) Curves for Sultanate of Oman. Ph.D. Thesis, Sultan Qaboos University, Muscat, Oman, 2018. [Google Scholar]
- Choudri, B.S.; Baawain, M.; Ahmed, M. Review of water quality and pollution in the coastal areas of Oman. J. Poll Res. 2015, 34, 429–439. [Google Scholar]
- Ross, C.W.; Prihodko, L.; Anchang, J.Y.; Kumar, S.S.; Ji, W.; Hanan, N.P. Global Hydrologic Soil Groups (HYSOGs250m) for Curve Number-Based Runoff Modeling; ORNL DAAC: Oak Ridge, TN, USA, 2018. [Google Scholar] [CrossRef]
- Rosenzweig, B.; Ruddell, B.L.; McPhillips, L.; Hobbins, R.; McPhearson, T.; Cheng, Z.; Kim, Y. Developing knowledge systems for urban resilience to cloudburst rain events. Environ. Sci. Policy 2019, 99, 150–159. [Google Scholar] [CrossRef]
- Lian, H.; Yen, H.; Huang, J.C.; Feng, Q.; Qin, L.; Bashir, M.A.; Liu, H. CN-China: Revised runoff curve number by using rainfall-runoff events data in China. Water Res. 2020, 177, 115767. [Google Scholar] [CrossRef] [PubMed]
- Darabi, H.; Haghighi, A.T.; Mohamadi, M.A.; Rashidpour, M.; Ziegler, A.D.; Hekmatzadeh, A.A.; Kløve, B. Urban flood risk mapping using data-driven geospatial techniques for a flood-prone case area in Iran. Hydro. Res. 2020, 51, 127–142. [Google Scholar] [CrossRef] [Green Version]
- Xu, D.; Ouyang, Z.; Wu, T.; Han, B. Dynamic trends of urban flooding mitigation services in Shenzhen, China. Sustainability 2020, 12, 4799. [Google Scholar] [CrossRef]
- Scionti, F.; Miguez, M.G.; Barbaro, G.; De Sousa, M.M.; Foti, G.; Canale, C. Integrated methodology for Urban Flood Risk Mitigation in cittanova, Italy. J. Water Resour. Plan. Manag. 2018, 144, 1–10. [Google Scholar] [CrossRef]
- Thieler, E.R.; Himmelstoss, E.A.; Zichichi, J.L.; Ergul, A. Digital Shoreline Analysis System (DSAS) Version 4.0—An ArcGIS Extension for Calculating Shoreline Change (ver. 4.4, July 2017); Open-File Report; U.S. Geological Survey: Reston, VA, USA, 2009. Available online: https://pubs.er.usgs.gov/publication/ofr20081278 (accessed on 11 October 2021).
- Himmelstoss, E.A.; Henderson, R.E.; Kratzmann, M.G.; Farris, A.S. Digital Shoreline Analysis System (DSAS) Version 5.0 User Guide; Open-File Report; U.S. Geological Survey: Reston, VA, USA, 2018; pp. 79–110.
- Pelorosso, R. Modeling and urban planning: A systematic review of performance-based approaches. Sustain. Cities Soc. 2020, 52, 2210–6707. [Google Scholar] [CrossRef]
- Li, L.; Uyttenhove, P.; Van Eetvelde, V. Planning green infrastructure to mitigate urban surface water flooding risk–A methodology to identify priority areas applied in the city of Ghent. Landsc. Urban Plan. 2020, 194, 103703. [Google Scholar] [CrossRef]
- Lourenco, I.B.; de Oliveira AK, B.; Marques, L.S.; Barbosa AA, Q.; Verol, A.P.; Magalhaes, P.C.; Miguez, M.G. A framework to support flood prevention and mitigation in the landscape and urban planning process regarding water dynamics. J. Clean. Prod. 2020, 277, 122983. [Google Scholar] [CrossRef]
- dos Santos, E.A.; Medeiros, M.B.; Ferreira, E.J.; Simon, M.F.; Oliveira, W.L.; Costa, F.R. Palm distribution patterns in the southwestern Brazilian Amazon: Impact of a large hydroelectric dam. For. Ecol. Manag. 2020, 463, 1–10. [Google Scholar] [CrossRef]
- Evadzi, P.I.; Zorita, E.; Hünicke, B. Quantifying and predicting the contribution of sea-level rise to shoreline change in Ghana: Information for coastal adaptation strategies. J. Coast. Res. 2017, 33, 1283–1291. [Google Scholar] [CrossRef]
- Das, S.K.; Sajan, B.; Ojha, C.; Soren, S. Shoreline change behavior study of Jambudwip island of Indian Sundarban using DSAS model. Egypt. J. Remote Sens. Space Sci. 2021, 24, 961–970. [Google Scholar] [CrossRef]
- Miller, A.; Blair, D.G.; Dubyna, J. Shoreline Erosion and Sea Level Rise. 2020. Available online: https://oceanwatch.ca/howesound/wp-content/uploads/sites/2/2020/08/OceanWatch-HoweSoundReport2020-CC-ShorelineErosion.pdf (accessed on 1 November 2021).
- Cantasano, N.; Caloiero, T.; Pellicone, G.; Aristodemo, F.; De Marco, A.; Tagarelli, G. Can ICZM Contribute to the Mitigation of Erosion and of Human Activities Threatening the Natural and Cultural Heritage of the Coastal Landscape of Calabria? Sustainability 2021, 13, 1122. [Google Scholar] [CrossRef]
- Landry, C.E.; Shonkwiler, J.S.; Whitehead, J.C. Economic values of coastal erosion management: Joint estimation of use and existence values with recreation demand and contingent valuation data. J. Environ. Econ. Manag. 2020, 103, 1–17. [Google Scholar] [CrossRef]
Figure 1.
Shaheen’s impacted cities in the Al-Batinah region. Background map ESRI open street map.

Figure 2.
Wetland erosion due to storm surge and inland flooding.

Figure 3.
Al Khaboura study site location.
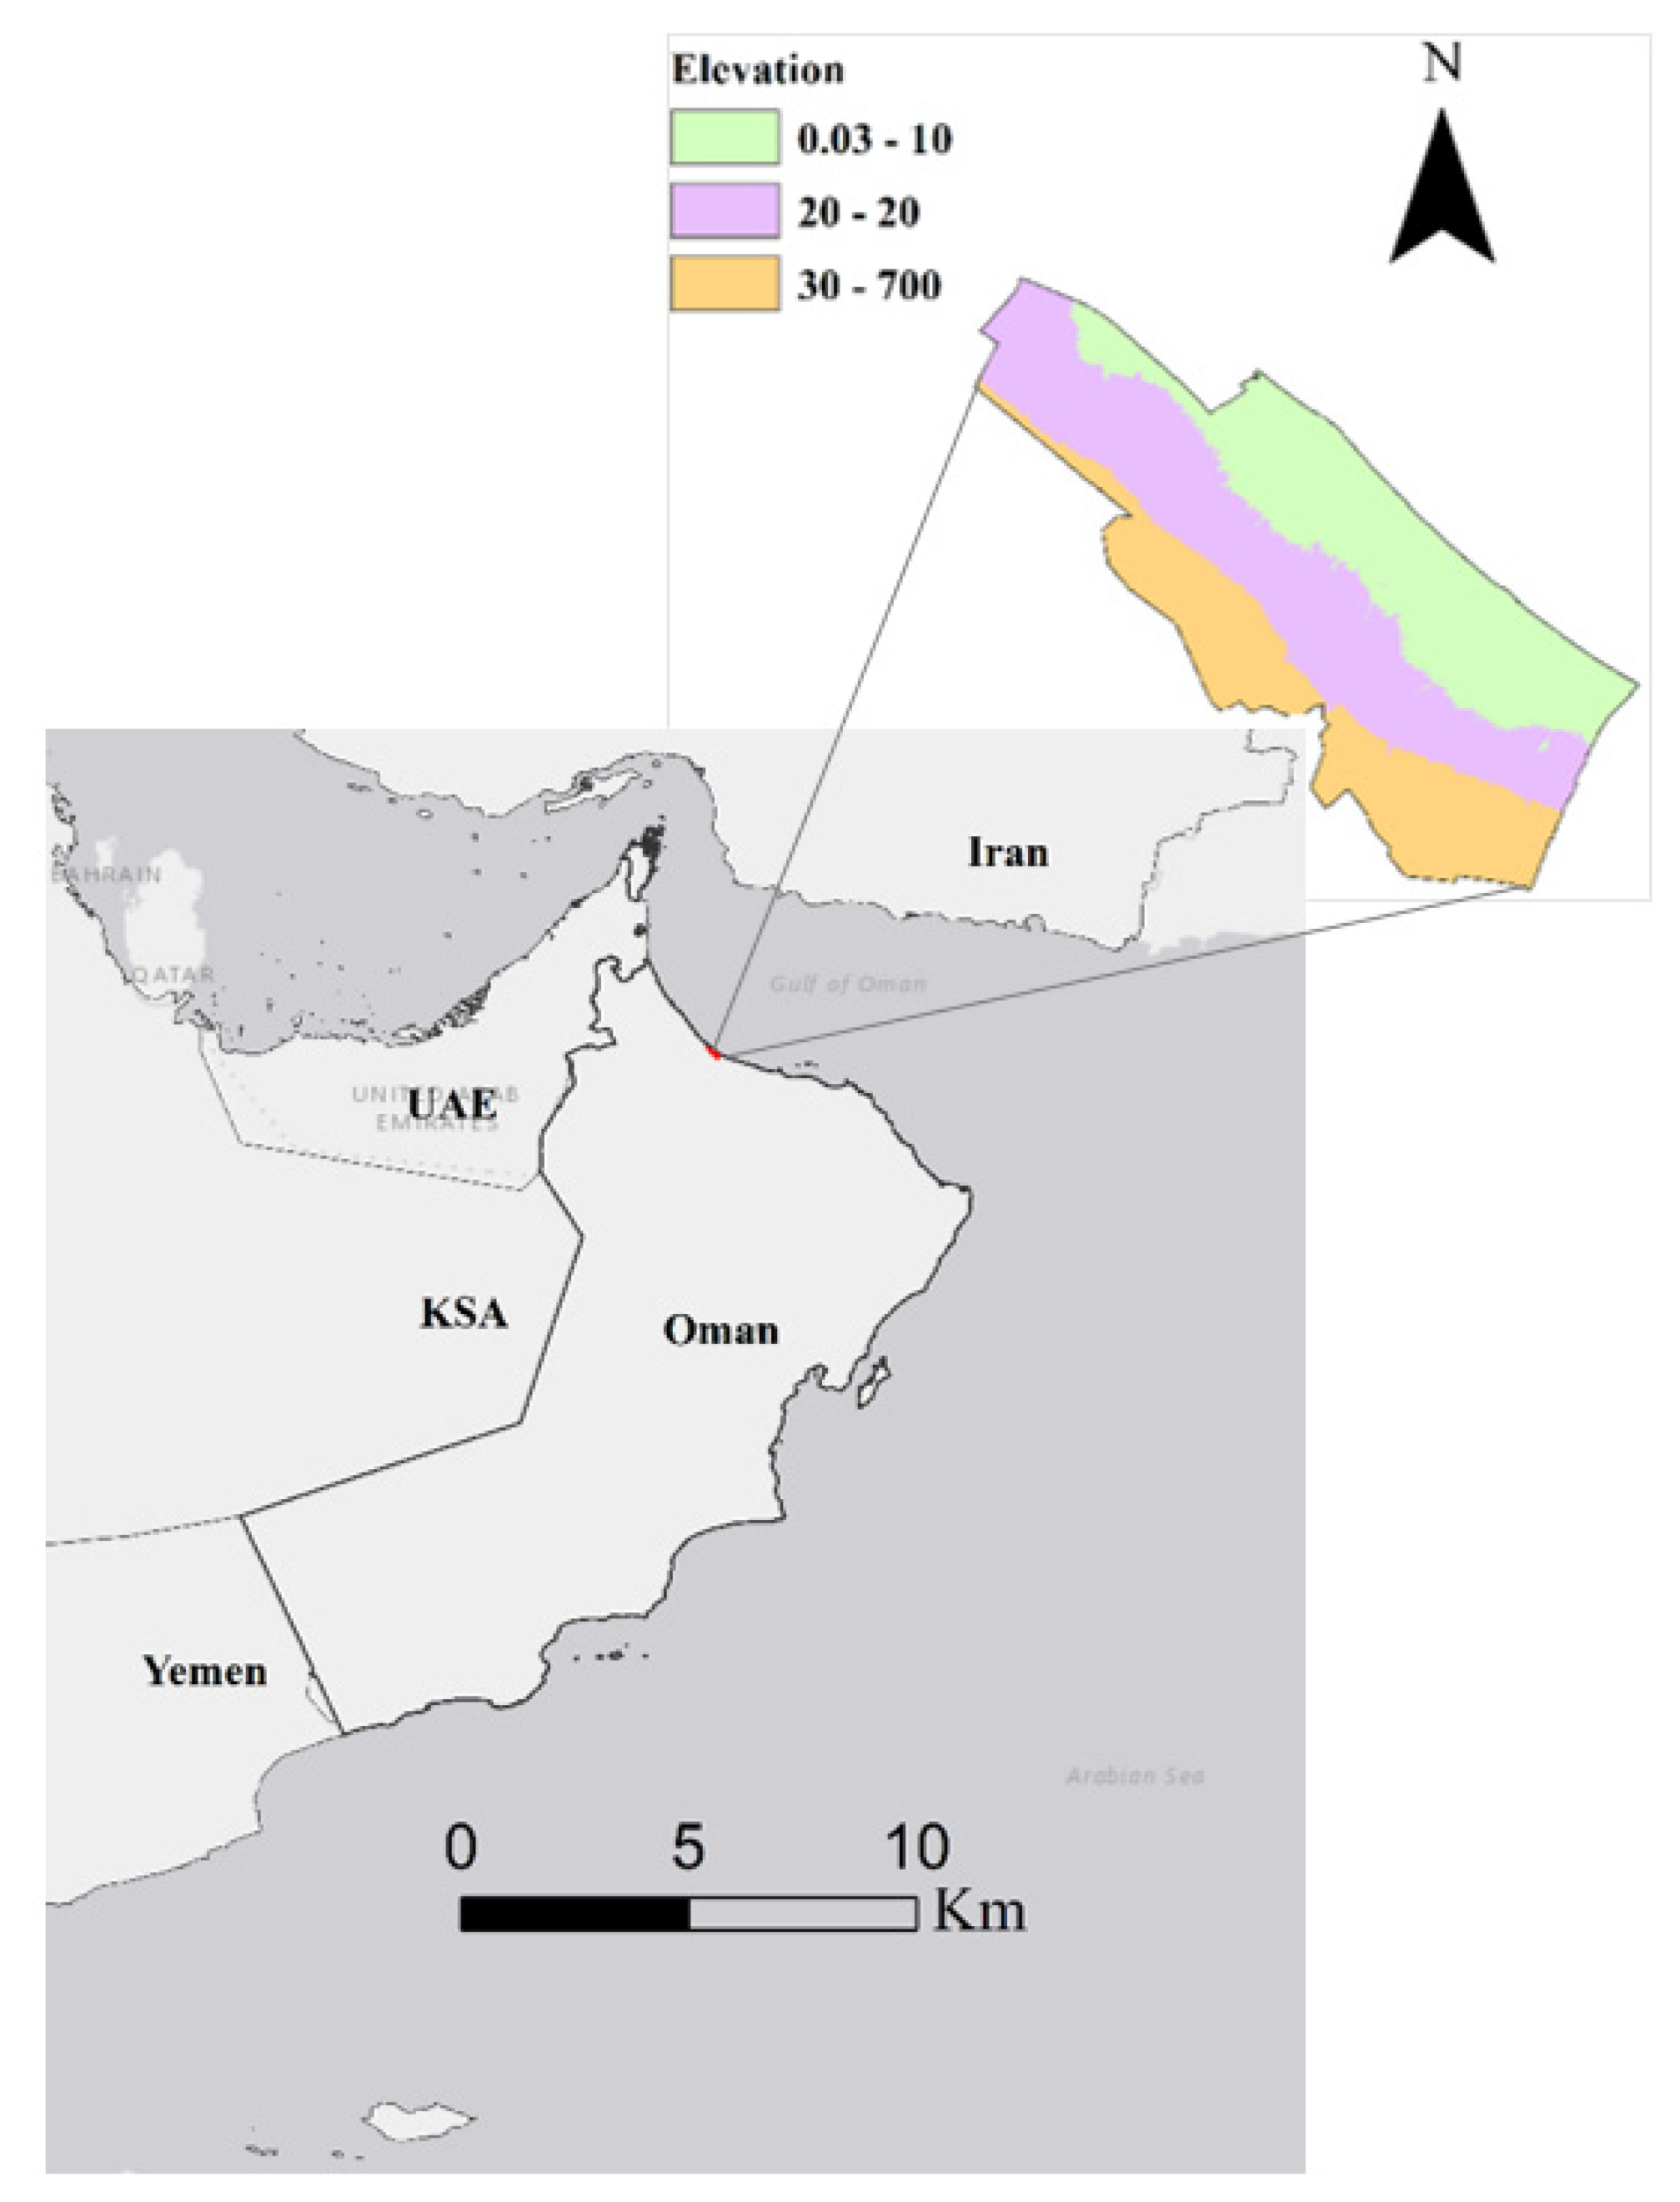
Figure 4.
The framework of the urban flood risk mitigation model input.
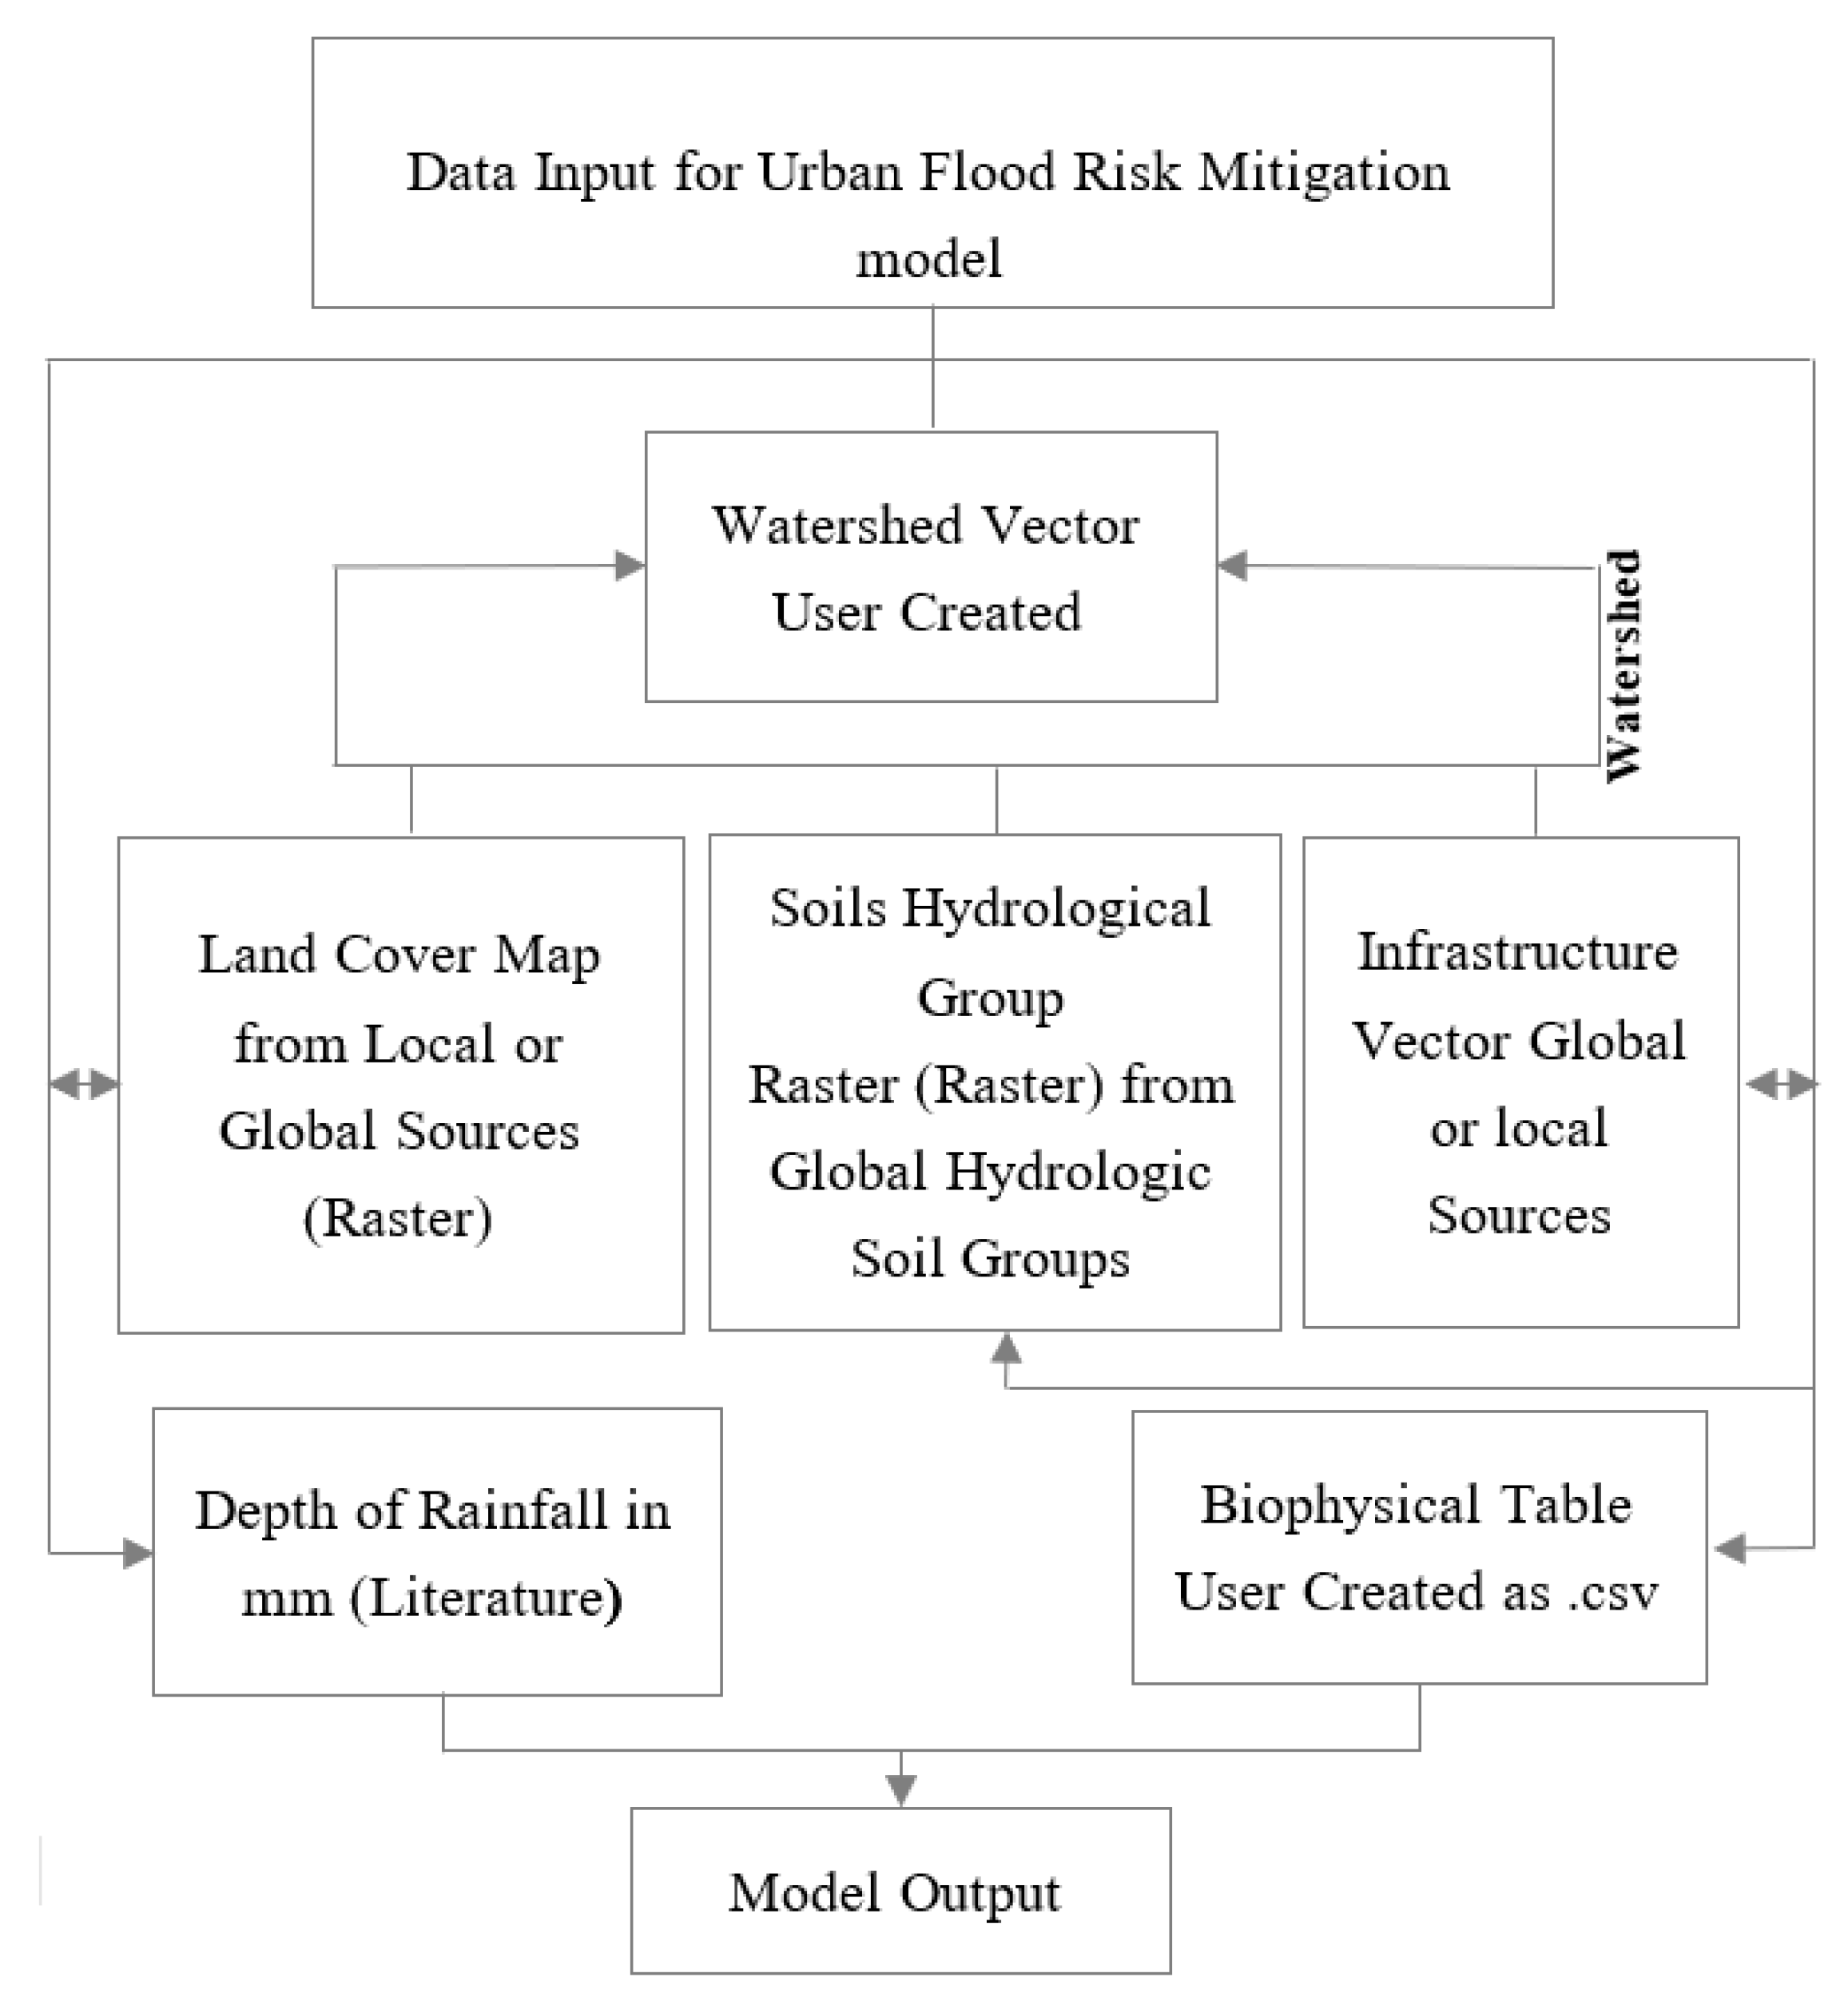
Figure 5.
The framework of the DSAS approach.
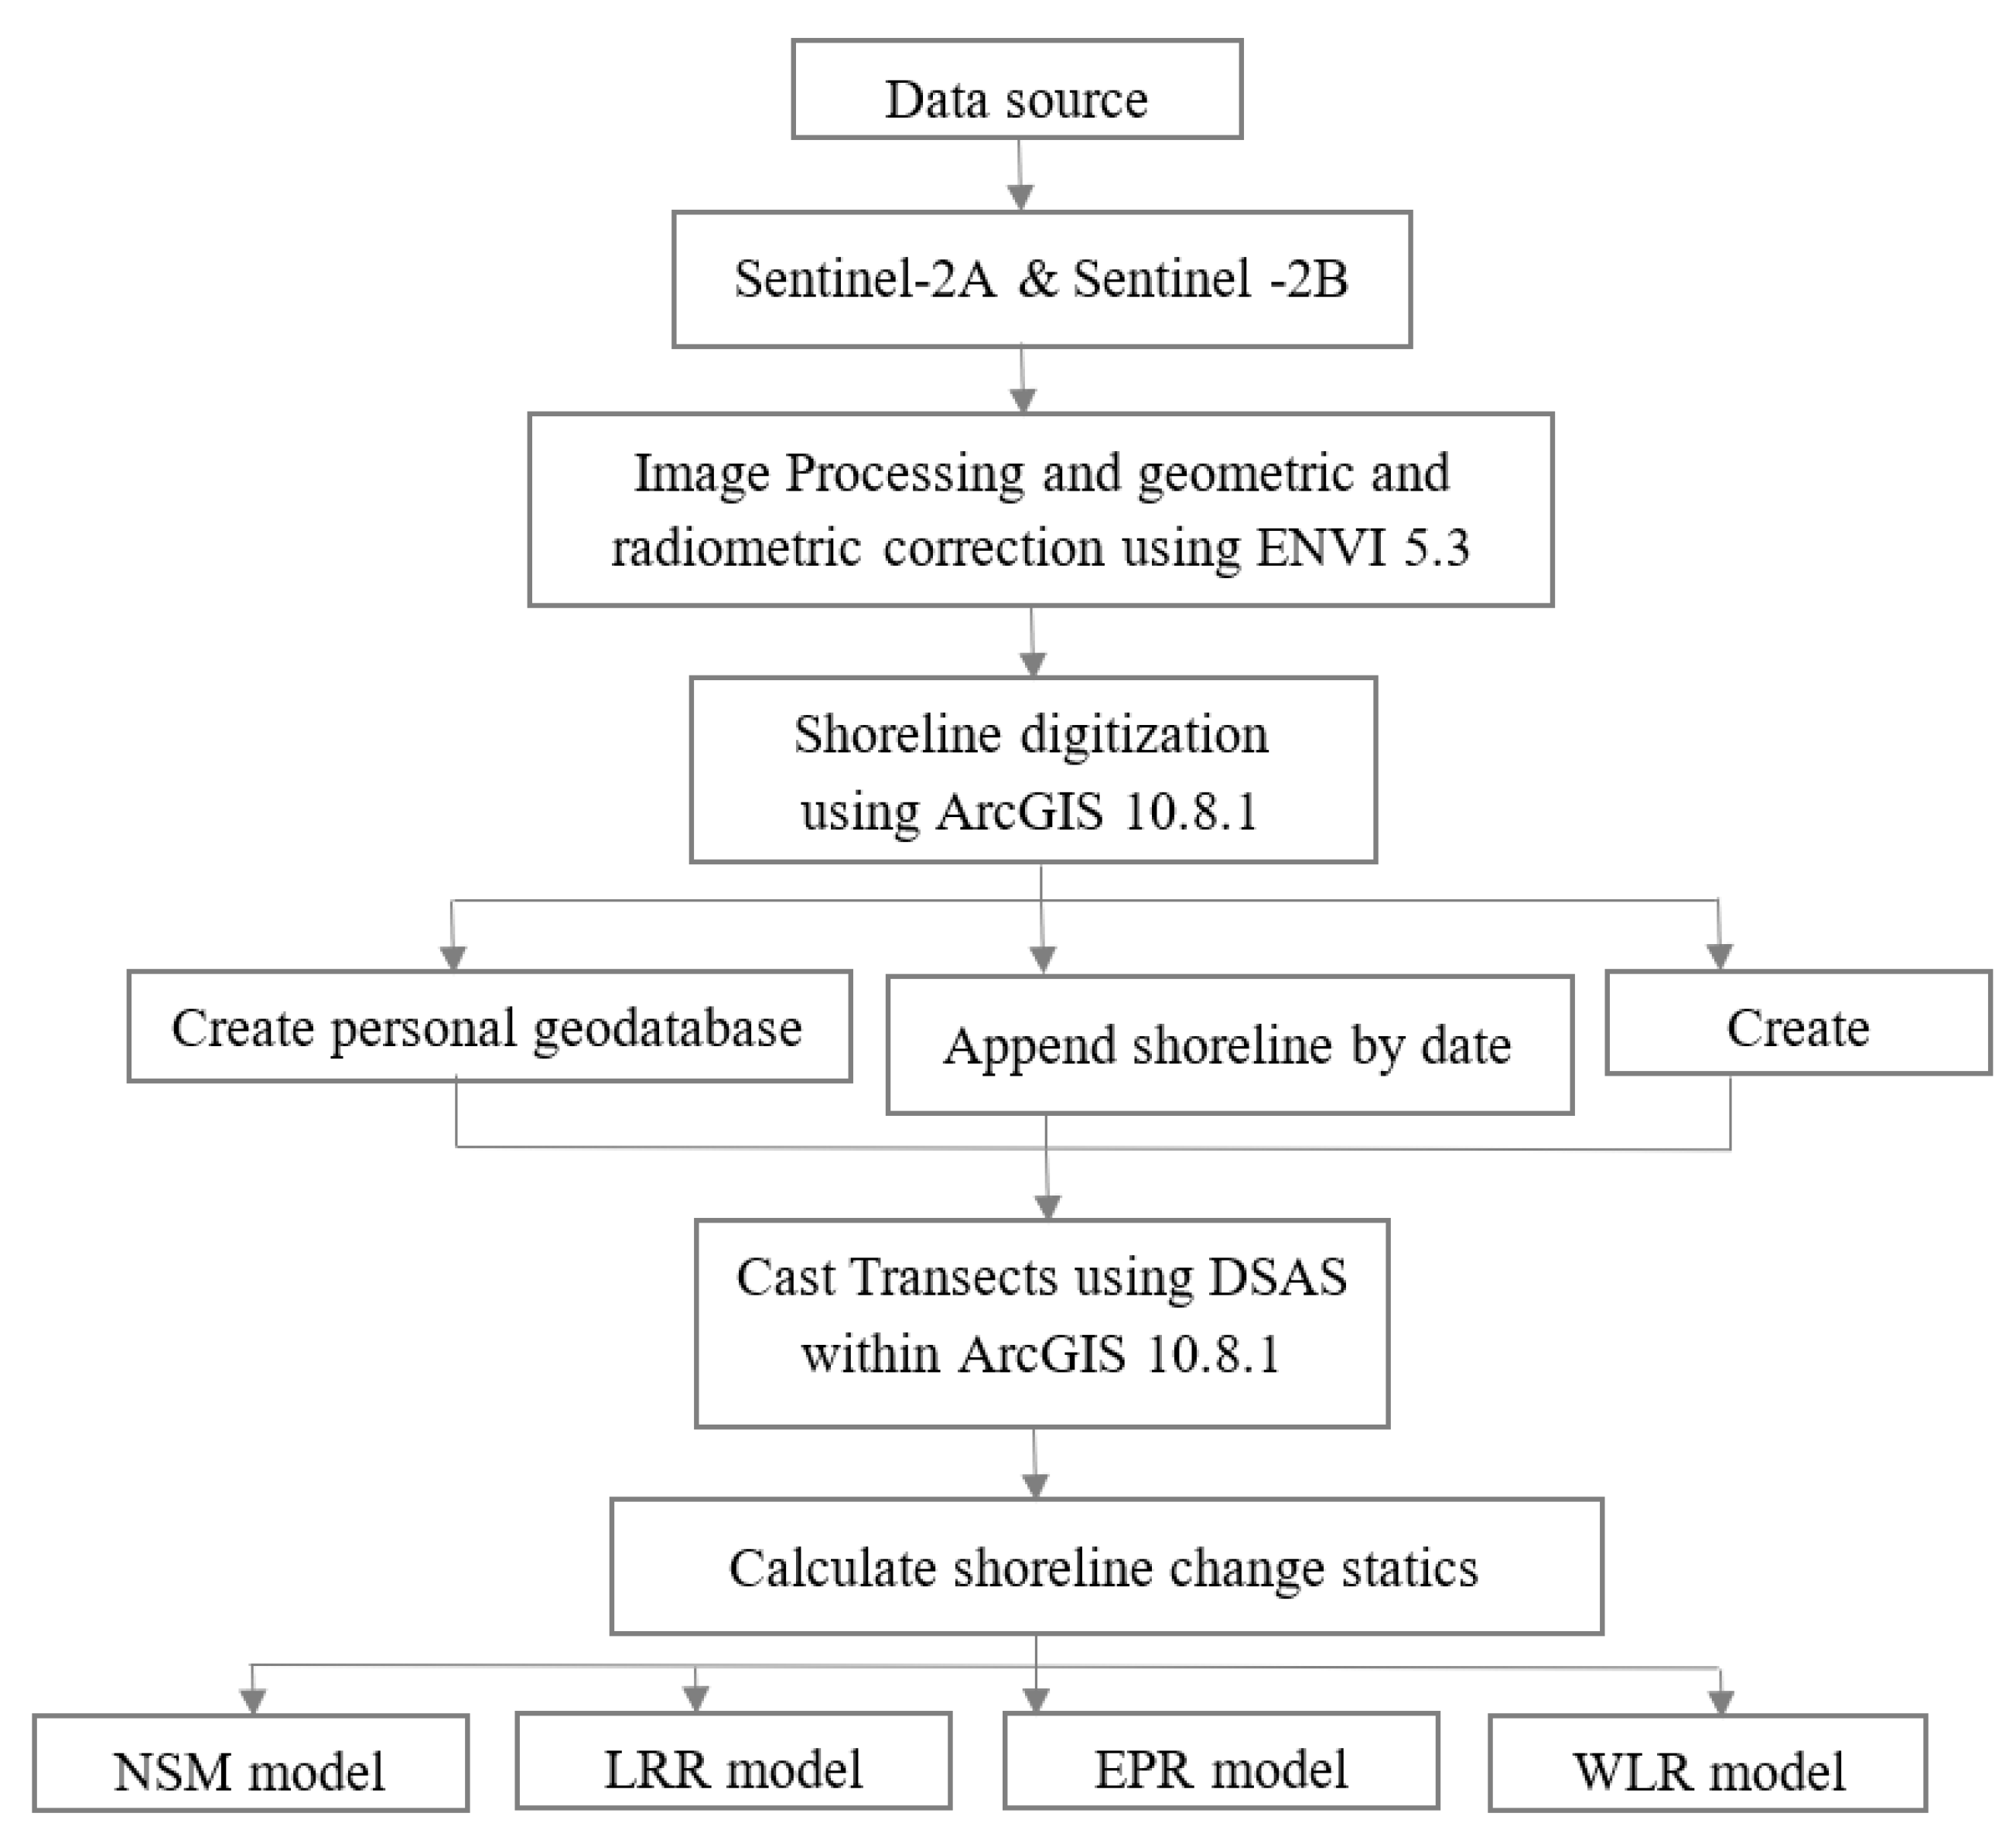
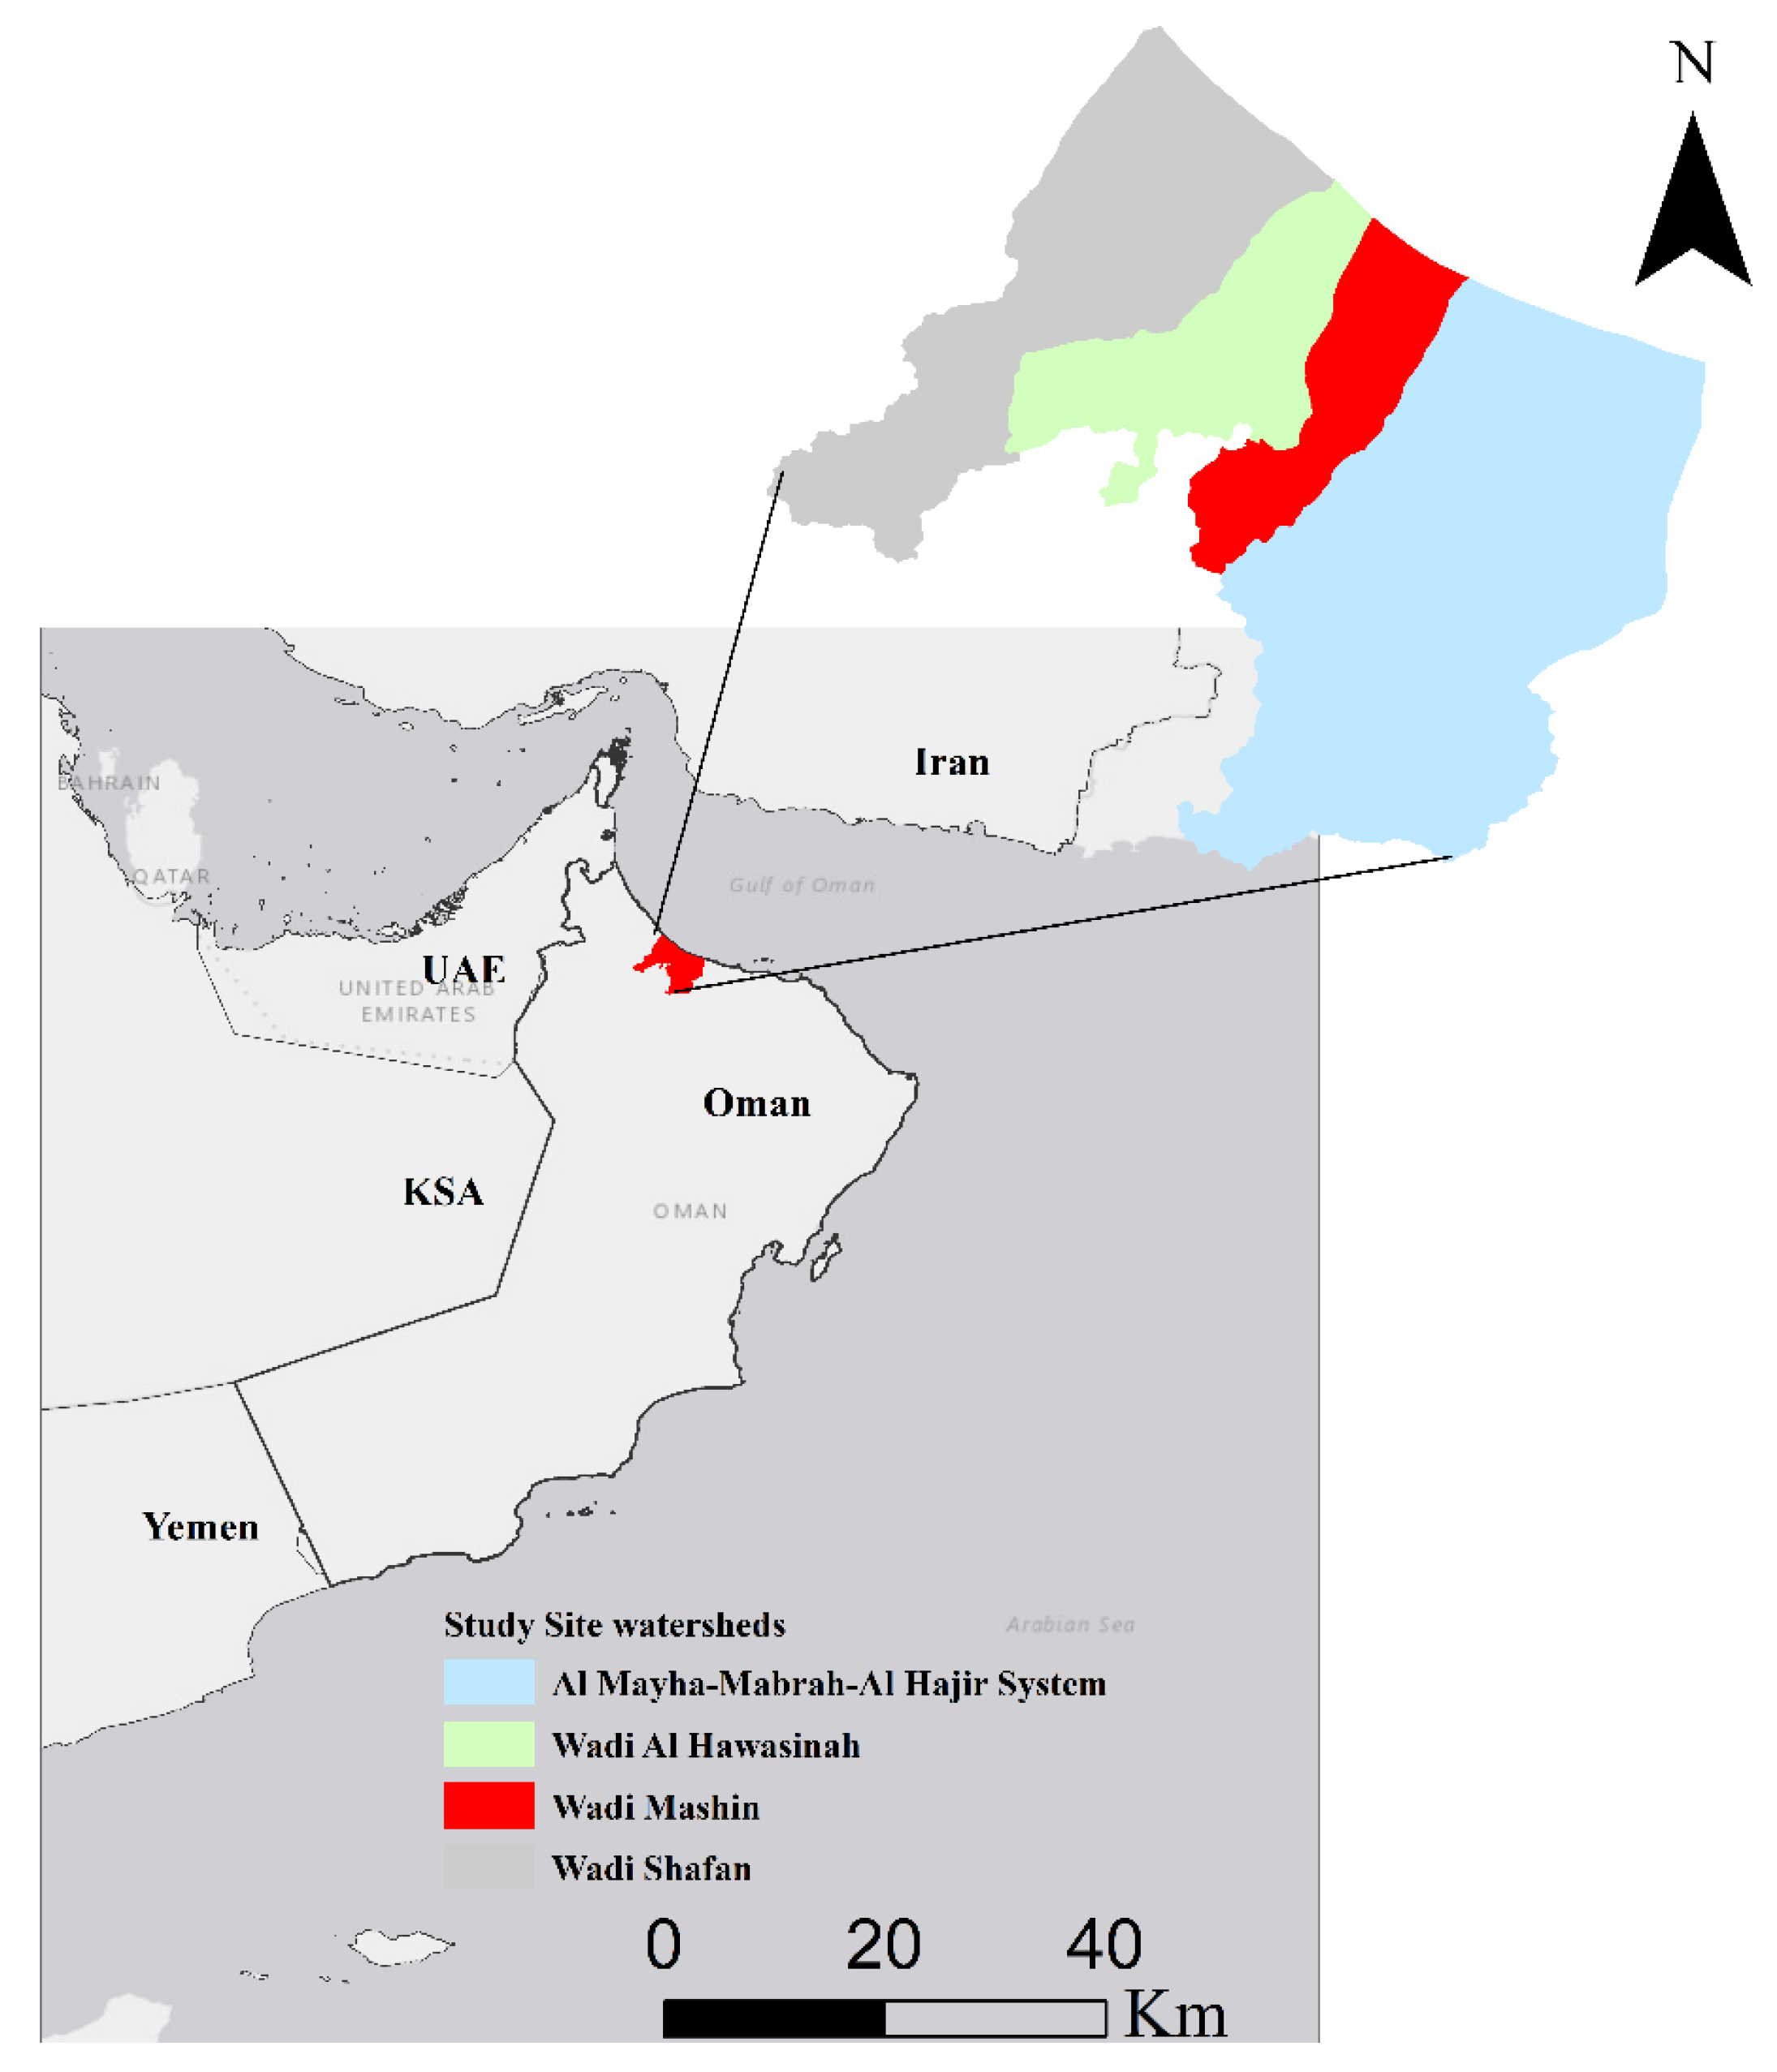
Figure 6.
Study area watersheds.

Figure 7.
Flash wadi flooding in Al Khaboura city during Shaheen cyclone. Photo by Haitham Al Farsi.
Figure 7.
Flash wadi flooding in Al Khaboura city during Shaheen cyclone. Photo by Haitham Al Farsi.
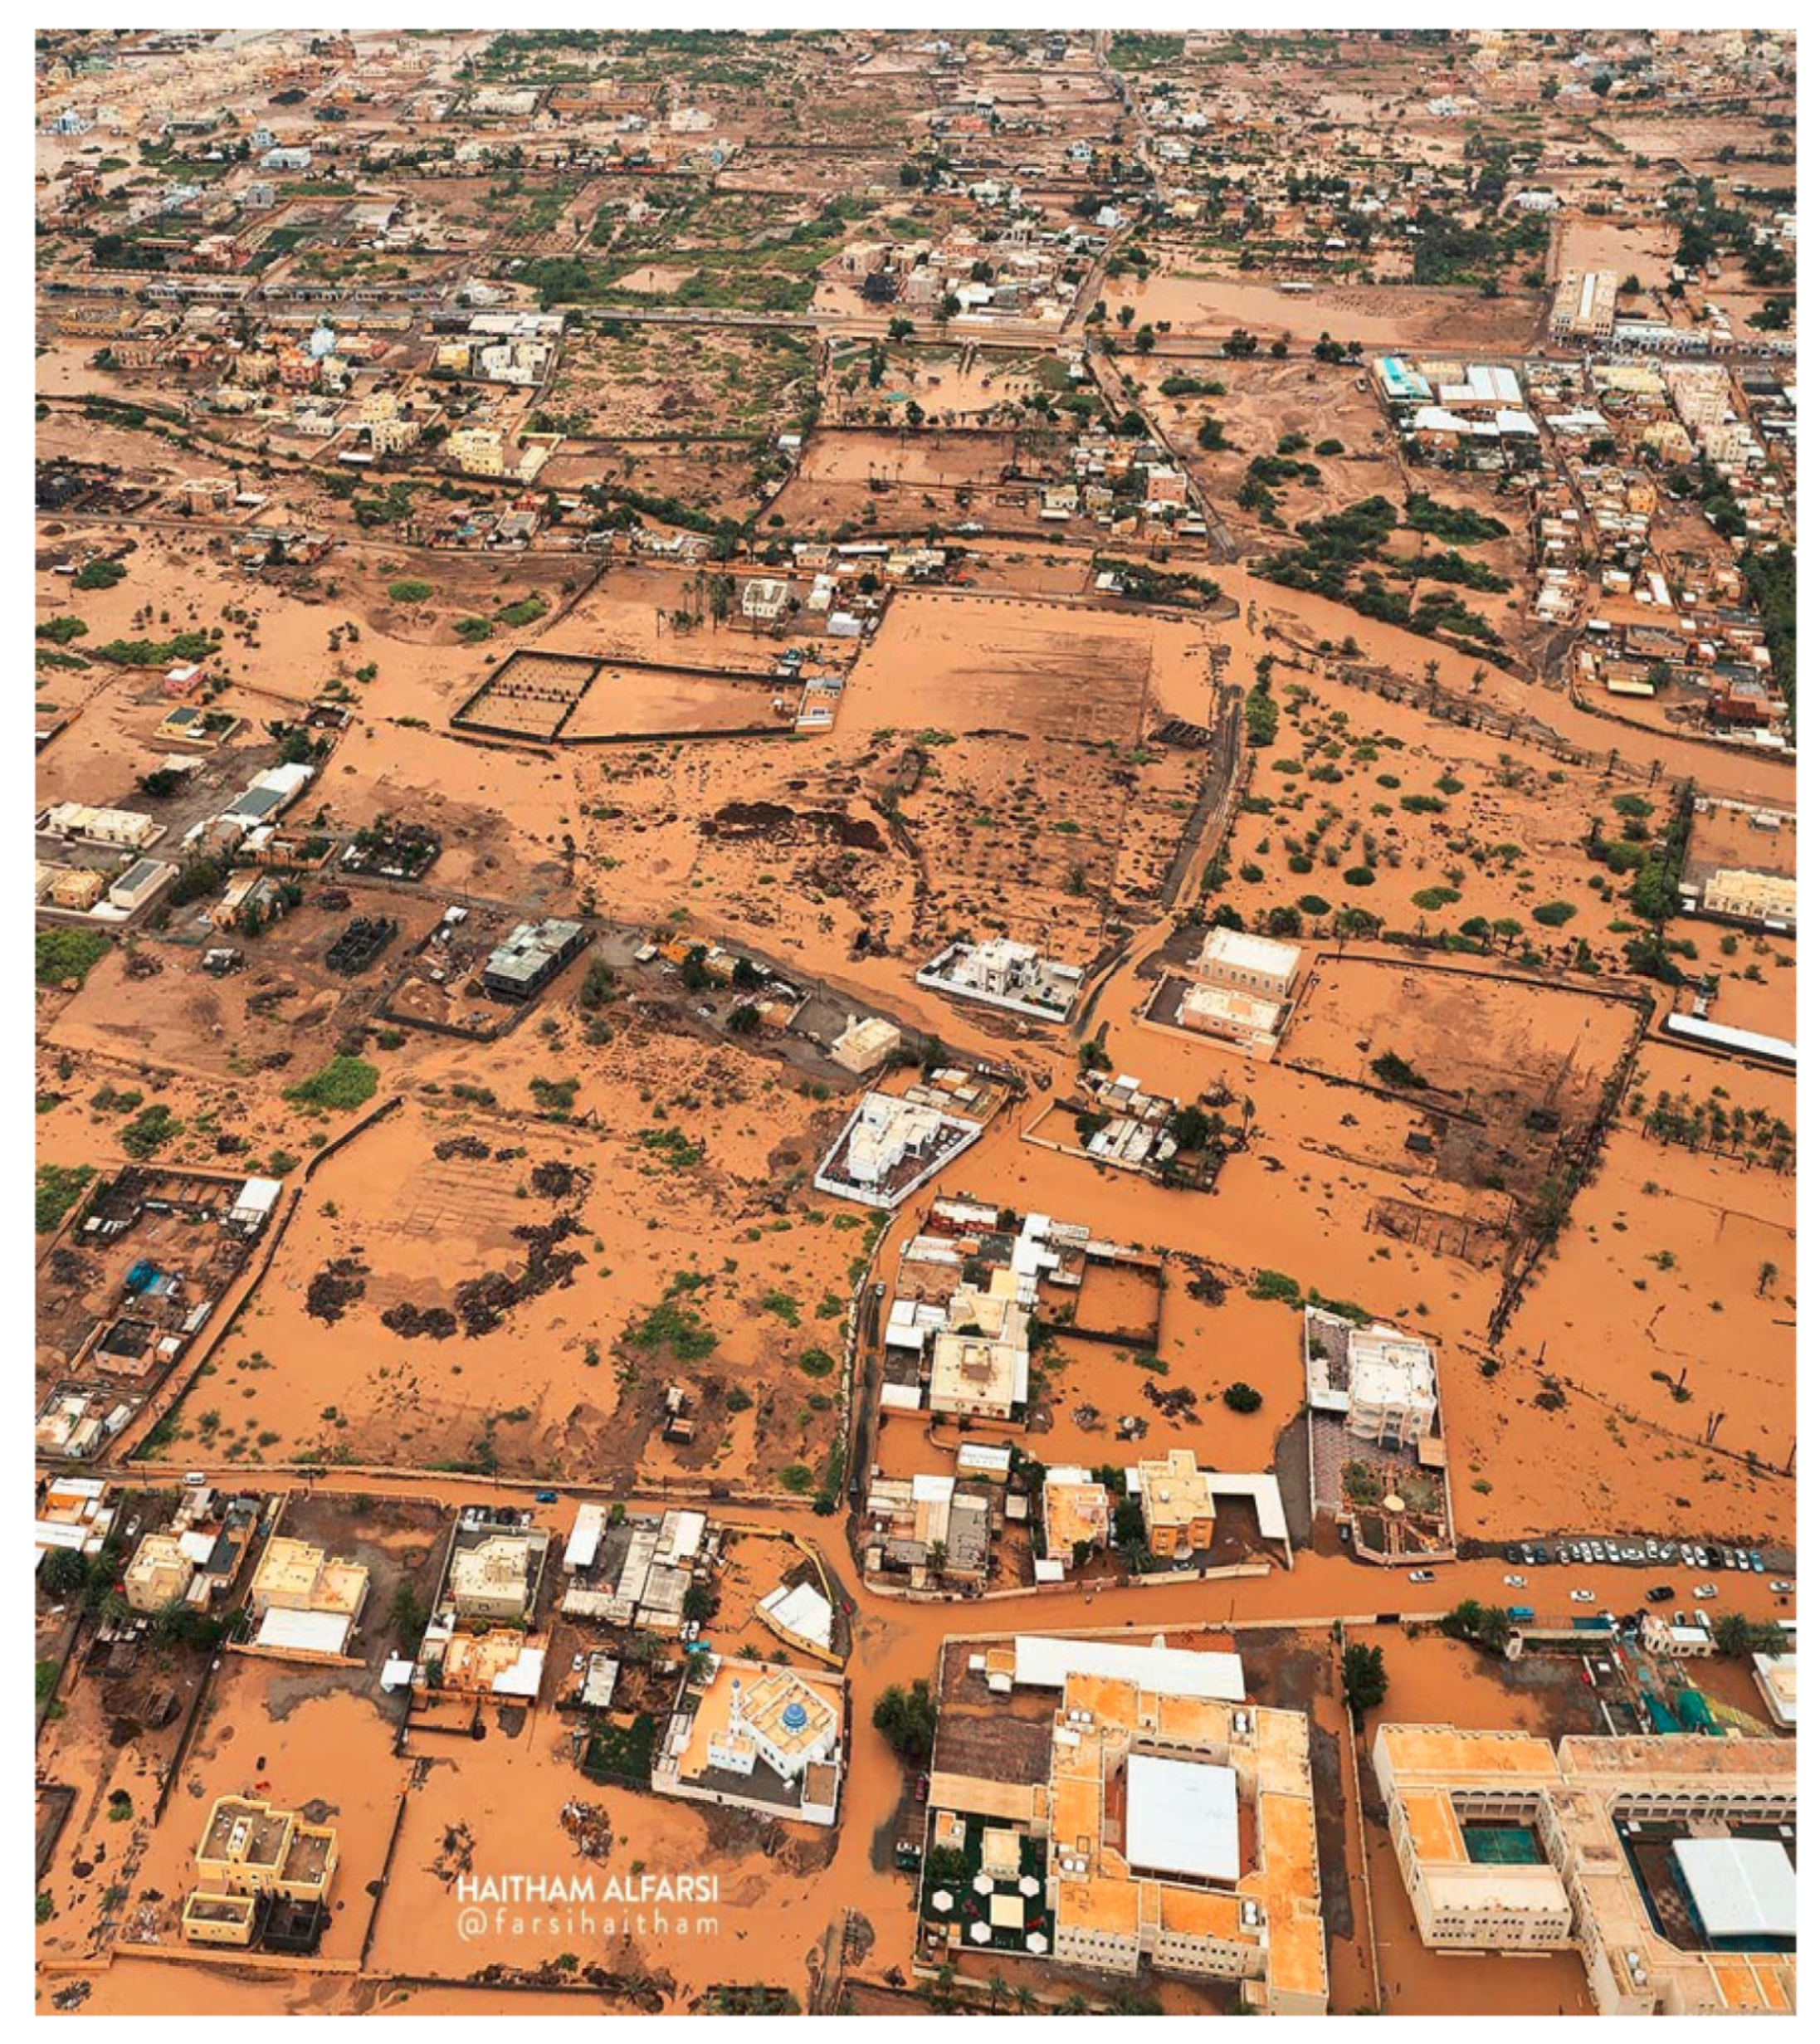
Figure 8.
Runoff volume per ha for each watershed (121.1 mm rainfall intensity).
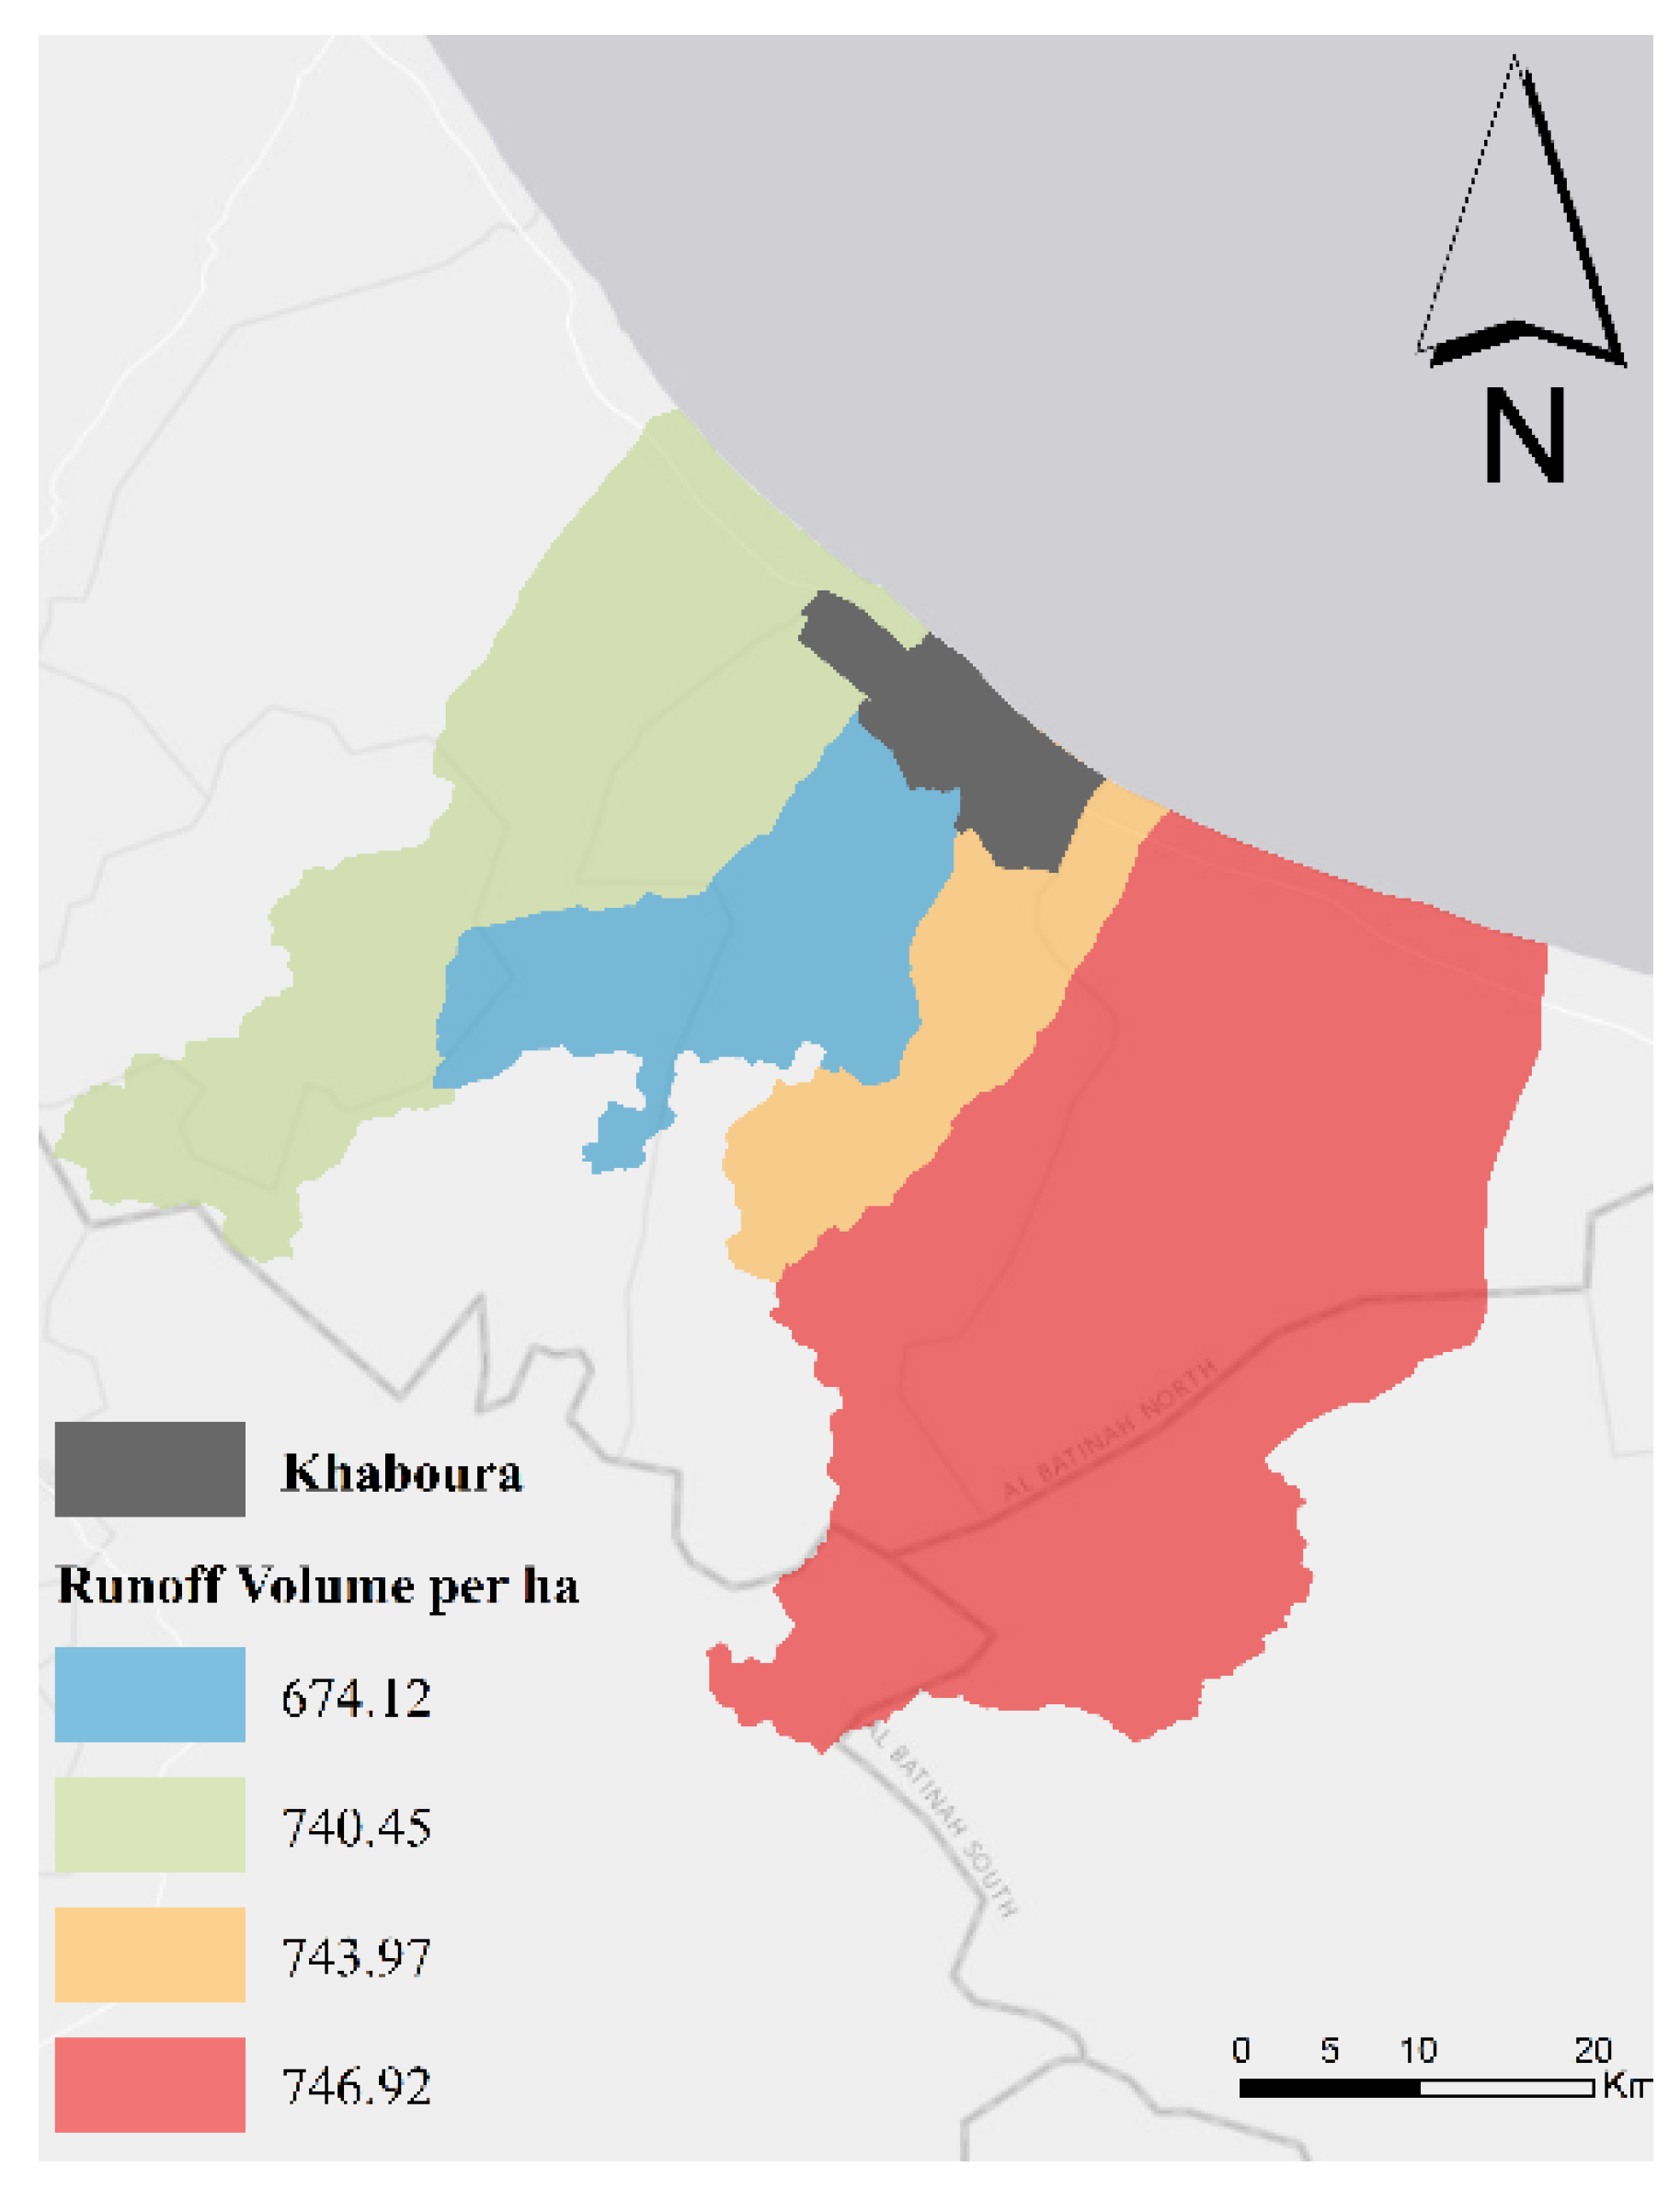
Figure 9.
Runoff retention index per pixels (121.1 mm rainfall intensity).
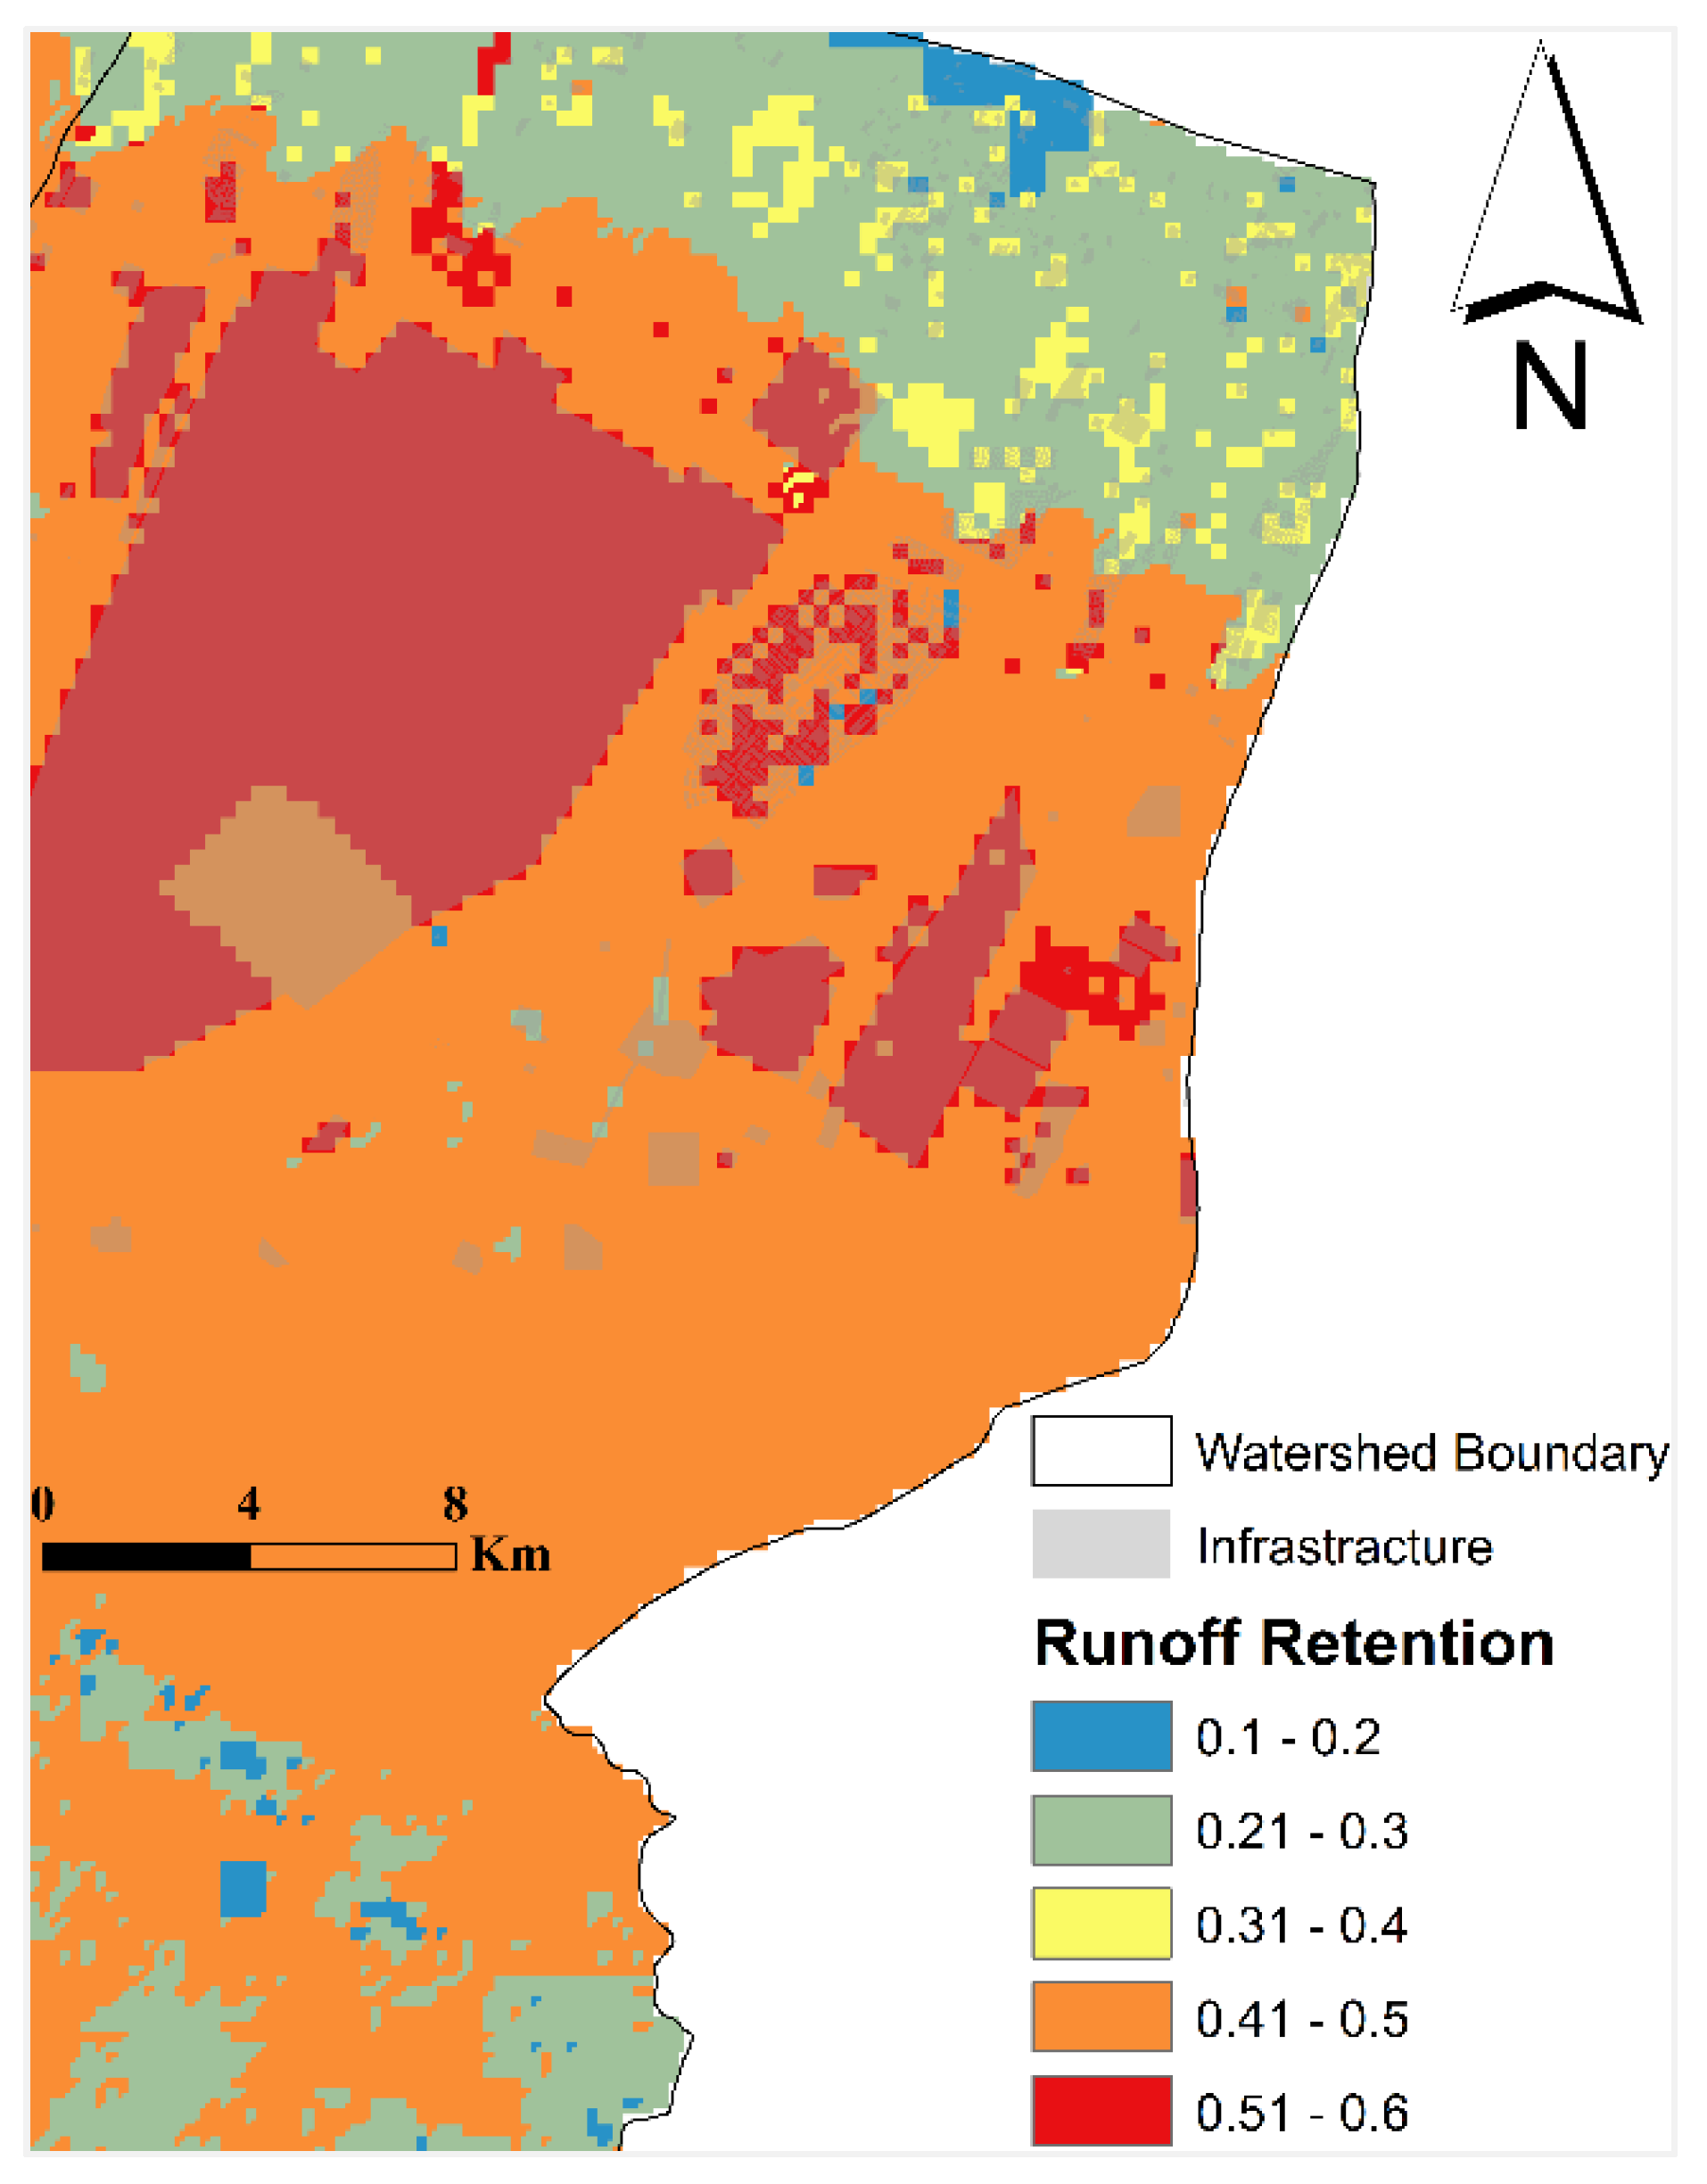
Figure 10.
Variation of runoff retention index for 121.1 and 213.8 mm rainfall intensity.

Figure 11.
Shoreline accretions and erosion of Al Khaboura coast with LRR.

Figure 12.
(a) EPR–LRR and (b) EPR–WLR comparison for the shoreline change rate for all transects of Al Khaboura shoreline; (c) values of EPR, LRR, and WLR (m/year) of the study for Shaheen cyclonic event.
Figure 12.
(a) EPR–LRR and (b) EPR–WLR comparison for the shoreline change rate for all transects of Al Khaboura shoreline; (c) values of EPR, LRR, and WLR (m/year) of the study for Shaheen cyclonic event.

Table 1.
Output of the flood risk mitigation model for four watersheds.
| Watershed | Area (ha) | Rain Event (mm) | Runoff Retention Index (%) | Runoff Index (%) | Runoff Retention Volume (m3) | Runoff Retention Volume (m3)/Area (ha) | Runoff Volume (m3)/ Area (ha) |
|---|---|---|---|---|---|---|---|
| Wadi Shafan | 75,524 | 121.1 | 38 | 62 | 348,499.02 | 461.44 | 740.45 |
| 213.8 | 25 | 75 | 398,569.26 | 527.74 | 1594.2 | ||
| Wadi Al Hawasinah | 38,994 | 121.1 | 44 | 56 | 206,516.72 | 529.61 | 674.12 |
| 213.8 | 29 | 71 | 240,535.31 | 616.85 | 1508.3 | ||
| Al Mayha-Mabrah-Al Hajir System | 145,030 | 121.1 | 38 | 62 | 664,486.28 | 458.17 | 746.92 |
| 213.8 | 25 | 75 | 760,771.79 | 524.56 | 1603.0 | ||
| Wadi Mashin | 27,459 | 121.1 | 38 | 62 | 126,420.82 | 460.39 | 743.97 |
| 213.8 | 25 | 75 | 144,078.97 | 524.70 | 1601.6 |
Table 2.
Used satellite imagery in the study.
| Platform | Date | Tile Number |
|---|---|---|
| SENTINEL-2A | 27 September 2021 | T40QEM |
| 7 October 2021 | ||
| SENTINEL-2B | 2 October 2021 | |
| 1 November 2021 |
Publisher’s Note: MDPI stays neutral with regard to jurisdictional claims in published maps and institutional affiliations. |
© 2022 by the author. Licensee MDPI, Basel, Switzerland. This article is an open access article distributed under the terms and conditions of the Creative Commons Attribution (CC BY) license (https://creativecommons.org/licenses/by/4.0/).
Share and Cite
MDPI and ACS Style
AlRuheili, A.M. A Tale of Shaheen’s Cyclone Consequences in Al Khaboura City, Oman. Water 2022, 14, 340. https://doi.org/10.3390/w14030340
AMA Style
AlRuheili AM. A Tale of Shaheen’s Cyclone Consequences in Al Khaboura City, Oman. Water. 2022; 14(3):340. https://doi.org/10.3390/w14030340
Chicago/Turabian StyleAlRuheili, Amna M. 2022. "A Tale of Shaheen’s Cyclone Consequences in Al Khaboura City, Oman" Water 14, no. 3: 340. https://doi.org/10.3390/w14030340
Note that from the first issue of 2016, this journal uses article numbers instead of page numbers. See further details here.