Article

Integrative Analysis of the Role of TP53 in Human Pan-Cancer

Institute for Brain Sciences Research, School of Life Sciences, Henan University, Kaifeng 475004, China
*
Authors to whom correspondence should be addressed.
These authors contributed equally to this work.
Curr. Issues Mol. Biol. 2023, 45(12), 9606-9633; https://doi.org/10.3390/cimb45120601
Submission received: 31 October 2023 / Revised: 20 November 2023 / Accepted: 23 November 2023 / Published: 29 November 2023
(This article belongs to the Section Bioinformatics and Systems Biology)

Abstract

:
Tumor protein P53 (TP53) is an important tumor suppressor gene in humans. Under normal circumstances, TP53 can help repair mutated genes, or promote the death of cells with severe gene mutations (specifically, TP53 prevents cells from arrest in the G1/S phase when deoxyribonucleic acid (DNA) is damaged and promotes apoptosis if not repaired), and prevents normal cells from becoming malignant cells. TP53 mutations affect its tumor suppressor function, leading to the development of malignant tumors. In this study, using a public database, we explored the pan-cancer expression of TP53, its impact on patient survival and prognosis, the types of gene mutations, its correlation with immunity, and its regulation of other transcription factors and micro RNA (miRNA). The docking sites of therapeutic drugs and key amino acid sites of action provide a basis for future targeted therapies. TP53 has important biological functions in the human body. This study provides a theoretical basis for clinical TP53 gene therapy.

1. Introduction

Tumor protein P53 (TP53, also known as p53) is a tumor suppressor gene located on the short arm of human chromosome 17. It encodes and expresses TP53 protein, which is an important cell cycle factor and tumor suppressor [1]. TP53 is a transcription factor that directly regulates the expression of 500 genes and is associated with important biological functions; apart from its classical function in cell cycle arrest, deoxyribonucleic acid (DNA) repair, apoptosis, and senescence, it also supervises processes such as cellular plasticity, self-renewal, and differentiation [2,3,4]. Under normal/physiological conditions, TP53 is a tumor suppressor gene that plays a crucial role in maintaining the integrity of the genome. It functions as a transcription factor that regulates the expression of numerous genes involved in cell cycle arrest, DNA repair, apoptosis, and senescence. TP53 acts as a guardian of the genome by detecting DNA damage and initiating the appropriate response to prevent the propagation of damaged cells [5]. However, the protein expressed by a mutated TP53 gene has certain structural and functional defects, loses the TP53 gene’s original biological characteristics of inhibiting tumor cell growth, and promotes the continuous malignant transformation of tumor cells, which leads to the development of malignant tumors. The high expression of TP53 in tumors is due to the fact that heat shock protein 90 (HSP90) and HSP70 maintain the stability of mutations in TP53 in cancer by interacting with the DNA-binding domain of mutated TP53. The functions of TP53 in tumors include genetic instability (promoting amplification and chromosomal instability), the regulation of ferroptosis (which has been shown in most studies to promote the occurrence of iron death) and tumor microenvironment, and the acquisition of cancer stem cells (CSCs) phenotypes. The hallmark feature of CSCs is their ability to produce heterogeneous tumor cells, which are critical in the initiation and progression of cancer [6].
Studies have shown that TP53 is a common mutated gene in various forms of human cancer. TP53 is related to 50% of human tumors, including liver, breast, gastric, colorectal, esophageal, and lung cancers [7]. Over the years, the role of TP53 in other cellular processes, such as metabolism, angiogenesis, immune responses, stem cell maintenance, and tumor–stromal cell crosstalk, has emerged. TP53 has thus earned a position as an “all-rounder” in cancer biology by being involved in the orchestration of the basic events that must be overcome for cancer initiation and progression, summarized as “the hallmarks of cancer” [8]. In addition to mutations, TP53 activity can be modulated through other mechanisms. Some viruses can inactivate TP53, allowing infected cells to evade immune surveillance and promote viral replication. Additionally, various cellular stressors, such as hypoxia, radiation, and chemotherapy, can stabilize TP53, leading to the activation of its downstream target genes and inducing cell cycle arrest or apoptosis. Overall, TP53 plays a critical role in maintaining genomic stability and suppressing tumor formation under normal conditions. Its dysregulation through mutations or other mechanisms contributes to the development and progression of various pathological conditions, particularly cancer [9,10]. The TP53 gene is divided into wild type (normal gene) and mutant type, and its products are also of wild type and mutant type [11]. Wild-type TP53 protein acts as a broad-spectrum tumor suppressor by inhibiting the division of cells with DNA damage and chromosomal aberrations and preventing the transmission of aberrations to daughter cells. In contrast, mutations (deletion) in the TP53 gene are closely related to the occurrence and development of tumors; therefore, TP53 is known as a gene guardian [12]. Studies have shown that some environments and diets can directly cause mutations in the TP53 gene, such as exposure to aflatoxin B1 in foods, so it is necessary to avoid eating moldy foods that may contain aflatoxin [13]. Hepatitis B virus (HBV)- and hepatitis C virus (HCV)-related carcinogenesis is initiated in the context of chronic hepatitis, and progresses to HCC in a multistep process lasting for as long as 30 years [14]. During hepatocellular carcinoma (HCC) progression, synergy among several environmental factors (aflatoxin B1, alcohol consumption, cigarette smoking, hepatotoxic chemical agents) as well as host co-factors (elevated serum androgen levels, genetic polymorphisms, DNA repair enzymes) may lead to the progressive accumulation of multiple genomic changes in hepatocytes. Among these, non-synonymous mutations in the TP53 gene are well-known cancer drivers for HCC development with variable frequencies depending on the underlying etiology [15]. Mutations in TP53 in non-melanoma skin cancer are associated with ultraviolet (UV) exposure from the sun [16]. Smoking can cause TP53 mutations, related to the occurrence of lung cancer [17]. Clinically, TP53 mutations are associated with poor prognosis in some cancers; however, this remains controversial. Studies show that TP53 mutations are not restricted to glioblastoma multiforme and may be important in the tumorigenesis of lower-grade astrocytomas and that TP53 mutations in lower-grade astrocytomas are associated with the loss of chromosome 17p [18]. Notably, the World Health Organization (WHO) incorporated the distinction between mutated and wild-type TP53 in specific brain tumors [19,20], and TP53 mutational status can have varying implications for different medulloblastoma groups, divided into sonic hedgehog (SHH)-activated and TP53-wild type, and SHH-activated and TP53-mutant, for example [21]. Moreover, previous studies have shown TP53 mutations in primary human brain tumors [22]. Therefore, this study explored the pan-cancer expression of TP53 based on public databases, mutation status, prognostic analysis, diagnostic receiver operating characteristic (ROC), immune infiltration, regulation of the expression of other transcription factors, and further analyses based on TP53 gene mutations, so as to better understand the function of TP53 in human cancers and obtain a more accurate prognosis prediction.

2. Material and Methods

2.1. Identifying Pan-Cancer Expression of TP53

We compared the expression and methylation of TP53 in tumor and normal tissues using the TIMER2 (http://timer.comp-genomics.org/ (accessed on 17 May 2023)) [23], gene expression profiling interactive analysis (GEPIA2) (http://gepia2.cancer-pku.cn/#index (accessed on 18 May 2023)) [24], and UALCAN databases (https://ualcan.path.uab.edu/ (accessed on 18 May 2023)) [25]. The parameters in GEPIA2 were set to p-value < 0.05, |log2 (fold change)| > 1, and the GEPIA2 database was used to analyze the pathological stage. Z-values represent standard deviations from the median across samples for each cancer type. Log2 spectral count ratio values from the Clinical Proteomic Tumor Analysis Consortium (CPTAC) were first normalized within each sample profile and then across samples.

2.2. Survival Prognosis, Mutation, and mRNA Expression Analysis

Across different tumor types, the prognostic values of TP53, including overall survival (OS) and disease-free survival (RFS), were determined using the GEPIA2 database, TCGA, and Kaplan–Meier plotter. Heatmap data and survival plots for TP53 are shown. In addition, we used the cBioPortal tool (https://www.cbioportal.org/ (accessed on 19 May 2023)) [26] and GSCALite database (http://bioinfo.life.hust.edu.cn/web/GSCALite/ (accessed on 19 May 2023)) [27] to explore the mutation frequency, mutation type, site information, and mRNA expression of TP53 across different tumors. We also assessed the survival values of TP53 genetic alterations, including OS and RFS, across the different cancers.

2.3. Pan-Cancer Clinical Value of TP53

We downloaded the standardized pan-cancer dataset from the UCSC (https://xenabrowser.net/ (accessed on 20 May 2023)) database: The Cancer Genome Atlas (TCGA) Pan-Cancer (PANCAN, N = 10,535, G = 60,499). Further, we extracted ENSG00000141510 (TP53) gene expression data for each sample, and expression values for each of the log2 (x + 0.001) transforms. We built a Cox proportional hazards regression model using the coxph function of the R software package survival (version 3.2-7), and this was used to analyze the relationship between gene expression and prognosis for each tumor. The logrank test was used for statistical testing to obtain prognostic significance. To screen the pan-cancer expression of the TP53 gene, we visually displayed the results of ROC curve analysis, and AUCs were calculated using the pROC package in R software (version 4.2.1) to determine the predicted values of the TP53 gene.

2.4. Analysis of Immune Infiltration

We analyzed the relationship between TP53 expression and immune infiltrates across all tumors using the TIMER2 tool. We selected B cells, CD8+ T cells, CD4+ T cells, macrophages, neutrophils, dendritic cells (DC), natural killer cells (NK cells), monocytes, cancer-associated fibroblasts (CAF), endothelial cells, eosinophils, and regulatory T cells (Tregs) for detailed analysis. Seven algorithms, namely TIMER, EPIC, MCPCOUNTER, CIBERSORT, CIBERSORT-ABS, QUANTISEQ, and XCELL, were applied in the analysis of immune infiltration. The gene expression profile of each tumor was extracted and mapped to GeneSymbol, and the immune score of each patient with each tumor was calculated according to gene expression using the R software package ESTIMATE (version 1.0.13, https://bioinformatics.mdanderson.org/public-software/estimate/ (accessed on 21 May 2023)). differences in the significance of analysis were determined using the R software package psych (version 2.1.6), and the Pearson’s correlation coefficients of genes as well as immune invasion scores of individual tumors were calculated to determine the significance of correlation with immune invasion scores. Using the Timer method of the R software package IOBR (version 0.99.9), we reassessed the immune cell invasion score for each patient with each tumor and plotted a survival curve.

2.5. Tumor Stemness of TP53

The DNA tumor dryness score was calculated from the methylation characteristics for each tumor; we integrated the sample dryness index and gene expression data and further transformed each expression value with log2 (x + 0.001). Finally, we eliminated cancers with less than three samples each, and finally obtained the expression data of 37 cancers. We also analyzed two types of immune checkpoints in each sample, including 26 inhibition sites and 36 activation sites.

2.6. Analysis of Single-Cell Sequencing Data

At the single-cell level, we explored the correlation between TP53 expression and tumor functional status by searching CancerSEA (http://biocc.hrbmu.edu.cn/CancerSEA/ (accessed on 22 May 2023)) [28]. A heatmap was drawn to indicate significant correlations. The top four significantly different functional states (p < 0.05) and the T-SNE diagrams of tumors were obtained based on the CancerSEA database.

2.7. Enrichment Analysis of TP53-Related Genes

STRING (https://cn.string-db.org/ (accessed on 23 May 2023)) [29] was used to perform the molecular interaction network analysis. Furthermore, GEPIA2 was used to explore Spearman correlations between TP53 and the selected genes. The miRNA network was selected for analysis using the GSCALite database. The Oncomir (http://www.oncomir.org/ (accessed on 23 May 2023)) database [30] was used to perform the cluster analysis of related miRNAs and pan-cancer survival analysis. At the same time, the wikipathways database (https://www.wikipathways.org/ (accessed on 24 May 2023)) [31] was used to analyze TP53-related signaling pathways. The TRRUST database (https://www.grnpedia.org/trrust/Network_search_form.php (accessed on 25 May 2023)) [32] was used to screen TP53-related transcription factors. Vakser Lab (http://gramm.compbio.ku.edu/ (accessed on 25 May 2023)) [33] was used to perform docking analysis of TP53 and its related transcription factors.

2.8. Drug Screening and Molecular Docking

The Connectivity Map database (CMap, https://clue.io/query (accessed on 26 May 2023)) [34] was used to screen compounds for TP53-related targets, and the DoGSite database (https://proteins.plus/ (accessed on 27 May 2023)) [35] was used to perform molecular docking analysis. The best binding site was found.

2.9. Statistical Analysis

In TIMER2, statistical significance calculated using the Wilcoxon test was annotated with a specific number of stars. In GEPIA2, we used the analysis of variance (ANOVA) method to compare tumors with normal samples. Spearman rank correlation coefficients were used to evaluate the correlations between two groups. We used the Kaplan–Meier method to evaluate the relationship between patient prognosis and TP53 expression or mutation level. p < 0.05 was considered a statistically significant difference.

3. Results

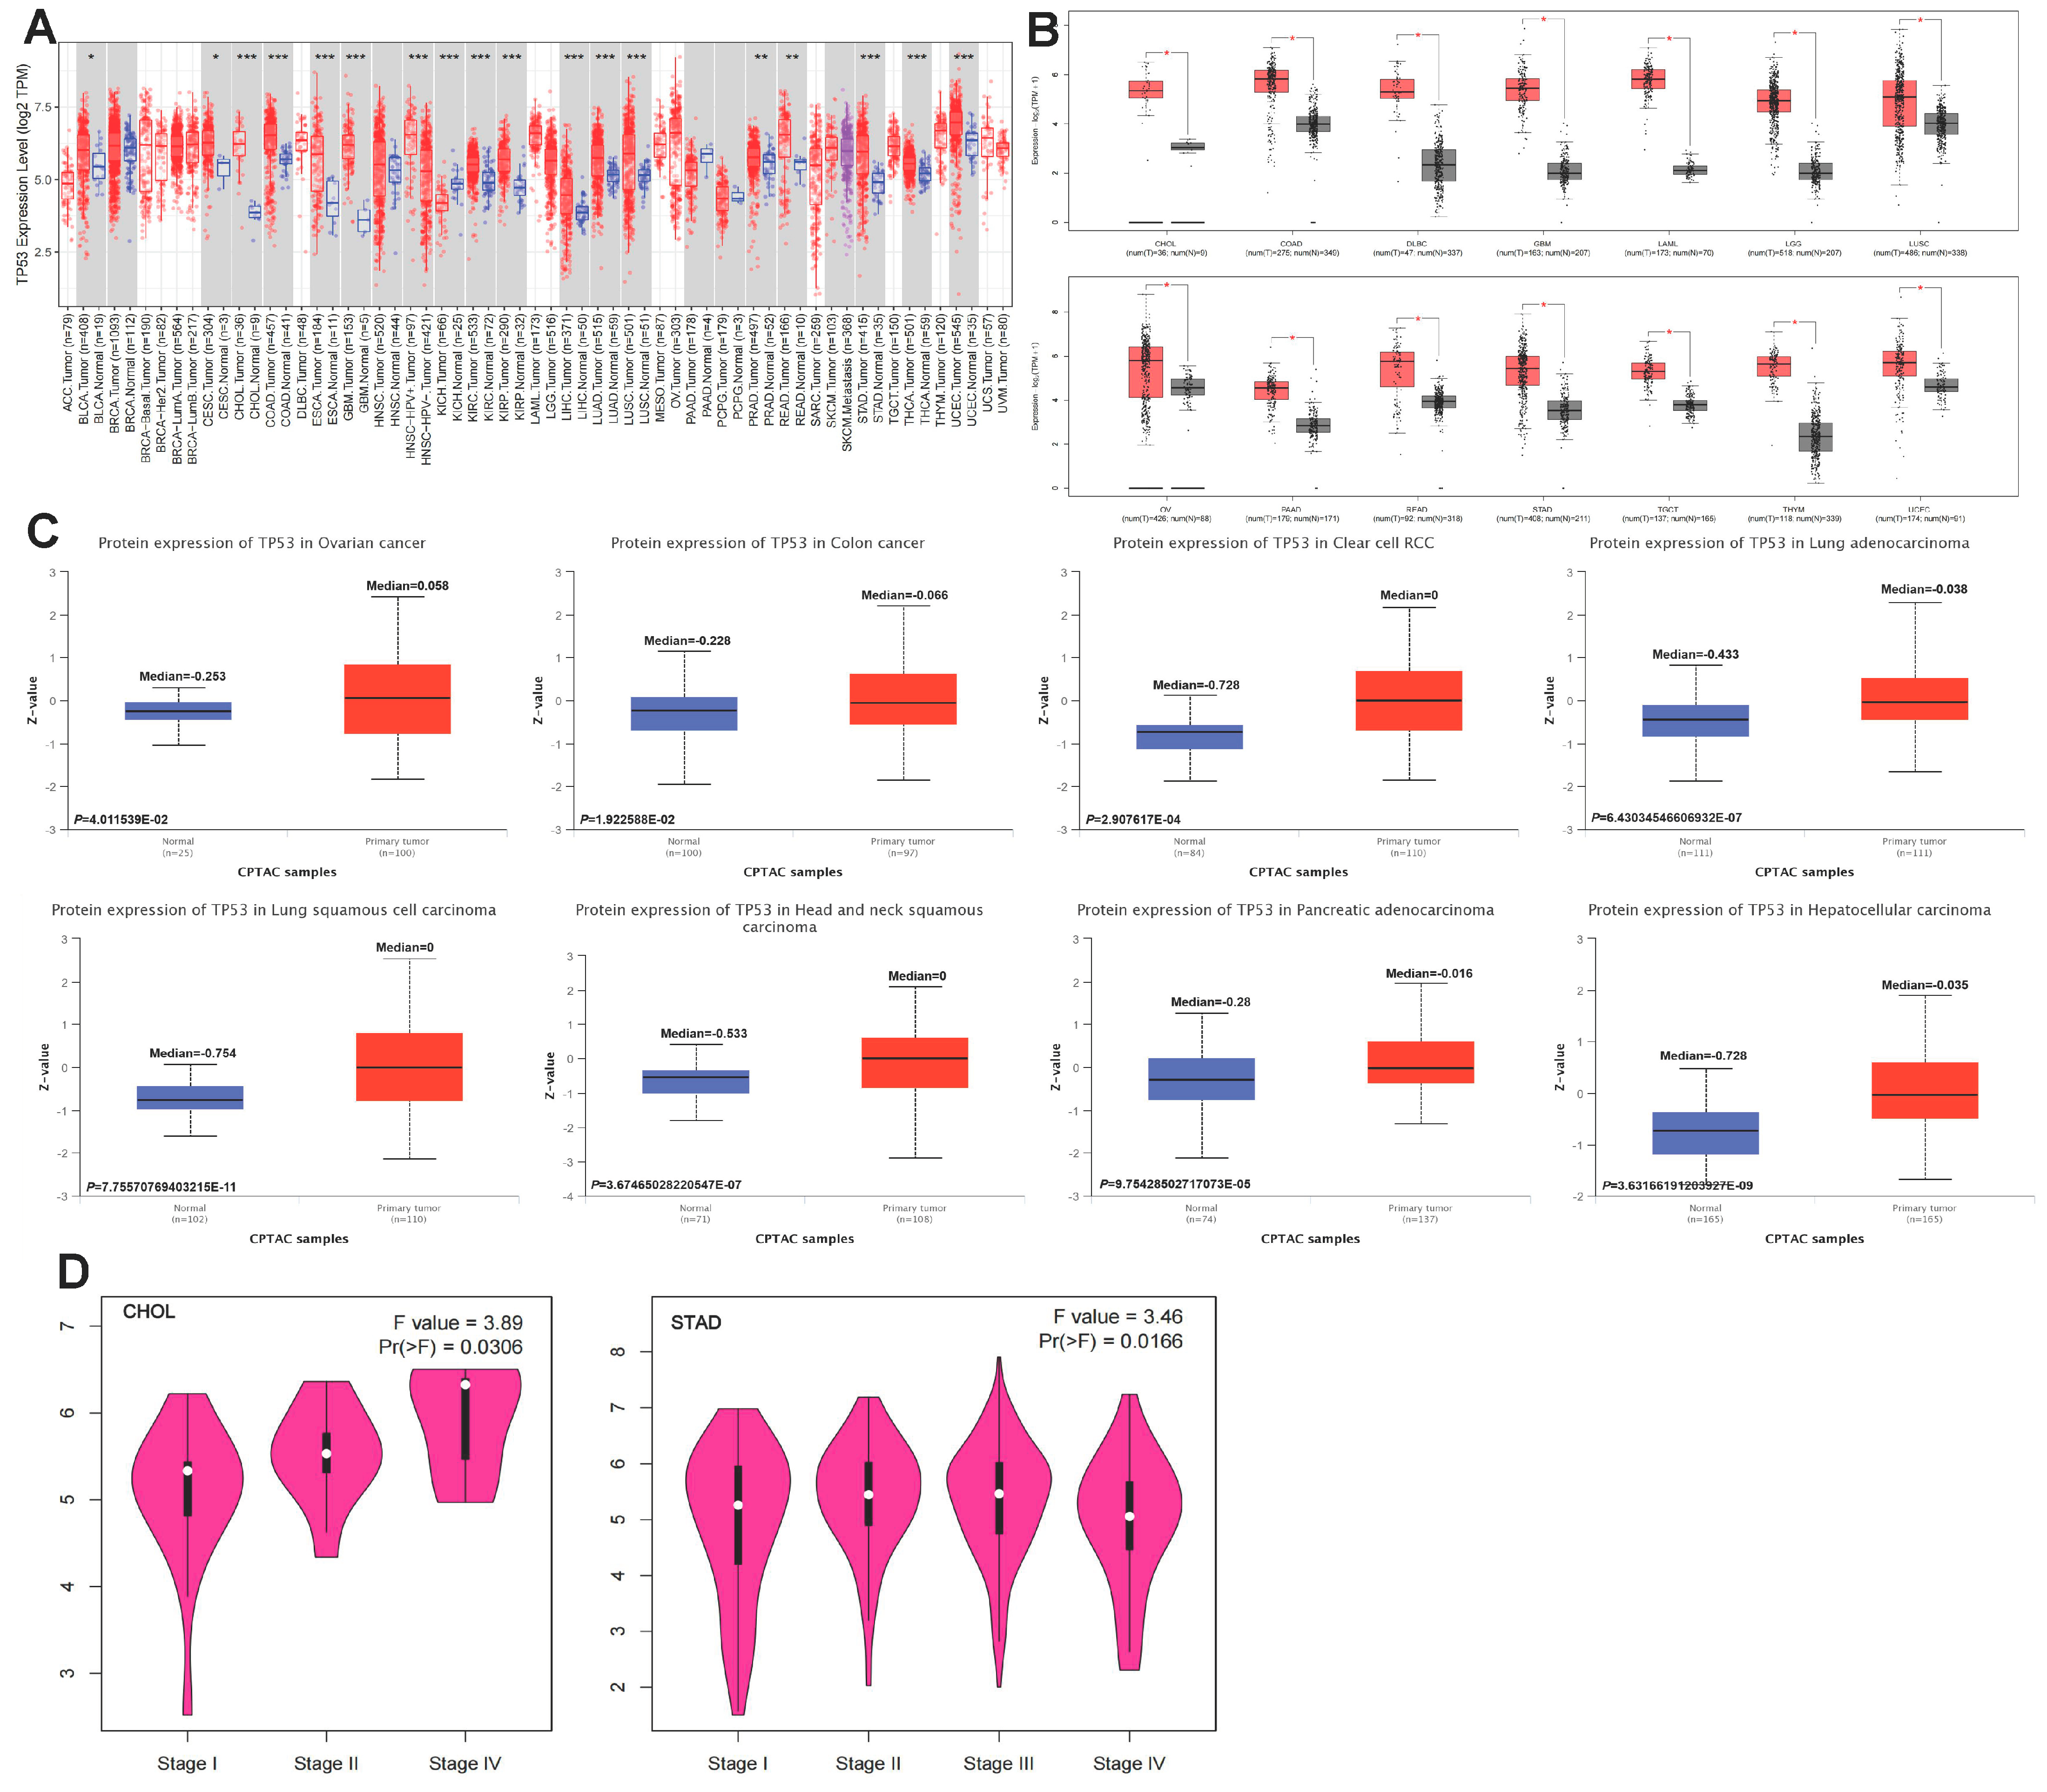
3.1. Aberrant Pan-Cancer Expression of TP53

In this study, TIMER2 was used to investigate the differential expression of TP53 by comparing tumors and normal tissues. As shown in Figure 1A, TP53 expression was significantly upregulated in 15 tumor tissues, namely BLCA (tissue type: bladder urothelial), CESC (cervix), CHOL (bile duct), COAD (colon), ESCA (esophageal), GBM (brain), KIRC (kidney), KIRP (kidney), LIHC (liver), LUAD (lung), LUSC (lung), PRAD (prostate), READ (rectum), STAD (stomach), THCA (thyroid), and UCEC (endometrial). In contrast, TP53 expression was significantly downregulated in KICH. We further assessed the differential expression of TP53 in tumor and normal tissues by matching TCGA and GTEx data for several cancers. We found upregulated expression of TP53 in CHOL, COAD, DLBC, GBM, LAML, LCC, LUSC, OV, PAAD, READ, STAD, TGCT, THYM, and UCEC (Figure 1B, Supplementary Table S1). For the other tumors, there were no significant differences in the expression of TP53 (Supplementary Figure S1A). To better understand the differential expression, the CPTAC dataset was used to assess TP53 protein levels from a pan-cancer perspective. As shown in Figure 1C, TP53 expression was significantly increased in OV, COAD, KIRC, LUAD, LUSC, HNSC, PAAD, and LIHC. For the other tumors, there were no significant differences in the expression of TP53 (Supplementary Figure S1B). GEPIA2 and TCGA were also used to analyze the relationship between TP53 expression and tumor pathological stage. As shown in Figure 1D, stage-specific changes in TP53 expression were observed in two tumor types: CHOL and STAD. In other cancers, there was no clear association between TP53 expression and pathological stage (Supplementary Figure S1C).

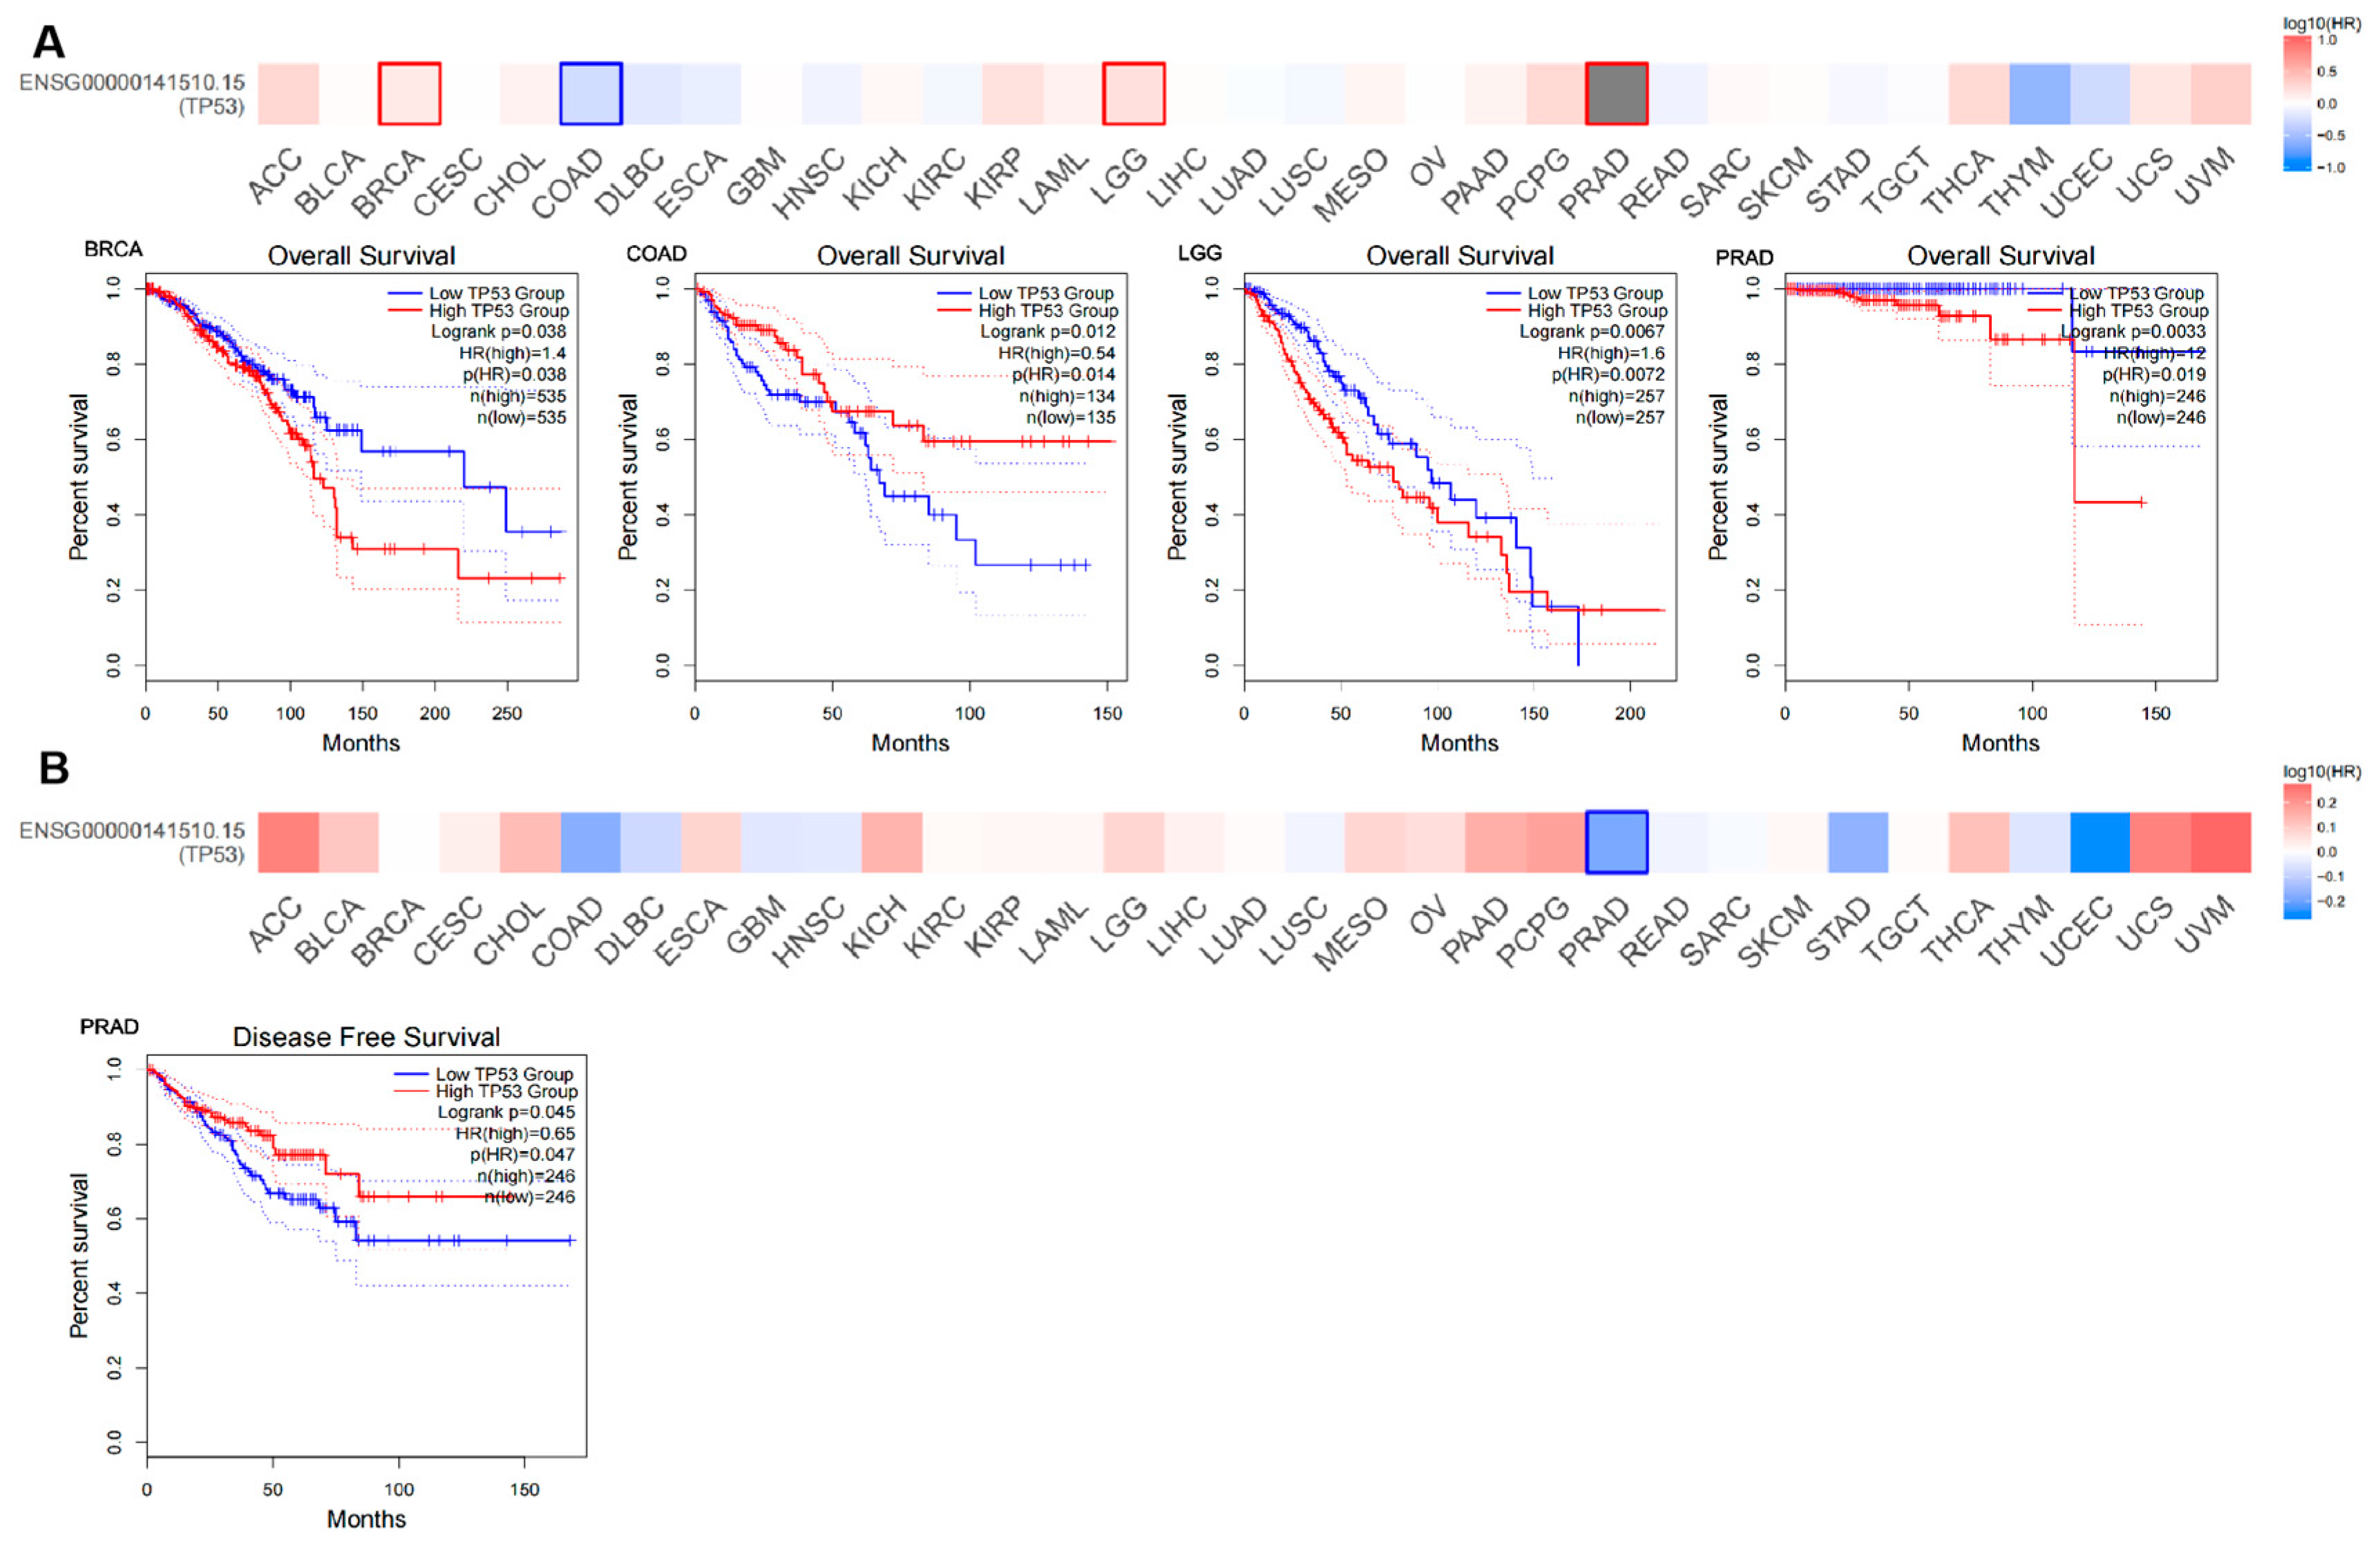
3.2. Survival Analysis of TP53 Expression in Pan Cancer

We used GEPIA2 to explore the role of TP53 in patient prognosis, including OS and RFS. In OS, high expression of TP53 was associated with poor prognosis in patients with BRCA (p = 0.038), LGG (p = 0.0072), and PRAD (p = 0.019). Inversely, high expression of TP53 was associated with good prognosis in patients with COAD (p = 0.014) (Figure 2A). In RFS, high expression of TP53 was associated with good prognosis in patients with PRAD (p = 0.047) (Figure 2B). Furthermore, the Kaplan–Meier plotter tool was used to identify the survival value of TP53. As shown in Supplementary Figure S2A, we found that a high TP53 RNA expression level was associated with poor prognosis in patients with BRCA and COAD. These results indicate the promising role of TP53 in the prognosis of patients with BRCA and COAD.

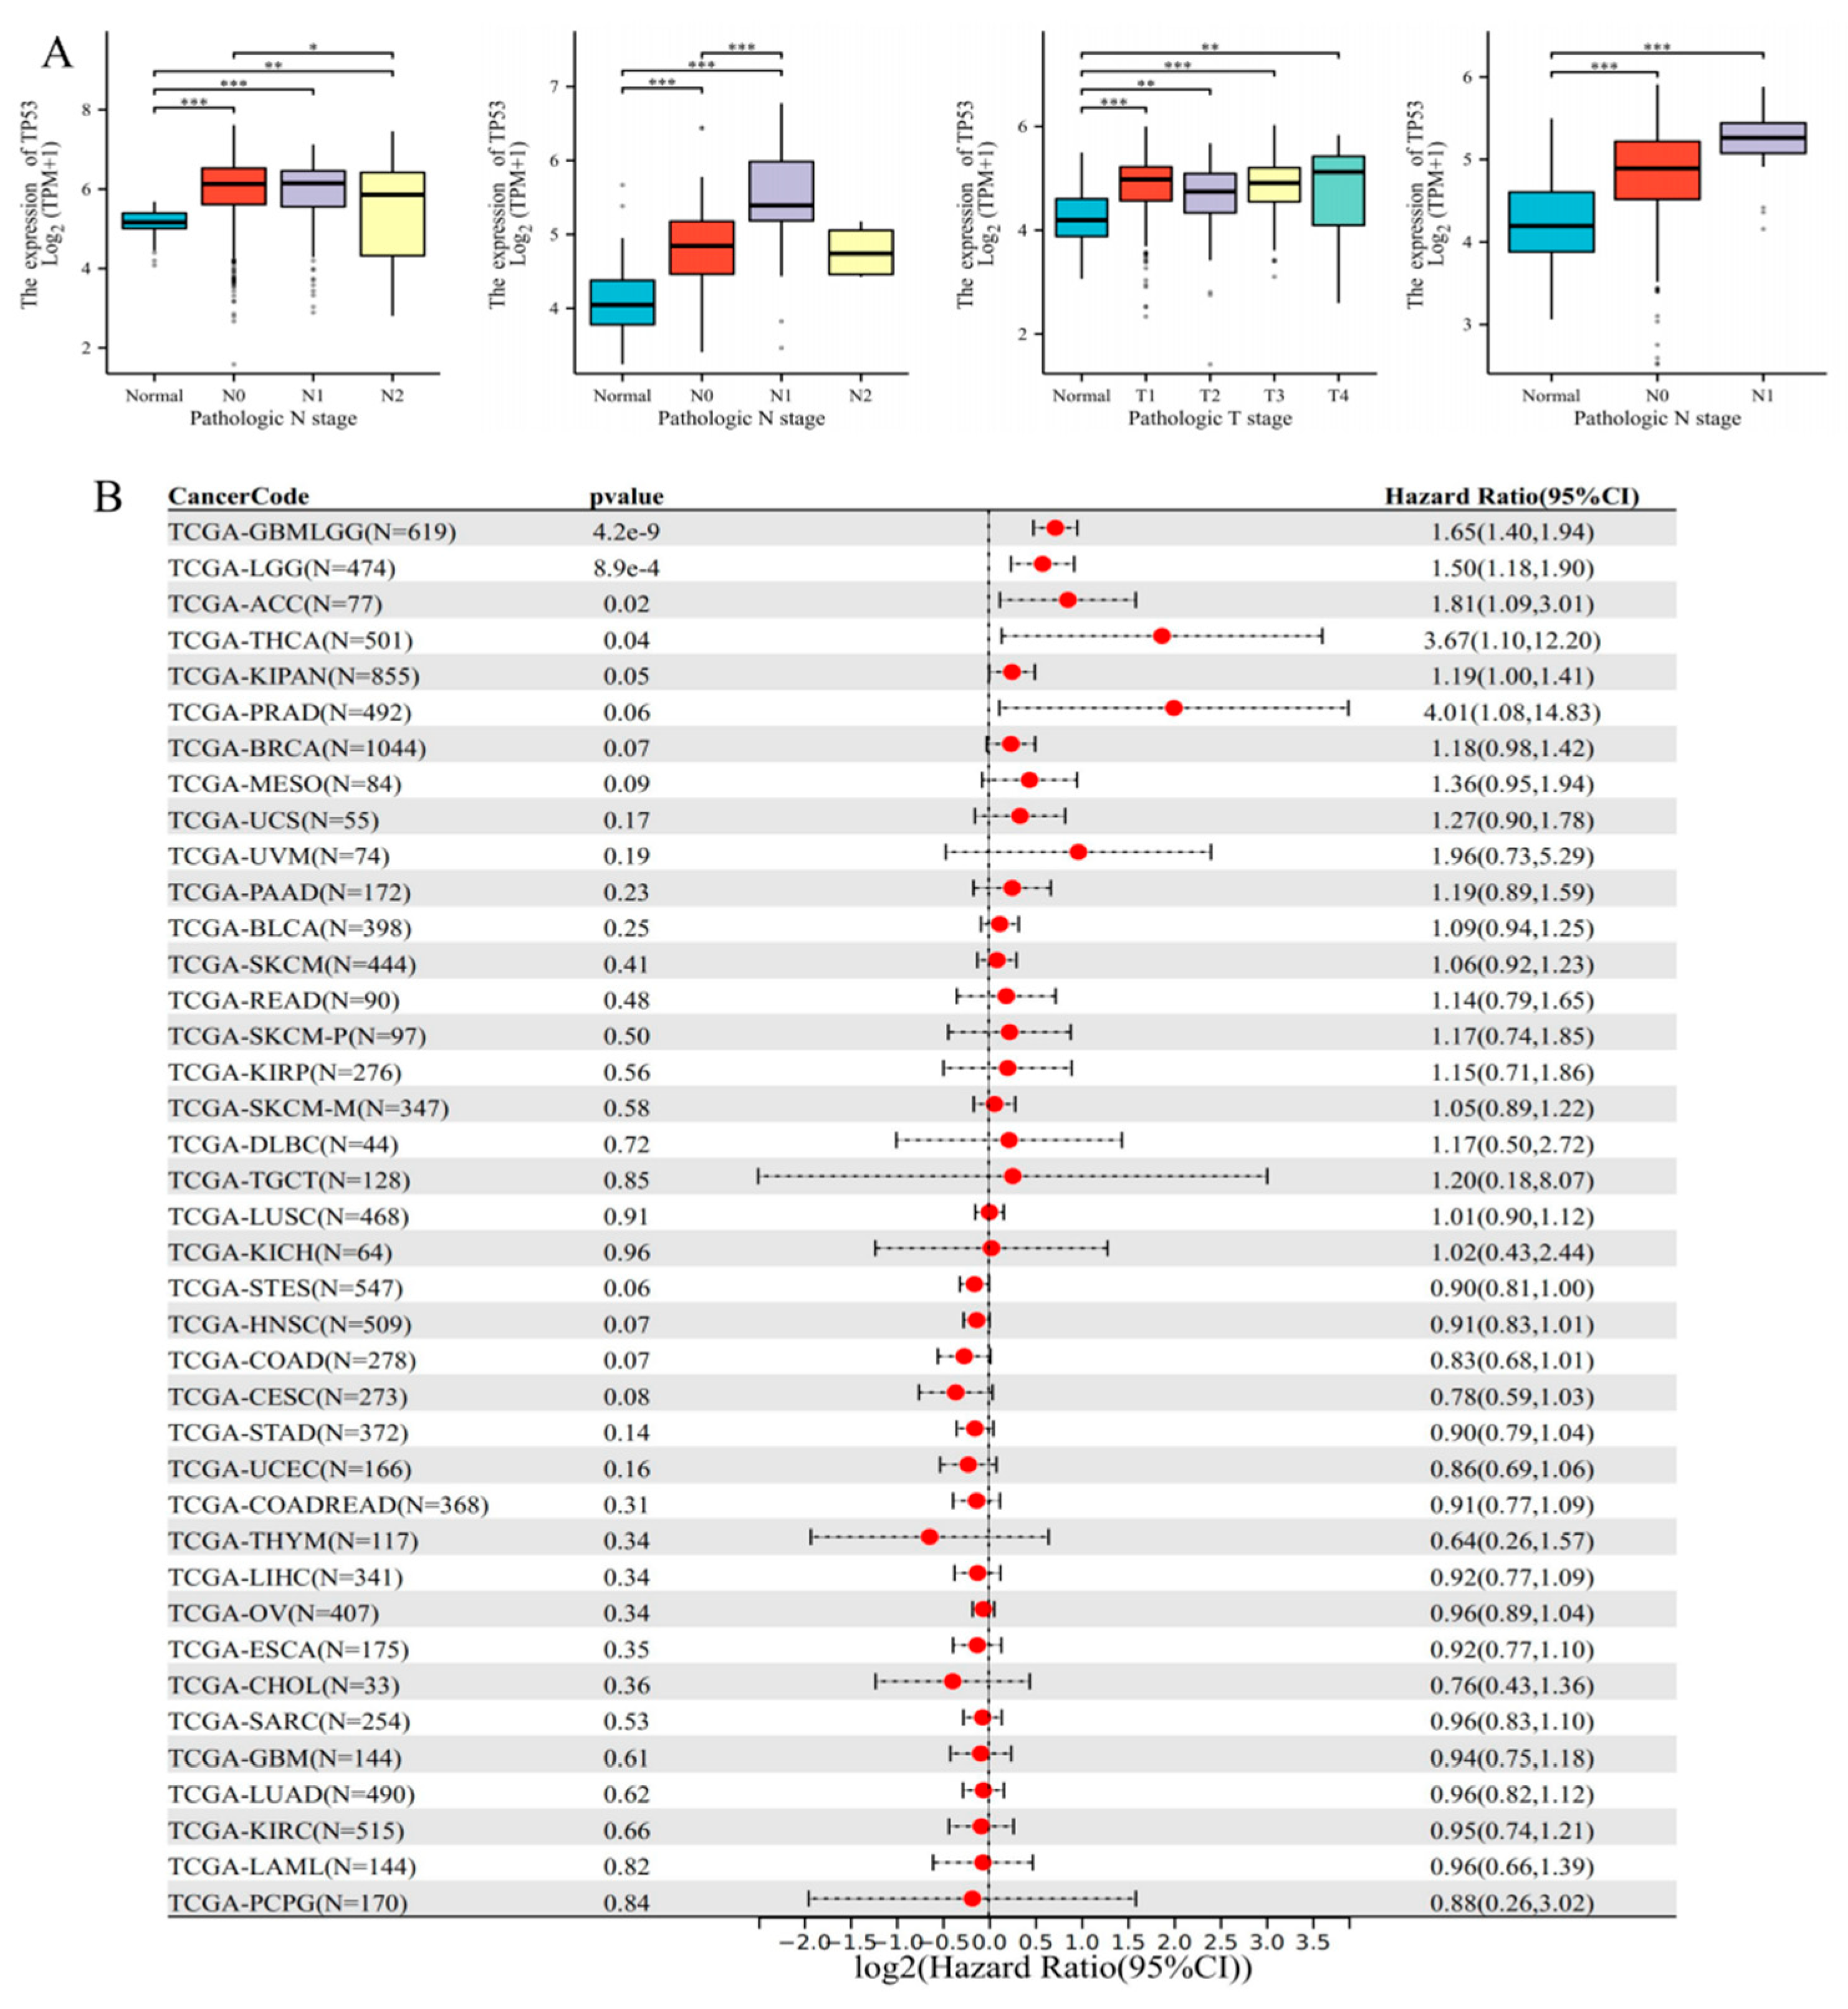
3.3. Clinical Significance and Prognostic Analysis of TP53

TP53 is highly expressed in most tumors. We analyzed the clinical significance of TP53 in tumors by clinicopathological T, N, and M stages, and found that there were differences in N stage in COAD and KIRP, and differences in T and N stages in KIRC (Table 1, Figure 3A). Next, we analyzed the prognosis and diagnosis of TP53 in pan-cancer. The results showed that TP53 expression in five types of tumors was increased with poor prognosis: TCGA–GBMLGG (N = 619, p = 4.2 × 10⁻⁹, HR = 1.65 (1.40, 1.94)), TCGA LGG (N = 474, p = 8.9 × 10⁻⁴, HR = 1.50 (1.18, 1.90)), TCGA KIPAN (N = 855, HR = 1.19, p = 0.05 (1.00, 1.41)), TCGA–THCA (N = 501, p = 0.04, HR = 3.67 (1.10, 12.20)), and TCGA–ACC (N = 77, p = 0.02, HR = 1.81 (1.09, 3.01)) (Figure 3B, Supplementary Table S3). The diagnostic analysis included ROC curve and logistics analyses. The T, N, and M clinicopathological staging and logistics model of TP53 are shown in Table 2.

3.4. Diagnostic ROC Analysis of TP53

The value of the TP53 gene in pan-cancer diagnosis was evaluated using ROC curves. Figure 4 shows the pan-cancer diagnostic values of the TP53 gene. The ROC analysis showed that the respective areas under the curves (AUCs) for BLCA, BRCA, CESC, CHOL, COAD, ESCA, GBM, HNSC, KICH, KIRC, KIRP, LIHC, LUAD, LUSC, PAAD, PCPG, PRAD, READ, SARC, SKCM, STAD, THCA, THYM, and UCEC were 0.625, 0.537, 0.791, 0.987, 0.789, 0.759, 0.993, 0.550, 0.910, 0.767, 0.821, 0.723, 0.676, 0.641, 0.771, 0.507, 0.600, 0.747, 0.684, 0.638, 0.819, 0.693, 0.471, and 0.705, respectively. The results showed that AUC > 0.5 (except THYM), indicating that the TP53 gene has good diagnostic value throughout the analyzed cancers.

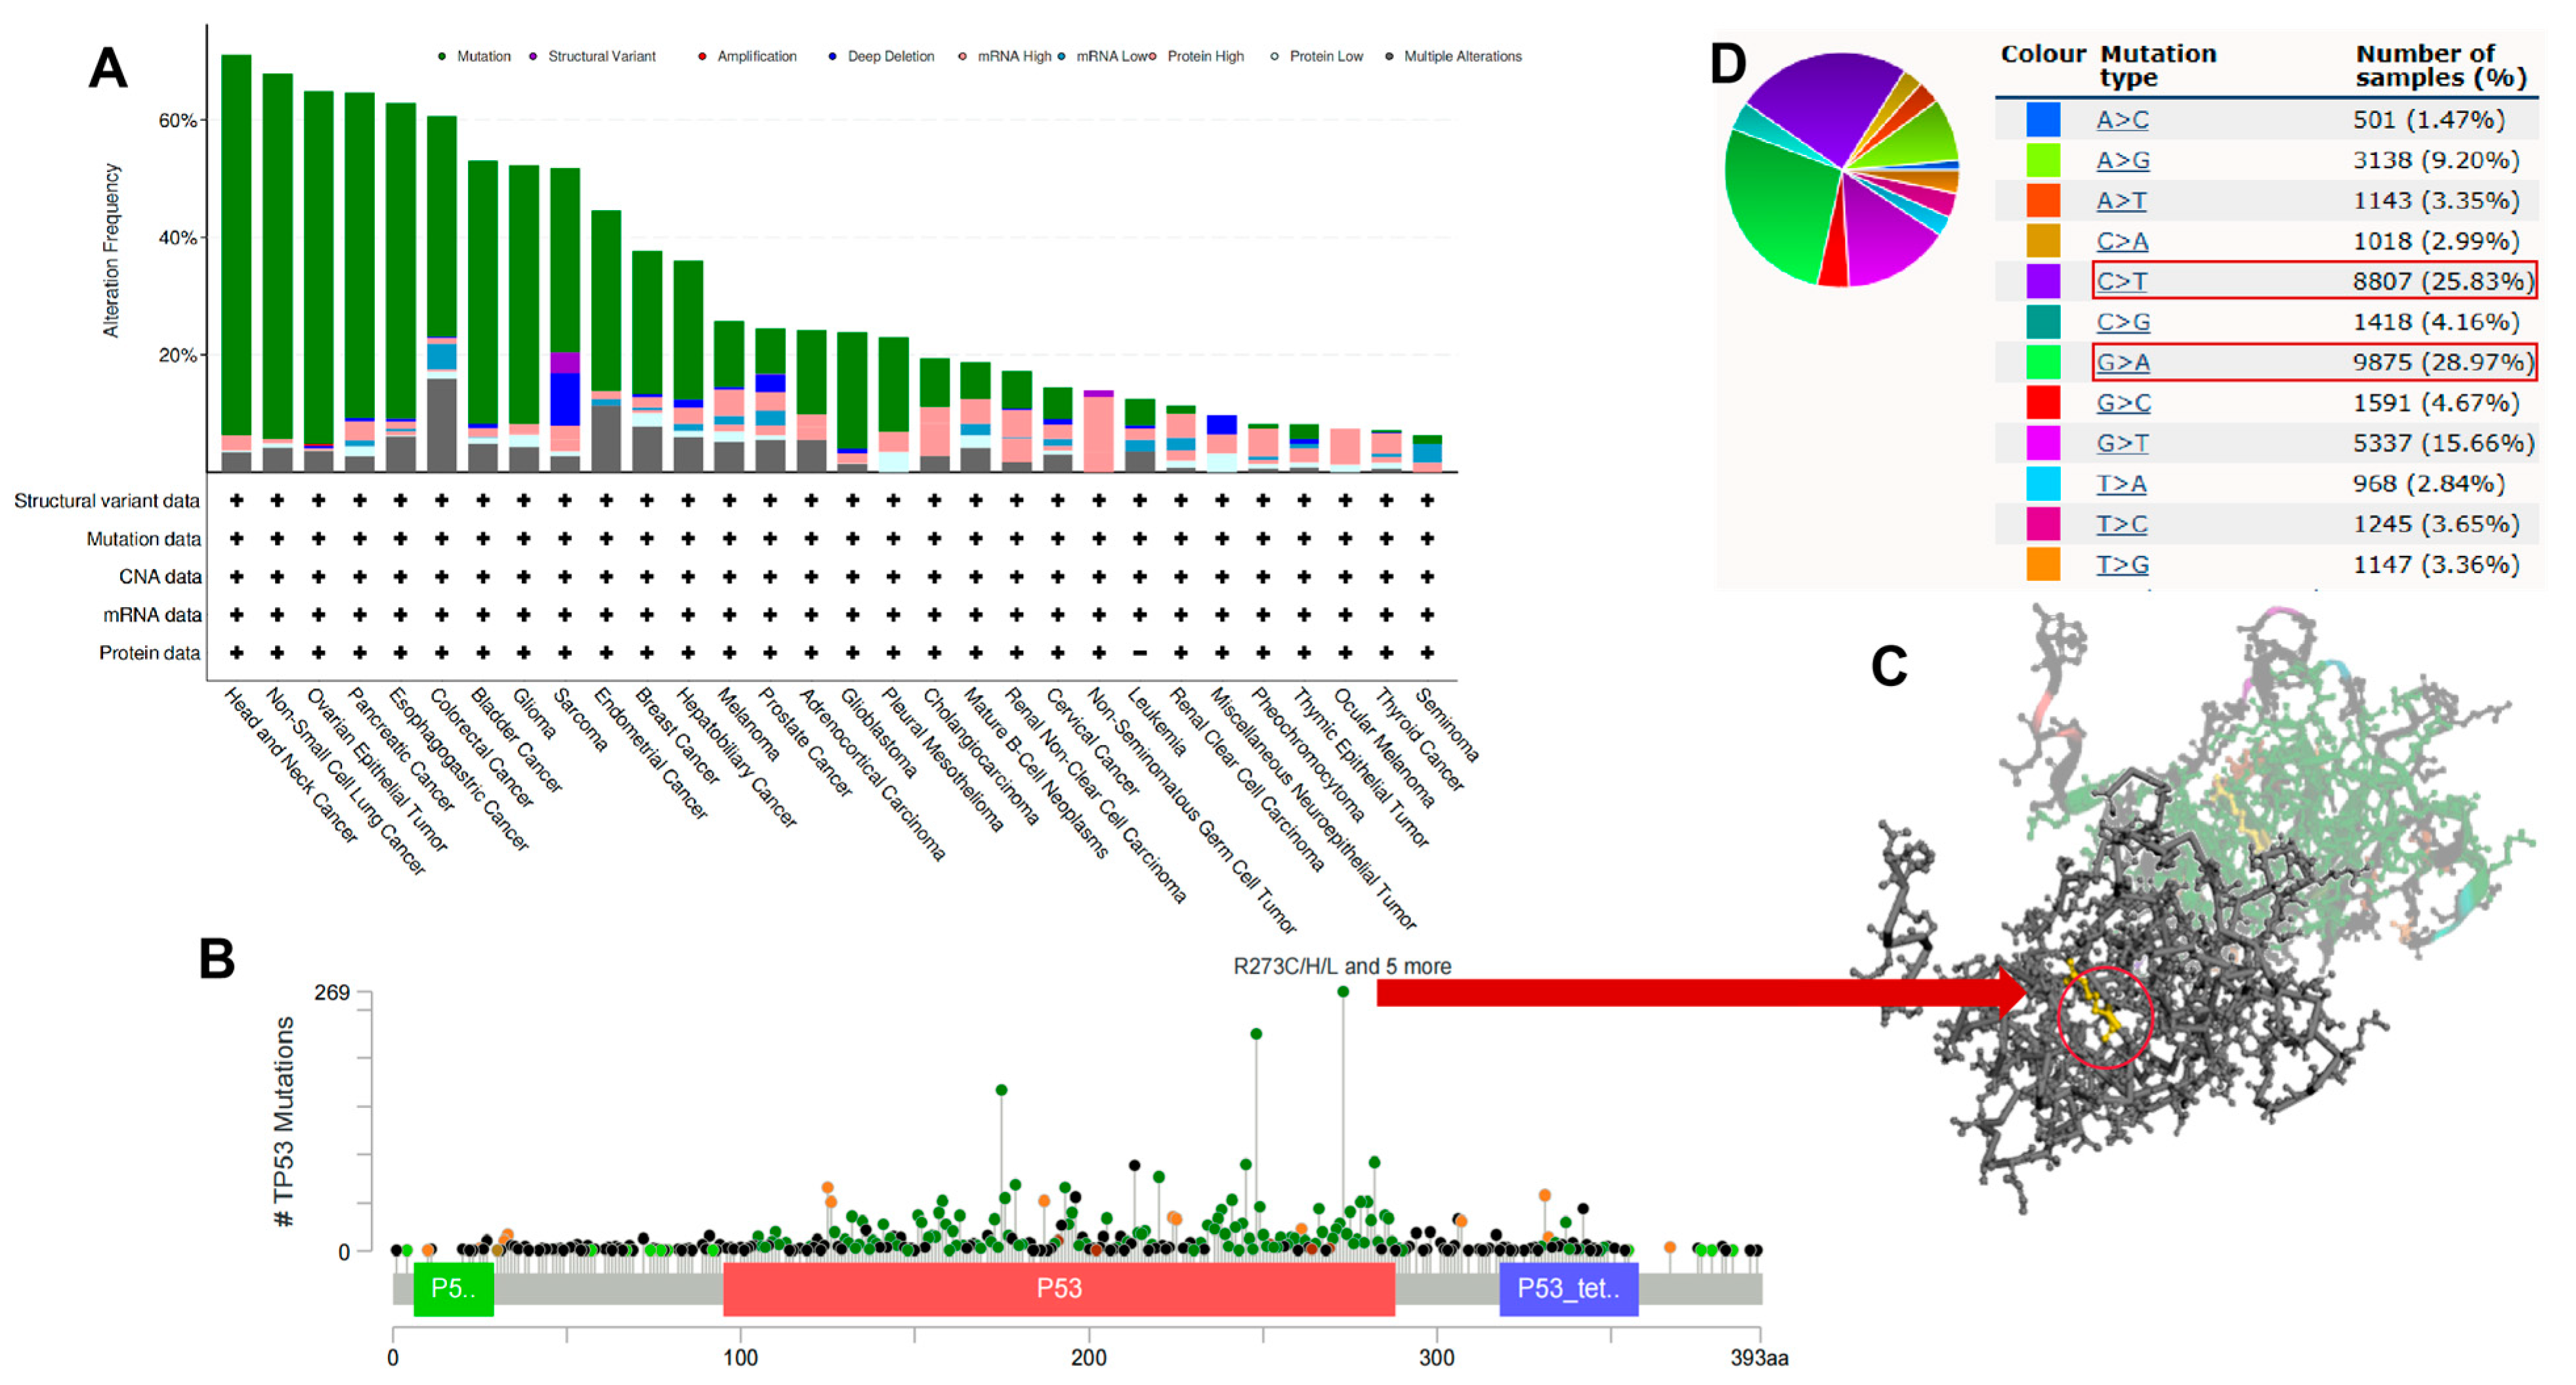
3.5. Pan-Cancer Genetic Alterations of TP53

According to our analysis, the frequency of TP53 alterations (64.82%) was highest in undifferentiated HNSC with “mutation” as the primary type. COAD had the highest incidence of the “multiple alterations” type, with a frequency of 15.99%. Non-seminomatous germ cell tumors had the highest incidence of the “mRNA high” type, with a frequency of 9.3%. SARC had the highest incidence of the “structural variant” and “deep deletion” types, with frequencies of 3.53% and 9.02%, respectively (Figure 5A). Patient TP53 alteration information is shown in Supplementary Table S2. As shown in Figure 5B, there were 4250 mutations in the full sequence of TP53. Also, “mutation” seemed to be the main type of genetic alteration and was mainly located within the P53 DNA-binding domain (95-288). For instance, a missense mutation with potential clinical significance, the R273C/R273H/R273L/R273S/R273P/R273G/R273Lfs*72N274_G279del alteration, was detected in many cases (269 mutations), including in LAML, UCS, ACC, LGG, GBM, LUSC, BLCA, LIHC, PRAD, UCEC, LUAD, ESCA, etc. In addition, the AAChange site was visualized in the 3D structure of TP53 protein (Figure 5C). Most substitution mutations were G to A transitions, followed by C to T transitions (Figure 5D). As shown in Supplementary Figure S2B, genetic alterations in TP53 showed correlations with poor prognosis (including OS and RFS) in LGG and PRAD. The Chi-square test was used to evaluate the differences in the frequencies of gene mutations in each group of samples, and the results of the mutation landscape are shown in Supplementary Figure S3.

3.6. Pan-Cancer mRNA Expression of TP53

Figure 6A shows the pan-cancer expression of TP53 mRNA, mutation sites, and copy number alterations (CNAs). TP53 mRNA was most highly expressed in OV, UCEC, LUSC, DLBC, ESCA, and COAD. The TP53 mutations included Y163C, P278T, Y220C, H193P, T253N, T253A, and I195N. The most common CNA mutations included amplification, gain, diploid, and shallow deletions. As shown in Figure 6B depicting the expression of TP53 mRNA under different mutation situations, the most common type of mutation in TP53 corresponding to the highest mRNA value was missense (VUS), and the CNA mutation was amplified. As shown in Figure 6C, pan-cancer alterations in the TP53 gene fragment were found, with greater alterations in ACC, OV, BRCA, UVM, and COAD. The mutation sites were R196*, S149Ffs*32, Q38Kfs*6, and E285*. The CNA types were diploid and shallow deletion. Figure 6D shows TP53 methylation (WRAP53 (cg06587969): methylation (HM27 and HM450 merge)), mRNA expression, mutation location, and CNAs. The highest mRNA expression value for TP53 methylation was log10 = 0.02201, corresponding to the mutation point Y163C. The CNA referred to amplification. R273H was the mutation point of TP53, with a high log10 = 0.620327 expression value, and the CNA was shallow deletion. As shown in Figure 6E, regarding the relationship between the putative CNA and mRNA expression of TP53, the mutation site with the highest mRNA expression was Y163C, and both putative CNA and CNA were amplified. As shown in Figure 6F, the relationship between mRNA expression and TP53 protein showed that the highest mRNA expression value was negatively correlated with protein expression when the mutation site was Y163C and the CNA was amplified. The highest protein expression value was positively correlated with mRNA expression when the mutation site was R273S and the CNA was diploid. As shown in Figure 6G depicting the number of pan-cancer TP53 mutations, mutation sites, and CNAs, the highest numbers of TP53 mutations were seen in UCEC, UVM, and GBM. The mutation sites were H168Cfs*8, R273C, X125_splice, E56*, X25_splice, and Y234C. The CNAs included gain, diploid, and shallow deletion. The pan-cancer mRNA expression, mutation sites, methylation, and protein expression of TP53 are shown in Supplementary Table S4.

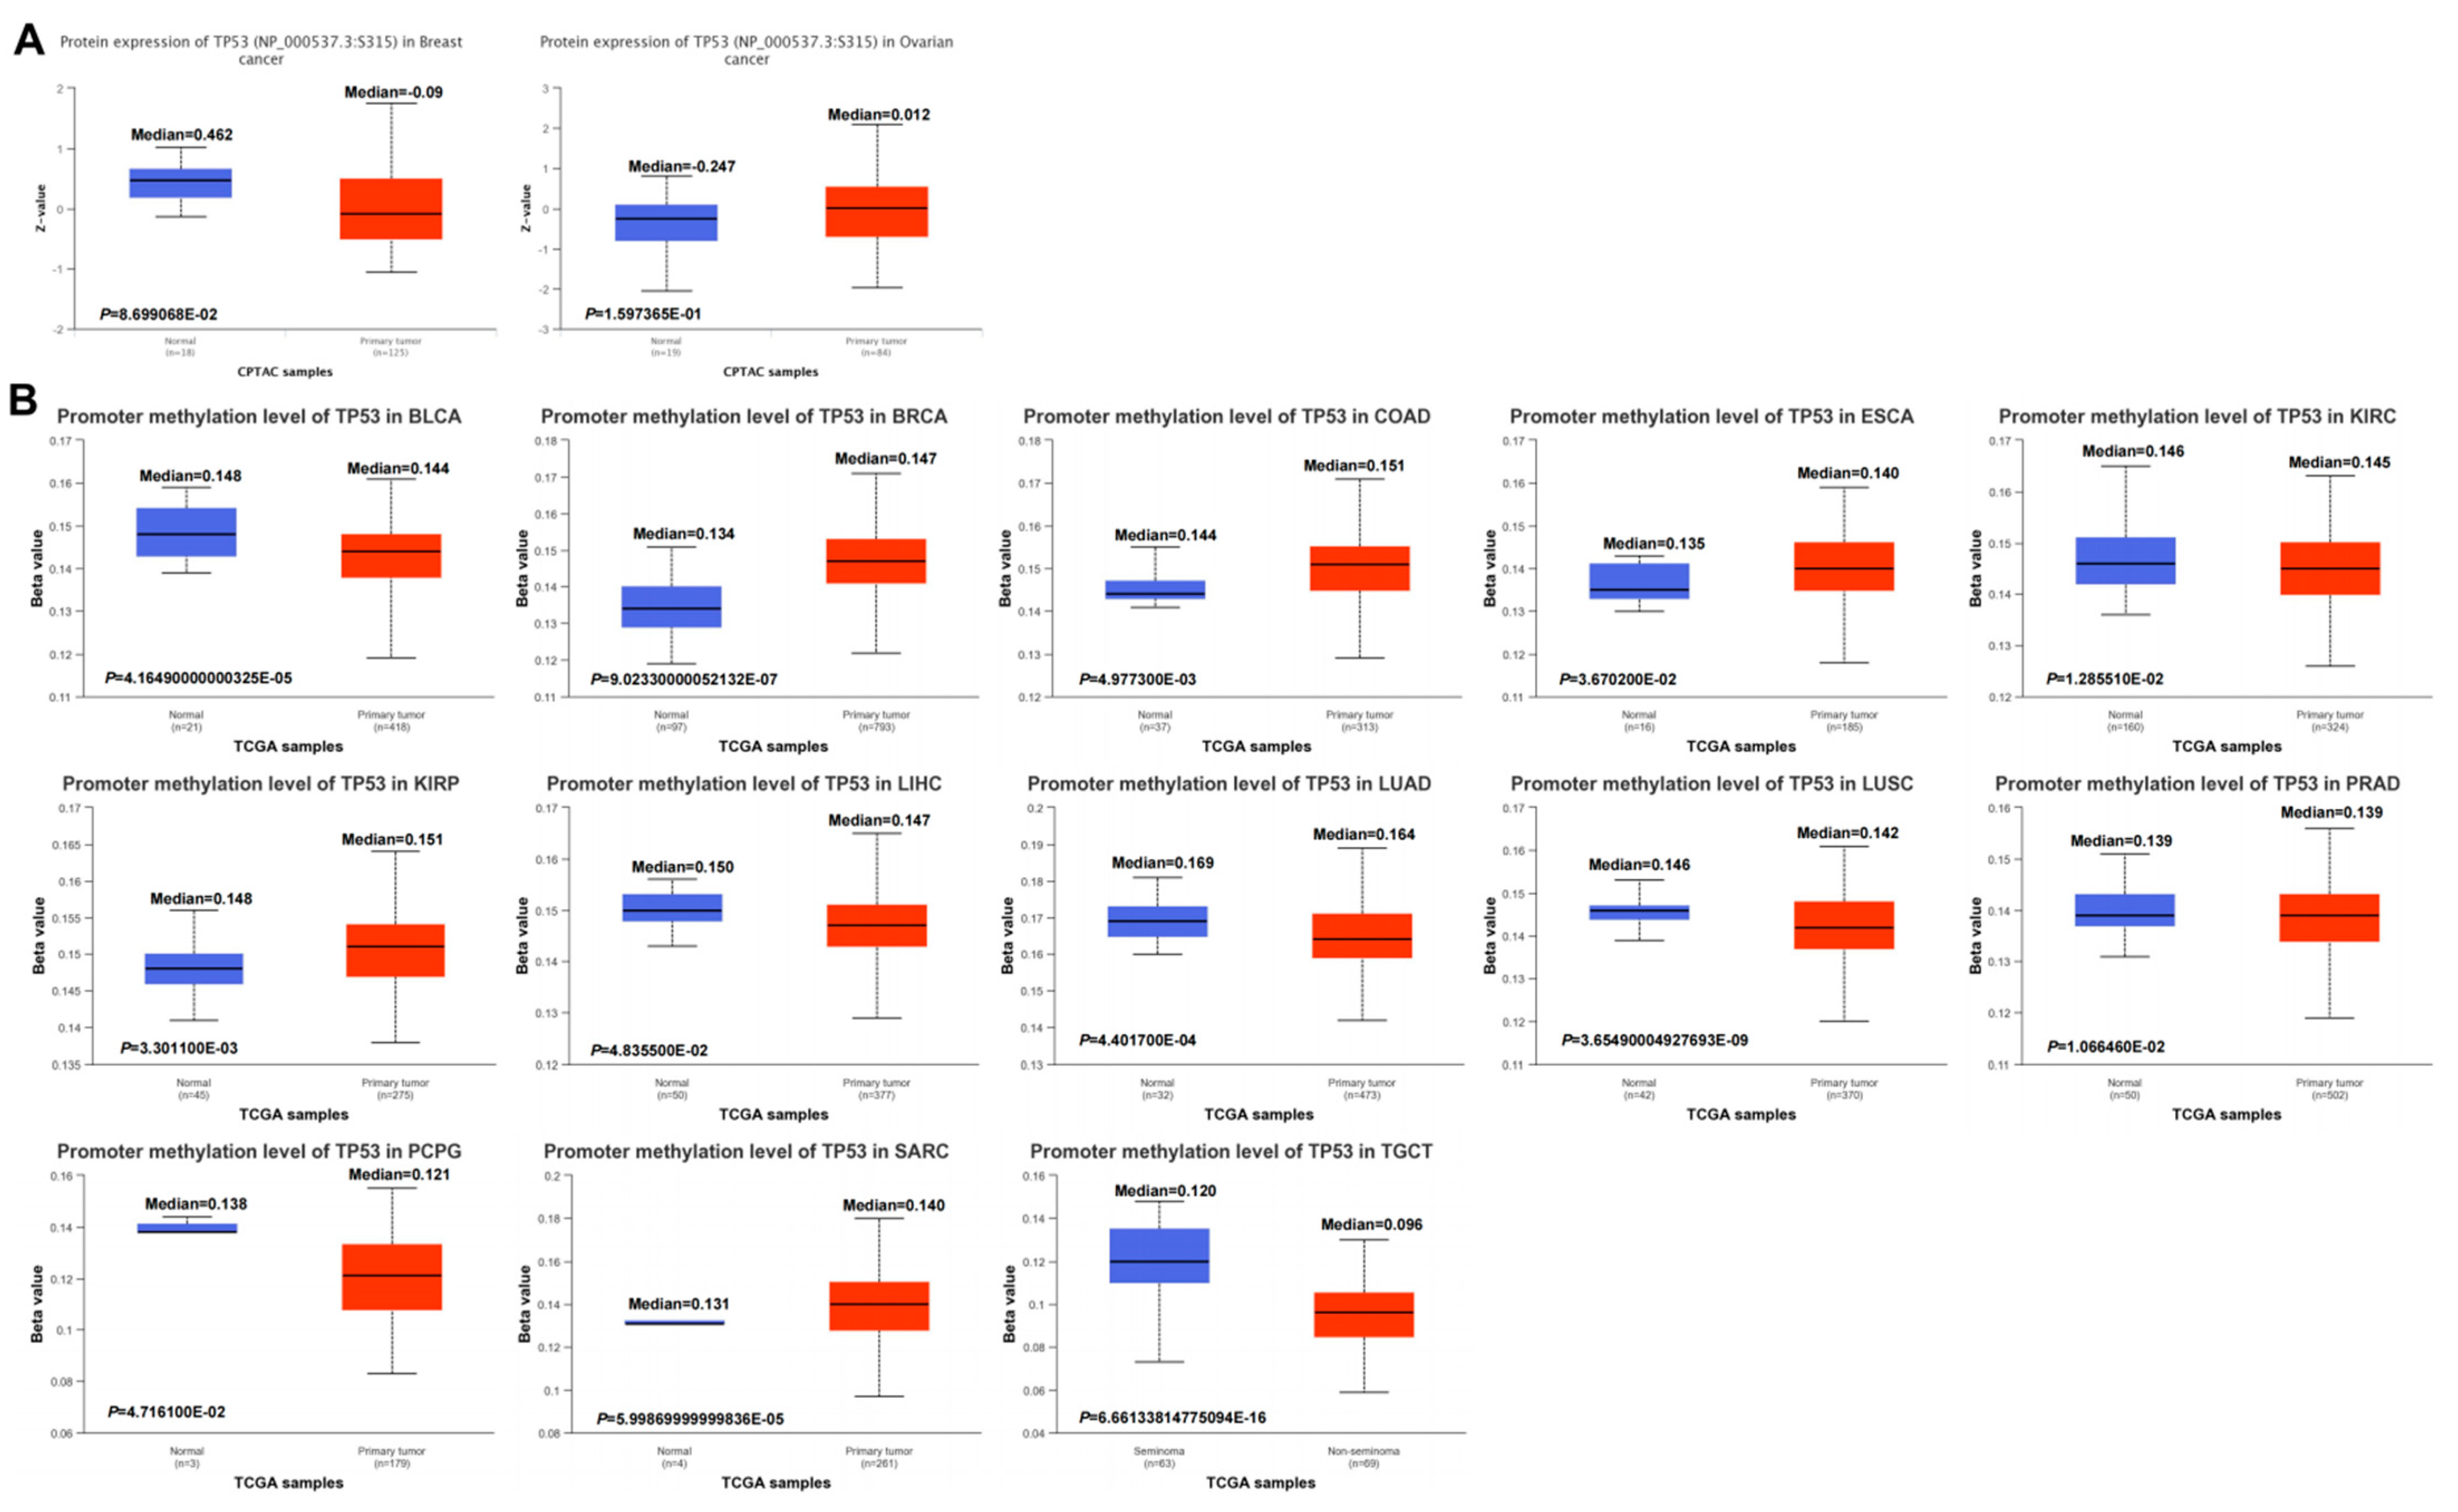
3.7. Pan-Cancer DNA Methylation of TP53

We further explored the phosphorylation of TP53 in normal and primary tumor tissues. However, using the CPTAC dataset, we found no pan-cancer differences in TP53 phosphorylation (Figure 7A). In multiple cancers, DNA methylation throughout the genome is an epigenetic modification that contributes to the regulation of cancer-associated genes. However, the underlying role of TP53 methylation in various cancers remains unclear. In our study, we demonstrated decreased promoter methylation levels of TP53 in BLCA, KIRC, LIHC, LUAD, LUSC, PRAD, PCPG, SARC, and TGCT and increased promoter methylation levels of TP53 in BRCA, COAD, ESCA, and KIRP (Figure 7B). No obvious changes in the methylation values of TP53 were observed in other cancers (Supplementary Figure S4).

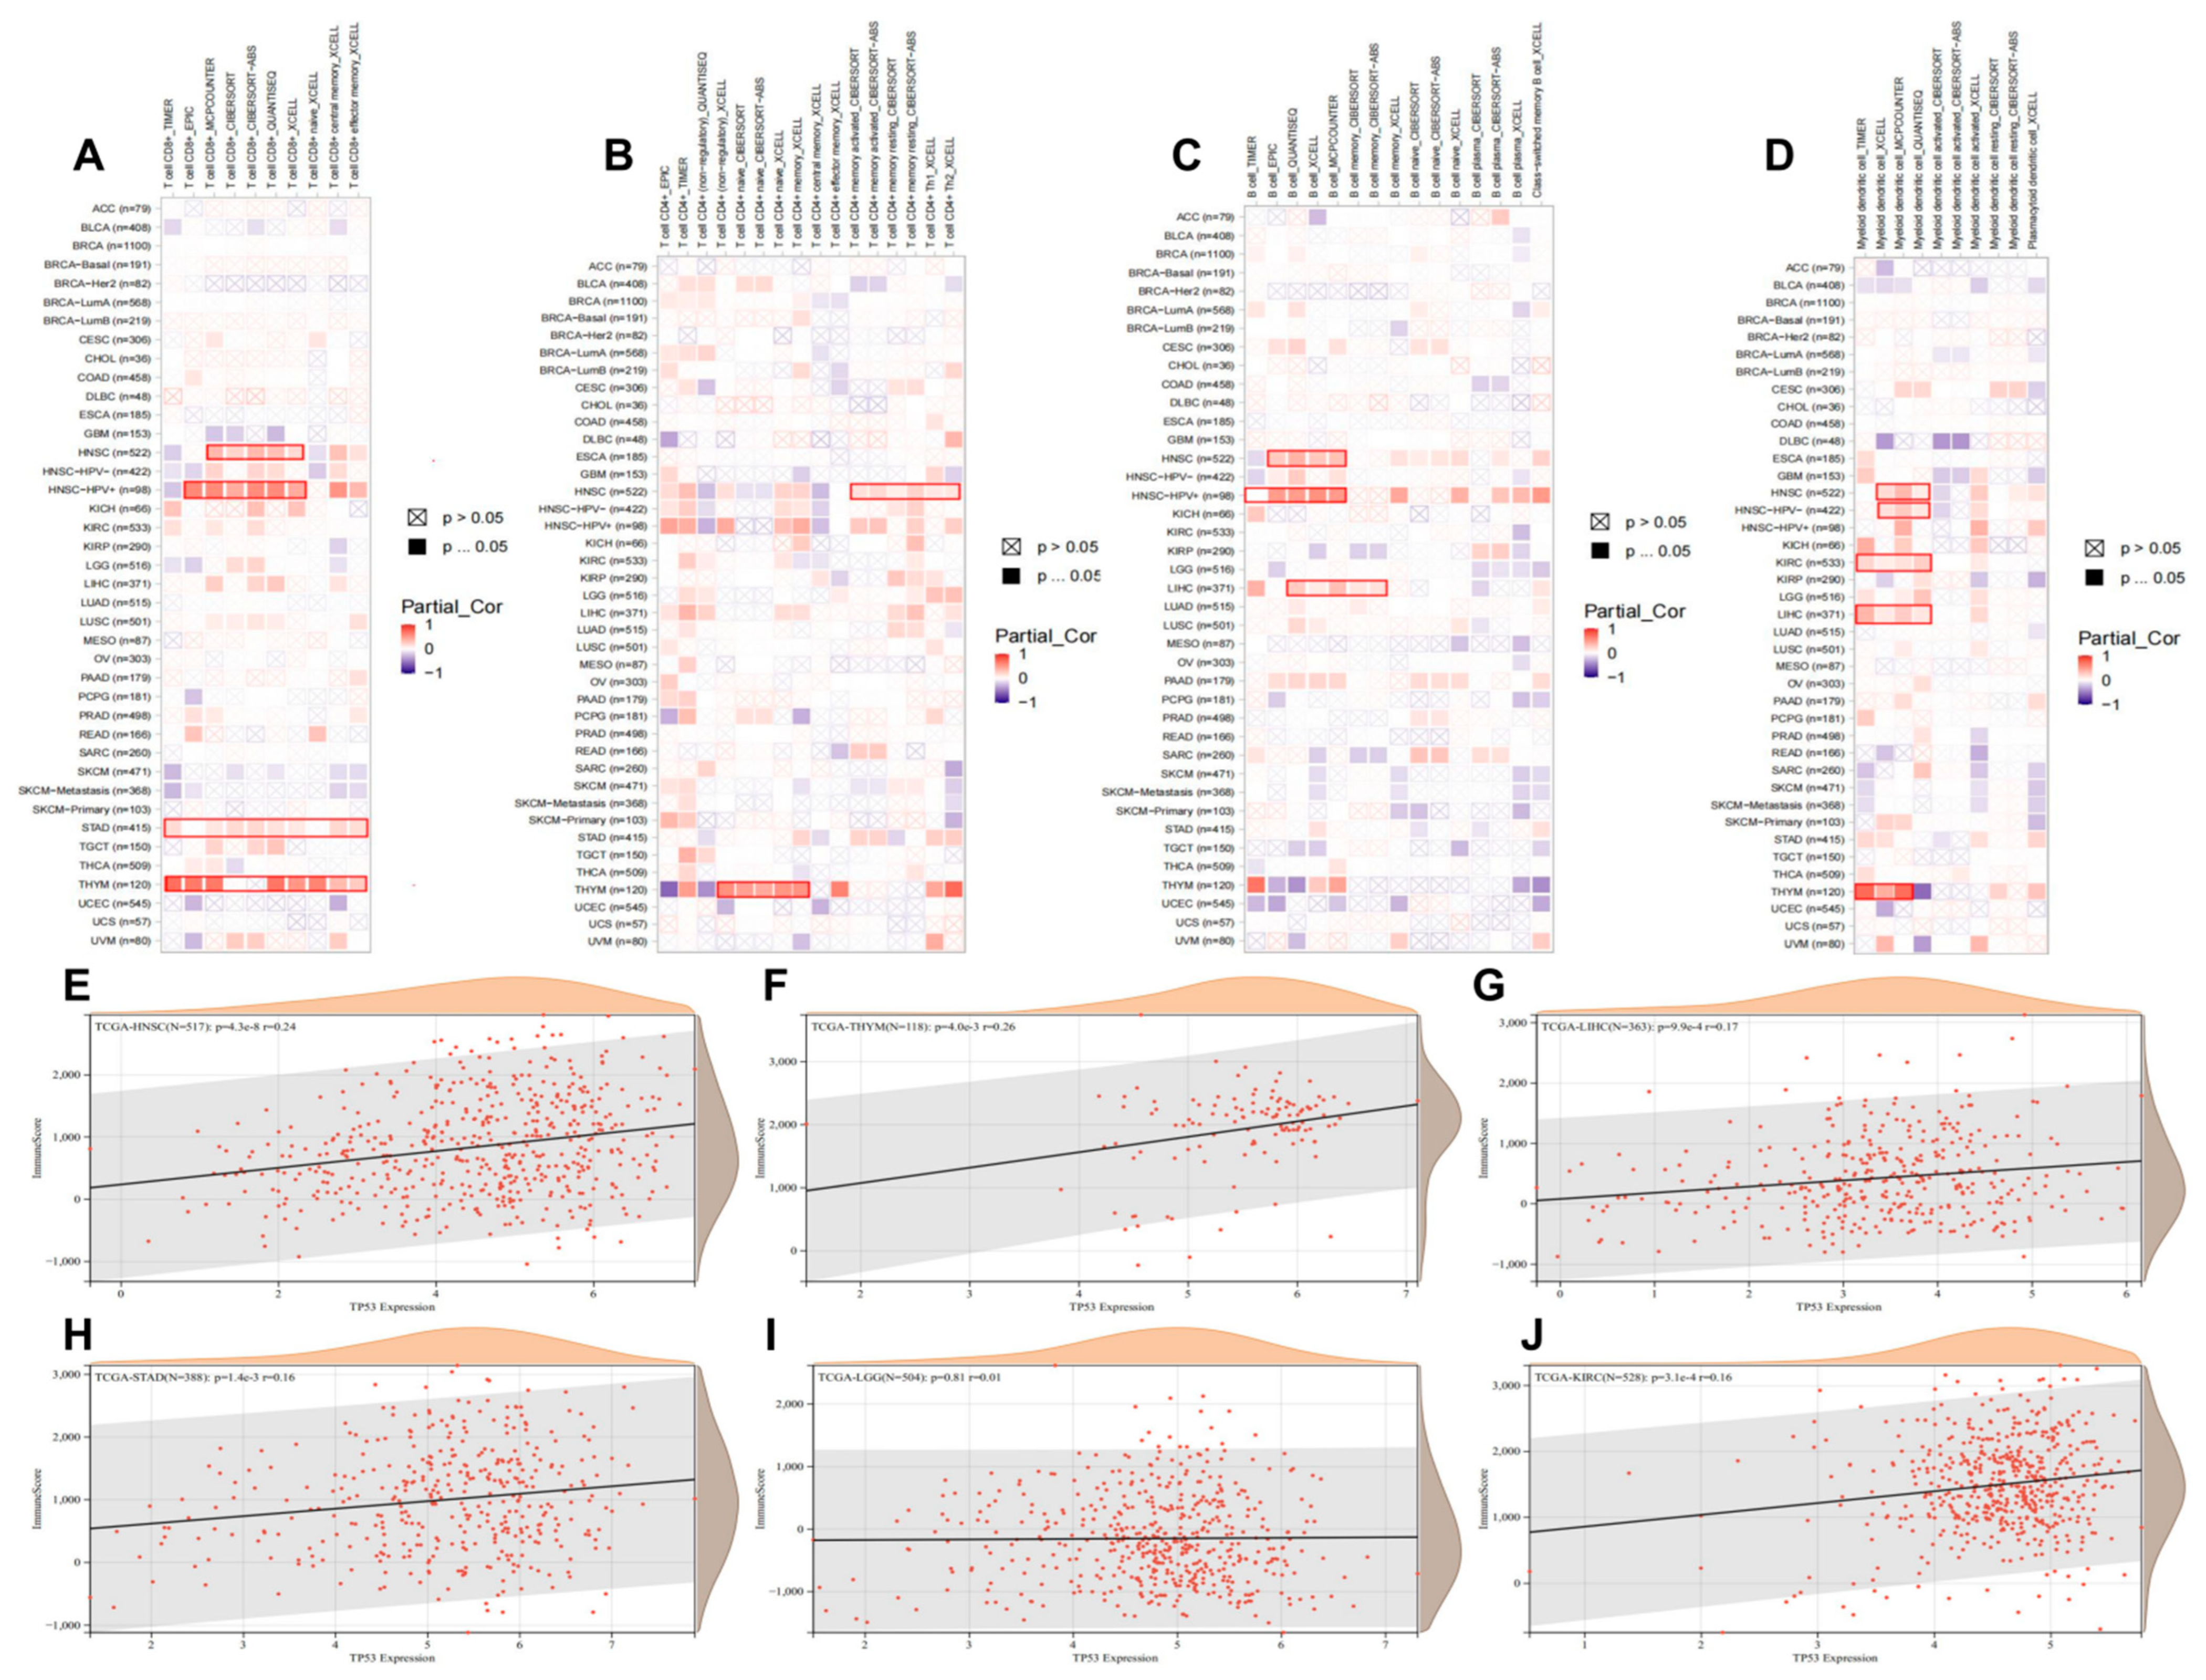
3.8. Pan-Cancer Roles of TP53 in Immune Infiltration

Here, we explored the potential correlation between TP53 expression and tumor-infiltrating immune cells by performing a comprehensive analysis. Seven algorithms, namely TIMER, EPIC, MCPCOUNTER, CIBERSORT, CIBERSORT-ABS, QUANTISEQ, and XCELL, were applied to estimate immune infiltration in different tumor types. As shown in Figure 8A–D, there were positive correlations between TP53 expression and CD8+ T cells, CD4+ T cells, B cells, and myeloid dendritic cells (DC) in HNSC, LIHC, THYM, STAD, LGG, and KIRC. Supplementary Figure S5A shows that pan-cancer TP53 expression was negatively correlated with the immune cells. At the same time, we also investigated the correlation between TP53 expression and immune infiltration in HNSC (R = 0.24), LIHC (R = 0.26), THYM (R = 0.17), STAD (R = 0.16), LGG (R = 0.01), and KIRC (R = 0.16). The results showed that TP53 expression was positively correlated with immune cell infiltration (Figure 8E–J). Information on TP53 expression and tumor-related immune infiltration is shown in Supplementary Table S5.

3.9. Analysis of Tumor Stemness and Immune Checkpoints

The tumor suppressor TP53 maintains an equilibrium between self-renewal and differentiation to sustain a limited repertoire of stem cells for the proper development and maintenance of tissue homeostasis. The inactivation of TP53 disrupts this balance and promotes pluripotency and somatic cell reprogramming. A few reports in recent years have indicated that prevalent TP53 oncogenic gain-of-function (GOF) mutations further boost the stemness properties of cancer cells [36]. Stem cells are a rare population of cells that can perpetuate themselves through self-renewal and can produce mature cells of a tissue by differentiation [37]. We observed a significant association with TP53 in 14 tumors, with significant positive correlations in 3 tumors (LGG (N = 507) (R = 0.186, p = 2.54 × 10⁻⁵), LAML (N = 167) (R = 0.284, p = 1.98 × 10⁻⁴), THYM (N = 119) (R = 0.415, p = 2.65 × 10⁻⁶)) and significant negative correlations in 11 tumors (BRCA (N = 1080) (R = −0.099, p = 0.001), SARC (N = 253) (R = −0.289, p = 3.19 × 10⁻⁶), KIRP (N = 283) (R = −0.147, p = 0.013), KIPAN (N = 860) (R = −0.398, p = 4.52 × 10⁻³⁴), KIRC (N = 512) (R = −0.372, p = 3.01 × 10⁻¹⁸), LIHC (N = 366) (R = −0.237, p = 4.31 × 10⁻⁶), THCA (N = 499) (R = −0.263, p = 2.44 × 10⁻⁹), TGCT (N = 147) (R = −0.223, p = 0.006), PCPG (N = 176) (R = −0.239, p = 0.001), SKCM (N = 102) (R = −0.355, p = 2.47 × 10⁻⁴), KICH (N = 65) (R = −0.257, p = 0.039)) (Supplementary Figure S5B). The pan-cancer relationship between TP53 and immune checkpoints included 24 inhibition sites and 36 activation sites. The inhibition sites mainly included CD276, VEGFB, IL10, LAG3, and PDCD1, whereas the activation sites included HMGB1, TNFSF4, BTN3A1, TNF, ICAM1, and CD27 (Supplementary Figure S5C).

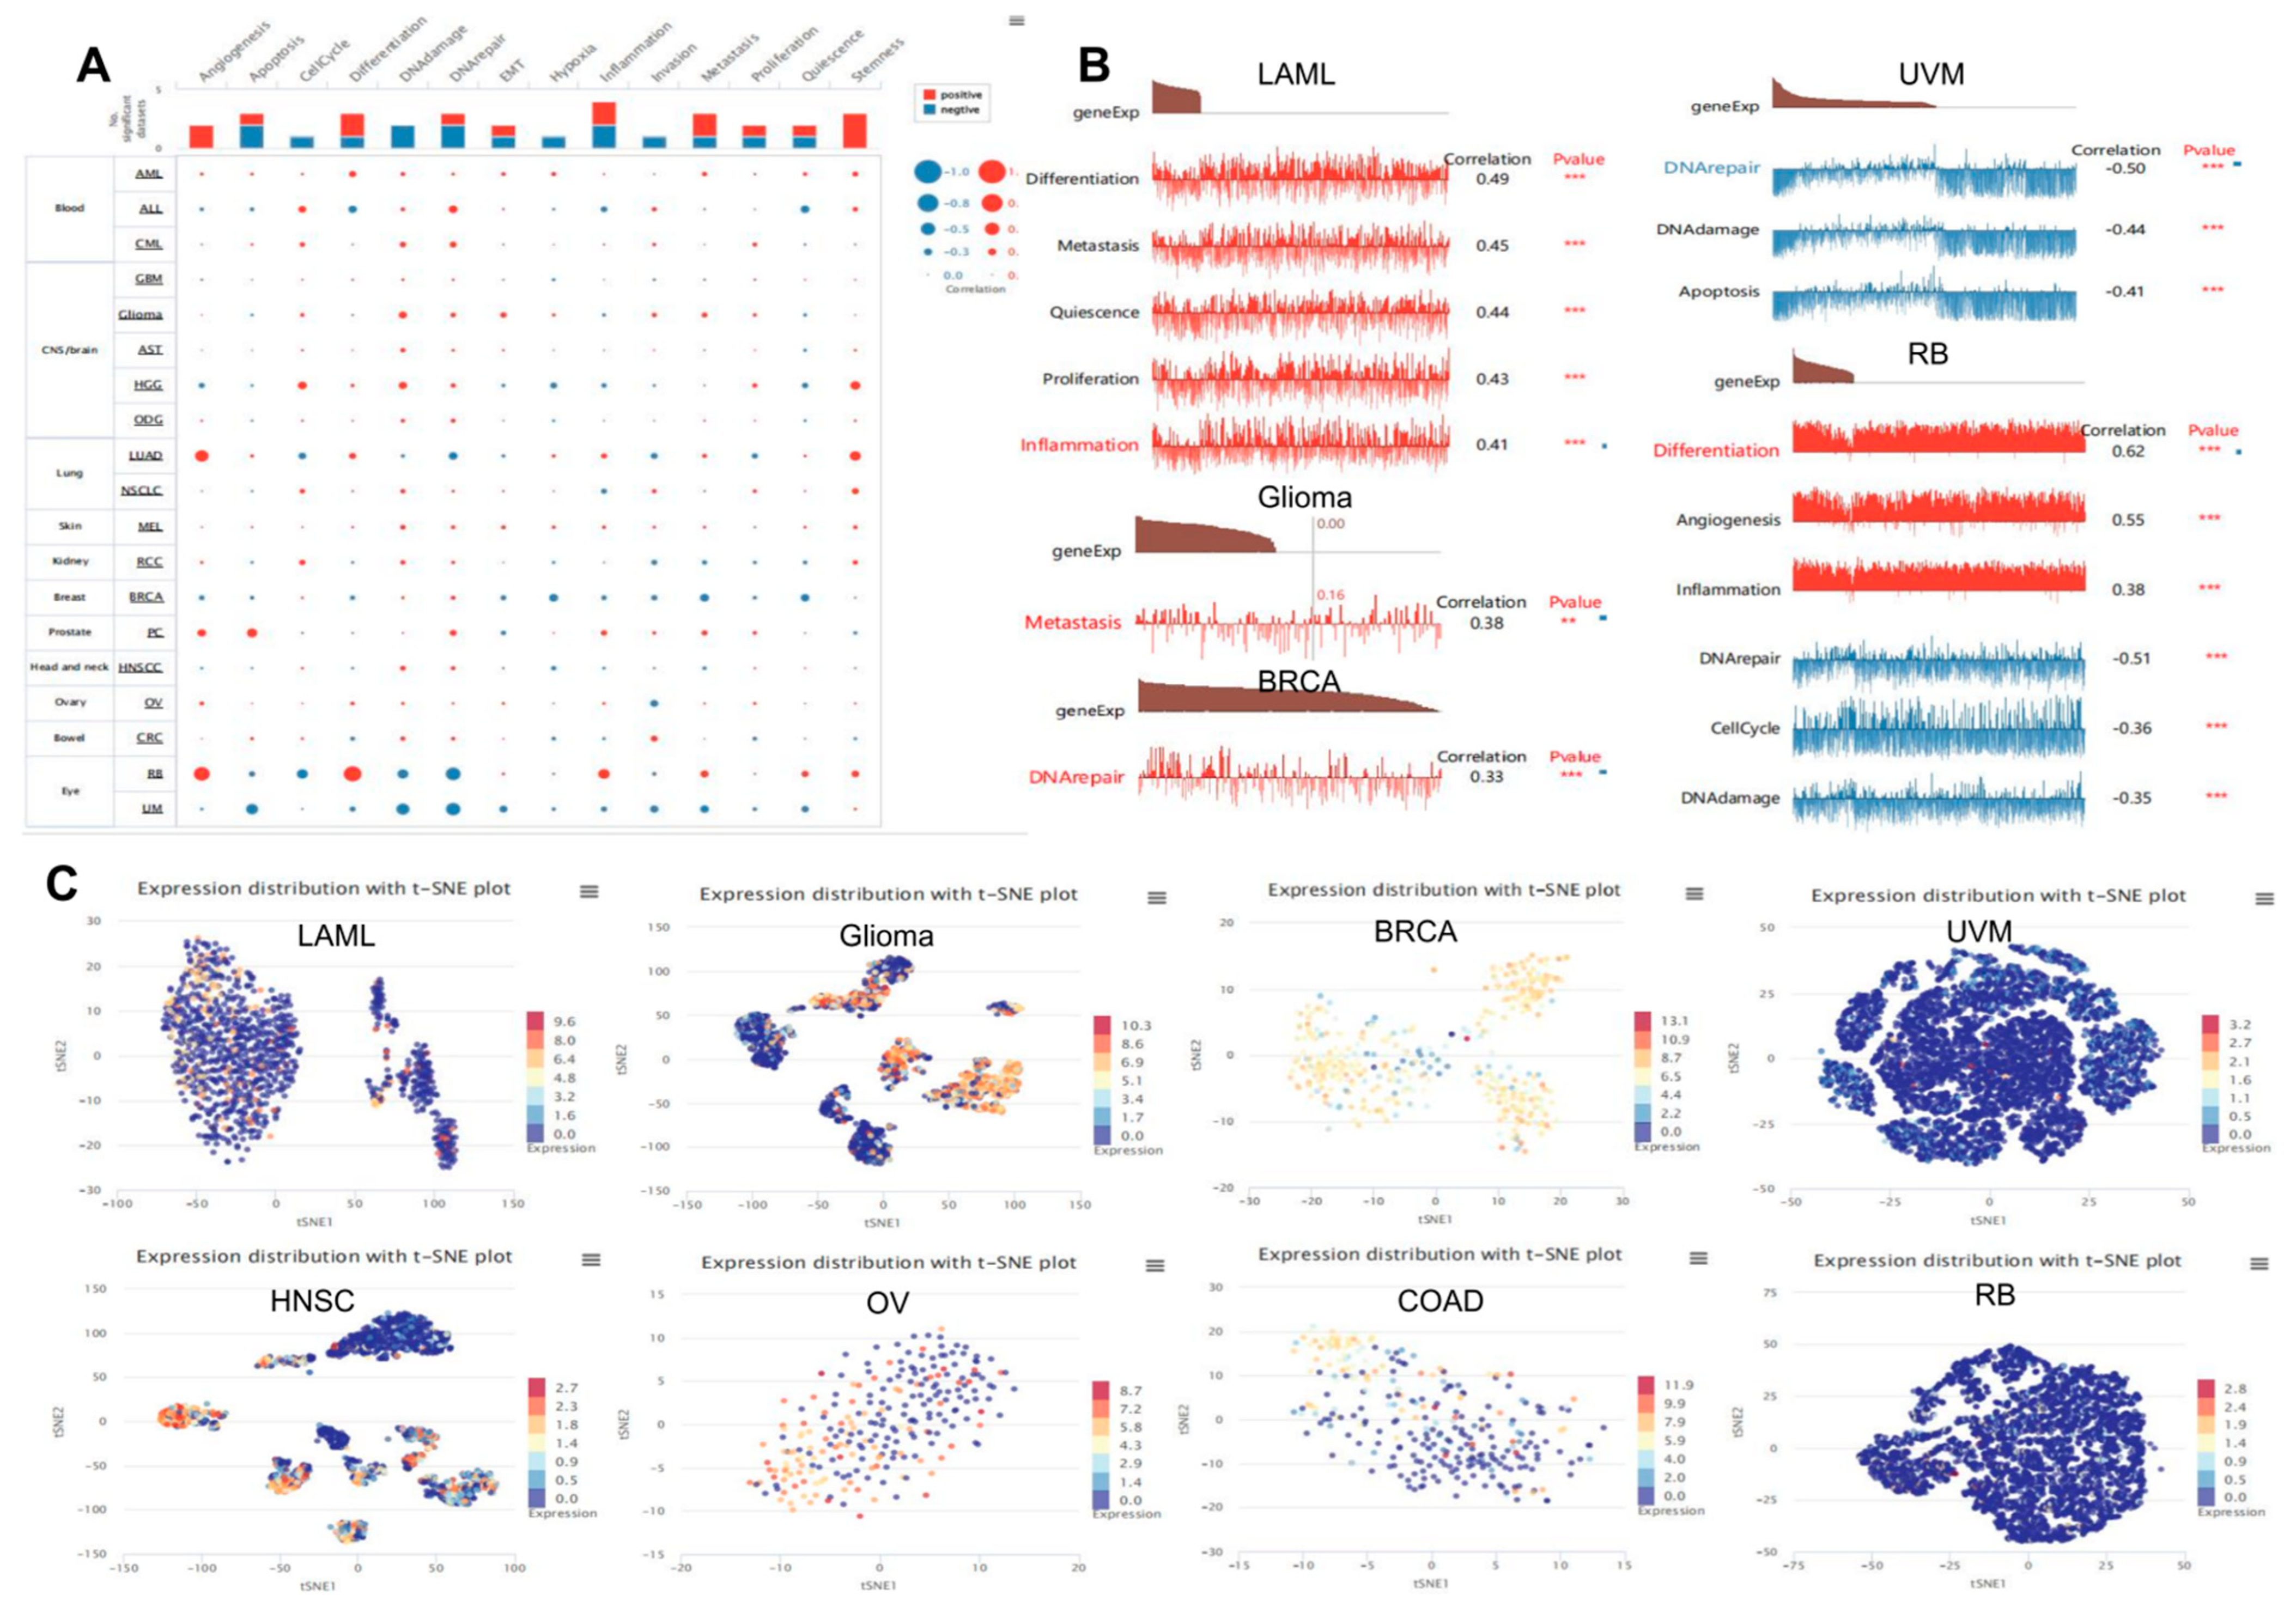
3.10. Expression Pattern of TP53 in a Single Cell and Its Relationship with Cancer Functional Status

Single-cell sequencing technology has been used to study the internal heterogeneity of tumor cells, tumor invasion and metastasis, tumor treatment and drug resistance, and evolution of the tumor microenvironment [38,39]. We searched the CancerSEA website to verify the expression of TP53 at the single-cell level in different cancers and its relationship with the tumor’s functional status. In Figure 9A and Supplementary Table S6, the heatmap shows that TP53 was strongly correlated with tumor functional status in most cancer types. Figure 9B and Supplementary Table S7 show the relationship between TP53 expression and LAML, Glioma, BRCA, UVM, and RB. TP53 expression profiles are shown at single-cell levels in LAML, Glioma, BRCA, UVM, HNSC, OV, COAD, and RB using T-SNE diagrams (Figure 9C). These results suggest that TP53 may play a crucial role in the biological processes of cancer progression, including showing positive correlations with differentiation, metastasis, inflammation, proliferation, and quiescence, and negative correlations with DNA repair, DNA damage, cell cycle, and apoptosis.

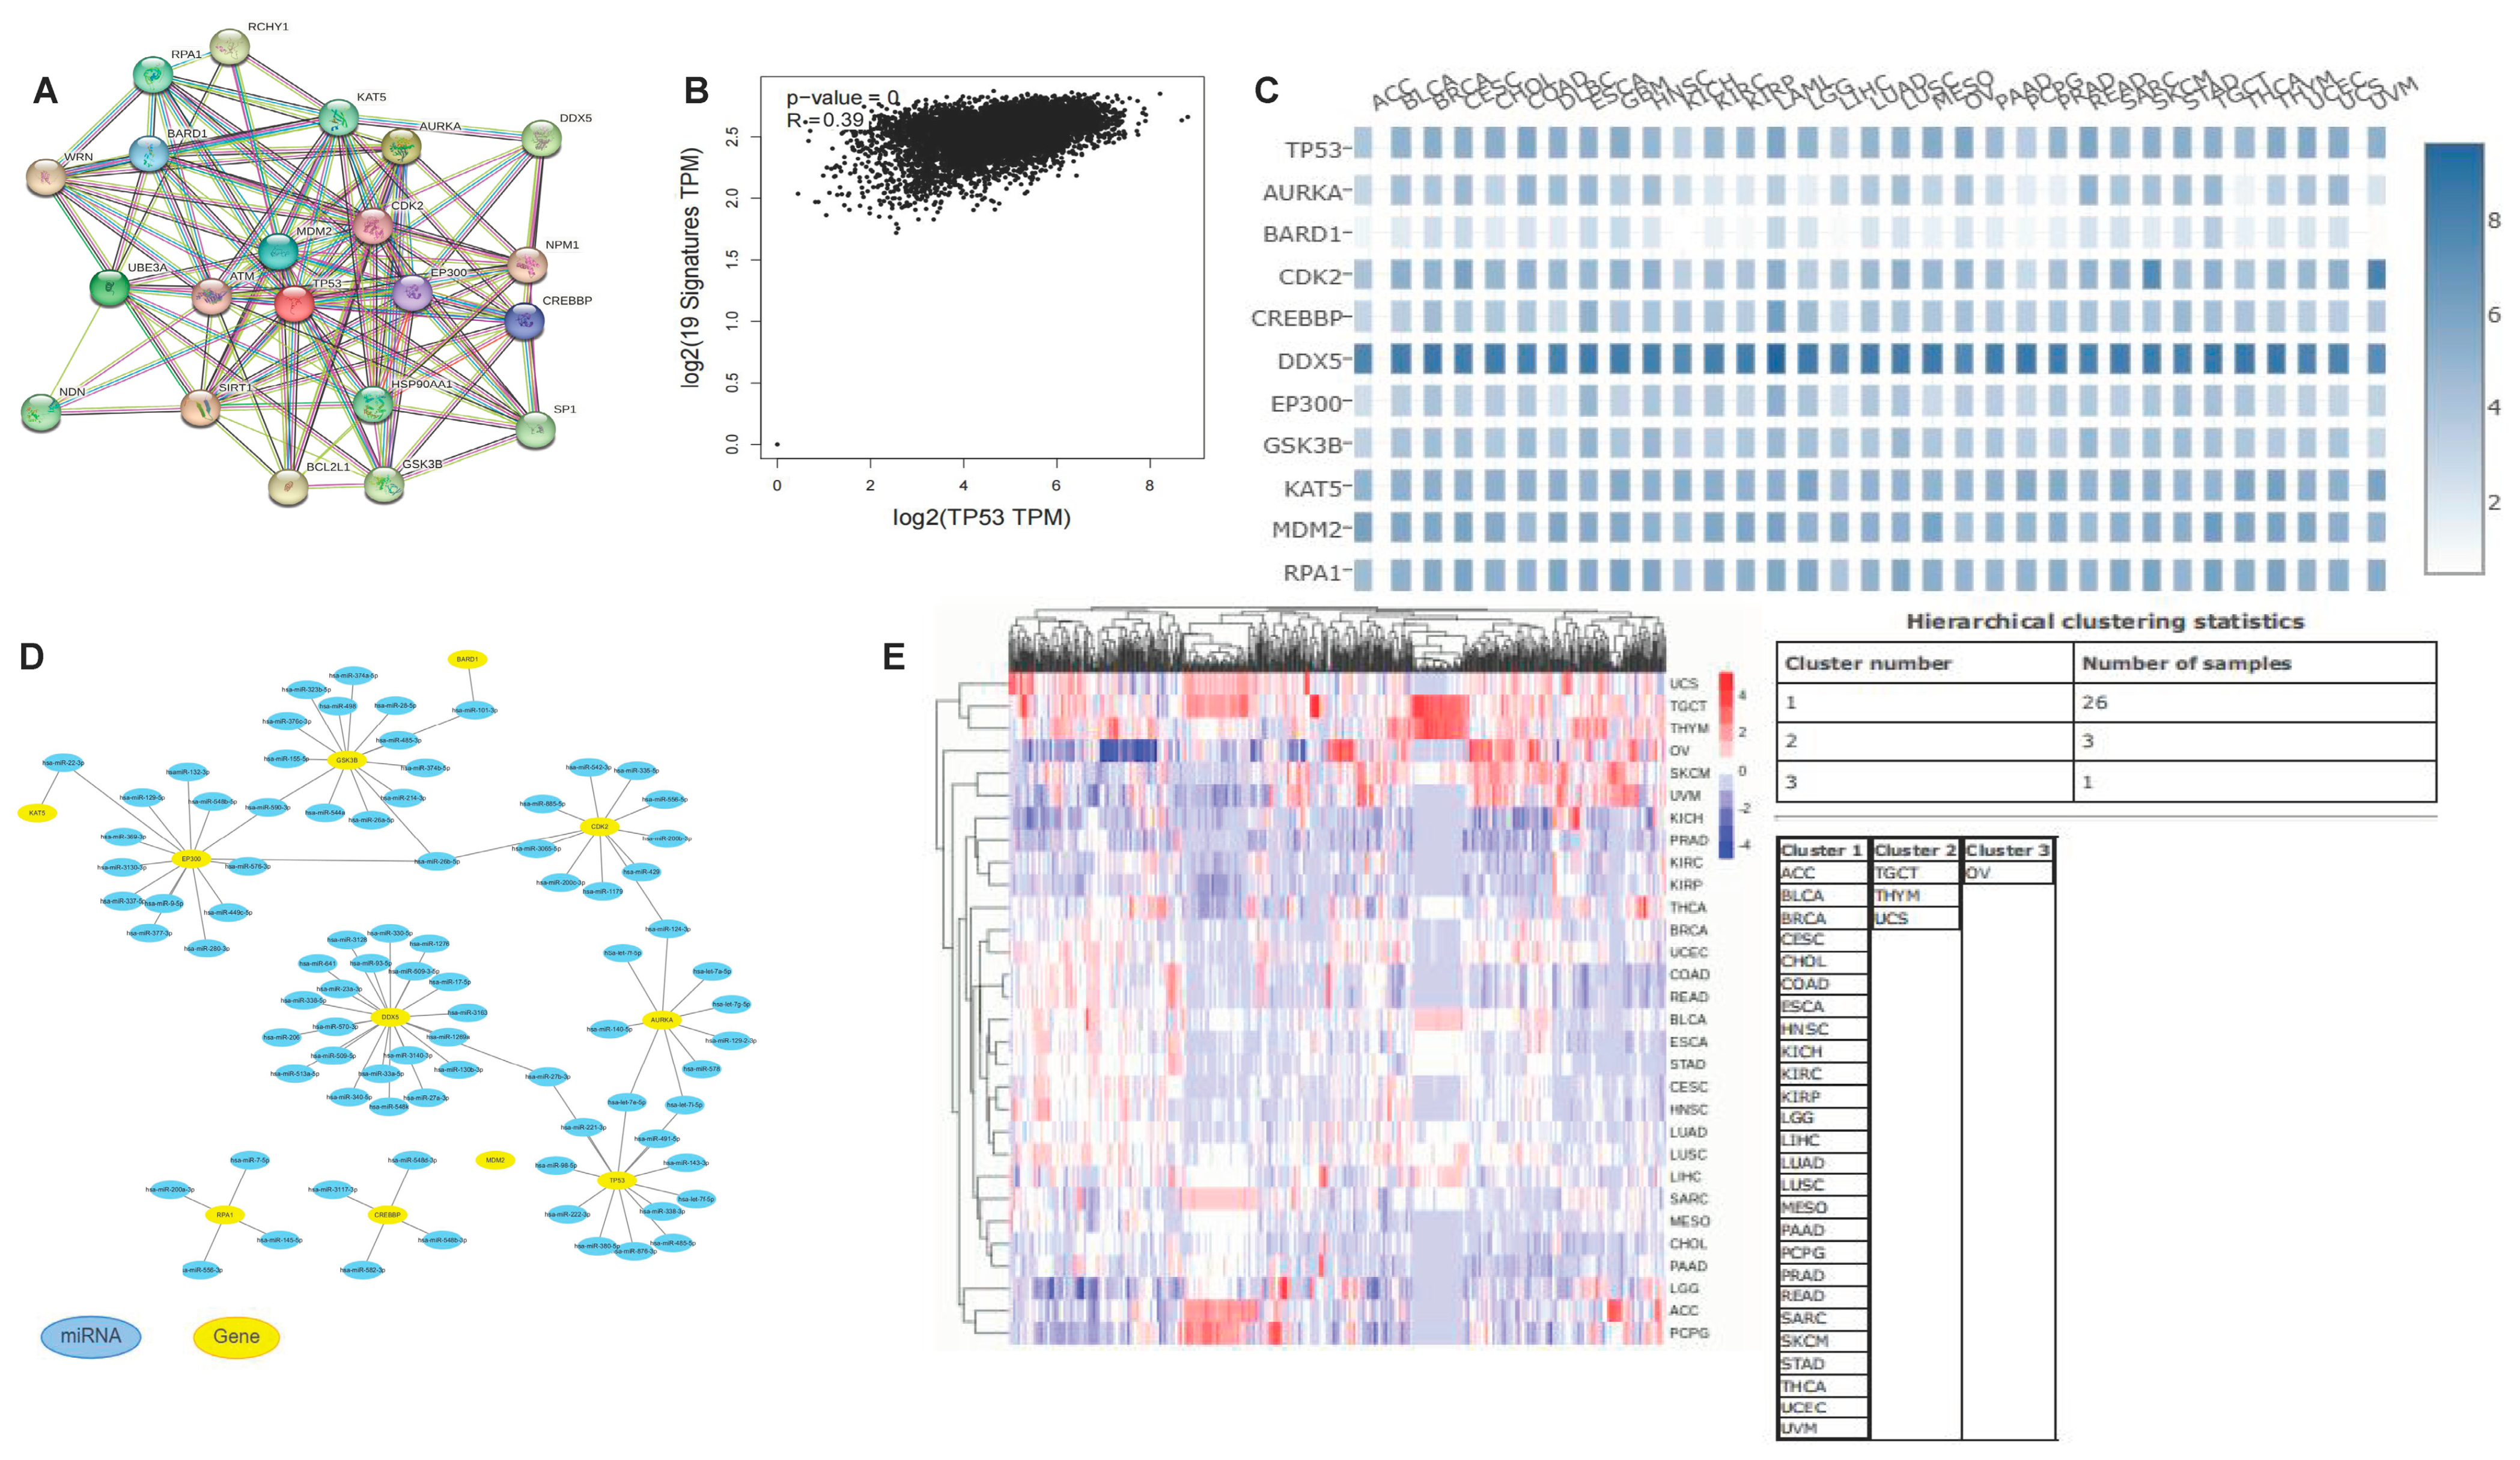
3.11. Co-Expression Network of TP53

The TP53-related proteins were aurora kinase A (AURKA), BRCA-associated RING domain 1 (BARD1), cyclin-dependent kinase 2 (CDK2), CAMP responsive element binding protein (CREBBP), DEAD-box helicase 5 (DDX5), E1A-binding protein P300 (EP300), glycogen synthase kinase 3β (GSK3β), lysine acetyltransferase 5 (KAT5), MDM2 proto-oncogene (MDM2), and replication protein A1 (RPA1). The PPI network contained 21 nodes and 120 edges, with an average node degree of 11.4 and the average local clustering coefficient was 0.738 (Figure 10A). As shown in Figure 10B and Supplementary Figure S6A, TP53 showed good correlations with the interacting proteins. The heatmap demonstrated that TP53 had strong positive correlations with the ten aforementioned genes in most cancer types (Figure 10C). As shown in Figure 10D, the miRNAs that were strongly associated with TP53 included hsa-let-7e-5p, hsa-miR-98-5p, hsa-miR-221-3p, hsa-miR-222-3p, hsa-miR-380-5p, and hsa-miR-485-5p. Cluster analysis was performed on the above miRNAs, which were divided into three categories; a positive correlation is marked in red, while a negative correlation is marked in blue (Figure 10E). Supplementary Figure S6B shows the results of pan-cancer survival curve analysis for these miRNAs. High expression of hsa-let-7e-5p and hsa-miR-98-5p was associated with a long survival time, while high expression of hsa-miR-221-3p, hsa-miR-222-3p, hsa-miR-380-5p, and hsa-miR-485-5p was associated with a shorter survival time. At the same time, some studies have shown that these miRNAs are related to pan-cancer cell proliferation, migration, and immune infiltration [40,41,42,43]. These results indicate that miRNAs play an important role in the regulation of pan-cancer prognosis. Thus, they have the potential to serve as pan-cancer biomarkers. The signaling pathways involved included the pentose phosphate, glycolysis, tricarboxylic acid cycle, T cell activation, ferroptosis, DNA response damage, Wnt signaling, mitogen-activated protein kinase 1 (MAPK) signaling, transforming growth factor (TGF), and cell cycle pathways, among others (Supplementary Figure S7).

3.12. TP53-Related Transcription Factors

The TP53 tumor suppressor protein is a major barrier preventing cancer from occurring and developing. In terms of biochemistry, TP53 functions primarily as a sequence-specific transcription factor capable of binding to DNA sequences identified within the genome (called TP53 response elements or TP53 binding sites) and activating the transcription of adjacent genes, as well as the transcription of more distant genes regulated by enhancers with TP53 binding sites. In addition, TP53 can inhibit the transcription of a large number of genes, often through indirect mechanisms. In normal unstressed cells, TP53 protein levels are kept low by conformational proteomic degradation, which is indicated by the E3 ubiquitin ligase MDM2, a major inhibitor of TP53. In addition, the biochemical activity of TP53 as a transcription factor is also limited by MDM4 protein (also known as MDMX), meaning it is an additional physiological inhibitor of TP53 [44]. We performed PPI analysis on TP53-related transcription factors, finding 51 nodes, 392 edges, a network density of 0.307, a network heterogeneity of 0.717, and a clustering coefficient of 0.685 (Figure 11A). As shown in Figure 11B, the protein expression of transcription factors TP53, MYC proto-oncogene, BHLH transcription factor (MYC), histone deacetylase 1 (HDAC1), MDM2, CREBBP, signal transducer and activator of transcription 3 (STAT3), and Jun proto-oncogene, AP-1 transcription factor subunit (JUN) were all located in the nucleoplasm. These proteins were subjected to molecular docking analysis with TP53, revealing that: MYC (6G6K) docked to TP53 (1TUP), and the interacting amino acids included HIS, GLU, ASN, VAL, LYS, ARG, THR, GLN, LEU, SER, PHE, and ILE; HDAC1 (4BKX) docked to TP53 (1TUP), and the amino acid sites were GLY, ILE, ARG, VAL, ASN, ARG, TYR, ALA, ASP, THR, LEU, LYS, GLU, and TRP; MDM2 (1YCR) docked to TP53 (1TUP), and the amino acid sites were GLU, THR, LEU, VAL, ARG, PRO, LYS, GLN, ASP, TYR, MET, and PHE; CREBBP (5NLK) docked to TP53 (1TUP), and the amino acid sites were LYS, ILE, PHE, PRO, GLU, ARG, GLN, ALA, MET, LEU, THR, TYR, and TRP; STAT3 (6NUQ) docked to TP53 (1TUP), and the amino acid sites were VAL, THR, GLU, LYS, GLN, MET, LEU, HIS, ARG, GLN, ASP, SER, PHE, and ASN; and JUN (1FOS) docked to TP53 (1TUP), and the amino acid sites were LYS, ARG, ILF, GLU, ASN, MET, ALA, SER, LEU, THR, ASP, GLN, and PHE (Figure 11C). The protein–protein docking interaction amino acid sites are shown in Supplementary Table S8.

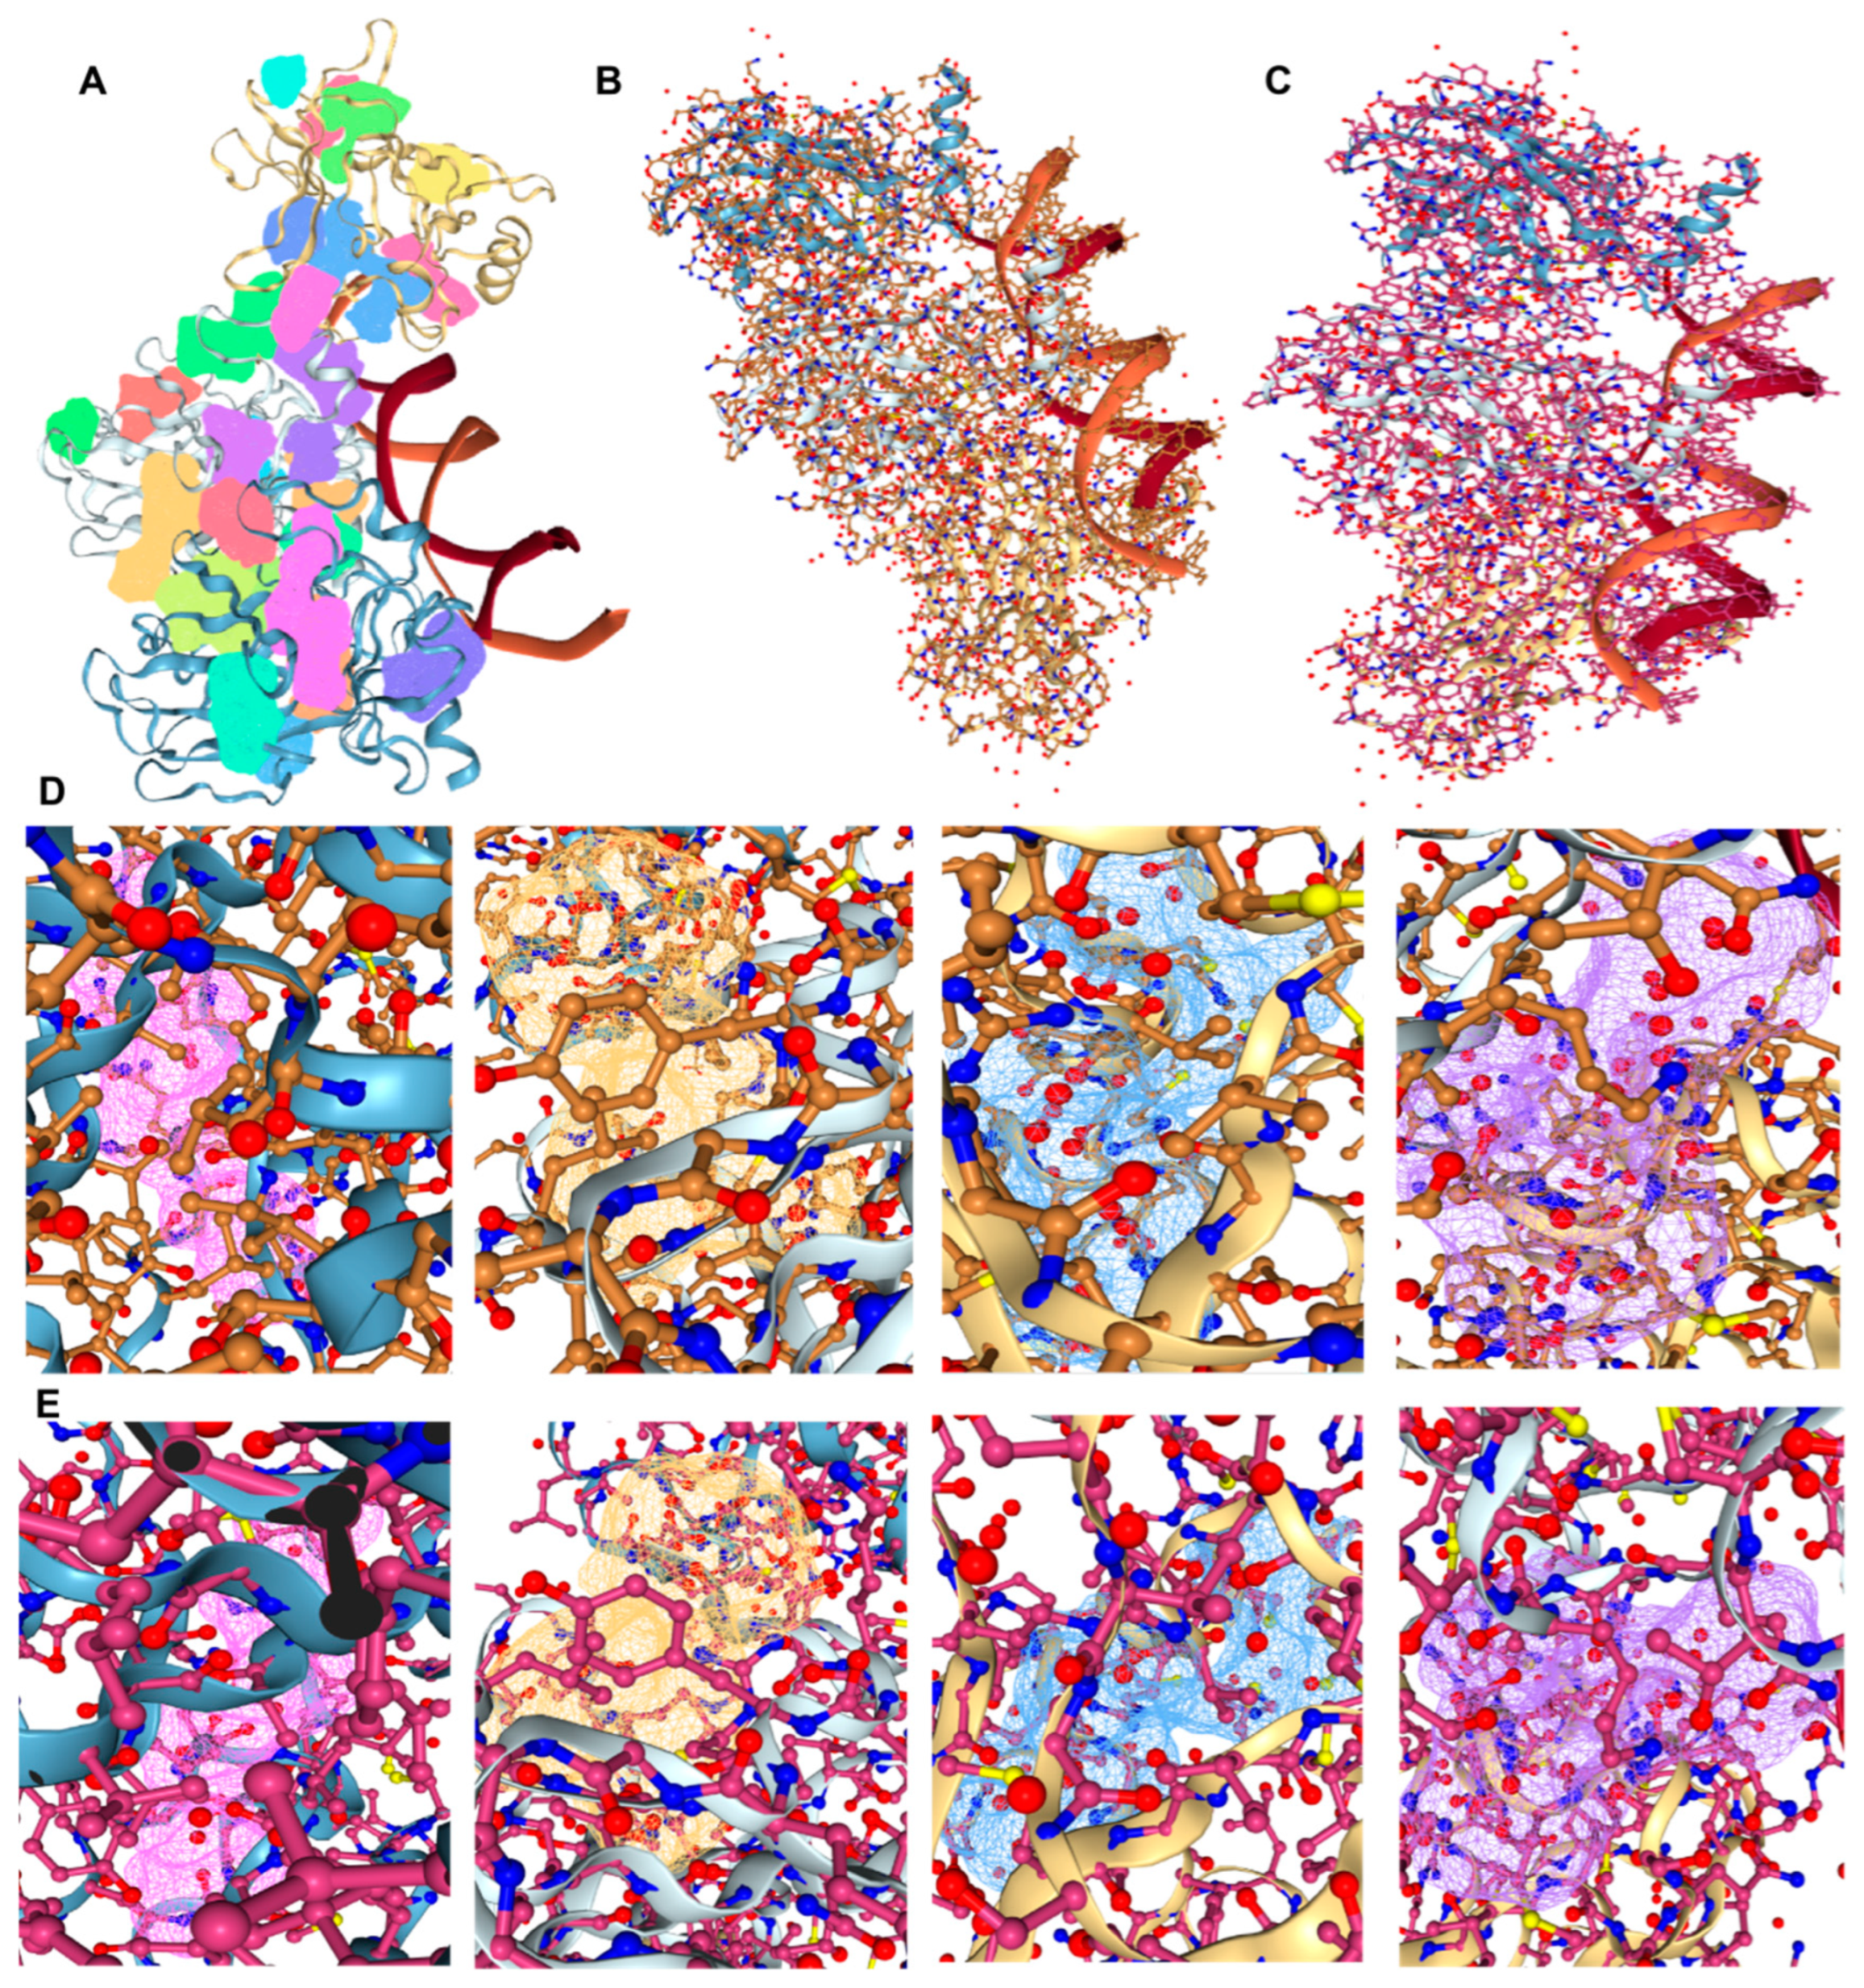
3.13. Therapeutic Drugs and Molecular Docking

The drugs that target TP53 include pifithrin-mu, mepacrine, pifithrin-alpha, prima-1-met, and aspirin [45,46,47,48,49]. We predicted that TP53 protein (1TUP) would have 26 pockets (Figure 12A, Supplementary Table S9), and we developed protein-binding pockets for molecular docking analysis with pifithrin-mu and aspirin (Figure 12B,C). Among these, the best binding sites for pifithrin-mu and aspirin to TP53 protein were P_6, P_0, P_4, and P_1 (Figure 12D,E). The binding site scores and acting amino acids are listed in Table 3. It can be seen that the acting amino acids mainly included ALA, ARG, LEU, MET, SER, and VAL. Pifithrin-μ, a cell-permeable inhibitor of TP53 binding and TP53-mediated apoptosis, directly inhibits TP53 binding to the mitochondria [50] and inhibits TP53 binding to Bcl-2 and Bcl-xL proteins [51]. Pifithrin-μ also selectively inhibits HSP70 activity. Pretreatment of mice with pifithrin-μ can repair the damage induced by γ-rays or DNA-damaging agents in primary thymic cells [51]. Aspirin regulates global demethylation and TP53 activity and expression along with decreasing cell proliferation and migration [52]. Unfortunately, currently, there are no food and drug administration (FDA)-approved small-molecule drugs that directly target TP53. Currently, many targeted drugs and new treatment methods for TP53 mutations are in clinical trials.

4. Discussion

The higher expression of TP53 in tumors is an important indicator. TNM staging for tumors can determine the severity of disease and predict the survival rate of patients. High expression of TP53 was associated with poor prognosis and tumor diagnosis, thus giving important information about patient disease progression and treatment response. In addition, mutations and methylation in TP53 play an important role in the occurrence and development of tumors. The correlations between TP53 expression and immune infiltration and immune checkpoints further indicated the potential role of TP53 in tumor immunotherapy. TP53 may play a crucial role in the biological processes of cancer progression, including showing positive correlations with differentiation, metastasis, inflammation, proliferation, and quiescence, and negative correlations with DNA repair, DNA damage, cell cycle, and apoptosis. Many transcription factors were associated with TP53, including AURKA, BARD1, CDK2, CREBBP, DDX5, EP300, GSK3B, KAT5, MDM2, and RPA1. These transcription factors, together with TP53, are involved in biological processes such as cell cycle regulation, DNA repair, apoptosis, cell migration, and metastasis, and they play an important regulatory role in the occurrence and development of tumors. For example, AURKA inhibits the DNA damage response by suppressing the expression of various DNA damage repair genes in a TP53-dependent manner [53]. MDM2 is a well-known transcription factor that interacts with TP53 and can regulate the cell life cycle and apoptosis by binding to TP53 and inhibiting its function [54]. In conclusion, there are complex interactions between TP53 and these transcription factors, which play important regulatory roles in tumorigenesis. Studying the interaction mechanisms between these transcription factors and TP53 is of great significance for understanding the tumorigenesis mechanism and providing targets and strategies for tumor therapy. In-depth research and comprehensive analyses of multiple aspects related to TP53 may help to further elucidate the mechanisms underlying tumor occurrence and development and provide an important basis for precision treatment.
In many cancer processes, transcription factors can be mutated or dysregulated through various mechanisms of action, including chromosomal translocation, gene amplification or deletion, point mutations, and expression changes. The most prominent feature of TP53 is that it is a transcription factor, and many of its target genes are related to apoptosis or cell cycle regulation, such as TP21-encoding cyclin-dependent protein kinase inhibitor and BAX-encoding apoptosis precursor protein [55]. Transcription factors play important biological roles in diseases such as cancer, autoimmune diseases, diabetes, and cardiovascular diseases [56]. However, transcription factors have traditionally been considered “untreatable” targets because of their severe structural disorganization and lack of well-defined small-molecule binding cavities [57]. Extensive experimental data have shown that mutated TP53 plays a key role in promoting the malignant phenotype of cancers. Therefore, it is considered an attractive target for the treatment of various cancers. TP53 gene testing aims to provide a more comprehensive assessment of the cancer risk of the subject [58], so that the patient can make timely and moderate adjustments to their lifestyle and living habits, such as exercise, diet, and sleep. TP53 gene detection is a “cancer prevention guide” that can be used to help the subject actively avoid environmental risk factors that induce tumors, making the prevention and treatment of cancer more targeted and organized [59]. Although it is well established that TP53 mutations affect cancer prognosis, they are rarely used for patient stratification or to guide treatment [60]. One of the important reasons for this is that the locations and types of TP53 mutations have different effects on prognosis, and there is still a lack of unified classification criteria for TP53 mutations. One classification classifies mutations into damaging and non-damaging mutations based on the degree of disruption of the TP53 protein structure and function. Damaging mutations may result in complete or nearly complete loss of TP53 protein activity. In contrast, non-destructive mutations can preserve some functional properties of the TP53 protein.
Accumulating evidence suggests that TP53 regulates both innate and acquired immune responses. TP53 is an essential component of toll-like receptor 8 (TLR 8)-mediated immune responses. TP53 is also involved in the activation of the major histocompatibility complex I (MHC-I) antigen presentation pathway by inducing transporter antigen peptide 1 (TAP1) [61,62]. However, mutations in TP53 affect the recruitment and activity of T cells, leading to immune evasion and the promotion of cancer progression. In LUAD, mutant TP53 inhibits the formation of the stimulator of interferon genes–TANK binding kinase 1–interferon regulatory factor 3 (STING-TBK1-IRF3) complex, leading to the inactivation of the innate immune signaling pathway [63]. Alternatively, mutant TP53 has been found to be immunogenic, and could act as a novel antigen to trigger immune responses. For example, in LUAD, mutant TP53 promotes PD-L1 expression and CD8+ T cell infiltration and enhances tumor immunogenicity [64]. Therefore, patients with mutant TP53 may be more sensitive to PD-1 blockade immunotherapy. Studies have shown that patients with HNSC and destructive TP53 mutations have a significantly shorter survival time, whereas patients with LUAD and non-destructive TP53 mutations have worse prognosis [65]. Overall, although TP53 mutations may make tumor treatment more difficult, investigators are actively searching for new treatments for TP53-mutated tumors. These novel therapies will provide more treatment options for patients with cancer and are expected to improve the efficacy of cancer treatment. It is believed that with the continuous progress of science and technology, we will derive a more effective means to fight cancer and bring hope to patients.
At present, the US FDA has approved some drugs targeting TP53. Gene therapy, targeted tumor vaccines, and anti-cancer drugs targeting TP53 mutations are in the early stages of clinical trials, including APR-246 (eprenetapopt, PRIMA-1MET), PEITC (phenethyl isothiocyanate), ATO (arsenic trioxide/Trisenox), HSP90 inhibitor (ganetespib/STA-9090), Atorvastatin, Vorinostat/Zolinza/SAHA, Wee1 inhibitor (adavosertib/AZD1775/MK-1775), Lamivudine (3TC/Epivir/Zeffix/DELSTRIGO), Zoledronic acid (ZA/Reclast/Zometa), and atorvastatin [66,67]. Cancer cells with TP53 mutations have also been shown to be sensitive to the Aurora A kinase inhibitor alisertib, which is a currently in a phase II clinical study for the treatment of non-small-cell lung carcinoma (NSCLC) [68]. In addition, studies have shown that TP53 mutations may affect the efficacy of radiotherapy. Introducing wild-type TP53 into tumor cells and reestablishing TP53 protein function can help to increase tumor sensitivity to traditional radiotherapy and chemotherapy. This is understandable. Traditional treatment destroys DNA, and cancer cells with DNA damage are blocked by TP53 protein and enter the apoptotic program. The cancer cells may have thus lost a checkpoint, or it could be that many tumors have TP53 mutations, in part because of evolutionary selection.
However, several questions remain unanswered. First, TP53 is mutated in more than 50% of tumors; therefore, what factors influence the type and spectrum of TP53 mutations? Second, post-translational modifications play an important role in the accumulation of mutant TP53. How do post-translational modifications regulate the function of mutant TP53 and what is the specific regulatory mechanism? Third, current studies have focused on mutational hotspots of TP53. It is uncertain whether TP53 mutations with different residues and different functional domains exert the same gain of function, and what is the mechanism by which it exerts gain of function? Fourth, mutant TP53 is generally considered to be “undruggable.” In recent years, although some studies have reported the development of a variety of small-molecule compounds or peptide drugs targeting mutant TP53, few drugs have entered clinical trials, and no drugs targeting mutant TP53 have been approved for tumor treatment. Further research is needed on mutant TP53. There are also some limitations in this study. Bioinformatic analysis is an effective way to infer the role of a gene in a tumor, but it is not sufficient to fully confirm its role. Experimental verification can provide more reliable and concrete evidence to support the conclusions of bioinformatics analysis. For example, the expression of TP53 in tumor cells can be disrupted or enhanced by CRISPR/Cas9 gene editing technology, after which the characteristics of cell proliferation, apoptosis, and invasion can be observed to further confirm the role of TP53 in tumors.

Supplementary Materials

The following supporting information can be downloaded at: https://www.mdpi.com/article/10.3390/cimb45120601/s1, Figure S1 Aberrant expression of TP53 in pan-cancer. (A) Box plot of the TP53 mRNA level analyzed by the GEPIA2 database. (B) The expression of TP53 in normal tissue and BRCA, GBM, and STAD performed by CPTAC. (C) Tumors with no clear association between TP53 expression and patients’ stage. Figure S2 RNA-sequencing and TCGA data were used to analyze the survival and RFS. (A) The high SLC31A1 RNA-sequencing expression level was associated with poor prognosis in patients with BRCA and COAD. (B) TCGA data analysis OS and RFS of BRCA, COAD, LGG, PRAD. Figure S3 The mutation landscape of SLC31A1 in pan-cancer. Figure S4 Information of TP53 mutation samples and cohorts from the cBioPortal tool. Figure S5 Analysis of immune infiltration, tumor dryness, and immune checkpoint. (A) Correlation heatmap between TP53 expression and tumor infifiltrating immune cells across different cancer types was displayed, including Neutrophil, Mast cell, NK cell, and Macrophage. (B) TP53 expression and tumor stemness, a significant positive correlation in 3 tumors (LGG, LAML, and THYM) and a significant negative correlation in 11 tumors ( BRCA, SARC, KIRP, KIPAN, KIRC, LIHC, THCA, TGCT, PCPG, SKCM, KICH ). (C) Correlation between TP53 and 60 immune checkpoint (inhibitory, stimulatory). * p < 0.05. Figure S6 (A) TP53-correlated genes analyzed by GEPIA2, including AURKA, BARD1, CDK2, CREBBP, DDX5, EP300, GSK3B, KAT5, MDM2, and RPA1. (B) Survival curve analysis of hsa-let-7e-5p, hsa-miR-98-5p, hsa-miR-221-3p, hsa-miR-222-3p, hsa-miR-380-5p, and hsa-miR-485-5p in pan-cancer. Figure S7 TP53-associated signaling pathways in pan-cancer.

Author Contributions

Conceptualization, T.L. and J.W.; methodology, T.L. and J.W.; software, T.L. and J.W.; validation, T.L. and J.W.; formal analysis, T.L. and J.W.; investigation, T.L. and J.W.; resources, T.L. and J.W.; data curation, T.L. and J.W.; writing—original draft preparation, T.L. and J.W.; writing—review and editing, T.L., J.D. and J.W.; visualization, T.L. and J.W.; supervision, T.L. and J.W.; project administration, T.L., X.C. and J.W.; funding acquisition, T.L., J.D., X.C. and J.W. All authors have read and agreed to the published version of the manuscript.

Funding

This work was supported partly by the National Natural Science Foundation of China (32161143021, 81271410, 81401062, 81601123), Henan University Graduate «Talent Program» of Henan Province (SYLYC2023092), and Henan Natural Science Foundation of China (182300410313).

Institutional Review Board Statement

Not applicable. All authors agreed to participate.

Informed Consent Statement

Not applicable.

Conflicts of Interest

The authors declare no conflict of interest.

References

  1. Goh, A.M.; Coffill, C.R.; Lane, D.P. The role of mutant p53 in human cancer. J. Pathol. 2011, 223, 116–126. [Google Scholar] [CrossRef] [PubMed]
  2. Wang, Z.; Strasser, A.; Kelly, G.L. Should mutant TP53 be targeted for cancer therapy? Cell Death Differ. 2022, 29, 911–920. [Google Scholar] [CrossRef] [PubMed]
  3. Chen, J. The Cell-Cycle Arrest and Apoptotic Functions of p53 in Tumor Initiation and Progression. Cold Spring Harb. Perspect. Med. 2016, 6, a026104. [Google Scholar] [CrossRef] [PubMed]
  4. Koifman, G.; Aloni-Grinstein, R.; Rotter, V. p53 balances between tissue hierarchy and anarchy. J. Mol. Cell Biol. 2019, 11, 553–563. [Google Scholar] [CrossRef] [PubMed]
  5. Mijit, M.; Caracciolo, V.; Melillo, A.; Amicarelli, F.; Giordano, A. Role of p53 in the Regulation of Cellular Senescence. Biomolecules 2020, 10, 420. [Google Scholar] [CrossRef] [PubMed]
  6. Chen, X.; Zhang, T.; Su, W.; Dou, Z.; Zhao, D.; Jin, X.; Lei, H.; Wang, J.; Xie, X.; Cheng, B.; et al. Mutant p53 in cancer: From molecular mechanism to therapeutic modulation. Cell Death Dis. 2022, 13, 974. [Google Scholar] [CrossRef]
  7. Stein, Y.; Rotter, V.; Aloni-Grinstein, R. Gain-of-Function Mutant p53: All the Roads Lead to Tumorigenesis. Int. J. Mol. Sci. 2019, 20, 6197. [Google Scholar] [CrossRef]
  8. Silwal-Pandit, L.; Langerød, A.; Børresen-Dale, A.L. TP53 Mutations in Breast and Ovarian Cancer. Cold Spring Harb. Perspect. Med. 2017, 7, a026252. [Google Scholar] [CrossRef]
  9. Maurer, G.D.; Heller, S.; Wanka, C.; Rieger, J.; Steinbach, J.P. Knockdown of the TP53-Induced Glycolysis and Apoptosis Regulator (TIGAR) Sensitizes Glioma Cells to Hypoxia, Irradiation and Temozolomide. Int. J. Mol. Sci. 2019, 20, 1061. [Google Scholar] [CrossRef]
  10. Masunaga, S.; Uto, Y.; Nagasawa, H.; Hori, H.; Nagata, K.; Suzuki, M.; Kinashi, Y.; Ono, K. Evaluation of hypoxic cell radio-sensitizers in terms of radio-sensitizing and repair-inhibiting potential. Dependency on p53 status of tumor cells and the effects on intratumor quiescent cells. Anticancer Res. 2006, 26, 1261–1270. [Google Scholar]
  11. Chiou, Y.H.; Wong, R.H.; Chao, M.R.; Chen, C.Y.; Liou, S.H.; Lee, H. Nickel accumulation in lung tissues is associated with increased risk of p53 mutation in lung cancer patients. Environ. Mol. Mutagen. 2014, 55, 624–632. [Google Scholar] [CrossRef] [PubMed]
  12. Sasaki, M.S.; Ejima, Y.; Tachibana, A.; Yamada, T.; Ishizaki, K.; Shimizu, T.; Nomura, T. DNA damage response pathway in radioadaptive response. Mutat Res. 2002, 504, 101–118. [Google Scholar] [CrossRef] [PubMed]
  13. Paget, V.; Lechevrel, M.; André, V.; Le Goff, J.; Pottier, D.; Billet, S.; Garçon, G.; Shirali, P.; Sichel, F. Benzo[a]pyrene, aflatoxine B₁ and acetaldehyde mutational patterns in TP53 gene using a functional assay: Relevance to human cancer aetiology. PLoS ONE 2012, 7, e30921. [Google Scholar] [CrossRef] [PubMed]
  14. Arzumanyan, A.; Reis, H.M.; Feitelson, M.A. Pathogenic mechanisms in HBV- and HCV-associated hepatocellular carcinoma. Nat. Rev. Cancer 2013, 13, 123–135. [Google Scholar] [CrossRef] [PubMed]
  15. Tornesello, M.L.; Buonaguro, L.; Izzo, F.; Buonaguro, F.M. Molecular alterations in hepatocellular carcinoma associated with hepatitis B and hepatitis C infections. Oncotarget 2016, 7, 25087–25102. [Google Scholar] [CrossRef] [PubMed]
  16. Jia, L.; Wang, X.W.; Harris, C.C. Hepatitis B virus X protein inhibits nucleotide excision repair. Int. J. Cancer 1999, 80, 875–879. [Google Scholar] [CrossRef]
  17. Toyooka, S.; Tsuda, T.; Gazdar, A.F. The TP53 gene, tobacco exposure, and lung cancer. Hum. Mutat. 2003, 21, 229–239. [Google Scholar] [CrossRef] [PubMed]
  18. von Deimling, A.; Eibl, R.H.; Ohgaki, H.; Louis, D.N.; von Ammon, K.; Petersen, I.; Kleihues, P.; Chung, R.Y.; Wiestler, O.D.; Seizinger, B.R. p53 mutations are associated with 17p allelic loss in grade II and grade III astrocytoma. Cancer Res. 1992, 52, 2987–2990. [Google Scholar]
  19. Louis, D.N.; Perry, A.; Reifenberger, G.; von Deimling, A.; Figarella-Branger, D.; Cavenee, W.K.; Ohgaki, H.; Wiestler, O.D.; Kleihues, P.; Ellison, D.W. The 2016 World Health Organization Classification of Tumors of the Central Nervous System: A summary. Acta Neuropathol. 2016, 131, 803–820. [Google Scholar] [CrossRef]
  20. Bale, T.A.; Rosenblum, M.K. The 2021 WHO Classification of Tumors of the Central Nervous System: An update on pediatric low-grade gliomas and glioneuronal tumors. Brain Pathol. 2022, 32, e13060. [Google Scholar] [CrossRef]
  21. Eibl, R.H.; Schneemann, M. Medulloblastoma: From TP53 Mutations to Molecular Classification and Liquid Biopsy. Biology 2023, 12, 267. [Google Scholar] [CrossRef] [PubMed]
  22. Ohgaki, H.; Eibl, R.H.; Wiestler, O.D.; Yasargil, M.G.; Newcomb, E.W.; Kleihues, P. p53 mutations in nonastrocytic human brain tumors. Cancer Res. 1991, 51, 6202–6205. [Google Scholar] [PubMed]
  23. Li, T.; Fu, J.; Zeng, Z.; Cohen, D.; Li, J.; Chen, Q.; Li, B.; Liu, X.S. TIMER2.0 for analysis of tumor-infiltrating immune cells. Nucleic Acids Res. 2020, 48, W509–W514. [Google Scholar] [CrossRef] [PubMed]
  24. Tang, Z.; Kang, B.; Li, C.; Chen, T.; Zhang, Z. GEPIA2: An enhanced web server for large-scale expression profiling and interactive analysis. Nucleic Acids Res. 2019, 47, W556–W560. [Google Scholar] [CrossRef] [PubMed]
  25. Chandrashekar, D.S.; Bashel, B.; Balasubramanya, S.A.H.; Creighton, C.J.; Ponce-Rodriguez, I.; Chakravarthi, B.V.S.K.; Varambally, S. UALCAN: A Portal for Facilitating Tumor Subgroup Gene Expression and Survival Analyses. Neoplasia 2017, 19, 649–658. [Google Scholar] [CrossRef]
  26. Gao, J.; Aksoy, B.A.; Dogrusoz, U.; Dresdner, G.; Gross, B.E.; Sumer, S.O.; Sun, Y.; Jacobsen, A.; Sinha, R.; Larsson, E.; et al. Integrative analysis of complex cancer genomics and clinical profiles using the cBioPortal. Sci Signal. 2013, 6, pl1. [Google Scholar] [CrossRef] [PubMed]
  27. Liu, C.J.; Hu, F.F.; Xia, M.X.; Han, L.; Zhang, Q.; Guo, A.Y. GSCALite: A web server for gene set cancer analysis. Bioinformatics 2018, 34, 3771–3772. [Google Scholar] [CrossRef] [PubMed]
  28. Yuan, H.; Yan, M.; Zhang, G.; Liu, W.; Deng, C.; Liao, G.; Xu, L.; Luo, T.; Yan, H.; Long, Z.; et al. CancerSEA: A cancer single-cell state atlas. Nucleic Acids Res. 2019, 47, D900–D908. [Google Scholar] [CrossRef]
  29. Szklarczyk, D.; Gable, A.L.; Nastou, K.C.; Lyon, D.; Kirsch, R.; Pyysalo, S.; Doncheva, N.T.; Legeay, M.; Fang, T.; Bork, P.; et al. The STRING database in 2021: Customizable protein-protein networks, and functional characterization of user-uploaded gene/measurement sets. Nucleic Acids Res. 2021, 49, D605–D612. [Google Scholar] [CrossRef]
  30. Sarver, A.L.; Sarver, A.E.; Yuan, C.; Subramanian, S. OMCD: OncomiR Cancer Database. BMC Cancer 2018, 18, 1223. [Google Scholar] [CrossRef]
  31. Martens, M.; Ammar, A.; Riutta, A.; Waagmeester, A.; Slenter, D.N.; Hanspers, K.; Miller, R.A.; Digles, D.; Lopes, E.N.; Ehrhart, F.; et al. WikiPathways: Connecting communities. Nucleic Acids Res. 2021, 49, D613–D621. [Google Scholar] [CrossRef] [PubMed]
  32. Han, H.; Cho, J.-W.; Lee, S.; Yun, A.; Kim, H.; Bae, D.; Yang, S.; Kim, C.Y.; Lee, M.; Kim, E.; et al. TRRUST v2: An expanded reference database of human and mouse transcriptional regulatory interactions. Nucleic Acids Res. 2018, 46, D380–D386. [Google Scholar] [CrossRef] [PubMed]
  33. Badal, V.D.; Kundrotas, P.J.; Vakser, I.A. Text mining for modeling of protein complexes enhanced by machine learning. Bioinformatics 2021, 37, 497–505. [Google Scholar] [CrossRef] [PubMed]
  34. Lamb, J.; Crawford, E.D.; Peck, D.; Modell, J.W.; Blat, I.C.; Wrobel, M.J.; Lerner, J.; Brunet, J.-P.; Subramanian, A.; Ross, K.N.; et al. The Connectivity Map: Using gene-expression signatures to connect small molecules, genes, and disease. Science 2006, 313, 1929–1935. [Google Scholar] [CrossRef]
  35. Volkamer, A.; Kuhn, D.; Rippmann, F.; Rarey, M. DoGSiteScorer: A web server for automatic binding site prediction, analysis and druggability assessment. Bioinformatics 2012, 28, 2074–2075. [Google Scholar] [CrossRef]
  36. Ghatak, D.; Das Ghosh, D.; Roychoudhury, S. Cancer Stemness: p53 at the Wheel. Front Oncol. 2021, 10, 604124. [Google Scholar] [CrossRef]
  37. Reya, T.; Morrison, S.J.; Clarke, M.F.; Weissman, I.L. Stem cells, cancer, and cancer stem cells. Nature 2001, 414, 105–111. [Google Scholar] [CrossRef]
  38. Zhang, Y.; Wang, D.; Peng, M.; Tang, L.; Ouyang, J.; Xiong, F.; Guo, C.; Tang, Y.; Zhou, Y.; Liao, Q.; et al. Single-cell RNA sequencing in cancer research. J. Exp. Clin. Cancer Res. 2021, 40, 81. [Google Scholar] [CrossRef]
  39. Qian, J.; Olbrecht, S.; Boeckx, B.; Vos, H.; Laoui, D.; Etlioglu, E.; Wauters, E.; Pomella, V.; Verbandt, S.; Busschaert, P.; et al. A pan-cancer blueprint of the heterogeneous tumor microenvironment revealed by single-cell profiling. Cell Res. 2020, 30, 745–762. [Google Scholar] [CrossRef]
  40. Wang, S.; Jin, S.; Liu, M.-D.; Pang, P.; Wu, H.; Qi, Z.-Z.; Liu, F.-Y.; Sun, C.-F. Hsa-let-7e-5p Inhibits the Proliferation and Metastasis of Head and Neck Squamous Cell Carcinoma Cells by Targeting Chemokine Receptor 7. J. Cancer 2019, 10, 1941–1948. [Google Scholar] [CrossRef]
  41. Niculae, A.M.; Dobre, M.; Herlea, V.; Manuc, T.E.; Trandafir, B.; Milanesi, E.; Hinescu, M.E. Let-7 microRNAs Are Possibly Associated with Perineural Invasion in Colorectal Cancer by Targeting IGF Axis. Life 2022, 12, 1638. [Google Scholar] [CrossRef] [PubMed]
  42. Li, J.; Li, Z.; Zhao, S.; Song, Y.; Si, L.; Wang, X. Identification key genes, key miRNAs and key transcription factors of lung adenocarcinoma. J. Thorac. Dis. 2020, 12, 1917–1933. [Google Scholar] [CrossRef] [PubMed]
  43. Tan, P.; Li, M.; Liu, Z.; Li, T.; Zhao, L.; Fu, W. Glycolysis-Related LINC02432/Hsa-miR-98-5p/HK2 Axis Inhibits Ferroptosis and Predicts Immune Infiltration, Tumor Mutation Burden, and Drug Sensitivity in Pancreatic Adenocarcinoma. Front. Pharmacol. 2022, 13, 937413. [Google Scholar] [CrossRef]
  44. Hassin, O.; Oren, M. Drugging p53 in cancer: One protein, many targets. Nat. Rev. Drug Discov. 2023, 22, 127–144. [Google Scholar] [CrossRef] [PubMed]
  45. Hagn, F.; Klein, C.; Demmer, O.; Marchenko, N.; Vaseva, A.; Moll, U.M.; Kessler, H. BclxL changes conformation upon binding to wild-type but not mutant p53 DNA binding domain. J. Biol. Chem. 2010, 285, 3439–3450. [Google Scholar] [CrossRef] [PubMed]
  46. Friedman, J.; Nottingham, L.; Duggal, P.; Pernas, F.G.; Yan, B.; Yang, X.P.; Chen, Z.; Van Waes, C. Deficient TP53 expression, function, and cisplatin sensitivity are restored by quinacrine in head and neck cancer. Clin. Cancer Res. 2007, 13 Pt 1, 6568–6578. [Google Scholar] [CrossRef] [PubMed]
  47. Lee, S.B.; Lee, S.; Park, J.Y.; Lee, S.Y.; Kim, H.S. Induction of p53-Dependent Apoptosis by Prostaglandin A2. Biomolecules 2020, 10, 492. [Google Scholar] [CrossRef]
  48. Elayapillai, S.; Ramraj, S.; Benbrook, D.M.; Bieniasz, M.; Wang, L.; Pathuri, G.; Isingizwe, Z.R.; Kennedy, A.L.; Zhao, Y.D.; Lightfoot, S.; et al. Potential and mechanism of mebendazole for treatment and maintenance of ovarian cancer. Gynecol. Oncol. 2021, 160, 302–311. [Google Scholar] [CrossRef]
  49. Gong, L.; Zhang, D.; Dong, Y.; Lei, Y.; Qian, Y.; Tan, X.; Han, S.; Wang, J. Integrated Bioinformatics Analysis for Identificating the Therapeutic Targets of Aspirin in Small Cell Lung Cancer. J. Biomed. Inform. 2018, 88, 20–28. [Google Scholar] [CrossRef]
  50. He, C.; Qin, H.; Tang, H.; Yang, D.; Li, Y.; Huang, Z.; Zhang, D.; Lv, C. Comprehensive bioinformatics analysis of the TP53 signaling pathway in Wilms’ tumor. Ann. Transl. Med. 2020, 8, 1228. [Google Scholar] [CrossRef]
  51. Strom, E.; Sathe, S.; Komarov, P.G.; Chernova, O.B.; Pavlovska, I.; Shyshynova, I.; Bosykh, D.A.; Burdelya, L.G.; Macklis, R.M.; Skaliter, R.; et al. Small-molecule inhibitor of p53 binding to mitochondria protects mice from gamma radiation. Nat. Chem. Biol. 2006, 2, 474–479. [Google Scholar] [CrossRef] [PubMed]
  52. Szabó, B.; Németh, K.; Mészáros, K.; Krokker, L.; Likó, I.; Saskői, É.; Németh, K.; Szabó, P.T.; Szücs, N.; Czirják, S.; et al. Aspirin Mediates Its Antitumoral Effect Through Inhibiting PTTG1 in Pituitary Adenoma. J. Clin. Endocrinol. Metab. 2022, 107, 3066–3079. [Google Scholar] [CrossRef] [PubMed]
  53. Shan, B.; Zhao, R.; Zhou, J.; Zhang, M.; Qi, X.; Wang, T.; Gong, J.; Wu, Y.; Zhu, Y.; Yang, W.; et al. AURKA Increase the Chemosensitivity of Colon Cancer Cells to Oxaliplatin by Inhibiting the TP53-Mediated DNA Damage Response Genes. Biomed. Res. Int. 2020, 2020, 8916729. [Google Scholar] [CrossRef] [PubMed]
  54. Nag, S.; Qin, J.; Srivenugopal, K.S.; Wang, M.; Zhang, R. The MDM2-p53 pathway revisited. J. Biomed. Res. 2013, 27, 254–271. [Google Scholar] [CrossRef] [PubMed]
  55. Subhasree, N.; Jiangjiang, Q.; Kalkunte, S.; Minghai, W.; Ruiwen, Z. BCL-2, TP53 and BAX protein expression in superficial urothelial bladder carcinoma. Cancer Lett. 2007, 250, 292–299. [Google Scholar] [CrossRef]
  56. Henley, M.J.; Koehler, A.N. Advances in targeting ‘undruggable’ transcription factors with small molecules. Nat. Rev. Drug Discov. 2021, 20, 669–688. [Google Scholar] [CrossRef]
  57. Williams, E.A.; Sharaf, R.; Decker, B.; Werth, A.J.; Toma, H.; Montesion, M.; Sokol, E.S.; Pavlick, D.C.; Shah, N.; Williams, K.J.; et al. CDKN2C-Null Leiomyosarcoma: A Novel, Genomically Distinct Class of TP53/RB1-Wild-Type Tumor With Frequent CIC Genomic Alterations and 1p/19q-Codeletion. JCO Precis. Oncol. 2020, 4, 955–971. [Google Scholar] [CrossRef]
  58. Weitzel, J.N.; Chao, E.C.; Nehoray, B.; Van Tongeren, L.R.; LaDuca, H.; Blazer, K.R.; Slavin, T.; Pesaran, T.; Rybak, C.; Solomon, I.; et al. Somatic TP53 variants frequently confound germ-line testing results. Genet Med. 2018, 20, 809–816. [Google Scholar] [CrossRef]
  59. Scheinberg, T.; Goodwin, A.; Ip, E.; Linton, A.; Mak, B.; Smith, D.P.; Stockler, M.R.; Strach, M.C.; Tran, B.; Young, A.L.; et al. Evaluation of a Mainstream Model of Genetic Testing for Men With Prostate Cancer. JCO Oncol. Pract. 2021, 17, e204–e216. [Google Scholar] [CrossRef]
  60. Kennedy, M.C.; Lowe, S.W. Mutant p53: It’s not all one and the same. Cell Death Differ. 2022, 29, 983–987. [Google Scholar] [CrossRef]
  61. Sun, H.; Tang, Q.; Chen, Y.; Tang, C.; Zou, S.; Qiu, F. Effects of dendritic cells transfected with full length wild type P53 and modified by gastric cancer lysate on immune response. J. Huazhong Univ. Sci. Technol. Med. Sci. 2004, 24, 460–463. [Google Scholar] [CrossRef]
  62. Morimoto, I.; Sasaki, Y.; Ishida, S.; Imai, K.; Tokino, T. Identification of the osteopontin gene as a direct target of TP53. Genes Chromosomes Cancer 2002, 33, 270–278. [Google Scholar] [CrossRef] [PubMed]
  63. Kitajima, S.; Ivanova, E.; Guo, S.; Yoshida, R.; Campisi, M.; Sundararaman, S.K.; Tange, S.; Mitsuishi, Y.; Thai, T.C.; Masuda, S.; et al. Suppression of STING Associated with LKB1 Loss in KRAS-Driven Lung Cancer. Cancer Discov. 2019, 9, 34–45. [Google Scholar] [CrossRef] [PubMed]
  64. Biton, J.; Mansuet-Lupo, A.; Pécuchet, N.; Alifano, M.; Ouakrim, H.; Arrondeau, J.; Boudou-Rouquette, P.; Goldwasser, F.; Leroy, K.; Goc, J.; et al. TP53, STK11, and EGFR Mutations Predict Tumor Immune Profile and the Response to Anti-PD-1 in Lung Adenocarcinoma. Clin. Cancer Res. 2018, 24, 5710–5723. [Google Scholar] [CrossRef] [PubMed]
  65. Li, L.; Li, M.; Wang, X. Cancer type-dependent correlations between TP53 mutations and antitumor immunity. DNA Repair 2020, 88, 102785. [Google Scholar] [CrossRef]
  66. Duffy, M.J.; Synnott, N.C.; Crown, J. Mutant p53 as a target for cancer treatment. Eur. J. Cancer 2017, 83, 258–265. [Google Scholar] [CrossRef]
  67. Nishikawa, S.; Iwakuma, T. Drugs Targeting p53 Mutations with FDA Approval and in Clinical Trials. Cancers 2023, 15, 429. [Google Scholar] [CrossRef]
  68. Melichar, B.; Adenis, A.; Lockhart, A.C.; Bennouna, J.; Dees, E.C.; Kayaleh, O.; Obermannova, R.; DeMichele, A.; Zatloukal, P.; Zhang, B.; et al. Safety and activity of alisertib, an investigational aurora kinase A inhibitor, in patients with breast cancer, small-cell lung cancer, non-small-cell lung cancer, head and neck squamous-cell carcinoma, and gastro-oesophageal adenocarcinoma: A five-arm phase 2 study. Lancet Oncol. 2015, 16, 395–405. [Google Scholar] [CrossRef]
Figure 1. Aberrant pan-cancer expression of TP53. (A) mRNA level of TP53 based on the TIMER2 database: blue represents the healthy control group, red represents tumor patients. (B) Box plot of TP53 mRNA level in CHOL, COAD, DLBC, GBM, LAML, LCC, LUSC, OV, PAAD, READ, STAD, TGCT, THYM, and UCEC based on the GEPIA2 database: gray represents the healthy control group, red represents tumor patients. (C) The expression of TP53 in normal tissue and OV, COAD, KIRC, LUAD, LUSC, HNSC, PAAD, and LIHC based on CPTAC: blue represents the healthy control group, red represents tumor patients. (D) The expression of TP53 in each tumor pathological stage. Relationship between TP53 expression and tumor pathological stage based on GEPIA2. Compared with the healthy control group, * p < 0.05; ** p < 0.01; *** p < 0.001.
Cimb 45 00601 g001
Figure 2. Survival analysis of TP53 expression in pan cancer (A,B) The role of TP53 expression in patient prognosis based on GEPIA2, including OS (A) and RFS (B). High cutoff (50%) and low cutoff (50%) values were used as the expression thresholds for splitting the high-expression and low-expression cohorts. The cutoff value was as follows: p-value < 0.01 and |log2 (fold change)| ˃ 1.
Cimb 45 00601 g002
Figure 3. Clinical significance and prognostic analysis of TP53. (A) Clinicopathologic staging, including N stage in COAD and KIRP, and T and N stages in KIRC. * p ˂ 0.05, ** p ˂ 0.01, *** p ˂ 0.001. (B) Pan-cancer prognostic analysis of TP53 using univariate Cox regression.
Cimb 45 00601 g003
Figure 4. Pan-cancer diagnostic value of the TP53 gene, including BLCA, BRCA, CESC, CHOL, COAD, ESCA, GBM, HNSC, KICH, KIRC, KIRP, LIHC, LUAD, LUSC, PAAD, PCPG, PRAD, READ, SARC, SKCM, STAD, THCA, THYM, and UCEC.
Cimb 45 00601 g004
Figure 5. Pan-cancer genetic alterations of TP53. (A) Pan-cancer mutation status of TP53 was performed using the cBioPortal tool. (B) Main mutation types of TP53. (C) The R273C/R273H/R273L/R273S/R273P/R273G/R273Lfs*72N274_G279del mutation site was visualized in the 3D structure of TP53 protein. (D) TP53 base mutation frequency.
Cimb 45 00601 g005
Figure 6. Pan-cancer mRNA expression of TP53. (A) Pan-cancer mutations of TP53 mRNA expression, including Splice (Driver), Truncating (Driver), Inframe (Driver), Inframe (VUS), Missense (Driver), Missense (VUS), Not mutated, Not profiled for mutations, Amplification, Gain, Diploid, Shallow Deletion, Deep Deletion, Structural Variant, Not profiled for CNA, and Structural Variants. (B) mRNA expression under different mutations of TP53: the horizontal coordinate represents TP53 mutation type, including Missense, Inframe, Truncating, Splice, Multiple, No mutation, and Not profiled, and the vertical coordinate represents mRNA expression. (C) Pan-cancer alterations and mutations in TP53 fragments: the horizontal coordinate represents the various tumors and the vertical coordinate represents the TP53 alterations and types of alterations. (D) TP53 methylation affects mRNA expression: the horizontal coordinate represents TP53 methylation [WRAP53 (cg06587969): methylation (HM27 and HM450 merge)] and the vertical coordinate represents mRNA expression. (E) Relationship between mRNA and putative copy number of TP53: the horizontal coordinate represents the TP53 copy number, including Deep Deletion, Shallow Deletion, Diploid, Gain, and Amplification, and the vertical coordinate represents mRNA expression. (F) Relationship between TP53 mRNA expression and protein expression: the horizontal coordinate represents TP53 mRNA expression and the vertical coordinate represents protein expression. (G) Pan-cancer TP53 mutation counts: the horizontal coordinate represents the various tumors and the vertical coordinate represents the count of TP53 mutations.
Cimb 45 00601 g006
Figure 7. Pan-cancer protein phosphorylation and DNA methylation of TP53. (A) CPTAC indicated the phosphorylation levels of PDHA1 at S315. (B) DNA methylation of TP53 between normal and primary tumor tissues based on the UALCAN database: blue represents the healthy control group, red represents tumor patients.
Cimb 45 00601 g007
Figure 8. Roles of TP53 in immune infiltration and immune scores in all TCGA tumor types. (AD) Correlation heatmap between TP53 expression and tumor infiltrating immune cells across different cancer types, including CD8+ T cells (A), CD4+ T cells (B), B cells (C), and myeloid dendritic cells (D). A positive correlation is marked as red, while a negative correlation is marked as blue. Non-significant correlations values are marked with a cross. (EJ) The correlation between TP53 expression and immune infiltration in HNSC (R = 0.24) (E), LIHC (R = 0.26) (F), THYM (R = 0.17) (G), STAD (R = 0.16) (H), LGG (R = 0.01) (I), and KIRC (R = 0.16) (J): the horizontal coordinate represents TP53 expression and the vertical coordinate represents immune score.
Cimb 45 00601 g008
Figure 9. Expression pattern of TP53 at the single-cell level and its relationship with cancer functional status. (A) Correlation between TP53 expression and different tumor functional status is displayed as a heatmap based on the CancerSEA database. (B) Correlation between TP53 expression and different functional states. In different tumors, red represents a positive correlation between TP53 and functional status, while blue represents a negative correlation with function status. (C) TP53 expression profiles at single-cell levels in LAML, Glioma, BRCA, UVM, HNSC, OV, COAD, and RB by T-SNE diagrams. ** p < 0.01; *** p < 0.001.
Cimb 45 00601 g009
Figure 10. Co-expression network and miRNA analysis of TP53. (A) Co-expression network of SLC31A1. (B) SLC31A1-correlated genes based on GEPIA2. (C) Heatmap representation of the expression correlation between TP53 and ten TP53-correlated genes, AURKA, BARD1, CDK2, CREBBP, DDX5, EP300, GSK3B, KAT5, MDM2, and RPA1, in different tumors. (D) The miRNA expression of genes. (E) Cluster analysis of hsa-let-7e-5p, hsa-miR-98-5p, hsa-miR-221-3p, hsa-miR-222-3p, hsa-miR-380-5p, and hsa-miR-485-5p.
Cimb 45 00601 g010
Figure 11. Analysis of TP53-related transcription factors. (A) PPI analysis of TP53-related transcription factors. (B) Location of TP53, MYC, HDAC1, MDM2, CREBBP, STAT3, and JUN proteins in cells: green represents the target protein, red represents microtubules, yellow represents the endoplasmic reticulum, and blue represents the nucleus (Scale bar, 10 μm). (C) TP53 (1TUP) protein–protein docking results with MYC (6G6K), HDAC1 (4BKX), MDM2 (1YCR), CREBBP (5NLK), STAT3 (6NUQ), JUN (1FOS). Green represents the structure of TP53 protein. Blue represents the protein structure of each transcription factor.
Cimb 45 00601 g011
Figure 12. Molecular docking analysis of TP53 and drugs. (A) TP53 protein (1TUP) had 26 binding pockets. (B) Molecular docking results between TP53 protein and pifithrin-mu. (C) Molecular docking results between TP53 protein and aspirin. (D) The higher TP53 protein drug score combined with the pocket (P_6, P_0, P_4, P_1) and pifithrin-mu molecular docking results. (E) The higher TP53 protein drug score combined with the pocket (P_6, P_0, P_4, P_1) and aspirin molecular docking results.
Cimb 45 00601 g012
Table 1. Pan-cancer clinical significance analysis of TP53.
TumorCharacteristicsLow Expression of TP53High Expression of TP53p-ValueTumorCharacteristicsLow Expression of TP53High Expression of TP53p-ValueTumorCharacteristicsLow Expression of TP53High Expression of TP53p-Value
ACCn3940 BLCAn206206 BRCAn543544
Pathologic T stage, n (%)0.135197547Pathologic T stage, n (%)0.596Pathologic T stage, n (%)0.741
T17 (9.1%)2 (2.6%) T13 (0.8%)2 (0.5%) T1138 (12.7%)140 (12.9%)
T221 (27.3%)21 (27.3%) T254 (14.3%)64 (16.9%) T2322 (29.7%)309 (28.5%)
T32 (2.6%)6 (7.8%) T3103 (27.2%)93 (24.6%) T365 (6%)75 (6.9%)
T47 (9.1%)11 (14.3%) T432 (8.5%)27 (7.1%) T416 (1.5%)19 (1.8%)
Pathologic N stage, n (%)1Pathologic N stage, n (%)0.212Pathologic N stage, n (%)0.627
N033 (42.9%)35 (45.5%) N0110 (29.9%)128 (34.8%) N0268 (25.1%)248 (23.2%)
N14 (5.2%)5 (6.5%) N124 (6.5%)22
(6%)
N1174 (16.3%)185 (17.3%)
Clinical M stage, n (%)0.486682972N246 (12.5%)31 (8.4%) N255 (5.1%)61 (5.7%)
M031 (40.3%)31 (40.3%) N33 (0.8%)4 (1.1%) N336 (3.4%)41 (3.8%)
M16 (7.8%)9 (11.7%) Pathologic M stage, n (%)0.138Pathologic M stage, n (%)0.395
CESCn153153 M092 (43.4%)109 (51.4%) M0449 (48.5%)456 (49.3%)
Pathologic T stage, n (%)0.996M12 (0.9%)9 (4.2%) M18 (0.9%)12 (1.3%)
T166 (27.2%)74 (30.5%) CHOLn1718 COADn239239
T235 (14.4%)37 (15.2%) Pathologic T stage, n (%)0.103Pathologic T stage, n (%)0.603
T310 (4.1%)11 (4.5%) T112 (34.3%)6 (17.1%) T16 (1.3%)5 (1%)
T45 (2.1%)5 (2.1%) T24 (11.4%)8 (22.9%) T3168 (35.2%)155 (32.5%)
Pathologic N stage, n (%)0.567T31
(2.9%)
4 (11.4%) T428 (5.9%)32 (6.7%)
N060 (30.8%)74 (37.9%) T40 (0%)0 (0%) T237 (7.8%)46 (9.6%)
N130 (15.4%)31 (15.9%) Pathologic N stage, n (%)0.33Pathologic N stage, n (%)0.017
Pathologic M stage, n (%)0.915N014 (46.7%)11 (36.7%) N0134 (28%)150 (31.4%)
M057 (22.3%)59 (23%) N11
(3.3%)
4 (13.3%) N150 (10.5%)58 (12.1%)
M16 (2.3%)5 (2%) Pathologic M stage, n (%)1N255 (11.5%)31 (6.5%)
MX62 (24.2%)67 (26.2%) M013 (40.6%)14 (43.8%) Pathologic M stage, n (%)0.905
DLBCn2424 M12 (6.2%)3 (9.4%) M0177 (42.7%)172 (41.4%)
Clinical stage, n (%)0.081ESCAn8182 M134 (8.2%)32 (7.7%)
Stage I4 (9.5%)4 (9.5%) Pathologic T stage, n (%)0.518HNSCn252252
Stage II6 (14.3%)11 (26.2%) T116 (11%)11 (7.6%) Pathologic T stage, n (%)0.488
Stage III5 (11.9%)0 (0%) T219 (13.1%)18 (12.4%) T123 (5.1%)22 (4.9%)
Stage IV5 (11.9%)7 (16.7%) T336 (24.8%)41 (28.3%) T264 (14.3%)71 (15.8%)
KICHn3233 T41 (0.7%)3 (2.1%) T347 (10.5%)49 (10.9%)
Pathologic T stage, n (%)0.338Pathologic N stage, n (%)0.398T496 (21.4%)76 (17%)
T18 (12.3%)12 (18.5%) N028 (19.4%)38 (26.4%) Pathologic N stage, n (%)0.731
T214 (21.5%)11 (16.9%) N135 (24.3%)28 (19.4%) N094 (22.9%)77 (18.7%)
T310 (15.4%)8 (12.3%) N25 (3.5%)4 (2.8%) N133 (8%)33 (8%)
T40 (0%)2 (3.1%) N32 (1.4%)4 (2.8%) N283 (20.2%)84 (20.4%)
Pathologic N stage, n (%)0.675Pathologic M stage, n (%)1N33 (0.7%)4 (1%)
N023 (52.3%)16 (36.4%) M060 (46.5%)61 (47.3%) Pathologic M stage, n (%)0.45
N11 (2.3%)2 (4.5%) M14 (3.1%)4 (3.1%) M0104 (55%)84 (44.4%)
N21 (2.3%)1 (2.3%) KIRCn270271 M10 (0%)1 (0.5%)
Pathologic M stage, n (%)1Pathologic T stage, n (%)0.017KIRPn145146
M019 (52.8%)15 (41.7%) T1128 (23.7%)151 (27.9%) Pathologic T stage, n (%)0.232
M11 (2.8%)1 (2.8%) T247 (8.7%)24 (4.4%) T1102 (35.3%)91 (31.5%)
LIHCn187187 T391 (16.8%)89 (16.5%) T217 (5.9%)17 (5.9%)
Pathologic T stage, n (%)0.254T44 (0.7%)7 (1.3%) T325 (8.7%)35 (12.1%)
T198 (26.4%)85 (22.9%) Pathologic N stage, n (%)0.036T40 (0%)2 (0.7%)
T247 (12.7%)48 (12.9%) N0126 (48.8%)116 (45%) Pathologic N stage, n (%)0.011
T333 (8.9%)47 (12.7%) N14
(1.6%)
12 (4.7%) N029 (37.2%)21 (26.9%)
T48 (2.2%)5 (1.3%) Pathologic M stage, n (%)0.771N15 (6.4%)19 (24.4%)
Pathologic N stage, n (%)0.659M0214 (42.1%)215 (42.3%) N22 (2.6%)2 (2.6%)
N0124 (48.1%)130 (50.4%) M138 (7.5%)41 (8.1%) Pathologic M stage, n (%)1
N11 (0.4%)3 (1.2%) LUADn269270 M048 (46.2%)47 (45.2%)
Pathologic M stage, n (%)0.625Pathologic T stage, n (%)0.554M14 (3.8%)5 (4.8%)
M0134 (49.3%)134 (49.3%) T183 (15.5%)93 (17.4%) LUSCn251251
M13 (1.1%)1 (0.4%) T2148 (27.6%)144 (26.9%) Pathologic T stage, n (%)0.41
MESOn4344 T328 (5.2%)21 (3.9%) T160 (12%)54 (10.8%)
Pathologic T stage, n (%)0.464T48
(1.5%)
11 (2.1%) T2142 (28.3%)152 (30.3%)
T17 (8.2%)7 (8.2%) Pathologic N stage, n (%)0.193T340 (8%)31 (6.2%)
T212 (14.1%)14 (16.5%) N0184 (35.2%)166 (31.7%) T49 (1.8%)14 (2.8%)
T314 (16.5%)18 (21.2%) N143 (8.2%)54 (10.3%) Pathologic N stage, n (%)0.635
T49 (10.6%)4 (4.7%) N230 (5.7%)44 (8.4%) N0160 (32.3%)160 (32.3%)
Pathologic N stage, n (%)0.063N31 (0.2%)1 (0.2%) N161 (12.3%)70 (14.1%)
N018 (21.7%)26 (31.3%) Pathologic M stage, n (%)0.571N223 (4.6%)17 (3.4%)
N14 (4.8%)6 (7.2%) M0182 (46.7%)183 (46.9%) N33 (0.6%)2 (0.4%)
N217 (20.5%)9 (10.8%) M111 (2.8%)14 (3.6%) Pathologic M stage, n (%)0.473
N33 (3.6%)0 (0%) PAADn8990 M0208 (49.6%)204 (48.7%)
Pathologic M stage, n (%)1Pathologic T stage, n (%)0.515M15 (1.2%)2 (0.5%)
M028 (46.7%)29 (48.3%) T15 (2.8%)2 (1.1%) PRADn250251
M12 (3.3%)1 (1.7%) T371 (40.1%)72 (40.7%) Pathologic T stage, n (%)0.186
READn8383 T42 (1.1%)1 (0.6%) T287 (17.6%)102 (20.6%)
Pathologic T stage, n (%)0.162T210 (5.6%)14 (7.9%) T3157 (31.8%)137 (27.7%)
T12 (1.2%)7 (4.3%) Pathologic N stage, n (%)0.887 T44 (0.8%)7 (1.4%)
T362 (37.8%)51 (31.1%) N024 (13.8%)26 (14.9%) Pathologic N stage, n (%)0.804
T47 (4.3%)7 (4.3%) N161 (35.1%)63 (36.2%) N0173 (40.4%)175 (40.9%)
T211 (6.7%)17 (10.4%) Pathologic M stage, n (%)1 N141 (9.6%)39 (9.1%)
Pathologic N stage, n (%)0.963M034 (40%)46 (54.1%) STADn187188
N043 (26.5%)41 (25.3%) M12 (2.4%)3 (3.5%) Pathologic T stage, n (%)0.416
N122 (13.6%)23 (14.2%) SKCMn236236 T111 (3%)8 (2.2%)
N217 (10.5%)16 (9.9%) Pathologic T stage, n (%)0.848 T387 (23.7%)81 (22.1%)
Pathologic M stage, n (%)0.794T123 (6.3%)19 (5.2%) T443 (11.7%)57 (15.5%)
M062 (41.6%)64 (43%) T239 (10.7%)40 (11%) T242 (11.4%)38 (10.4%)
M112 (8.1%)11 (7.4%) T343 (11.8%)48 (13.2%) Pathologic N stage, n (%)0.303
TGCTn6970 T479 (21.6%)74 (20.3%) N059 (16.5%)52 (14.6%)
Pathologic T stage, n (%)0.682Pathologic N stage, n (%)0.24 N141 (11.5%)56 (15.7%)
T139 (28.3%)41 (29.7%) N0108 (26%)128 (30.8%) N237 (10.4%)38 (10.6%)
T227 (19.6%)25 (18.1%) N142 (10.1%)32 (7.7%) N341 (11.5%)33 (9.2%)
T32 (1.4%)4 (2.9%) N225
(6%)
24 (5.8%) Pathologic M stage, n (%)0.056
Pathologic N stage, n (%)0.601N332 (7.7%)24 (5.8%) M0159 (44.8%)171 (48.2%)
N016 (25%)35 (54.7%) Pathologic M stage, n (%)0.568 M117 (4.8%)8 (2.3%)
N15 (7.8%)6 (9.4%) M0209 (47.1%)210 (47.3%) UVMn4040
N21 (1.6%)1 (1.6%) M111 (2.5%)14 (3.2%) Pathologic M stage, n (%)0.835
Pathologic M stage, n (%)0.153THCAn256256 M025 (32.1%)26 (33.3%)
M059 (47.6%)61 (49.2%) Pathologic T stage, n (%)0.043M12 (2.6%)2 (2.6%)
M10 (0%)4 (3.2%) T168 (13.3%)75 (14.7%)
T273 (14.3%)96 (18.8%)
T3100 (19.6%)75 (14.7%)
T414 (2.7%)9 (1.8%)
Pathologic N stage, n (%)0.077
N0104 (22.5%)125 (27.1%)
N1125 (27.1%)108 (23.4%)
Pathologic M stage, n (%)0.214
M0140 (47.5%)146 (49.5%)
M12 (0.7%)7 (2.4%)
Table 2. Analysis of the logistics model between clinical pathological staging and TP53.
TumorCharacteristicsTotal (N)OR (95% CI)p-ValueTumorCharacteristicsTotal (N)OR (95% CI)p-ValueTumorCharacteristicsTotal (N)OR (95% CI)p-Value
ACCPathologic T stage (T3&T4 vs. T1&T2)772.300 (0.865–6.116)0.095BLCAPathologic T stage (T3&T4 vs. T1&T2)3780.768 (0.499–1.182)0.23BRCAPathologic T stage (T2&T3&T4 vs. T1)10840.986 (0.750–1.295)0.918
Pathologic N stage (N1 vs. N0)771.179 (0.291–4.770)0.818Pathologic N stage (N1&N2&N3 vs. N0)3680.671 (0.436–1.032)0.069Pathologic N stage (N1&N2&N3 vs. N0)10681.170 (0.920–1.488)0.199
CESCPathologic T stage (T2&T3&T4 vs. T1)2430.945 (0.568–1.573)0.829Pathologic M stage (M1 vs. M0)2123.798 (0.800–18.022)0.093Pathologic M stage (M1 vs. M0)9251.477 (0.598–3.647)0.398
Pathologic N stage (N1 vs. N0)1950.838 (0.457–1.537)0.568CHOLPathologic T stage (T2&T3&T4 vs. T1)354.800 (1.147–20.085)0.032COADPathologic T stage (T3&T4 vs. T1&T2)4770.804 (0.512–1.265)0.346
Pathologic M stage (M1&MX vs. M0)2561.023 (0.625–1.674)0.928Pathologic N stage (N1 vs. N0)305.091 (0.496–52.285)0.171Pathologic N stage (N1&N2 vs. N0)4780.757 (0.525–1.092)0.136
ESCAPathologic T stage (T3&T4 vs. T1&T2)1451.435 (0.743–2.772)0.282Pathologic M stage (M1 vs. M0)321.393 (0.200–9.711)0.738Pathologic M stage (M1 vs. M0)4150.969 (0.572–1.640)0.905
Pathologic N stage (N1&N2&N3 vs. N0)1440.632 (0.326–1.223)0.173HNSCPathologic T stage (T3&T4 vs. T1&T2)4480.818 (0.560–1.194)0.297KICHPathologic T stage (T2&T3&T4 vs. T1)650.583 (0.200–1.699)0.323
KIRCPathologic T stage (T2&T3&T4 vs. T1)5410.716 (0.511–1.005)0.053Pathologic N stage (N1&N2&N3 vs. N0)4111.241 (0.838–1.840)0.282Pathologic N stage (N1&N2 vs. N0)442.156 (0.323–14.410)0.428
Pathologic N stage (N1 vs. N0)2583.259 (1.022–10.388)0.046Pathologic M stage (M1 vs. M0)18975169169.1684 (0.000–Inf)0.997Pathologic M stage (M1 vs. M0)361.267 (0.073–21.968)0.871
Pathologic M stage (M1 vs. M0)5081.074 (0.664–1.736)0.771KIRPPathologic T stage (T2&T3&T4 vs. T1)2891.441 (0.881–2.358)0.146LIHCPathologic T stage (T2&T3&T4 vs. T1)3711.310 (0.871–1.970)0.194
LUADPathologic T stage (T2&T3&T4 vs. T1)5360.854 (0.595–1.225)0.390Pathologic N stage (N1&N2 vs. N0)784.143 (1.489–11.527)0.006 Pathologic N stage (N1 vs. N0)2582.862 (0.294–27.877)0.365
Pathologic N stage (N1&N2&N3 vs. N0)5231.483 (1.027–2.141)0.035Pathologic M stage (M1 vs. M0)1041.277 (0.323–5.049)0.728 Pathologic M stage (M1 vs. M0)2720.333 (0.034–3.245)0.344
Pathologic M stage (M1 vs. M0)3901.266 (0.560–2.862)0.571LUSC Pathologic T stage (T2&T3&T4 vs. T1)5021.146 (0.754–1.741)0.523MESOPathologic T stage (T3&T4 vs. T1&T2)850.865 (0.369–2.030)0.74
PAADPathologic T stage (T3&T4 vs. T1&T2)1770.937 (0.432–2.036)0.870Pathologic N stage (N1&N2&N3 vs. N0)4961.023 (0.708–1.478)0.904Pathologic N stage (N1&N2&N3 vs. N0)830.433 (0.179–1.045)0.063
Pathologic N stage (N1 vs. N0)1740.953 (0.494–1.839)0.887Pathologic M stage (M1 vs. M0)4190.408 (0.078–2.126)0.287Pathologic M stage (M1 vs. M0)600.483 (0.041–5.628)0.561
Pathologic M stage (M1 vs. M0)851.109 (0.176–7.004)0.913PRADPathologic T stage (T3&T4 vs. T2)4940.763 (0.530–1.098)0.145READPathologic T stage (T3&T4 vs. T1&T2)1640.455 (0.213–0.973)0.042
SKCMPathologic T stage (T3&T4 vs. T1&T2)3651.051 (0.680–1.625)0.824Pathologic N stage (N1 vs. N0)4280.940 (0.578–1.529)0.804Pathologic N stage (N1&N2 vs. N0)1621.049 (0.566–1.943)0.880
Pathologic N stage (N1&N2&N3 vs. N0)4150.682 (0.461–1.007)0.054STADPathologic T stage (T3&T4 vs. T1&T2)3671.223 (0.771–1.941)0.393Pathologic M stage (M1 vs. M0)1490.888 (0.365–2.162)0.794
Pathologic M stage (M1 vs. M0)4441.267 (0.562–2.855)0.569Pathologic N stage (N1&N2&N3 vs. N0)3571.211 (0.773–1.897)0.403UVMPathologic M stage (M1&MX vs. M0)780.769 (0.301–1.963)0.583
TGCTPathologic T stage (T2&T3 vs. T1)1380.951 (0.484–1.870)0.885Pathologic M stage (M1 vs. M0)3550.438 (0.184–1.042)0.062
Pathologic N stage (N1&N2 vs. N0)640.533 (0.154–1.844)0.321THCAPathologic T stage (T3&T4 vs. T1&T2)5100.608 (0.424–0.870)0.007
Pathologic M stage (M1 vs. M0)12456035110.1225 (0.000–Inf)0.994Pathologic N stage (N1 vs. N0)4620.719 (0.499–1.037)0.077
Pathologic M stage (M1 vs. M0)2953.356 (0.685–16.433)0.135
Table 3. The best binding pockets of TP53 protein.
NameP_6P_0P_4P_1
drugScore0.7850280.7459740.7235060.680187
volume277.86485.15309.3419.38
surface312.4685.27243.85613
depth21.116.1518.2715.25
surf/vol1.1243072051.4124909820.7883931461.46168153
ell c/a0.050.090.10.11
ell b/a0.140.20.290.79
siteAtms13597145124
accept34254233
donor16121511
hydrophobicity0.180.530.080.37
Cs92679781
Ns25122623
Os16171719
Ss2151
Xs0000
negAA0.040.090.030.07
posAA0.240.180.250.26
polarAA0.20.270.380.37
apolarAA0.520.450.340.3
ALA3122
ARG4353
ASN0021
ASP1101
CYS0042
GLN1012
GLU0111
GLY0020
HIS2033
ILE2320
LEU1211
LYS0101
MET2122
PHE0000
PRO2110
SER3214
THR0301
TRP0000
TYR1120
VAL3233
Disclaimer/Publisher’s Note: The statements, opinions and data contained in all publications are solely those of the individual author(s) and contributor(s) and not of MDPI and/or the editor(s). MDPI and/or the editor(s) disclaim responsibility for any injury to people or property resulting from any ideas, methods, instructions or products referred to in the content.

