
Identification of Multiple Genetic Loci Related to Low-Temperature Tolerance during Germination in Maize (Zea maize L.) through a Genome-Wide Association Study


Abstract
:1. Introduction
2. Materials and Methods
2.1. Plant Materials
2.2. Identification of Low-Temperature Tolerance during Germination in the Field
2.3. Identification of Low-Temperature Tolerance during Germination in the Laboratory
2.4. Phenotypic Analysis
2.5. Analysis of Genotype
2.5.1. Analysis of SNPs
2.5.2. Analysis of Population Structure
2.5.3. Analysis of LD
2.6. Analysis of Genome-Wide Association
3. Results
3.1. Phenotypic Analysis of Low-Temperature Tolerance during Germination in the Field
3.2. Phenotypic Analysis of Low-Temperature Tolerance during Germination in the Laboratory
3.3. Correlation Analysis of Low-Temperature Tolerance during Germination between Field and Indoor
3.4. Analysis of Genotype
3.4.1. Analysis of SNPs
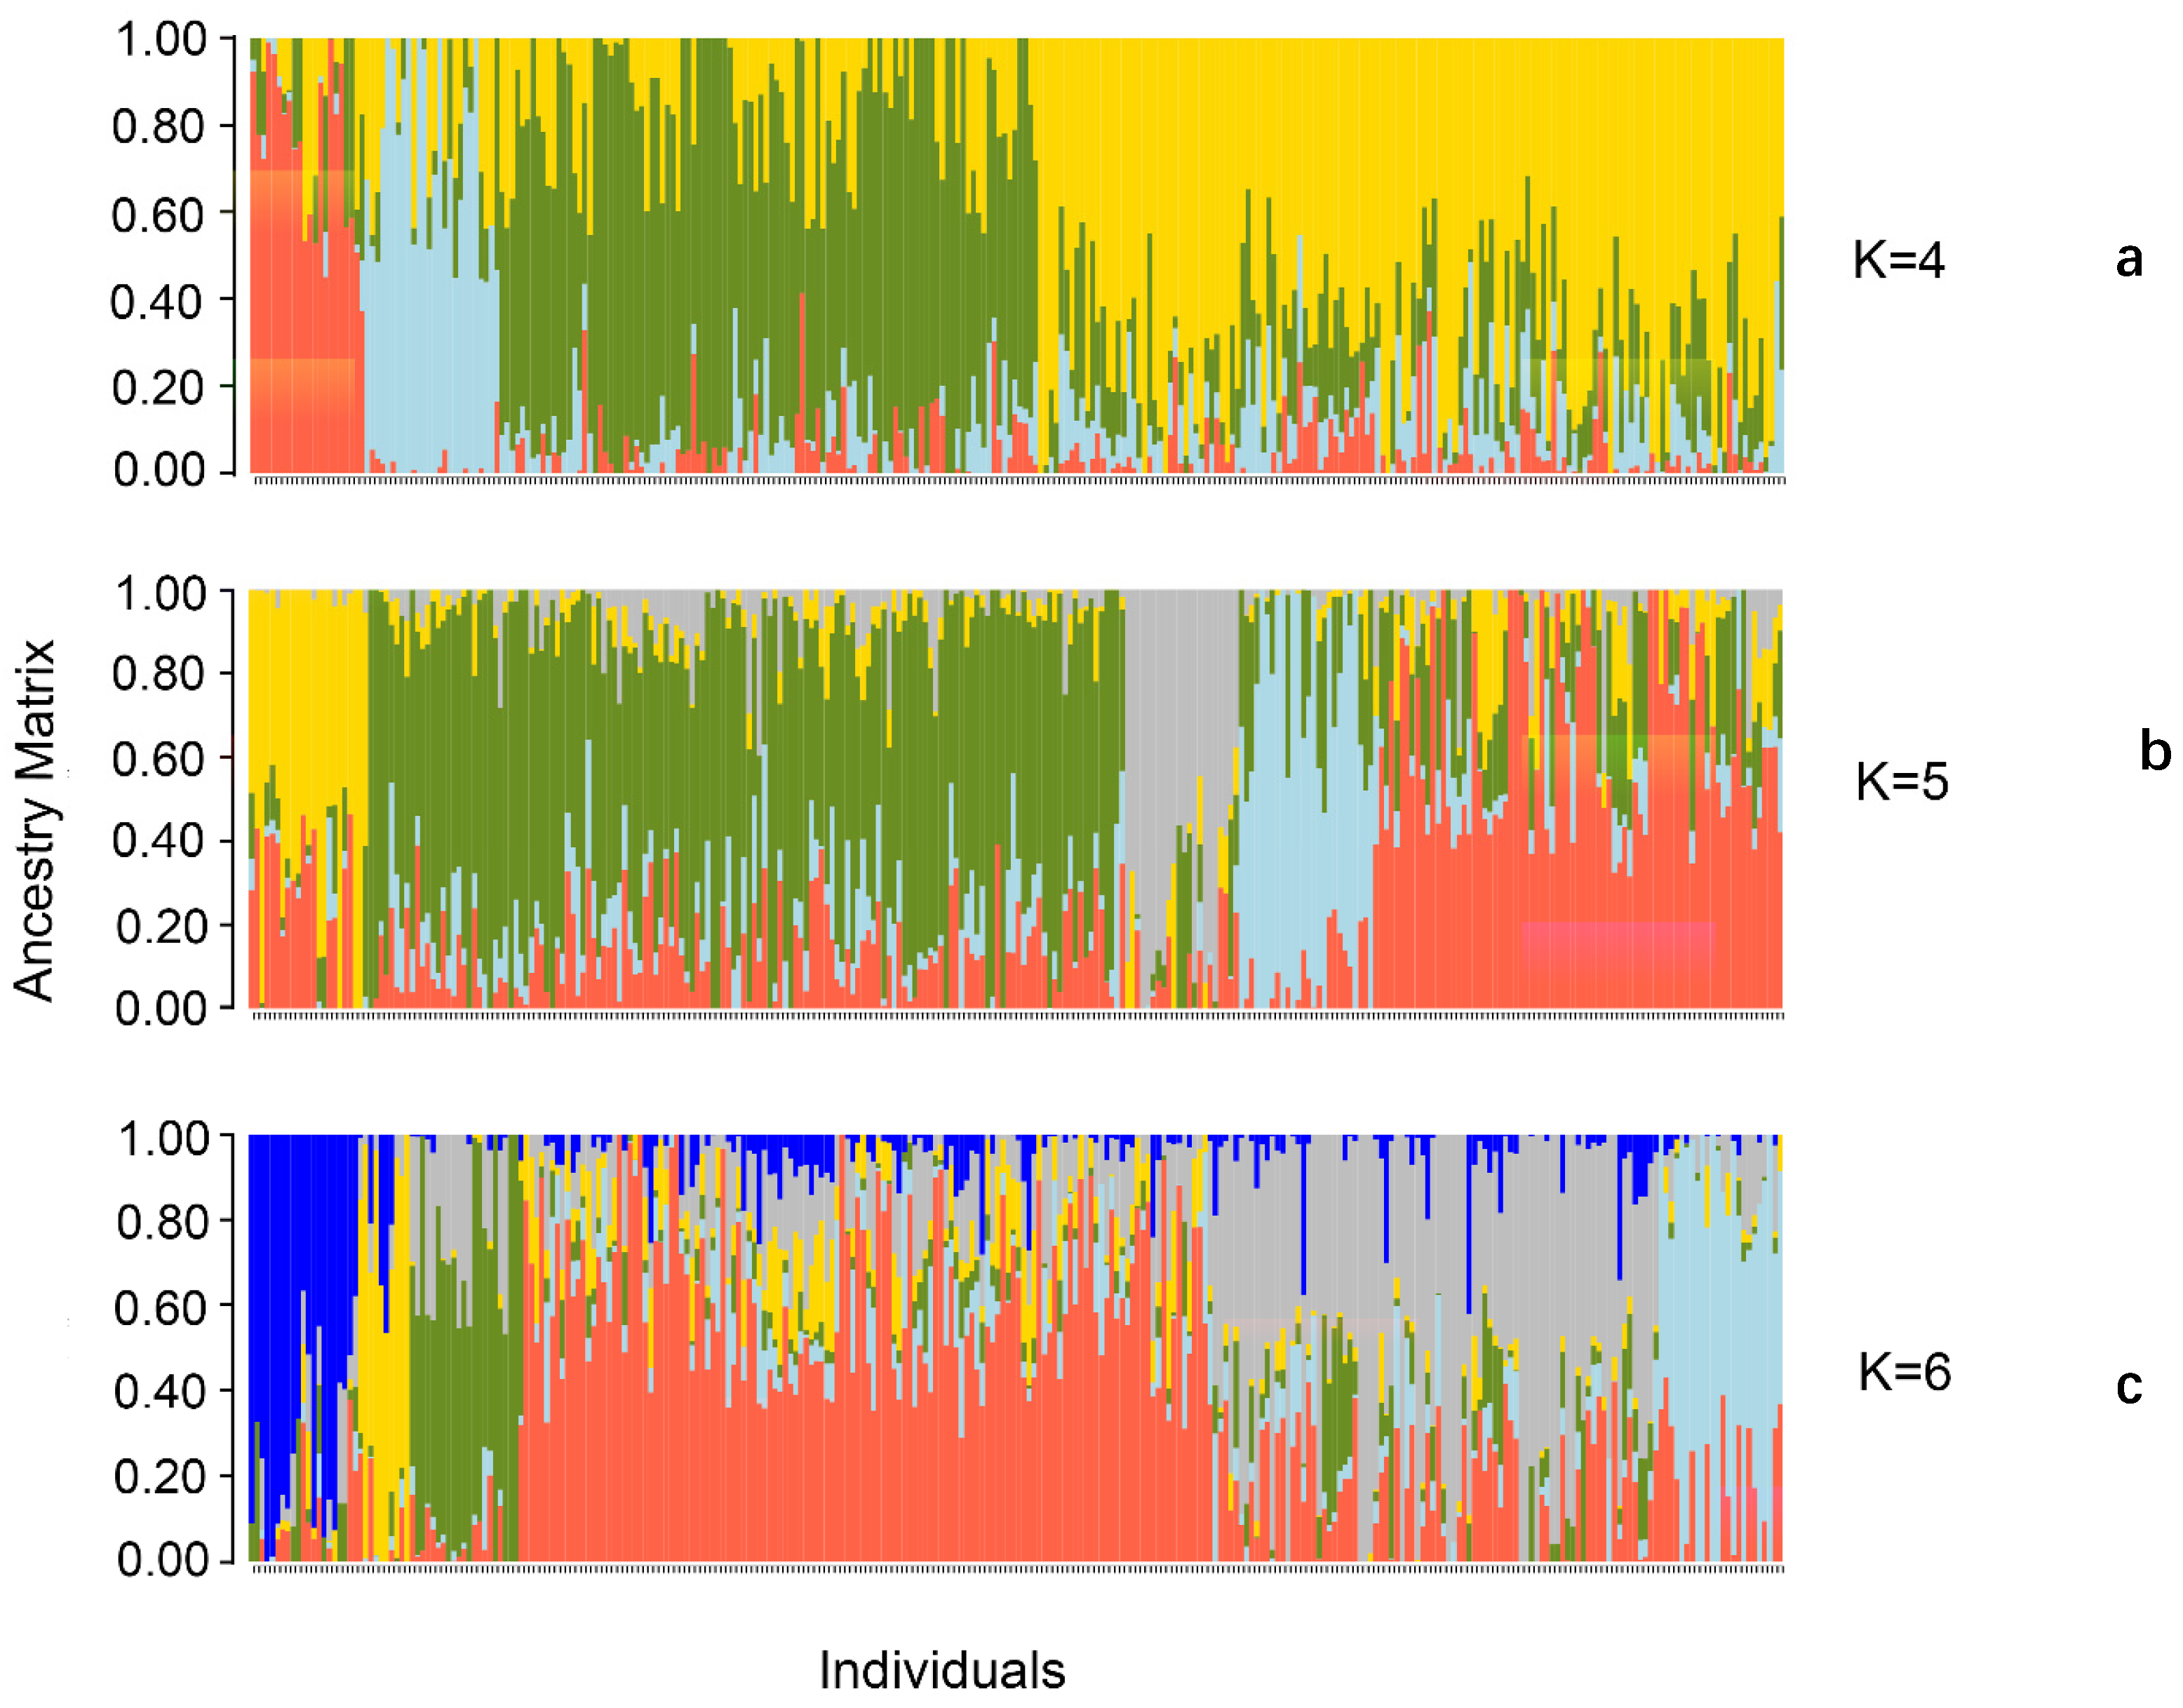
3.4.2. Analysis of Population Structure
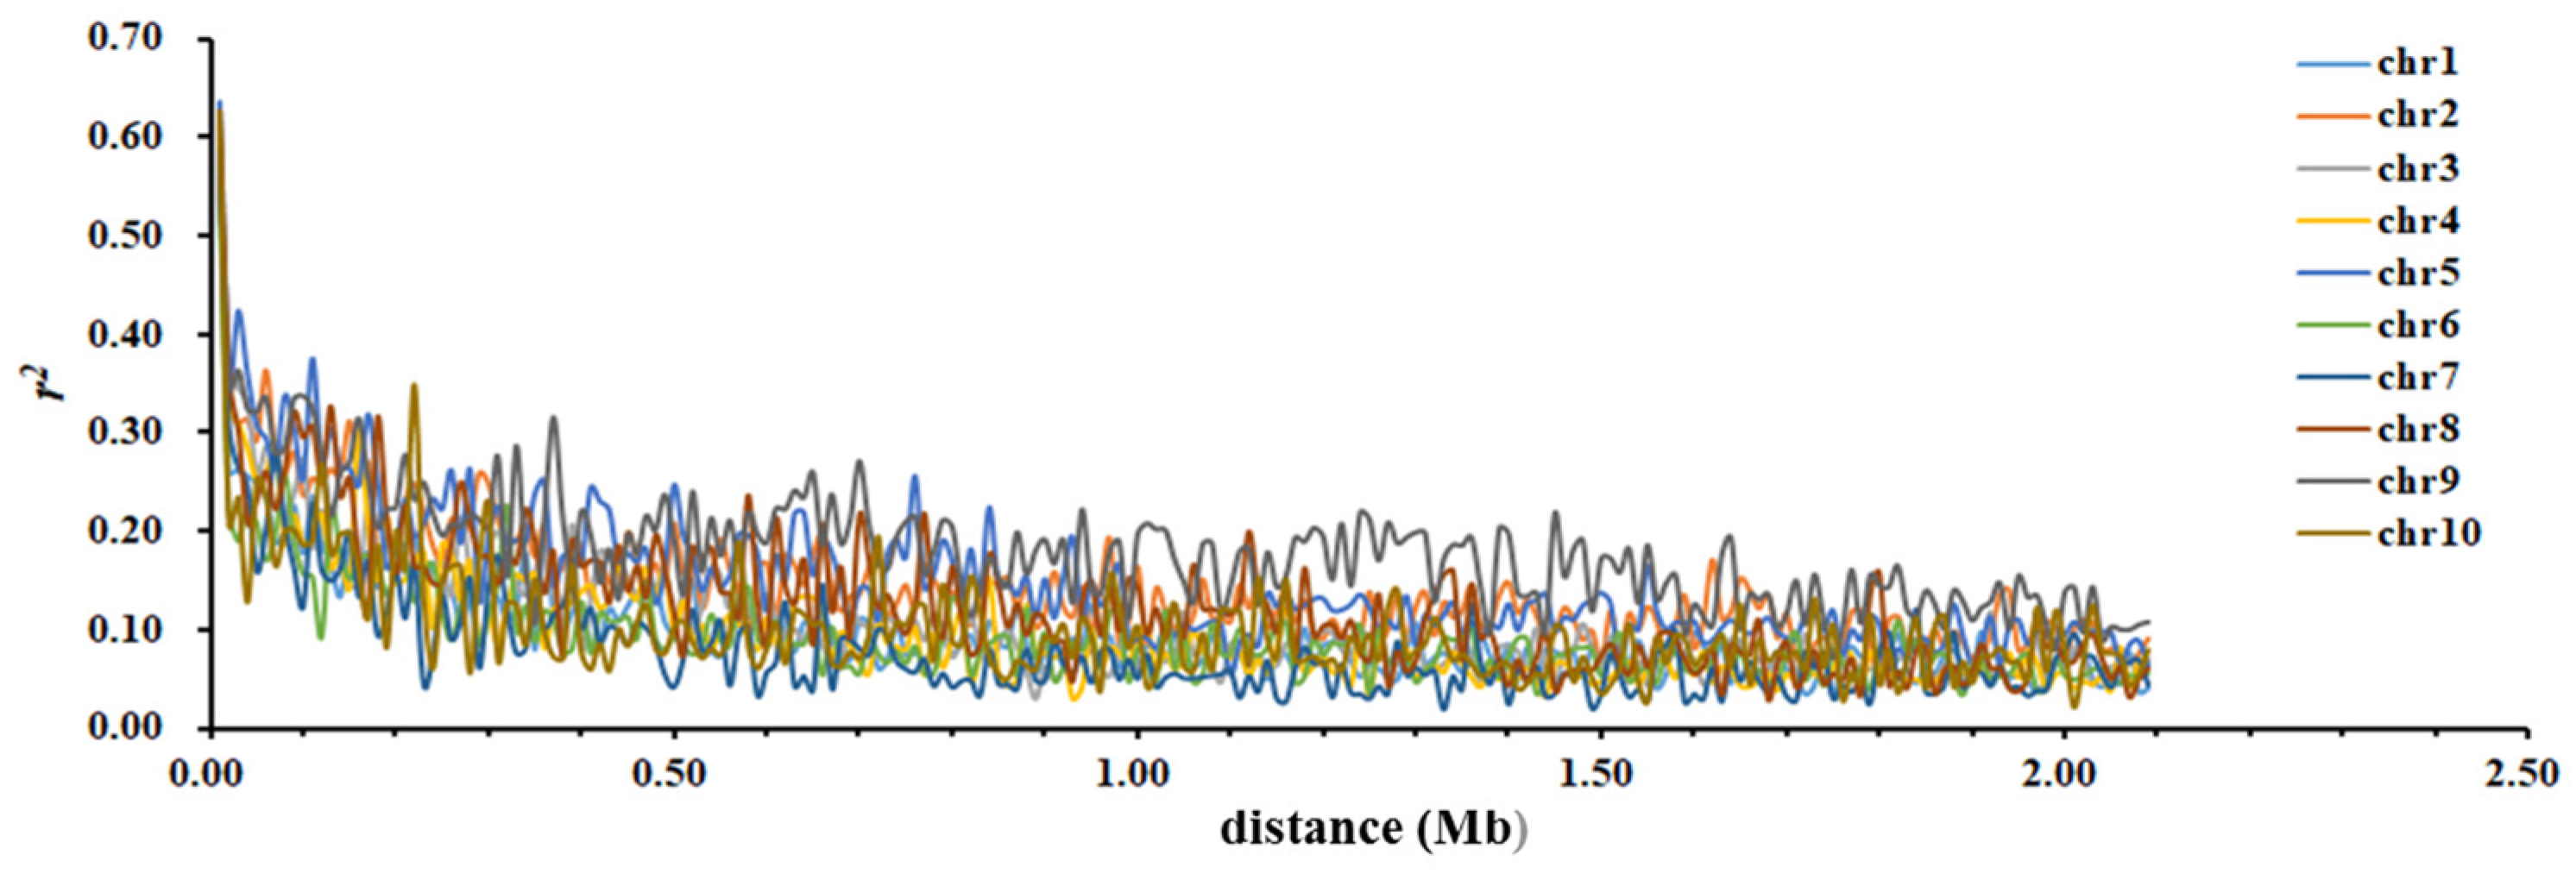
3.4.3. Analysis of LD
3.5. Analysis of Genome-Wide Association
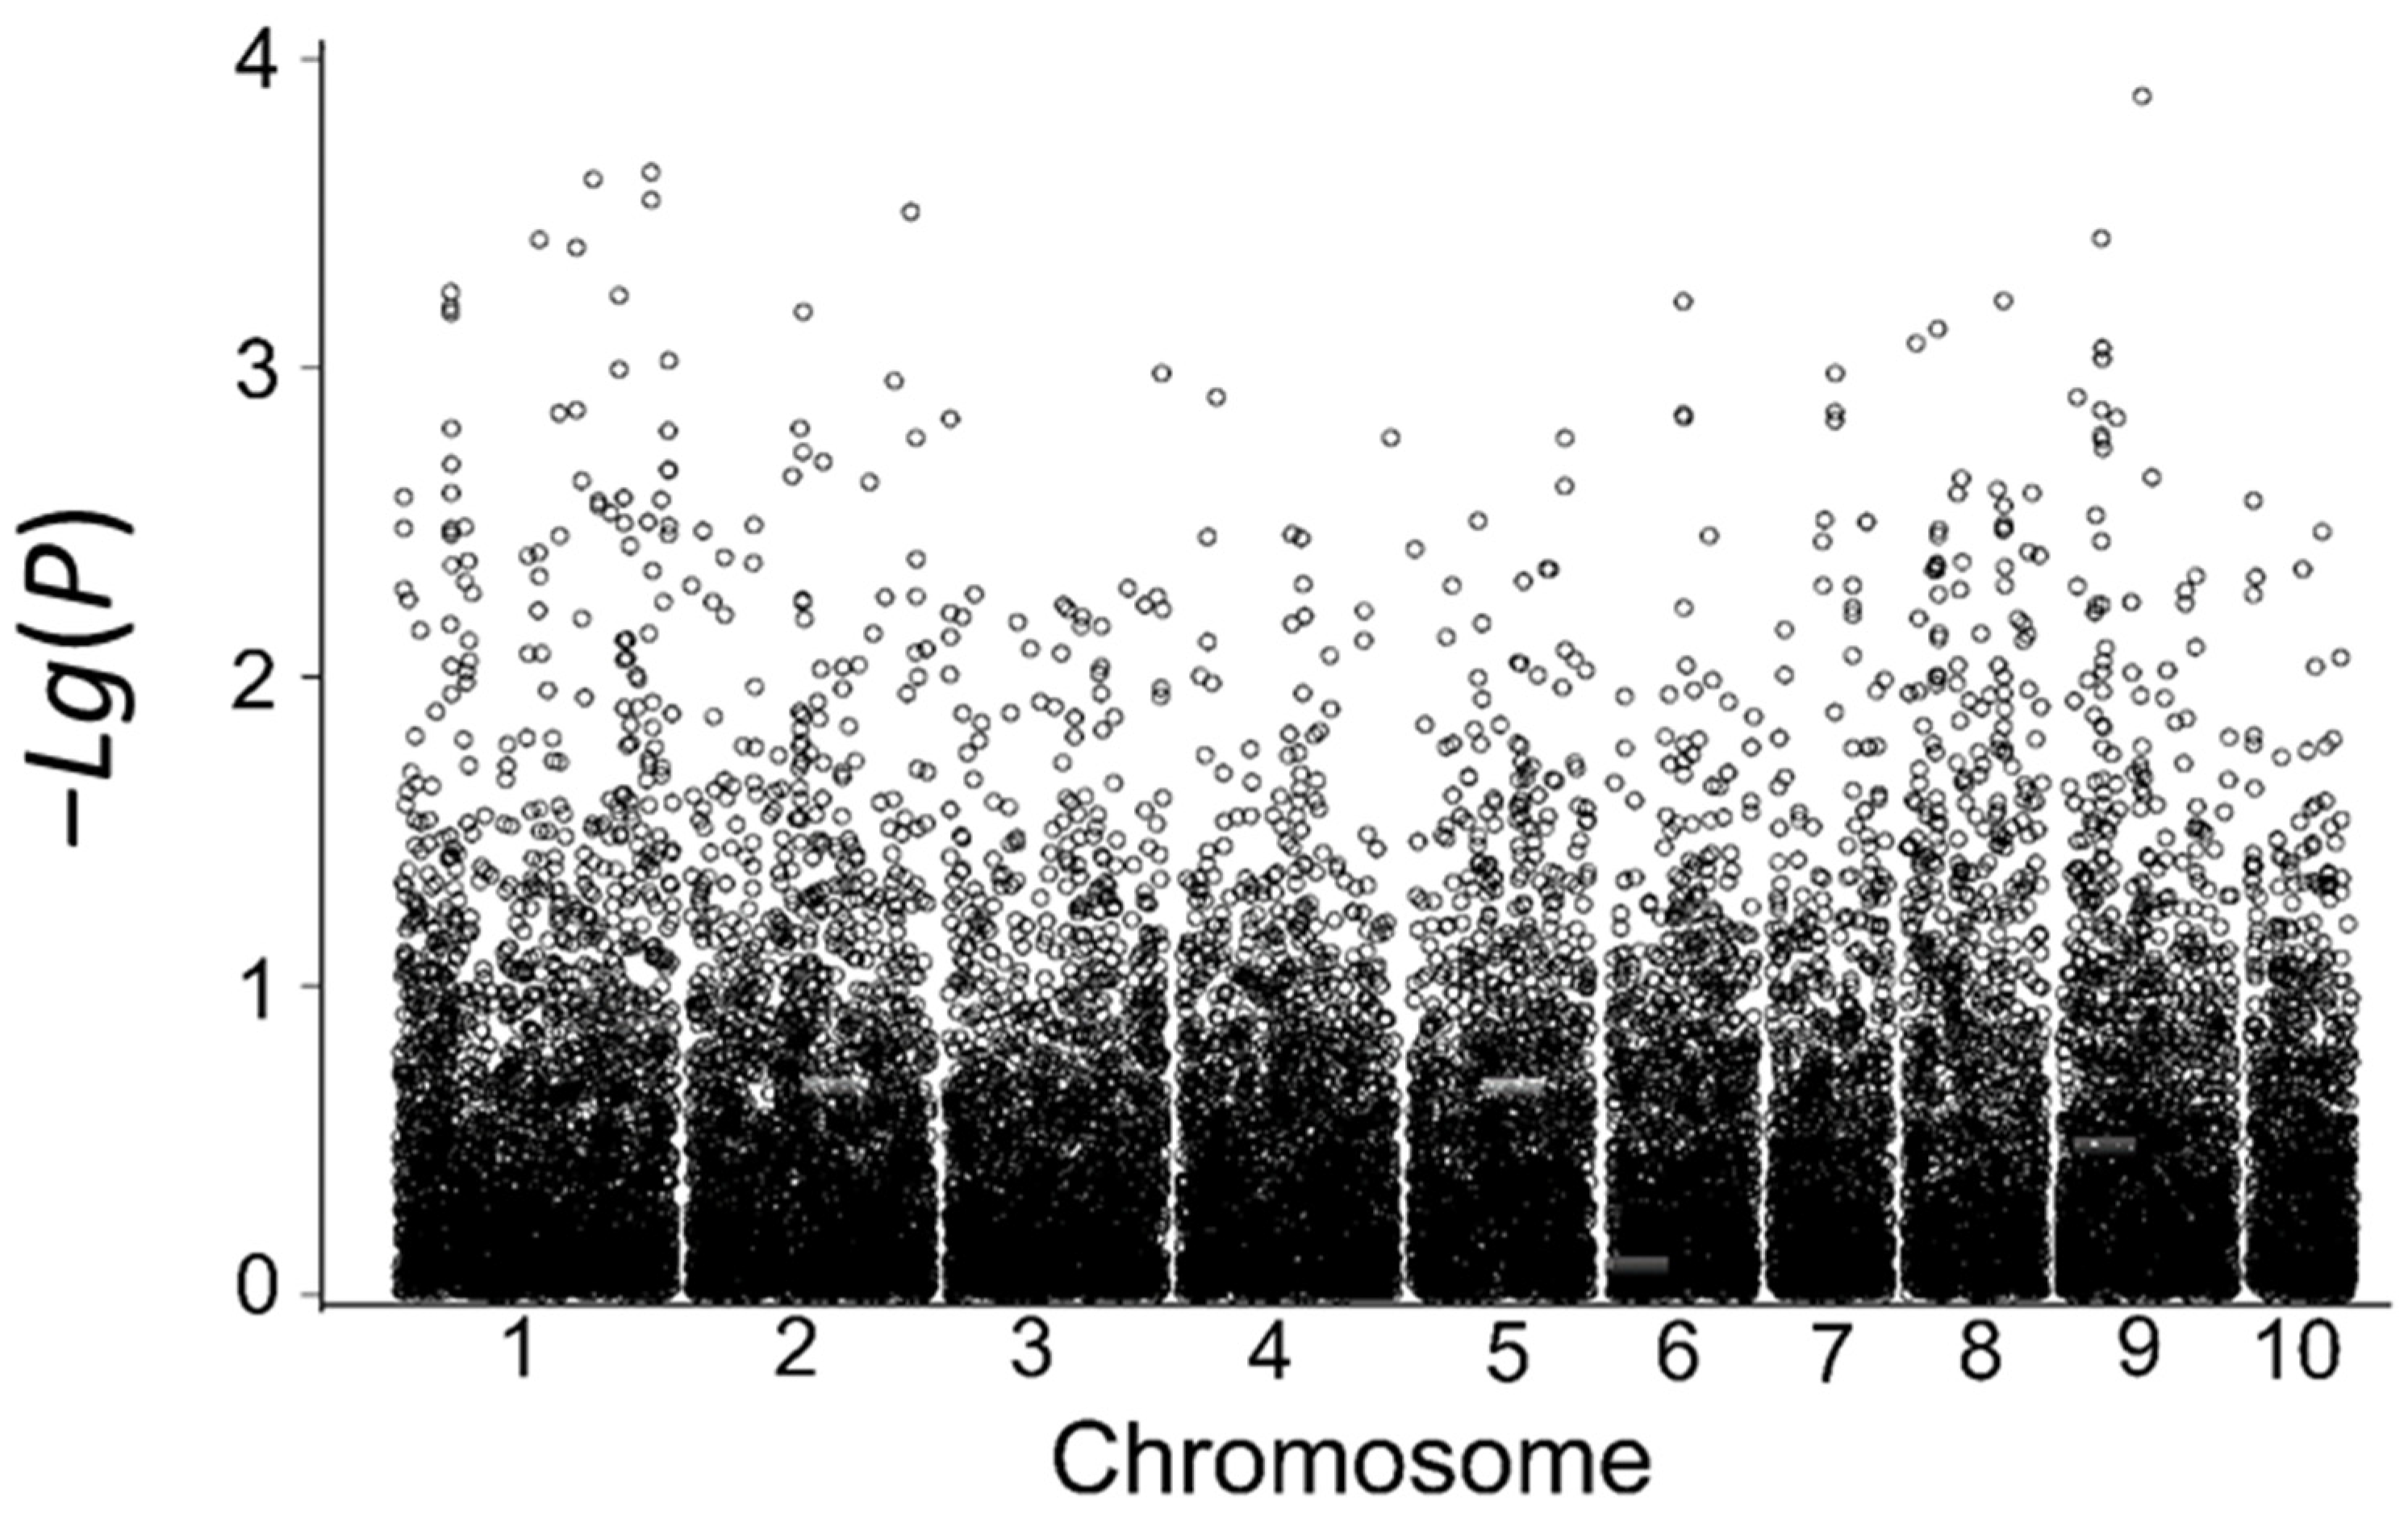
3.5.1. Genome-Wide Association Analysis of Low-Temperature Tolerance in the Field
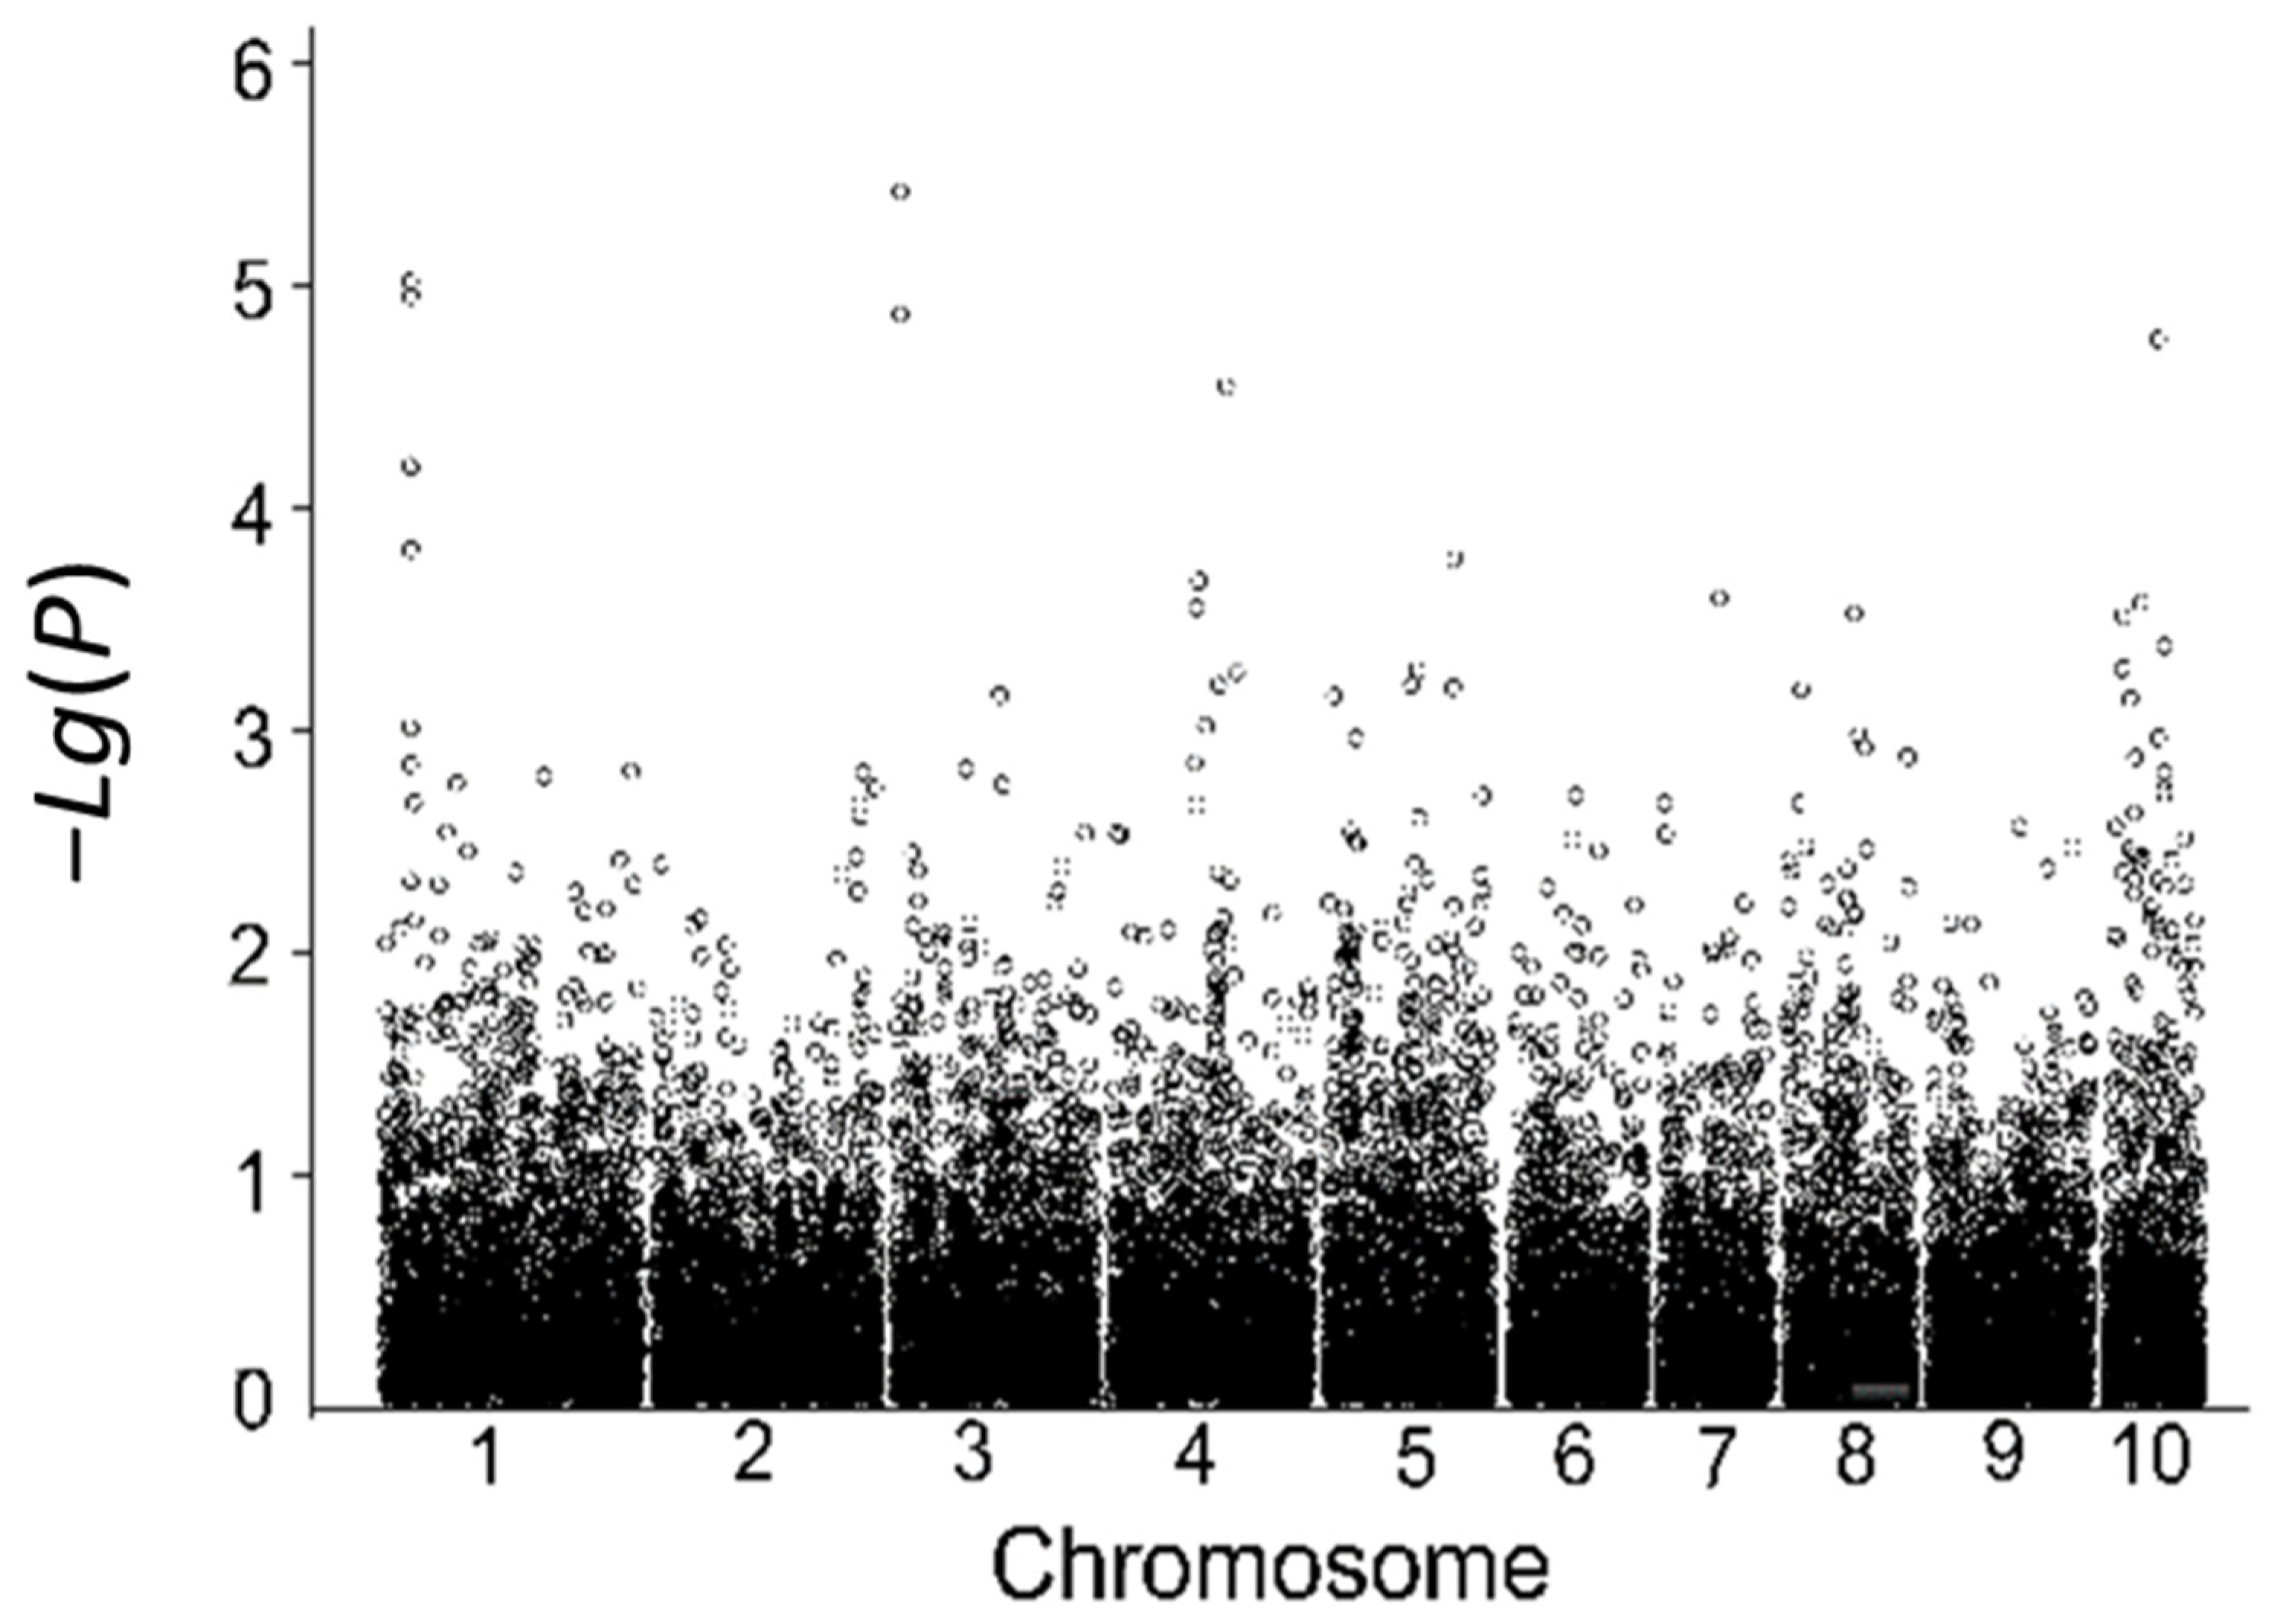
3.5.2. Genome-Wide Association Analysis of Low-Temperature Tolerance in the Laboratory
3.5.3. Consistency Analysis of SNP Markers Associated with Low-Temperature Tolerance
4. Discussion
5. Conclusions
Author Contributions
Funding
Institutional Review Board Statement
Informed Consent Statement
Data Availability Statement
Conflicts of Interest
Appendix A

| NO. | Name | Ancestry Matrix | Subgroup | ||||
|---|---|---|---|---|---|---|---|
| A | B | C | D | E | |||
| 1 | LX46 | 0.86 | 0 | 0.05 | 0 | 0.09 | A |
| 2 | UH302 | 0.92 | 0 | 0 | 0.08 | 0 | A |
| 3 | LX56 | 0.57 | 0.14 | 0 | 0 | 0.29 | A |
| 4 | LX57 | 0.59 | 0.14 | 0 | 0 | 0.27 | A |
| 5 | LX65 | 0.52 | 0.02 | 0.37 | 0.05 | 0.04 | A |
| 6 | LX76 | 0.39 | 0.09 | 0.32 | 0 | 0.2 | A |
| 7 | LX98 | 0.9 | 0.1 | 0 | 0 | 0 | A |
| 8 | LX99 | 0.67 | 0.33 | 0 | 0 | 0 | A |
| 9 | 38P05f | 0.77 | 0 | 0.07 | 0 | 0.16 | A |
| 10 | 38P05m | 1 | 0 | 0 | 0 | 0 | A |
| 11 | LX113 | 1 | 0 | 0 | 0 | 0 | A |
| 12 | YA1M | 0.9 | 0 | 0.04 | 0.03 | 0.03 | A |
| 13 | LX147 | 0.85 | 0 | 0.06 | 0.03 | 0.06 | A |
| 14 | LX148 | 0.88 | 0 | 0.05 | 0.03 | 0.04 | A |
| 15 | LX151 | 0.74 | 0.09 | 0 | 0 | 0.17 | A |
| 16 | LX156 | 0.67 | 0.33 | 0 | 0 | 0 | A |
| 17 | LX162 | 0.37 | 0 | 0.37 | 0.16 | 0.1 | A |
| 18 | LX171 | 0.53 | 0.03 | 0.06 | 0.2 | 0.18 | A |
| 19 | UH303 | 0.91 | 0 | 0.05 | 0.04 | 0 | A |
| 20 | LX194 | 0.45 | 0.15 | 0.27 | 0 | 0.13 | A |
| 21 | 688F | 0.94 | 0.06 | 0 | 0 | 0 | A |
| 22 | LX94 | 0 | 0.48 | 0.23 | 0.01 | 0.28 | B |
| 23 | LX115 | 0.01 | 0.56 | 0.02 | 0 | 0.41 | B |
| 24 | xy335f | 0 | 0.97 | 0.03 | 0 | 0 | B |
| 25 | LX132 | 0.01 | 0.44 | 0.15 | 0 | 0.4 | B |
| 26 | LX137 | 0.04 | 0.47 | 0.11 | 0 | 0.38 | B |
| 27 | LY88M | 0 | 0.78 | 0.06 | 0 | 0.16 | B |
| 28 | LX164 | 0 | 0.65 | 0.07 | 0 | 0.28 | B |
| 29 | LX166 | 0 | 0.68 | 0 | 0 | 0.32 | B |
| 30 | LX167 | 0 | 0.68 | 0.04 | 0.02 | 0.26 | B |
| 31 | LX168 | 0 | 0.54 | 0.01 | 0 | 0.45 | B |
| 32 | LX169 | 0 | 0.61 | 0.05 | 0 | 0.34 | B |
| 33 | LX172 | 0.03 | 0.55 | 0 | 0 | 0.42 | B |
| 34 | LX180 | 0 | 0.88 | 0.1 | 0.02 | 0 | B |
| 35 | LX186 | 0 | 0.89 | 0.09 | 0.02 | 0 | B |
| 36 | LX205 | 0 | 0.51 | 0.26 | 0 | 0.23 | B |
| 37 | LX206 | 0.04 | 0.48 | 0.24 | 0.03 | 0.21 | B |
| 38 | LY99M | 0 | 1 | 0 | 0 | 0 | B |
| 39 | MEIXI | 0.03 | 0.43 | 0.17 | 0.04 | 0.33 | B |
| 40 | 101M | 0.01 | 0.53 | 0 | 0 | 0.46 | B |
| 41 | 420F | 0 | 1 | 0 | 0 | 0 | B |
| 42 | 738M | 0 | 1 | 0 | 0 | 0 | B |
| 43 | 820F | 0.05 | 0.55 | 0.33 | 0.07 | 0 | B |
| 44 | LX1 | 0.05 | 0.04 | 0.49 | 0.09 | 0.33 | C |
| 45 | LX2 | 0.03 | 0.05 | 0.62 | 0.16 | 0.14 | C |
| 46 | LX3 | 0.01 | 0.06 | 0.64 | 0.2 | 0.09 | C |
| 47 | LX4 | 0 | 0.13 | 0.53 | 0.17 | 0.17 | C |
| 48 | LX5 | 0.02 | 0.02 | 0.83 | 0.13 | 0 | C |
| 49 | LX6 | 0 | 0.02 | 0.92 | 0.04 | 0.02 | C |
| 50 | LX8 | 0.02 | 0.02 | 0.59 | 0.04 | 0.33 | C |
| 51 | LX9 | 0 | 0 | 1 | 0 | 0 | C |
| 52 | LX10 | 0.03 | 0.03 | 0.76 | 0.05 | 0.13 | C |
| 53 | LuYuan92 | 0.02 | 0.03 | 0.72 | 0.08 | 0.15 | C |
| 54 | LX12 | 0.25 | 0 | 0.45 | 0.22 | 0.08 | C |
| 55 | LX13 | 0.02 | 0.05 | 0.53 | 0.05 | 0.35 | C |
| 56 | LX14 | 0.02 | 0.05 | 0.59 | 0.04 | 0.3 | C |
| 57 | LX15 | 0.03 | 0.09 | 0.69 | 0.05 | 0.14 | C |
| 58 | LX17 | 0.02 | 0.03 | 0.69 | 0.04 | 0.22 | C |
| 59 | LX18 | 0.1 | 0.03 | 0.44 | 0.3 | 0.13 | C |
| 60 | H261 | 0 | 0.02 | 0.74 | 0.05 | 0.19 | C |
| 61 | LX19 | 0.05 | 0.05 | 0.61 | 0.05 | 0.24 | C |
| 62 | LX20 | 0 | 0.01 | 0.61 | 0.05 | 0.33 | C |
| 63 | LX21 | 0.19 | 0.08 | 0.37 | 0.07 | 0.29 | C |
| 64 | Q319 | 0.04 | 0.06 | 0.71 | 0.05 | 0.14 | C |
| 65 | LX23 | 0.02 | 0.05 | 0.73 | 0.18 | 0.02 | C |
| 66 | LX25 | 0.1 | 0.08 | 0.6 | 0.07 | 0.15 | C |
| 67 | LX95 | 0 | 0.05 | 0.74 | 0.21 | 0 | C |
| 68 | LX27 | 0 | 0 | 0.86 | 0 | 0.14 | C |
| 69 | LX29 | 0.04 | 0.04 | 0.66 | 0.07 | 0.19 | C |
| 70 | LX30 | 0 | 0.08 | 0.56 | 0.29 | 0.07 | C |
| 71 | LX32 | 0 | 0 | 0.88 | 0.12 | 0 | C |
| 72 | LX33 | 0 | 0.07 | 0.57 | 0.31 | 0.05 | C |
| 73 | LX34 | 0 | 0.02 | 0.75 | 0.16 | 0.07 | C |
| 74 | LX35 | 0.1 | 0.05 | 0.45 | 0.26 | 0.14 | C |
| 75 | LX36 | 0.27 | 0.01 | 0.4 | 0.21 | 0.11 | C |
| 76 | LX37 | 0.04 | 0.06 | 0.46 | 0.28 | 0.16 | C |
| 77 | LX38 | 0 | 0 | 0.97 | 0 | 0.03 | C |
| 78 | LX39 | 0 | 0 | 0.82 | 0.18 | 0 | C |
| 79 | LX40 | 0.03 | 0 | 0.71 | 0 | 0.26 | C |
| 80 | LX41 | 0 | 0 | 0.54 | 0.15 | 0.31 | C |
| 81 | LX42 | 0.01 | 0.05 | 0.47 | 0.03 | 0.44 | C |
| 82 | LX43 | 0 | 0 | 0.87 | 0.13 | 0 | C |
| 83 | LX45 | 0.02 | 0.03 | 0.78 | 0.08 | 0.09 | C |
| 84 | B317 | 0 | 0.01 | 0.84 | 0.08 | 0.07 | C |
| 85 | LX48 | 0.01 | 0.02 | 0.77 | 0.11 | 0.09 | C |
| 86 | B144 | 0.02 | 0.04 | 0.47 | 0.04 | 0.43 | C |
| 87 | Si287 | 0 | 0 | 0.84 | 0.16 | 0 | C |
| 88 | 7-004 | 0 | 0 | 0.66 | 0 | 0.34 | C |
| 89 | SD190 | 0.01 | 0.05 | 0.78 | 0.08 | 0.08 | C |
| 90 | LX49 | 0.02 | 0.03 | 0.73 | 0.01 | 0.21 | C |
| 91 | LX50 | 0 | 0 | 0.89 | 0 | 0.11 | C |
| 92 | LX52 | 0.05 | 0 | 0.69 | 0.05 | 0.21 | C |
| 93 | LX53 | 0 | 0 | 0.9 | 0.05 | 0.05 | C |
| 94 | LX55 | 0.01 | 0.05 | 0.62 | 0.16 | 0.16 | C |
| 95 | LX59 | 0.06 | 0.02 | 0.72 | 0.05 | 0.15 | C |
| 96 | LX60 | 0.02 | 0.04 | 0.62 | 0.08 | 0.24 | C |
| 97 | LX61 | 0.03 | 0.03 | 0.73 | 0.12 | 0.09 | C |
| 98 | LX62 | 0 | 0 | 0.76 | 0.24 | 0 | C |
| 99 | LX63 | 0 | 0.08 | 0.79 | 0.1 | 0.03 | C |
| 100 | LX64 | 0 | 0.01 | 0.75 | 0.2 | 0.04 | C |
| 101 | LX66 | 0.23 | 0 | 0.42 | 0.13 | 0.22 | C |
| 102 | LX67 | 0.05 | 0.07 | 0.53 | 0.08 | 0.27 | C |
| 103 | LX68 | 0.02 | 0.04 | 0.33 | 0.29 | 0.32 | C |
| 104 | LX69 | 0.02 | 0.01 | 0.55 | 0.29 | 0.13 | C |
| 105 | LX71 | 0.02 | 0 | 0.87 | 0.04 | 0.07 | C |
| 106 | LX74 | 0 | 0.21 | 0.58 | 0 | 0.21 | C |
| 107 | LX75 | 0.04 | 0.18 | 0.41 | 0.05 | 0.32 | C |
| 108 | LX82 | 0.03 | 0.01 | 0.48 | 0.22 | 0.26 | C |
| 109 | LX83 | 0 | 0 | 0.74 | 0.22 | 0.04 | C |
| 110 | LX84 | 0 | 0 | 0.8 | 0.19 | 0.01 | C |
| 111 | LX85 | 0.03 | 0.06 | 0.49 | 0.02 | 0.4 | C |
| 112 | LX86 | 0 | 0 | 0.93 | 0.07 | 0 | C |
| 113 | LX87 | 0 | 0 | 0.95 | 0.05 | 0 | C |
| 114 | LX90 | 0.02 | 0.04 | 0.47 | 0.06 | 0.41 | C |
| 115 | LX92 | 0 | 0 | 0.74 | 0.26 | 0 | C |
| 116 | LX93 | 0 | 0 | 0.66 | 0.3 | 0.04 | C |
| 117 | LX100 | 0 | 0 | 0.53 | 0.29 | 0.18 | C |
| 118 | LX102 | 0 | 0.03 | 0.86 | 0.09 | 0.02 | C |
| 119 | LM33M | 0.03 | 0.05 | 0.61 | 0.07 | 0.24 | C |
| 120 | LX105 | 0.05 | 0 | 0.88 | 0.05 | 0.02 | C |
| 121 | LX106 | 0.01 | 0.1 | 0.81 | 0.05 | 0.03 | C |
| 122 | LX107 | 0.06 | 0 | 0.89 | 0.05 | 0 | C |
| 123 | LX112 | 0.07 | 0.14 | 0.47 | 0.09 | 0.23 | C |
| 124 | LX114 | 0.06 | 0.12 | 0.4 | 0.02 | 0.4 | C |
| 125 | Huangzao4 | 0 | 0 | 0.86 | 0.14 | 0 | C |
| 126 | Longxi53 | 0.04 | 0.04 | 0.41 | 0.13 | 0.38 | C |
| 127 | 706 | 0.08 | 0.05 | 0.71 | 0.11 | 0.05 | C |
| 128 | LX117 | 0.01 | 0.01 | 0.96 | 0.02 | 0 | C |
| 129 | LX118 | 0.03 | 0.1 | 0.72 | 0.06 | 0.09 | C |
| 130 | LX119 | 0 | 0.03 | 0.78 | 0.14 | 0.05 | C |
| 131 | K10 | 0 | 0.09 | 0.47 | 0.35 | 0.09 | C |
| 132 | Chang3 | 0.02 | 0.03 | 0.6 | 0.13 | 0.22 | C |
| 133 | Zhong7490-92 | 0.01 | 0.04 | 0.76 | 0.18 | 0.01 | C |
| 134 | 78599 | 0.03 | 0 | 0.91 | 0.06 | 0 | C |
| 135 | 478 | 0 | 0 | 0.89 | 0 | 0.11 | C |
| 136 | He344 | 0 | 0.01 | 0.75 | 0.18 | 0.06 | C |
| 137 | Longkang11 | 0 | 0 | 1 | 0 | 0 | C |
| 138 | MO17 | 0.04 | 0.17 | 0.56 | 0.03 | 0.2 | C |
| 139 | 4F1 | 0 | 0 | 1 | 0 | 0 | C |
| 140 | 330 | 0 | 0 | 0.9 | 0.1 | 0 | C |
| 141 | 5003 | 0 | 0 | 0.98 | 0.02 | 0 | C |
| 142 | B73 | 0.03 | 0.01 | 0.96 | 0 | 0 | C |
| 143 | LX120 | 0.07 | 0.03 | 0.66 | 0.19 | 0.05 | C |
| 144 | LX121 | 0.02 | 0.02 | 0.87 | 0.07 | 0.02 | C |
| 145 | LX122 | 0 | 0.04 | 0.69 | 0.27 | 0 | C |
| 146 | LX123 | 0.03 | 0 | 0.83 | 0.11 | 0.03 | C |
| 147 | LX124 | 0 | 0 | 0.99 | 0.01 | 0 | C |
| 148 | 06S021 | 0 | 0 | 0.97 | 0 | 0.03 | C |
| 149 | 06S032 | 0 | 0 | 1 | 0 | 0 | C |
| 150 | 06S034 | 0.13 | 0.01 | 0.78 | 0.05 | 0.03 | C |
| 151 | 06S052 | 0 | 0 | 0.53 | 0.01 | 0.46 | C |
| 152 | 06S060 | 0 | 0.01 | 0.84 | 0 | 0.15 | C |
| 153 | 06S068 | 0 | 0 | 0.92 | 0 | 0.08 | C |
| 154 | 06S075 | 0 | 0 | 0.77 | 0.14 | 0.09 | C |
| 155 | 06S095 | 0 | 0.04 | 0.71 | 0.1 | 0.15 | C |
| 156 | R117 | 0.01 | 0 | 0.91 | 0 | 0.08 | C |
| 157 | FLAF | 0.13 | 0.01 | 0.48 | 0.22 | 0.16 | C |
| 158 | YAM | 0.07 | 0.08 | 0.66 | 0.09 | 0.1 | C |
| 159 | LX125 | 0 | 0.05 | 0.81 | 0.14 | 0 | C |
| 160 | Jidan27♂ | 0.01 | 0.01 | 0.49 | 0.04 | 0.45 | C |
| 161 | LX126 | 0 | 0 | 0.59 | 0.01 | 0.4 | C |
| 162 | LX127 | 0 | 0.03 | 0.75 | 0.04 | 0.18 | C |
| 163 | LX128 | 0 | 0.02 | 0.83 | 0.13 | 0.02 | C |
| 164 | LX129 | 0 | 0 | 0.98 | 0.02 | 0 | C |
| 165 | LX130 | 0.01 | 0 | 0.67 | 0.01 | 0.31 | C |
| 166 | LX131 | 0.03 | 0.13 | 0.61 | 0.08 | 0.15 | C |
| 167 | Zheng58 | 0.01 | 0 | 0.87 | 0 | 0.12 | C |
| 168 | Chang7-2 | 0 | 0.01 | 0.8 | 0.14 | 0.05 | C |
| 169 | HY6M | 0.18 | 0 | 0.49 | 0.19 | 0.14 | C |
| 170 | HY6F | 0.04 | 0.03 | 0.77 | 0.06 | 0.1 | C |
| 171 | LX134 | 0.26 | 0 | 0.64 | 0.08 | 0.02 | C |
| 172 | LX140 | 0 | 0 | 0.87 | 0 | 0.13 | C |
| 173 | LX144 | 0.03 | 0.09 | 0.51 | 0.06 | 0.31 | C |
| 174 | Co117-2 | 0.1 | 0.04 | 0.53 | 0.19 | 0.14 | C |
| 175 | Co220 | 0.09 | 0.02 | 0.47 | 0.3 | 0.12 | C |
| 176 | Co228 | 0.15 | 0.03 | 0.4 | 0.3 | 0.12 | C |
| 177 | Co266 | 0.09 | 0.04 | 0.44 | 0.31 | 0.12 | C |
| 178 | Co274 | 0.07 | 0.09 | 0.55 | 0.15 | 0.14 | C |
| 179 | Co285 | 0.07 | 0.02 | 0.51 | 0.08 | 0.32 | C |
| 180 | Co358 | 0.13 | 0.02 | 0.48 | 0.21 | 0.16 | C |
| 181 | Co372 | 0.07 | 0.02 | 0.49 | 0.27 | 0.15 | C |
| 182 | Co373 | 0.1 | 0.06 | 0.47 | 0.28 | 0.09 | C |
| 183 | Co380 | 0.08 | 0.03 | 0.46 | 0.19 | 0.24 | C |
| 184 | LY88F | 0 | 0 | 0.8 | 0.1 | 0.1 | C |
| 185 | LX149 | 0 | 0 | 0.94 | 0.06 | 0 | C |
| 186 | LX150 | 0 | 0 | 0.81 | 0.08 | 0.11 | C |
| 187 | LX152 | 0.02 | 0 | 0.93 | 0 | 0.05 | C |
| 188 | LX153 | 0.06 | 0.02 | 0.71 | 0.09 | 0.12 | C |
| 189 | LX154 | 0.01 | 0 | 0.87 | 0.12 | 0 | C |
| 190 | LX155 | 0 | 0.02 | 0.83 | 0.15 | 0 | C |
| 191 | H127RE | 0.04 | 0.04 | 0.64 | 0.12 | 0.16 | C |
| 192 | LX163 | 0.05 | 0.07 | 0.82 | 0 | 0.06 | C |
| 193 | DY1 | 0 | 0.01 | 0.88 | 0.11 | 0 | C |
| 194 | DY10 | 0.01 | 0.03 | 0.53 | 0 | 0.43 | C |
| 195 | DY21 | 0.07 | 0.12 | 0.44 | 0.03 | 0.34 | C |
| 196 | DY53 | 0.01 | 0 | 0.86 | 0.13 | 0 | C |
| 197 | DY71 | 0.02 | 0.02 | 0.8 | 0.16 | 0 | C |
| 198 | DY97 | 0 | 0.01 | 0.63 | 0 | 0.36 | C |
| 199 | DY99 | 0.03 | 0.03 | 0.5 | 0.22 | 0.22 | C |
| 200 | Dy13-17 | 0.14 | 0.03 | 0.46 | 0.2 | 0.17 | C |
| 201 | LX176 | 0.03 | 0.02 | 0.95 | 0 | 0 | C |
| 202 | LX177 | 0 | 0.06 | 0.9 | 0.04 | 0 | C |
| 203 | LX178 | 0.03 | 0.06 | 0.57 | 0.06 | 0.28 | C |
| 204 | LX181 | 0 | 0.07 | 0.59 | 0.06 | 0.28 | C |
| 205 | LX184 | 0.01 | 0.03 | 0.67 | 0.01 | 0.28 | C |
| 206 | LX185 | 0.04 | 0.22 | 0.48 | 0.04 | 0.22 | C |
| 207 | LX188 | 0.03 | 0.26 | 0.37 | 0.02 | 0.32 | C |
| 208 | LX190 | 0.09 | 0.17 | 0.4 | 0.02 | 0.32 | C |
| 209 | LX193 | 0 | 0.02 | 0.95 | 0.03 | 0 | C |
| 210 | LX195 | 0 | 0.01 | 0.91 | 0.08 | 0 | C |
| 211 | LX196 | 0.07 | 0.01 | 0.77 | 0.03 | 0.12 | C |
| 212 | LX197 | 0 | 0.01 | 0.75 | 0.01 | 0.23 | C |
| 213 | LX198 | 0 | 0.01 | 0.77 | 0.01 | 0.21 | C |
| 214 | LX199 | 0.02 | 0 | 0.76 | 0 | 0.22 | C |
| 215 | LX201 | 0.04 | 0.02 | 0.49 | 0.02 | 0.43 | C |
| 216 | LX202 | 0.05 | 0 | 0.44 | 0.08 | 0.43 | C |
| 217 | LX209 | 0.13 | 0.06 | 0.67 | 0.08 | 0.06 | C |
| 218 | LX210 | 0.13 | 0.13 | 0.54 | 0.06 | 0.14 | C |
| 219 | 698F | 0.04 | 0.04 | 0.68 | 0.01 | 0.23 | C |
| 220 | 820M | 0.13 | 0.14 | 0.37 | 0.05 | 0.31 | C |
| 221 | YA2M | 0.27 | 0.09 | 0.47 | 0.06 | 0.11 | C |
| 222 | LX26 | 0 | 0.03 | 0.17 | 0.69 | 0.11 | D |
| 223 | UH004 | 0 | 0 | 0 | 1 | 0 | D |
| 224 | FLAM | 0 | 0.04 | 0.24 | 0.58 | 0.14 | D |
| 225 | YAF | 0 | 0 | 0 | 0.97 | 0.03 | D |
| 226 | Co374 | 0.21 | 0.03 | 0.2 | 0.45 | 0.11 | D |
| 227 | YA1F | 0 | 0.02 | 0 | 0.94 | 0.04 | D |
| 228 | LX159 | 0.36 | 0 | 0 | 0.64 | 0 | D |
| 229 | LX160 | 0.47 | 0 | 0 | 0.53 | 0 | D |
| 230 | LX161 | 0.21 | 0.1 | 0.06 | 0.52 | 0.11 | D |
| 231 | UH009 | 0 | 0.01 | 0 | 0.93 | 0.06 | D |
| 232 | Ji871 | 0 | 0 | 0.39 | 0.1 | 0.51 | E |
| 233 | LX11 | 0.04 | 0.03 | 0.42 | 0.08 | 0.43 | E |
| 234 | LX16 | 0 | 0.27 | 0.25 | 0.02 | 0.46 | E |
| 235 | LX22 | 0 | 0 | 0.12 | 0.03 | 0.85 | E |
| 236 | LX24 | 0 | 0.22 | 0 | 0 | 0.78 | E |
| 237 | LX31 | 0.03 | 0.03 | 0.41 | 0.04 | 0.49 | E |
| 238 | LX51 | 0.01 | 0 | 0.36 | 0.05 | 0.58 | E |
| 239 | LX54 | 0 | 0 | 0.21 | 0 | 0.79 | E |
| 240 | LX72 | 0.34 | 0.03 | 0.09 | 0 | 0.54 | E |
| 241 | LX73 | 0.05 | 0.26 | 0.25 | 0.07 | 0.37 | E |
| 242 | LX77 | 0.16 | 0.11 | 0.26 | 0.03 | 0.44 | E |
| 243 | LX78 | 0.14 | 0.18 | 0.06 | 0 | 0.62 | E |
| 244 | LX79 | 0.15 | 0.19 | 0.04 | 0 | 0.62 | E |
| 245 | LX80 | 0.06 | 0.11 | 0.21 | 0.01 | 0.61 | E |
| 246 | LX88 | 0.19 | 0.11 | 0.28 | 0 | 0.42 | E |
| 247 | LX89 | 0.03 | 0.02 | 0.34 | 0.02 | 0.59 | E |
| 248 | LX91 | 0 | 0 | 0.09 | 0.11 | 0.8 | E |
| 249 | LX101 | 0.06 | 0.25 | 0.27 | 0.04 | 0.38 | E |
| 250 | LX104 | 0 | 0 | 0.13 | 0.01 | 0.86 | E |
| 251 | LX108 | 0 | 0.1 | 0 | 0 | 0.9 | E |
| 252 | LX109 | 0.02 | 0.17 | 0.24 | 0.02 | 0.55 | E |
| 253 | LX110 | 0.13 | 0.01 | 0.03 | 0.04 | 0.79 | E |
| 254 | LX111 | 0.02 | 0.05 | 0.33 | 0.05 | 0.55 | E |
| 255 | LX116 | 0 | 0.02 | 0.01 | 0 | 0.97 | E |
| 256 | Lv28 | 0 | 0 | 0 | 0 | 1 | E |
| 257 | LX124 | 0.38 | 0.01 | 0.21 | 0 | 0.4 | E |
| 258 | xy335m | 0 | 0.09 | 0.02 | 0 | 0.89 | E |
| 259 | LX133 | 0 | 0.41 | 0.16 | 0.01 | 0.42 | E |
| 260 | LX135 | 0 | 0.33 | 0.09 | 0.01 | 0.57 | E |
| 261 | LX136 | 0 | 0.43 | 0.12 | 0.01 | 0.44 | E |
| 262 | LX138 | 0 | 0.34 | 0.23 | 0.02 | 0.41 | E |
| 263 | LX139 | 0.06 | 0.23 | 0.23 | 0.03 | 0.45 | E |
| 264 | LX141 | 0.02 | 0.08 | 0.37 | 0.06 | 0.47 | E |
| 265 | LX142 | 0 | 0 | 0 | 0 | 1 | E |
| 266 | LX143 | 0 | 0 | 0 | 0 | 1 | E |
| 267 | LX145 | 0 | 0 | 0 | 0.02 | 0.98 | E |
| 268 | LX146 | 0.01 | 0.02 | 0.14 | 0.01 | 0.82 | E |
| 269 | Co371 | 0.07 | 0.09 | 0.28 | 0.17 | 0.39 | E |
| 270 | LX165 | 0.3 | 0.04 | 0.3 | 0.01 | 0.35 | E |
| 271 | LX170 | 0.02 | 0.41 | 0 | 0 | 0.57 | E |
| 272 | DY7 | 0 | 0 | 0 | 0 | 1 | E |
| 273 | DY29 | 0.01 | 0 | 0 | 0.01 | 0.98 | E |
| 274 | DY36 | 0.05 | 0.03 | 0.14 | 0.02 | 0.76 | E |
| 275 | DY49 | 0 | 0.12 | 0.2 | 0 | 0.68 | E |
| 276 | LX173 | 0 | 0.07 | 0.09 | 0.02 | 0.82 | E |
| 277 | LX174 | 0 | 0 | 0 | 0 | 1 | E |
| 278 | LX175 | 0 | 0 | 0.04 | 0 | 0.96 | E |
| 279 | LX179 | 0 | 0.09 | 0.34 | 0.05 | 0.52 | E |
| 280 | LX182 | 0.42 | 0.09 | 0 | 0.02 | 0.47 | E |
| 281 | LX183 | 0.06 | 0.1 | 0.24 | 0.2 | 0.4 | E |
| 282 | LX187 | 0.01 | 0.03 | 0.36 | 0.07 | 0.53 | E |
| 283 | LX191 | 0.04 | 0.23 | 0.27 | 0.04 | 0.42 | E |
| 284 | LX192 | 0.18 | 0.26 | 0.24 | 0.01 | 0.31 | E |
| 285 | LX200 | 0 | 0 | 0.45 | 0.04 | 0.51 | E |
| 286 | LX203 | 0 | 0 | 0 | 0 | 1 | E |
| 287 | LX204 | 0 | 0 | 0 | 0 | 1 | E |
| 288 | LX207 | 0 | 0 | 0 | 0 | 1 | E |
| 289 | LX208 | 0 | 0.07 | 0.18 | 0.02 | 0.73 | E |
| 290 | 252M | 0.01 | 0.06 | 0.21 | 0.01 | 0.71 | E |
| 291 | 335MG | 0 | 0.04 | 0 | 0 | 0.96 | E |
| 292 | 688M | 0 | 0.04 | 0 | 0 | 0.96 | E |
| 293 | XZD276 | 0 | 0.1 | 0 | 0 | 0.9 | E |
| 294 | XZD170 | 0 | 0.08 | 0 | 0 | 0.92 | E |
| 295 | XZD171 | 0.02 | 0.13 | 0.31 | 0.02 | 0.52 | E |
| 296 | YA2F | 0 | 0.33 | 0 | 0 | 0.67 | E |
References
- Fracheboud, Y.; Ribaut, J.M.; Vaigas, M.; Messmer, R.; Stamp, P. Identification of quantitative trait loci for cold tolerance of photosynthesis in maize. J. Exp. Bot. 2002, 376, 1967–1977. [Google Scholar] [CrossRef]
- Shi, Y.; Li, G.H.; Tian, Z.Q.; Wang, Z.Y.; Wang, X.B.; Zhu, Y.G.; Chen, Y.H.; Guo, S.L.; Qi, J.S.; Zhang, X.; et al. Genetic dissection of seed vigour traits in maize (Zea mays L.) under low-temperature conditions. J. Genet. 2016, 95, 1017–1022. [Google Scholar] [CrossRef] [PubMed]
- Han, Q.; Zhu, Q.; Shen, Y.; Lee, M.; Lübberstedt, T.; Zhao, G. QTL Mapping Low-Temperature Germination Ability in the Maize IBM Syn10 DH Population. Plants 2022, 14, 214. [Google Scholar] [CrossRef] [PubMed]
- Goering, R.; Larsen, S.; Tan, J.; Whelan, J.; Makarevitch, I. QTL mapping of seedling tolerance to exposure to low temperature in the maize IBM RIL population. PLoS ONE 2021, 16, e0254437. [Google Scholar] [CrossRef]
- Yi, Q.; Malvar, R.A.; Álvarez-Iglesias, L.; Ordás, B.; Revilla, P. Dissecting the genetics of cold tolerance in a multiparental maize population. Theor. Appl. Genet. 2020, 133, 503–516. [Google Scholar] [CrossRef] [PubMed]
- He, R.Y.; Zheng, J.J.; Chen, Y.; Pan, Z.Y.; Yang, T.; Zhou, Y.; Li, X.F.; Nan, X.; Li, Y.Z.; Cheng, M.J.; et al. QTL-seq and transcriptomic integrative analyses reveal two positively regulated genes that control the low-temperature germination ability of MTP-maize introgression lines. Theor. Appl. Genet. 2023, 136, 116. [Google Scholar] [CrossRef] [PubMed]
- Xu, Q.; Wang, X.; Wang, Y.; Zhang, H.; Zhang, H.; Di, H.; Zhang, L.; Dong, L.; Zeng, X.; Liu, X.; et al. Combined QTL mapping and RNA-Seq pro-filing reveal candidate genes related to low-temperature tolerance in maize. Mol. Breed. 2022, 42, 33. [Google Scholar] [CrossRef] [PubMed]
- Yan, J.; Wu, Y.; Li, W.; Qin, X.; Yue, B. Genetic mapping with testcrossing associations and F2:3 populations reveals the importance of heterosis in chilling tolerance at maize seedling stage. Sci. Rep. 2017, 7, 427–428. [Google Scholar] [CrossRef]
- Revilla, P.; Rodríguez, V.M.; Ordás, A.; Rincent, R.; Charcosset, A.; Giauffret, C. Association mapping for cold tolerance in two large maize inbred panels. BMC Plant Biol. 2016, 16, 127. [Google Scholar] [CrossRef]
- Huang, J.; Zhang, J.; Li, W.; Hu, W.; Duan, L.; Feng, Y.; Qiu, F.Z.; Yue, B. Genome-wide association analysis of ten chilling tolerance indices at the germination and seedling stages in maize. J. Integr. Plant Biol. 2013, 55, 10. [Google Scholar] [CrossRef]
- Strigens, A.; Grieder, C.; Haussmann, B.I.G.; Melchinger, A.E. Genetic variation among inbred lines and testcrosses of maize for early growth parameters and their relationship to final dry matter yield. Crop Sci. 2012, 52, 1084. [Google Scholar] [CrossRef]
- Li, X.H.; Wang, G.H.; Fu, J.J.; Li, L.; Jia, G.Y.; Ren, L.S.; Lubberstedt, T.; Wang, G.Y.; Wang, J.H.; Gu, R.L. QTL mapping in three connected populations reveals a set of consensus genomic regions for low temperature germination ability in Zea mays L. Front. Plant Sci. 2018, 9, 65–72. [Google Scholar] [CrossRef]
- Hu, G.H.; Li, Z.; Lu, Y.C.; Li, C.X.; Gong, S.C.; Yan, S.Q.; Li, G.L.; Wang, M.Q.; Ren, H.L.; Guan, H.T.; et al. Genome-wide association study identified multiple genetic loci on chilling resistance during germination in maize. Sci. Rep. 2017, 7, 10840. [Google Scholar] [CrossRef] [PubMed]
- Jin, Y.; Zhang, Z.; Xi, Y.; Yang, Z.; Xiao, Z.; Guan, S.; Qu, J.; Wang, P.; Zhao, R. Identification and Functional Verification of Cold Tolerance Genes in Spring Maize Seedlings Based on a Genome-Wide Association Study and Quantitative Trait Locus Mapping. Front. Plant Sci. 2021, 12, 776972. [Google Scholar] [CrossRef]
- Zhang, H.; Zhang, J.; Xu, Q.; Wang, D.; Di, H.; Huang, J.; Yang, X.; Wang, Z.; Zhang, L.; Dong, L.; et al. Identification of candidate tolerance genes to low-temperature during maize germination by GWAS and RNA-seqapproaches. BMC Plant Biol. 2020, 20, 333. [Google Scholar] [CrossRef] [PubMed]
- Zhang, Y.; Liu, P.; Wang, C.; Zhang, N.; Zhu, Y.; Zou, C.; Yuan, G.; Yang, C.; Gao, S.; Pan, G.; et al. Genome-wide association study uncovers new genetic loci and candidate genes underlying seed chilling-germination in maize. PeerJ 2021, 9, e11707. [Google Scholar] [CrossRef]
- Yi, Q.; Álvarez-Iglesias, L.; Malvar, R.A.; Romay, M.C.; Revilla, P.A. worldwide maize panel revealed new genetic variation for cold tolerance. Theor. Appl. Genet. 2021, 4, 1083–1094. [Google Scholar] [CrossRef]
- Zhou, X.; Muhammad, I.; Lan, H.; Xia, C. Recent Advances in the Analysis of Cold Tolerance in Maize. Front. Plant Sci. 2022, 13, 866034. [Google Scholar] [CrossRef]
- R Core Team. R: A language and environment for statistical computing. Computing 2011, 1, 12–21. [Google Scholar]
- Kabacoff, R.I. R in Action: Data Analysis and Graphics with R; Simon and Schuster: New York, NY, USA, 2015. [Google Scholar]
- Murray, M.; Thompson, W.F. Rapid isolation of high molecular weight plant DNA. Nucleic Acids Res. 1980, 8, 4321–4326. [Google Scholar] [CrossRef]
- Frichot, E.F.O. Lea: An R package for landscape and ecological association studies. Methods Ecol. Evol. 2015, 6, 925–929. [Google Scholar] [CrossRef]
- Bradbury, P.J.; Zhang, Z.; Kroon, D.E.; Casstevens, T.M.; Buckler, E. TASSEL: Software for association mapping of complex traits in diverse samples. Bioinformatics 2007, 23, 2633–2635. [Google Scholar] [CrossRef]
- Gaut, B.S.; Long, A.D. The lowdown on linkage disequilibrium. Plant Cell 2003, 15, 1502–1506. [Google Scholar] [CrossRef] [PubMed]
- Benjamini, Y.; Hochberg, Y. Controlling the false discovery rate: A practical and powerful approach to multiple testing. J. R. Stat. Soc. 1995, 57, 289–300. [Google Scholar] [CrossRef]
- Wang, Q.; Tang, J.; Han, B.; Huang, X. Advances in genome-wide association studies of complex traits in rice. Theor. Appl. Genet. 2020, 3, 1415–1425. [Google Scholar] [CrossRef]
- Alseekh, S.; Kostova, D.; Bulut, M.; Fernie, A.R. Genome-wide association studies: Assessing trait characteristics in model and crop plants. Cell Mol. Life Sci. 2021, 8, 5743–5754. [Google Scholar] [CrossRef] [PubMed]
- Saini, D.K.; Chopra, Y.; Singh, J.; Sandhu, K.S.; Kumar, A.; Bazzer, S.; Srivastava, P. Comprehensive evaluation of mapping complex traits in wheat using genome-wide association studies. Mol. Breed. 2021, 42, 1. [Google Scholar] [CrossRef] [PubMed]
- Xiao, Y.; Liu, H.; Wu, L.; Warburton, M.; Yan, J. Genome-wide Association Studies in Maize: Praise and Stargaze. Mol. Plant 2017, 10, 359–374. [Google Scholar] [CrossRef] [PubMed]
- Weng, J.F.; Xie, C.X.; Hao, Z.F.; Wang, J.J.; Liu, C.L.; Li, M.S.; Zhang, D.G.; Bai, L.; Zhang, S.H.; Li, X.H. Genome-wide association study identifies candidate genes that affect plant height in Chinese elite maize (Zea mays L.) inbred lines. PLoS ONE 2011, 6, e29229. [Google Scholar] [CrossRef]
- Huang, X.H.; Zhao, Y.; Wei, X.H.; Li, C.Y.; Wang, A.H.; Zhao, Q.; Li, W.J.; Guo, Y.L.; Deng, L.W.; Zhu, C.R.; et al. Genome-wide association study of flowering time and grain yield traits in a worldwide collection of rice germplasm. Nat. Genet. 2012, 44, 32–39. [Google Scholar] [CrossRef]
- Xiao, Q.; Bai, X.; Zhang, C.; He, Y. Advanced high-throughput plant phenotyping techniques for genome-wide association studies: A review. J. Adv. Res. 2021, 35, 215–230. [Google Scholar] [CrossRef]
- Gupta, P.K.; Kulwal, P.L.; Jaiswal, V. Association mapping in plants in the post-GWAS genomics era. Adv. Genet. 2019, 104, 75–154. [Google Scholar]
- Wang, B.; Lin, Z.; Li, X.; Zhao, Y.; Zhao, B.; Wu, G.; Ma, X.; Wang, H.; Xie, Y.; Li, Q.; et al. Genome-wide selection and genetic improvement during modern maize breeding. Nat. Genet. 2020, 52, 565–571. [Google Scholar] [CrossRef]
- Li, H.; Peng, Z.; Yang, X.; Wang, W.; Fu, J.; Wang, J.; Han, Y.; Chai, Y.; Guo, T.; Yang, N.; et al. Genome-wide association study dissects the genetic architecture of oil biosynthesis in maize kernels. Nat. Genet. 2013, 45, 43. [Google Scholar] [CrossRef]
- Jia, G.; Huang, X.; Zhi, H.; Zhao, Y.; Zhao, Q.; Li, W.J.; Chai, Y.; Yang, L.F.; Liu, K.Y.; Lu, H.Y.; et al. A haplotype map of genomic variations and genome-wide association studies of agronomic traits in foxtail millet (Setaria italica). Nat. Genet. 2013, 45, 957–961. [Google Scholar] [CrossRef]
- Li, Y.X.; Li, C.; Bradbury, P.J.; Liu, X.; Lu, F.; Romay, C.M.; Glaubitz, J.C.; Wu, X.; Peng, B.; Shi, Y.; et al. Identification of genetic variants associated with maize flowering time using an extremely large multi-genetic background population. Plant J. 2016, 86, 391–402. [Google Scholar] [CrossRef]
- Yang, N.; Lu, Y.; Yang, X.; Huang, J.; Zhou, Y.; Ali, F.; Wen, W.; Liu, J.; Li, J.; Yan, J. Genome wide association studies using a new nonparametric model reveal the genetic architecture of 17 agronomic traits in an enlarged maize association panel. PLoS Genet. 2014, 10, e1004573. [Google Scholar] [CrossRef] [PubMed]
- Samayoa, L.F.; Cao, A.; Santiago, R.; Malvar, R.A.; Butrón, A. Genome-wide association analysis for fumonisin content in maize kernels. BMC Plant Biol. 2019, 19, 166. [Google Scholar] [CrossRef] [PubMed]
- Wang, D.; He, Y.; Nie, L.; Guo, S.; Tu, L.; Guo, X.; Wang, A.; Liu, P.; Zhu, Y.; Wu, X.; et al. Integrated IBD Analysis, GWAS Analysis and Transcriptome Analysis to Identify the Candidate Genes for White Spot Disease in Maize. Int. J. Mol. Sci. 2023, 24, 10005. [Google Scholar] [CrossRef]
- Xiang, N.; Hu, J.G.; Wen, T.X.; Brennan, M.A.; Brennan, C.S.; Guo, X.B. Effects of temperature stress on the accumulation of ascorbic acid and folates in sweet corn (Zea mays L.) seedlings. J. Sci. Food Agric. 2020, 100, 1694–1701. [Google Scholar] [CrossRef] [PubMed]
- Ritonga, F.N.; Chen, S. Physiological and Molecular Mechanism Involved in Cold Stress Tolerance in Plants. Plants 2020, 9, 560. [Google Scholar] [CrossRef] [PubMed]
- Farhangi-Abriz, S.; Torabian, S. Antioxidant enzyme and osmotic adjustment changes in bean seedlings as affected by biochar under salt stress. Ecotoxicol. Environ. Saf. 2017, 137, 64–70. [Google Scholar] [CrossRef] [PubMed]
- Nadarajah, K.K. ROS Homeostasis in Abiotic Stress Tolerance in Plants. Int. J. Mol. Sci. 2020, 21, 5208. [Google Scholar] [CrossRef] [PubMed]
- Qin, P.; Zhang, G.; Hu, B.; Wu, J.; Chen, W.; Ren, Z.; Liu, Y.; Xie, J.; Yuan, H.; Tu, B.; et al. Leaf-derived ABA regulates rice seed development via a transporter-mediated and temperature-sensitive mechanism. Sci. Adv. 2021, 7, eabc8873. [Google Scholar] [CrossRef] [PubMed]
- Ma, Y. emical Responses’ and QTL/Genes’ Identification. Plants 2022, 11, 2082. [Google Scholar] [CrossRef] [PubMed]
- Costa Silva Neta, I.; Vilela de Resende Von Pinho, É.; de Abreu, V.M.; Rezende Vilela, D.; Santos, M.C.; Oliveira Dos Santos, H.; Diniz Cabral Ferreira, R.A.; Garcia Von Pinho, R.; Coelho de Castro Vasconcellos, R. Gene expression and genetic control to cold tolerance during maize seed germination. BMC Plant Biol. 2020, 20, 188. [Google Scholar] [CrossRef]
- Liu, M.; Tan, X.; Yang, Y.; Liu, P.; Zhang, X.; Zhang, Y.; Wang, L.; Hu, Y.; Ma, L.; Li, Z.; et al. Analysis of the genetic architecture of maize kernel size traits by combined linkage and association mapping. Plant Biotechnol. J. 2020, 18, 207–221. [Google Scholar] [CrossRef]
- Peraza, O.G.; Leipner, J.; Reimer, R.; Nguyen, H.T.; Fracheboud, Y. Temperature at night affects the genetic control of acclimation to cold in maize seedlings. Maydica 2012, 56, 367–377. [Google Scholar]
- Jompuk, C. Mapping of quantitative trait loci associated with chilling tolerance in maize (Zea mays L.) seedlings grown under field conditions. J. Exp. Bot. 2005, 56, 1153–1163. [Google Scholar] [CrossRef]
- Allam, M.; Revilla, P.; Djemel, A.; Tracy, W.F.; Ordás, B. Identification of QTLs involved in cold tolerance in sweetfield corn. Euphytica 2016, 208, 353–365. [Google Scholar] [CrossRef]
- Zhou, Y.; Lu, Q.; Ma, J.; Wang, D.; Li, X.; Di, H.; Zhang, L.; Hu, X.; Dong, L.; Liu, X.; et al. Using a high density bin map to analyze quantitative trait locis of germination ability of maize at low temperatures. Front. Plant Sci. 2022, 22, 978941. [Google Scholar] [CrossRef] [PubMed]
- He, R.Y.; Yang, T.; Zheng, J.J.; Pan, Z.Y.; Chen, Y.; Zhou, Y.; Li, X.F.; Li, Y.Z.; Iqbal, M.Z.; Yang, C.Y.; et al. QTL Mapping and a Transcriptome Integrative Analysis Uncover the Candidate Genes That Control the Cold Tolerance of Maize Introgression Lines at the Seedling Stage. Int. J. Mol. Sci. 2023, 30, 2629. [Google Scholar] [CrossRef] [PubMed]
- Presterl, T.; Ouzunova, M.; Schmidt, W.; Möller, E.M.; Röber, F.K.; Knaak, C.; Ernst, K.; Westhoff, P.; Geiger, H.H. Quantitative trait loci for early plant vigour of maize grown in chilly environments. Theor. Appl. Genet. 2007, 114, 1059–1070. [Google Scholar] [CrossRef] [PubMed]


| Traits | Source of Variation | Degrees of Freedom | Sum of Squares | Mean Squares | F-Value | p-Value |
|---|---|---|---|---|---|---|
| error | 565 | 72,604 | 129 | - | - | |
| Relative germination index | Genotype | 292 | 191,859 | 657 | 87.98 | <2 × 10⁻¹⁰ *** |
| Environment | 1 | 4243 | 4243 | 568.15 | <2 × 10⁻¹⁰ *** | |
| Block | 1 | 4 | 4 | 0.52 | 0.47 | |
| Genotype × environment | 281 | 195,408 | 695 | 93.12 | <2 × 10⁻¹⁰ *** | |
| Error | 574 | 4287 | 7 | - | - | |
| Relative germination rate | Genotype | 293 | 113,856 | 389 | 1.01 | 0.47 |
| Environment | 1 | 12,858 | 12,858 | 33.33 | <2 × 10⁻⁸ *** | |
| Error | 285 | 109,946 | 386 | - | - |
| Traits | Number | Min. | Max. | Mean | Median | SD | Kurtosis | Skewness |
|---|---|---|---|---|---|---|---|---|
| Relative germination rate | 293 | 28.00 | 100.00 | 66.62 | 67.00 | 14.10 | −0.39 | −0.25 |
| Relative germination index in 2017 | 291 | 20.69 | 100.00 | 86.80 | 92.68 | 16.65 | 2.78 | −1.66 |
| Relative germination index in 2018 | 284 | 4.08 | 100.00 | 83.15 | 89.70 | 20.02 | 0.85 | −1.17 |
| Traits | Source of Variation | Degrees of Freedom | Sum of Squares | Mean Squares | F-Value | p-Value |
|---|---|---|---|---|---|---|
| Relative germination rate | Genotype | 287 | 478,817 | 1668 | 12.98 | <2 × 10⁻¹⁰ *** |
| Environment | 1 | 70,893 | 70,893 | 551.68 | <2 × 10⁻¹⁰ *** | |
| Block | 1 | 2 | 2 | 0.012 | 0.91 | |
| Genotype × environment | 280 | 98,028 | 350 | 2.72 | <2 × 10⁻¹⁰ *** | |
| Error | 565 | 72,604 | 129 | - | - |
| Traits | Number | Min | Max | Mean | Median | SD | Kurtosis | Skewness |
|---|---|---|---|---|---|---|---|---|
| Relative germination index in 2018 | 281 | 0.00 | 100.00 | 79.51 | 76.00 | 25.25 | 0.09 | −0.10 |
| Relative germination index in 2019 | 288 | 0.00 | 100.00 | 84.60 | 92.00 | 20.09 | 4.68 | −2.12 |
| Traits | Correlation Coefficient | ||||
|---|---|---|---|---|---|
| Indoor Relative Germination Rate (2018) | Indoor Relative Germination Rate (2019) | Field Relative Germination Rate | Field Relative Germination Index (2017) | Field Relative Germination Index (2018) | |
| Indoor relative germination rate (2018) | 1 | 0.67 *** | 0.18 *** | 0.07 | 0.02 |
| Indoor relative germination rate (2019) | 0.67 *** | 1 | 0.20 *** | 0.02 | 0.11 |
| Field-relative germination rate | 0.18 *** | 0.20 *** | 1 | 0.50 *** | 0.49 *** |
| Field-relative germination index (2017) | 0.07 | 0.02 | 0.50 *** | 1 | −0.06 |
| Field-relative germination index (2018) | 0.02 | 0.11 | 0.49 *** | −0.06 | 1 |
| Chr. | SNP | Minor Allele Frequency (MAF) | |||||
|---|---|---|---|---|---|---|---|
| >0.05 | Percent (%) | >0.1 | Percent (%) | >0.2 | Percent (%) | ||
| 1 | 3687 | 3599 | 98 | 1383 | 38 | 115 | 3 |
| 2 | 3217 | 3159 | 98 | 1174 | 36 | 89 | 3 |
| 3 | 2896 | 2833 | 98 | 930 | 32 | 91 | 3 |
| 4 | 2882 | 2802 | 97 | 947 | 33 | 95 | 3 |
| 5 | 2384 | 2334 | 98 | 838 | 35 | 94 | 4 |
| 6 | 1898 | 1868 | 98 | 715 | 38 | 90 | 5 |
| 7 | 1577 | 1532 | 97 | 580 | 37 | 57 | 4 |
| 8 | 1848 | 1793 | 97 | 635 | 34 | 62 | 3 |
| 9 | 2294 | 2264 | 99 | 854 | 37 | 111 | 5 |
| 10 | 1359 | 1313 | 97 | 529 | 39 | 36 | 3 |
| Total | 24,042 | 23,497 | 98 | 8585 | 36 | 840 | 3 |
| Chr. | LD Decay (r2 < 0.2) | LD Decay (r2 < 0.1) | Min | Max | Mean | Median | SD | Kurtosis | Skewness |
|---|---|---|---|---|---|---|---|---|---|
| 1 | 120 | 410 | 0.000 | 1.000 | 0.062 | 0.008 | 0.152 | 13.871 | 3.605 |
| 2 | 320 | 1000 | 0.000 | 1.000 | 0.088 | 0.009 | 0.201 | 6.198 | 2.69 |
| 3 | 130 | 620 | 0.000 | 1.000 | 0.067 | 0.007 | 0.169 | 10.411 | 3.264 |
| 4 | 100 | 500 | 0.000 | 1.000 | 0.061 | 0.008 | 0.152 | 13.999 | 3.648 |
| 5 | 270 | 990 | 0.000 | 1.000 | 0.082 | 0.008 | 0.187 | 7.887 | 2.903 |
| 6 | 85 | 350 | 0.000 | 1.000 | 0.064 | 0.008 | 0.16 | 11.833 | 3.435 |
| 7 | 90 | 440 | 0.000 | 1.000 | 0.052 | 0.008 | 0.141 | 17.75 | 4.069 |
| 8 | 220 | 820 | 0.000 | 1.000 | 0.068 | 0.008 | 0.169 | 11.335 | 3.378 |
| 9 | 340 | 1990 | 0.000 | 1.000 | 0.122 | 0.011 | 0.24 | 2.903 | 2.069 |
| 10 | 70 | 340 | 0.000 | 1.000 | 0.07 | 0.01 | 0.165 | 11.326 | 3.351 |
| Traits | Marker | Chr. | Physical Position | −Lg (p) | Contribution (%) |
|---|---|---|---|---|---|
| Field-relative germination rate | marker.14070 | 5 | 2,205,723 | 6.86 | 9.68 |
| Relative germination index (2018) | marker.17002 | 6 | 64,236,775 | 4.56 | 6.55 |
| Relative germination index (2018) | marker.17003 | 6 | 64,236,781 | 4.56 | 6.55 |
| Relative germination index (2018) | marker.17009 | 6 | 64,298,566 | 4.15 | 5.86 |
| Relative germination index (2018) | marker.17105 | 6 | 72,142,751 | 5.69 | 8.46 |
| Relative germination index (2018) | marker.19874 | 7 | 180,326,388 | 5.01 | 7.30 |
| Field-relative germination rate | marker.536 | 10 | 63,529,769 | 4.06 | 5.03 |
| Traits | Marker | Chr. | Physical Position | −Lg (p) | Contribution (%) |
|---|---|---|---|---|---|
| Relative germination rate (2019) | marker.1723 | 1 | 31,809,859 | 5.01 | 6.54 |
| Relative germination rate (2018) | marker.1724 | 1 | 31,809,902 | 4.07 | 5.46 |
| Relative germination rate (2019) | marker.1726 | 1 | 31,897,277 | 4.18 | 5.31 |
| Relative germination rate (2019) | marker.1729 | 1 | 31,954,983 | 4.95 | 6.41 |
| Relative germination rate (2018) | marker.8339 | 3 | 6,292,001 | 4.16 | 5.61 |
| Relative germination rate (2019) | marker.8339 | 3 | 6,292,001 | 5.42 | 7.12 |
| Relative germination rate (2018) | marker.8340 | 3 | 6,292,053 | 5.01 | 6.87 |
| Relative germination rate (2019) | marker.8340 | 3 | 6,292,053 | 4.87 | 6.34 |
| Relative germination rate (2019) | marker.12816 | 4 | 140,575,088 | 4.54 | 5.87 |
| Relative germination rate (2018) | marker.14070 | 5 | 2,205,723 | 5.17 | 6.26 |
| Relative germination rate (2018) | marker.190 | 10 | 22,696,941 | 4.13 | 5.56 |
| Relative germination rate (2019) | marker.753 | 10 | 90,874,322 | 4.75 | 6.17 |
| Relative germination rate (2019) | marker.14070 | 5 | 2,205,723 | 4.00 | 4.84 |
| Relative germination rate (2018) | marker.843 | 10 | 100,622,715 | 4.52 | 6.10 |
Disclaimer/Publisher’s Note: The statements, opinions and data contained in all publications are solely those of the individual author(s) and contributor(s) and not of MDPI and/or the editor(s). MDPI and/or the editor(s) disclaim responsibility for any injury to people or property resulting from any ideas, methods, instructions or products referred to in the content. |
© 2023 by the authors. Licensee MDPI, Basel, Switzerland. This article is an open access article distributed under the terms and conditions of the Creative Commons Attribution (CC BY) license (https://creativecommons.org/licenses/by/4.0/).
Share and Cite
Yu, T.; Zhang, J.; Cao, J.; Li, S.; Cai, Q.; Li, X.; Li, S.; Li, Y.; He, C.; Ma, X. Identification of Multiple Genetic Loci Related to Low-Temperature Tolerance during Germination in Maize (Zea maize L.) through a Genome-Wide Association Study. Curr. Issues Mol. Biol. 2023, 45, 9634-9655. https://doi.org/10.3390/cimb45120602
Yu T, Zhang J, Cao J, Li S, Cai Q, Li X, Li S, Li Y, He C, Ma X. Identification of Multiple Genetic Loci Related to Low-Temperature Tolerance during Germination in Maize (Zea maize L.) through a Genome-Wide Association Study. Current Issues in Molecular Biology. 2023; 45(12):9634-9655. https://doi.org/10.3390/cimb45120602
Chicago/Turabian StyleYu, Tao, Jianguo Zhang, Jingsheng Cao, Shujun Li, Quan Cai, Xin Li, Sinan Li, Yunlong Li, Changan He, and Xuena Ma. 2023. "Identification of Multiple Genetic Loci Related to Low-Temperature Tolerance during Germination in Maize (Zea maize L.) through a Genome-Wide Association Study" Current Issues in Molecular Biology 45, no. 12: 9634-9655. https://doi.org/10.3390/cimb45120602
APA StyleYu, T., Zhang, J., Cao, J., Li, S., Cai, Q., Li, X., Li, S., Li, Y., He, C., & Ma, X. (2023). Identification of Multiple Genetic Loci Related to Low-Temperature Tolerance during Germination in Maize (Zea maize L.) through a Genome-Wide Association Study. Current Issues in Molecular Biology, 45(12), 9634-9655. https://doi.org/10.3390/cimb45120602