Article

Comparative Transcriptome Analyses Provide New Insights into the Evolution of Divergent Thermal Resistance in Two Eel Gobies

1
National Engineering Laboratory of Marine Germplasm Resources Exploration and Utilization, College of Marine Sciences and Technology, Zhejiang Ocean University, Zhoushan 316022, China
2
National Engineering Research Center for Facilitated Marine Aquaculture, Zhejiang Ocean University, Zhoushan 316022, China
*
Author to whom correspondence should be addressed.
Curr. Issues Mol. Biol. 2024, 46(1), 153-170; https://doi.org/10.3390/cimb46010012
Submission received: 16 November 2023 / Revised: 16 December 2023 / Accepted: 21 December 2023 / Published: 25 December 2023
(This article belongs to the Section Biochemistry, Molecular and Cellular Biology)

Abstract

:
Adaptation to thermal conditions in tidal mudflats always involves tolerating frequent fluctuations and often extreme environmental temperatures. Regulation of gene expression plays a fundamental role in the evolution of these thermal adaptations. To identify the key gene regulatory networks associated with the thermal adaptation, we investigated the capability of cold tolerance, as well as the transcriptomic changes under cold stress in two mudflat inhabitants (Odontamblyopus lacepedii and O. rebecca) with contrasting latitude affinity. Our results revealed a remarkable divergent capacity of cold tolerance (CTmin: 0.61 °C vs. 9.57 °C) between the two gobies. Analysis of transcriptomic changes under cold stress unveiled 193 differentially expressed genes exhibiting similar expression profiles across all tissues and species, including several classic metabolic and circadian rhythm molecules such as ACOD and CIART that may represent the core cold response machinery in eel gobies. Meanwhile, some genes show a unique expression spectrum in the more cold-tolerant O. lacepedii suggesting their roles in the enhanced cold tolerance and hence the extreme thermal adaptations. In addition, a weighted gene co-expression network analysis (WGCNA) revealed a subset of metabolic hub genes including MYH11 and LIPT2 showing distinct down-regulation in O. lacepedii when exposed to cold stress which highlights the role of reduced energy consumption in the enhanced cold tolerance of eel gobies. These findings not only provide new insights into how mudflat teleosts could cope with cold stress and their potential evolutionary strategies for adapting to their thermal environment, but also have important implications for sound management and conservation of their fishery resources in a scenario of global climate warming in the marine realm.

1. Introduction

Thermal adaptation is a widespread phenomenon in taxa that are exposed to variable and dynamic environments. While some taxa may acclimate through phenotypic plasticity, or just modify their geographic distribution or behavior to avoid thermal stress [1,2], many others may evolve adaptive responses to local thermal regimes over generations via natural selection [3]. Such evolutionary adaptation to local thermal conditions has been verified across a wide variety of taxa [4,5,6,7,8], and is expected to play an important role in the survival of taxa with limited dispersals [3]. However, to date, the genetic basis of how various taxa acclimate these thermal stresses and adapt to environmental changes remains poorly understood. This is particularly true when it comes to the organisms in the marine realm, where analogous genetic information is yet to reach the same level as their terrestrial counterparts [9].
Mudflats are one of the most variable and dynamic habitats in the marine realm [10]. Taxa inhabiting this challenging environment may experience severe selection pressure from both abiotic and biotic conditions [11,12,13]. Particularly, mudflat species are constantly exposed to a range of environmental thermal stressors, including great variation in temperature from both temporal and spatial fluctuations [14,15]. As a consequence of this long-term selection, pronounced phenotypic plasticity and evolutionary adaptation may evolve [16], and thus provide a model system to investigate the genetic basis of adaptation to environmental thermal stresses. However, until now, both the prevalence and the exact molecular mechanisms underlying such a pattern of thermal adaptation remain largely unknown.
Fortunately, remarkable progress in molecular techniques such as RNA-seq provides the opportunity to investigate the transcriptional response to thermal stress and further identify molecular mechanisms and biological pathways involved in these thermal adaptations. The RNA-seq holds prospects for research of thermal adaptations, because acclimation and adaptation to thermal stress usually involve functionally tuning of a diverse variety of molecules, cell types, and organs to respond to thermal challenges [17,18]. During these processes, modulation of gene expression, the primary mechanism through which information encoded in the genome is converted into physiological phenotypes, is always involved [19]. Thus, identification of the key gene regulatory networks associated with thermal resistance would provide valuable information about the molecular mechanisms underlying the thermal adaptation [20]. A frequently used approach is to compare patterns of differentiation in gene expression between two closely related species with divergent thermal tolerance under the same thermal challenge [21,22]. In such a scenario, genes that affect the fitness of species under thermal challenge may also likely exhibit differential expression regulation between thermally tolerant and susceptible taxa [23]. Therefore, comparative studies of gene expression profiles among species with divergent thermal tolerance offer an opportunity to gain important insights into the mechanistic linkages between gene expression, biochemical pathways, and physiological function that underpin acclimation and adaptation to environmental stresses.
Here we assessed the gene expression divergence and thermal tolerance variation in two closely related mudflat inhabitants, Odontamblyopus lacepedii and O. rebecca, with contrasting latitude affinity, to investigate how gene expression is differentially regulated to enable thermal adaptation in tidal mudflat ectotherms. Both species are important components of the genus Odontamblyopus (Gobiidae: Amblyopinae) which are usually found in deep burrows of tidal mudflats, muddy bottoms of estuaries, as well as substrates from the adjacent shallow waters along the coast of China [24]. Though long considered as closely related sister species, divergent ecological preference has been recorded for the two species, with O. lacepedii endemic mostly to the North of the China Sea (primally from Liaoning to Zhejiang coastal waters) and O. rebecca primarily to the South China Sea (mainly from Zhejiang to Haiphong coastal waters), leaving a narrow contact zone located between them around the Taiwan strait regions (Figure 1) [24,25]. Such variation in latitude affinity may suggest divergent thermal tolerance and climate adaptation in these two eel gobies. Our previous analyses based on the whole genome re-sequencing also lent good support for their divergent thermal adaptation by revealing substantial signatures of selection on the DNA sequence level [25]. Despite these efforts, critical information is still lacking concerning exactly what level of thermal resistance diverges between each other, and how gene expression regulation is involved to underpin the divergent phenotype of thermal tolerance which potentially exists between the two taxa. The outcome of the research will not only provide new insights into how teleosts could cope with thermal stress, and their potential evolutionary strategies for adapting to their thermal environment, but also has good implications in sound management and conservation of their fishery resources in a scenario of global climate warming in the marine realm.

2. Materials and Methods

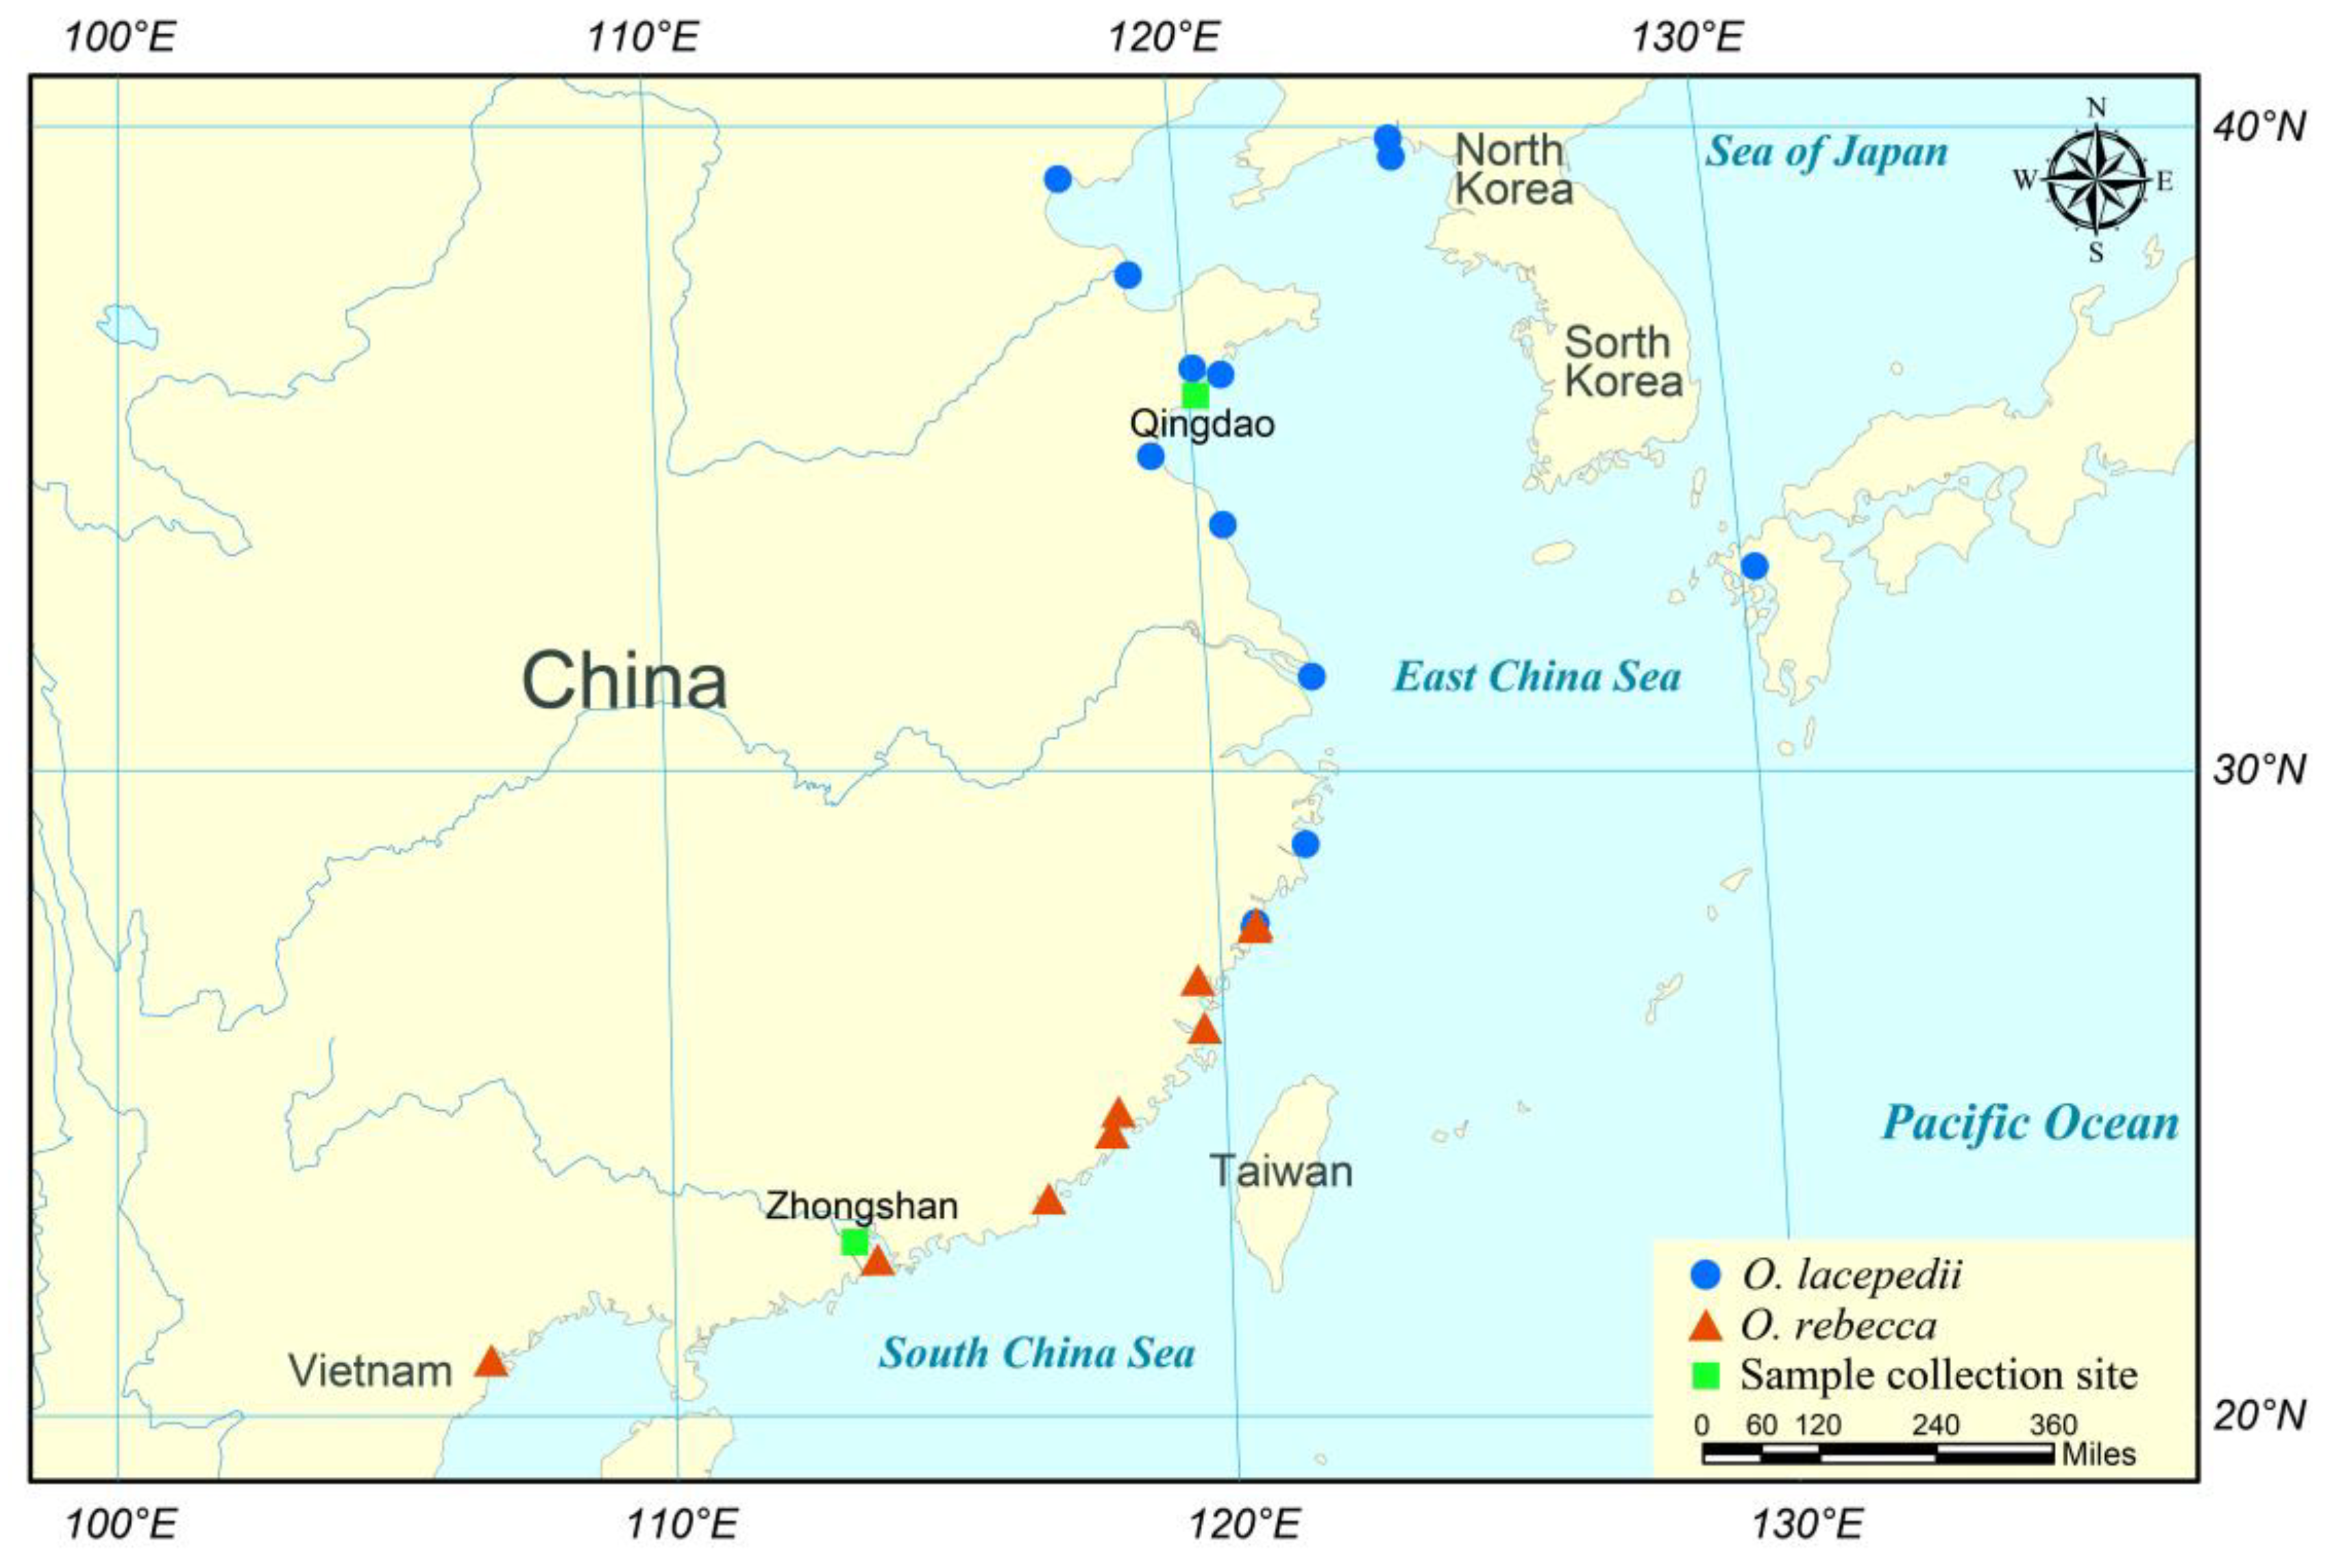
2.1. Sample Collection

Samples of O. lacepedii and O. rebecca were, respectively, collected from coastal waters of the north Yellow Sea in Qingdao of Shandong Province (120°19′ E, 36°16′ N), and the South China Sea in Zhongshan of Guangdong Province (113°36′ E, 22°30′ N) (Figure 1) using the ground cages in October 2022. For each species, a total of 100 individuals were collected and then immediately transported to the laboratory alive in plastic bags containing plentiful water and oxygen (one-third of water, and two-thirds of pure oxygen). After sample arrival, they were maintained at 23 °C in a recirculating system of 50 L aquaria filled with aerated seawater. An acclimation temperature of 23 °C was selected because it is probably appropriate for both species, considering that it falls into a cope of normal temperatures fluctuation (3.0–26.7 °C and 16.9–29.9 °C) (Table 1) in natural habitat for both species, and fish assemblage or spawning event occur when this ambient water temperature arrives (e.g., O. rebecca assembles in Zhongshan coastal waters when the temperature is 24.7 °C [28] and O. lacepedii spawns in Tianjin coastal water when the temperature is 21.5–25.5 °C [29]). The eel gobies were fed with small live shrimp Penaeus vannamei twice a day and acclimated for two weeks before experiments to allow the fish to recover from the adverse effects of transportation. After the acclimation, the fishes were starved for 24 h to eliminate the adverse impact of digestive activity on the experiment [30,31] before the assessment of thermal tolerance variation, as well as the gene expression divergence. All animal handling in the experiments as well as tissue sampling procedures afterward conform to all relevant ethical regulations provided by the Institutional Animal Care and Use Committee of Zhejiang Ocean University.

2.2. Determination of Cold Tolerance Capacity in the Two Eel Gobies

A parameter of critical thermal minimum (CTmin) was used to compare the cold tolerance capacity between the two species of eel gobies. Here, CTmin was defined as the arithmetic mean of the collective thermal points at which the endpoint is reached according to Currie (1998) [32], which is commonly used as a proxy for cold tolerance in fish [33,34]. For the assessment of CTmin in each species, three groups of randomly selected individuals, with ten individuals for each group, were removed from the acclimation aquaria and introduced into three new testing aquaria. Water quality variables in the CTmin testing chamber were matched to those of the acclimation aquaria before the introduction of fish. Test water was continually mixed and aerated during trials by bubbling air through air stones. The water temperature in each testing aquaria was regulated by a Blue-M constant flow portable cooling coil during CTmin trials. During the experiment, water temperatures were decreased by activating the cooling element of one or more circulating thermoregulators. Water temperature was decreased at a constant rate of 0.3 °C min−1 during CTmin trials, which follow the CTM criterion proposed by Becker & Genoway (1979) [35]. Individuals were observed continuously until they reached the end-point, which is defined as the loss of equilibrium, evidenced by the inability to maintain dorsoventral orientation for at least 1 min [32]. The temperature at which each fish reached its end-point was recorded and used to calculate the CTmin and its standard deviation with the formula C T m i n = s u m T L O E n / n , where T L O E n represents the temperature at which each individual reaches their end-point [36].

2.3. Transcriptomic Response to Cold Stress in the Two Eel Gobies

2.3.1. Cold Stress Experiments and Tissue Dissection

Another batch of 60 fish individuals, with 30 individuals for each species, were randomly selected and used for the cold stress experiments. For each species, individuals were randomly divided into three groups with 10 individuals for each group. One group was used as control, which was maintained at a constant acclimation temperature of 23 °C. The other two groups were used as cold stress groups, which were maintained at 15 °C and 11 °C, respectively. The temperatures chosen for the cold stress experiments were based on our results of the CTmin assessment described above. To induce cold stress, groups of fish individuals were introduced into the challenging aquaria as already depicted. A cooling element of circulating thermoregulators was activated to decrease the water temperatures at a rate of 5 °C/h until the temperature reached the preset cold stress level, and then maintained constantly for 48 h during the experiment. No fish died during the cold stress. After the cold stress, three individuals in each group were randomly selected as replicates. The fish were then anesthetized using 80 mg/L concentration of tricaine methanesulfonate (M222), and the brain, gills, and liver tissues from each individual were rapidly removed after anesthesia, and immediately snap-frozen in liquid nitrogen until use.

2.3.2. RNA Isolation, Library Preparation and Sequencing

Total RNA was isolated from each tissue using the standard TRIzol method (Ambion/Invitrogen, Waltham, MA, USA) [37]. The quality and concentration of the isolated RNA were qualified using 1.5% agarose gel electrophoresis and Agilent 2100 bioanalyzer (Agilent Technologies, Santa Clara, CA, USA). The isolated RNA was then used to construct the RNA-seq libraries. In total, fifty-four RNA-seq libraries (three tissues with three replicates per species at each temperature) were constructed using the NEBNext®Ultra™ RNA Library Prep Kit for Illumina® (NEB, Ipswich, MA, USA) following the manufacturer’s instructions. Libraries were then sequenced on an Illumina NovaSeq 6000 platform (Illumina, San Diego, CA, USA) at Beijing Novogene company (Novogene, Beijing, China).

2.3.3. Reads Mapping and Gene Expression Comparison

After quality control of the raw sequencing data using Trimmomatic (v. 0.36) [38] to remove the adaptors and low-quality reads, clean reads were aligned to our previously sequenced reference genome of O. lacepedii (GenBank: GCA_032888595.1) using HISAT2 (v. 2.0.5) [39] with default parameters. The fragments per kilobase of exon model per million mapped fragments (FPKM) values were calculated using featureCounts (v. 1.5.0-p3) [40] and custom Perl scripts to estimate gene expression levels. Differentially expressed transcripts between each pair of the samples were identified using the DESeq2 package [41], and differentially expressed genes (DEGs) were defined by a threshold of |log2(Foldchange)| ≥ 1 and P.adjust ≤ 0.05 [42]. In addition, to investigate the dynamic changes in gene expression across temperatures and species, the calculated DEGs were further extracted and clustered according to their dynamic expression profiles across all the samples with the parameter “cluster_rows=T” in the “pheatmap” package in the R software (v 4.3.1) [43]. In this package, the optimal number of clusters was determined based on the Bayesian information criterion (BIC) [44]. The Euclidean correlation dissimilarity matrix was used to perform the Hierarchical clustering of genes based on the complete linkage method. Heat maps depicting profiles of gene expression across temperatures and species were also plotted. To enable a straightforward and simplified illustration of the dynamic gene expression profiles, average expression values of the three replicates at each temperature for each species were applied to plot gene expression alterations for each cluster of genes. The identified DEGs were also used for GO and KEGG enrichment analysis via the R package clusterProfiler (v. 3.8.1) [45]. Significantly over-represented GO terms and KEGG pathways were identified with a p value ≤ 0.05.

2.4. Identification of Cold Responsive Modules in the Two Eel Gobies

A standard two-step procedure was applied to explore the cold-responsive modules and hub genes possibly associated with the cold tolerance in eel gobies according to Li (2023) [46]. Firstly, a weighted gene co-expression network was constructed to identify the cold-responsive modules using the R package WGCNA (v. 1.68) [47] following the package tutorials. To this end, all genes with the fragments per kilobase of exon model per million mapped fragments (FPKM) values less than 0.5 in more than 90% of the samples were removed to avoid noise from lowly expressed genes. The expression of the resultant 24,013 and 23,185 genes was then normalized by applying the varianceStabilizingTransformation function from the R package DESeq2 (v. 1.42.0) [41]. The adjacency matrix was estimated using a soft thresholding power of 5, which was recommended by command ‘sft$powerEstimate’ in the WGCNA package according to our data (the package will select the optimal soft thresholding power after balancing the scale independence and mean connectivity of the WGCNA by achieving fine mean connectivity while meeting a minimum scale-free topology fit index of 0.85 required by WGCNA analysis (Figure S1) [48] to ensure a scale-free network, according to Wang’s criteria [49]). The topological overlap matrix was calculated with minModuleSize set to 350, and cut-off heights were set to 0.99. A gene dendrogram was then used to identify modules using the cutreeDynamic function. Gene modules corresponding to the branch cut-off of the gene tree were labeled in different colors. The overrepresentation of tissue-specific DEGs between the cold stress and the control group was then calculated for each module by a hypergeometric test to identify the cold-responsive modules (CRMs). Secondly, the hub genes in each module were identified by characterizing the intramodular connectivity (Kwithin), which represents a gene’s connection strength to other genes within the module, and the top 5% of genes with the highest Kwithin were defined as hub genes. The hub genes and their corresponding networks were visualized using Cytoscape (v. 3.9.1) [50].

3. Results

3.1. Variation of Cold Tolerance between the Two Eel Gobies

The two eel gobies exhibited different responses to cold stresses when exposed to the same chilling regime. The O. lacepedii reached the loss of equilibrium at 0.61 ± 1.23 °C, which is significantly lower than the O. rebecca, at 9.57 ± 1.19 °C (t-test, p value = 1.24 × 10⁻²⁵) (Table 1).

3.2. Statistics of Transcriptome Sequences

A total of 367.79 Gb of raw RNA-seq reads were generated from three tissues of the brain, gills, and liver in O. lacepedii and O. rebecca exposed to different cold stresses using transcriptome sequencing strategy. After filtering the low quality data, the resultant clean reads were summarized in Table S1. A total of 30,818 protein-coding transcripts were obtained after mapping the clean reads to the reference genome of O. lacepedii. The mapping rates ranged from 77.73% to 85.50% (Table S1). The gene expression profile was thus calculated from the read counts of each successfully mapped gene and revealed a high correlation coefficient (>0.898) (Table S2) of gene expression and fine reproducibility among the biological replicates. All these 30,818 protein-coding transcripts were then included in subsequent analysis.

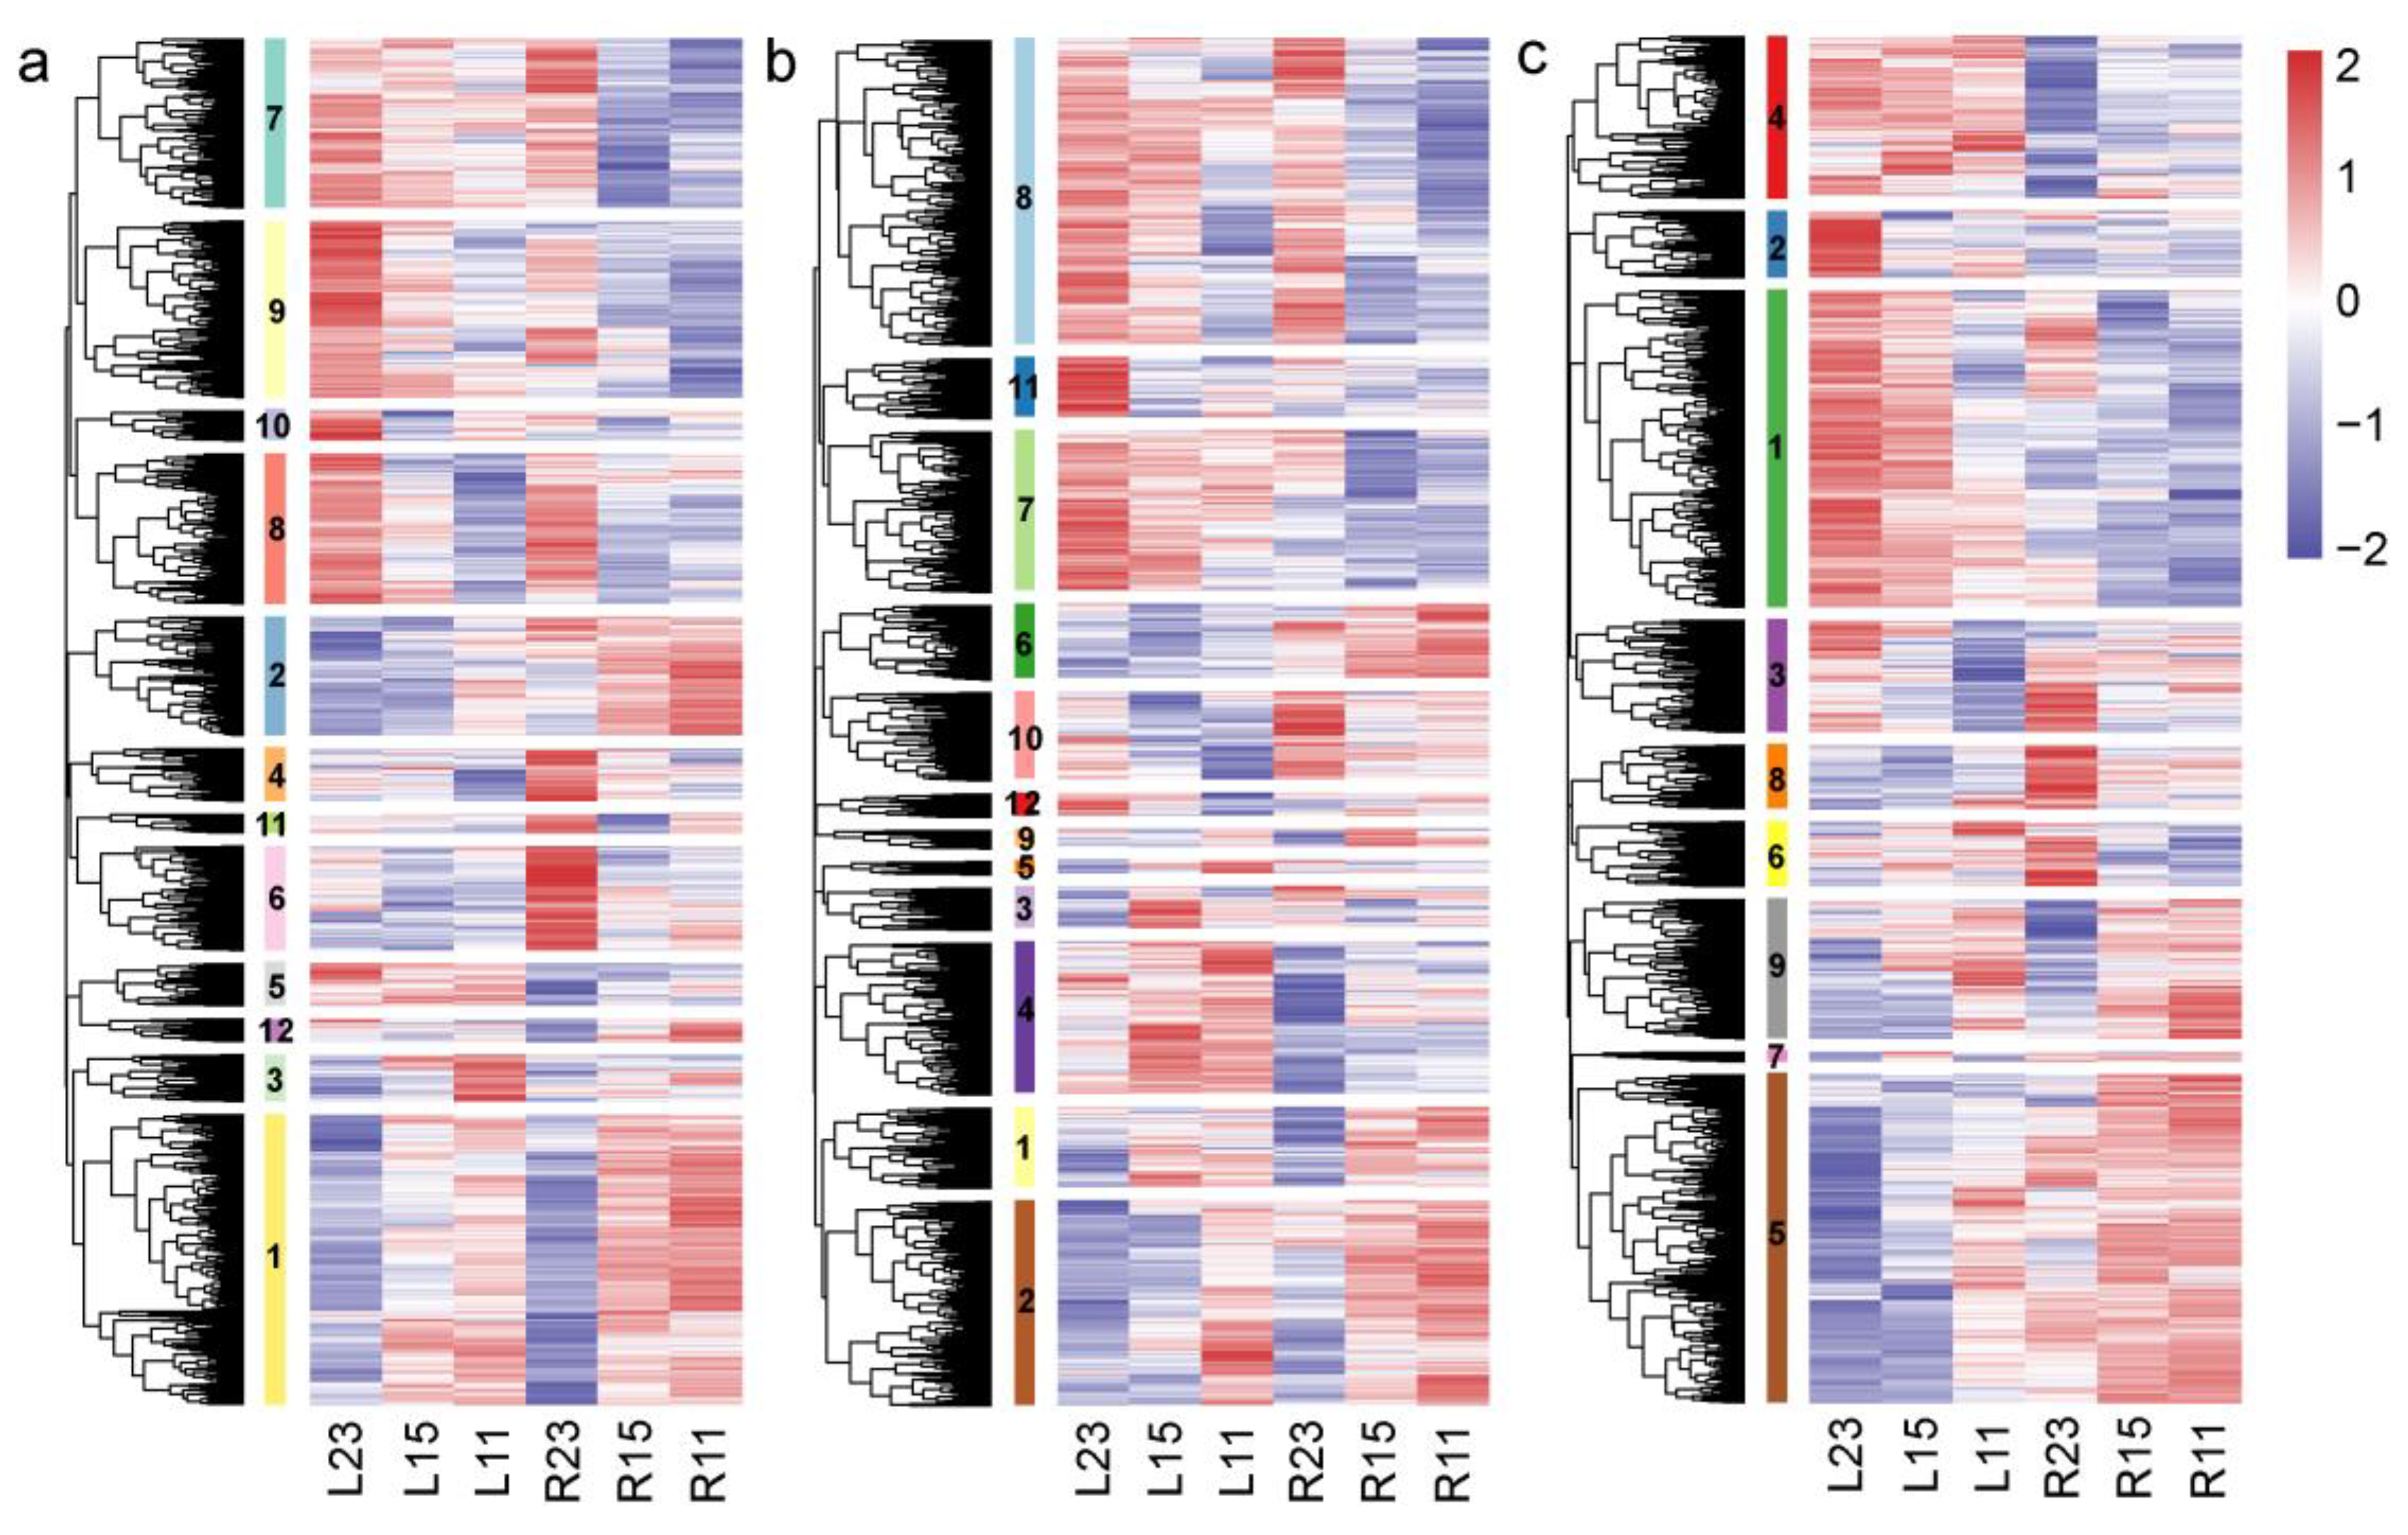
3.3. Transcriptomic Response to Cold Stress in Two Eel Gobies

Analyses of the transcriptional changes in the brain, gills, and liver of both species exposed to cold stresses revealed a total of 8853 and 7893 cold-responsive DEGs in O. lacepedii and O. rebecca, respectively. Functional enrichment (GO) analysis revealed that the identified DEGs from the two eel gobies under cold stress were primarily enriched in multiple biological processes, such as nutrient metabolism, oxidation-reduction, cellular response to stimulus, circadian rhythm, DNA repair, covalent chromatin modification, apoptosis, immune response processes, cellular processes, protein folding, membrane organization, RNA processing, and energy metabolic processes (Tables S3–S14). The transcriptional changes in response to the cold stresses varied substantially across the temperatures, tissues, and species. When the effect of challenging temperatures was considered, more DEGs were up or down-regulated under rigid cold stress of 11 °C than the more moderate one of 15 °C in all three tissues examined in both species (Figure 2). Whereas, when the effect of species was partitioned, O. lacepedii usually had a lower transcriptomic response than their sister species of O. rebecca at moderate cold stress of 15 °C but climbed to almost the same level when challenged at more rigid cold stress of 11 °C (Figure 2). The liver seems to be the main responding organ in O. lacepedii since generally more DEGs were up or down-regulated in the liver under cold stress than the other two tissues (Figure 2), but gills seem to be the main target of cold response in O. rebecca for a much higher number of DEGs were activated in gills than the other two (Figure 2). Nonetheless, 193 common DEGs were also observed across all three tissues of the two species under cold stresses according to the Venn diagram constructed for illustrating the gene expression profiles across tissues (Figure S2, Table S15), which was primarily enriched in biological processes of carbohydrate biosynthesis (e.g., MGAT2, NANS, and ISYNA1), lipid metabolism (e.g., PIGN, SC5D, ACOD, SDR42E1, and PLCG1), and circadian rhythm process (e.g., CIART, CIPC, and NFIL3) (Table 2).

3.4. Distinct DEGs in the Two Eel Gobies under Cold Stresses

To better investigate the inter-specific distinct DEGs that are possibly related to the divergent cold tolerance capacity between the two eel gobies, a hierarchical clustering of genes based on the Euclidean correlation dissimilarity matrix was performed and the results revealed that multiple clusters exhibited distinct expression trends and responses to cold stress in three tissues between the two species. A total of 4943 DEGs were identified between the cold stress and control groups in the brain tissue of the two species. They were clustered into 12 groups (Figure 3a) based on the model-based clustering analysis implemented in the R package/mclust (Supplementary Table S16), among which, six clusters exhibited distinct expression trends and divergent responses to cold stress between the two species (clusters 3, 4, 5, 7, 11, and 12) (Figure 4a). The GO enrichment for DEGs in all six clusters revealed significant enrichment in biological processes associated with nutrient metabolism and energy production (GO:0019752; GO:0006082; GO:0043436; GO:0016051; GO:0005975; GO:0006520; GO:0006090; GO:0006096), DNA repair processes (GO:0006281; GO:0006974; GO:0006757; GO:0046031), and cellular component biogenesis (GO:0044085; GO:0030029; GO:0030036; GO:0071840) (Table S17). Similarly, in the gills, a total of 6863 DEGs detected under cold stress compared to the control groups in two species were clustered into 12 groups based on their expression patterns (Figure 3b). Among these clusters, seven displayed distinct expression trends between the two species (clusters 3, 5, 6, 7, 9, 11, and 12) (Figure 4b). Genes in this category were significantly enriched in nutrient metabolism and energy production (GO:0006508; GO:0006471; GO:0055114; GO:0009101), immune response (GO:0002376; GO:0006955), apoptosis processes (GO:0010941; GO:0042981; GO:0043067; GO:0006915; GO:0008219; GO:0012501), and DNA replication (GO:0006270; GO:0006261; GO:0006260), as well as in cell cycle process (GO:0022402; GO:0000278; GO:1903047) (Table S18). In the meantime, a total of 6881 DEGs were identified between cold stress and control groups in the liver tissue of the two species. They were clustered into nine groups based on their expression profiles (Figure 3c), among which, six clusters exhibited distinct expression trends and responses to cold stress between the two species (clusters 2, 3, 4, 6, 7, and 8) (Figure 4c). Genes in this category included several biological processes associated with nutrient metabolism and energy production (GO:0055114; GO:0005975; GO:0006082; GO:0043436 GO:0006508; GO:0030203; GO:0019752; GO:0010557); immune response (GO:0002376; GO:0006955) and DNA repair processes (GO:0006281; GO:0006974) (Table S19).

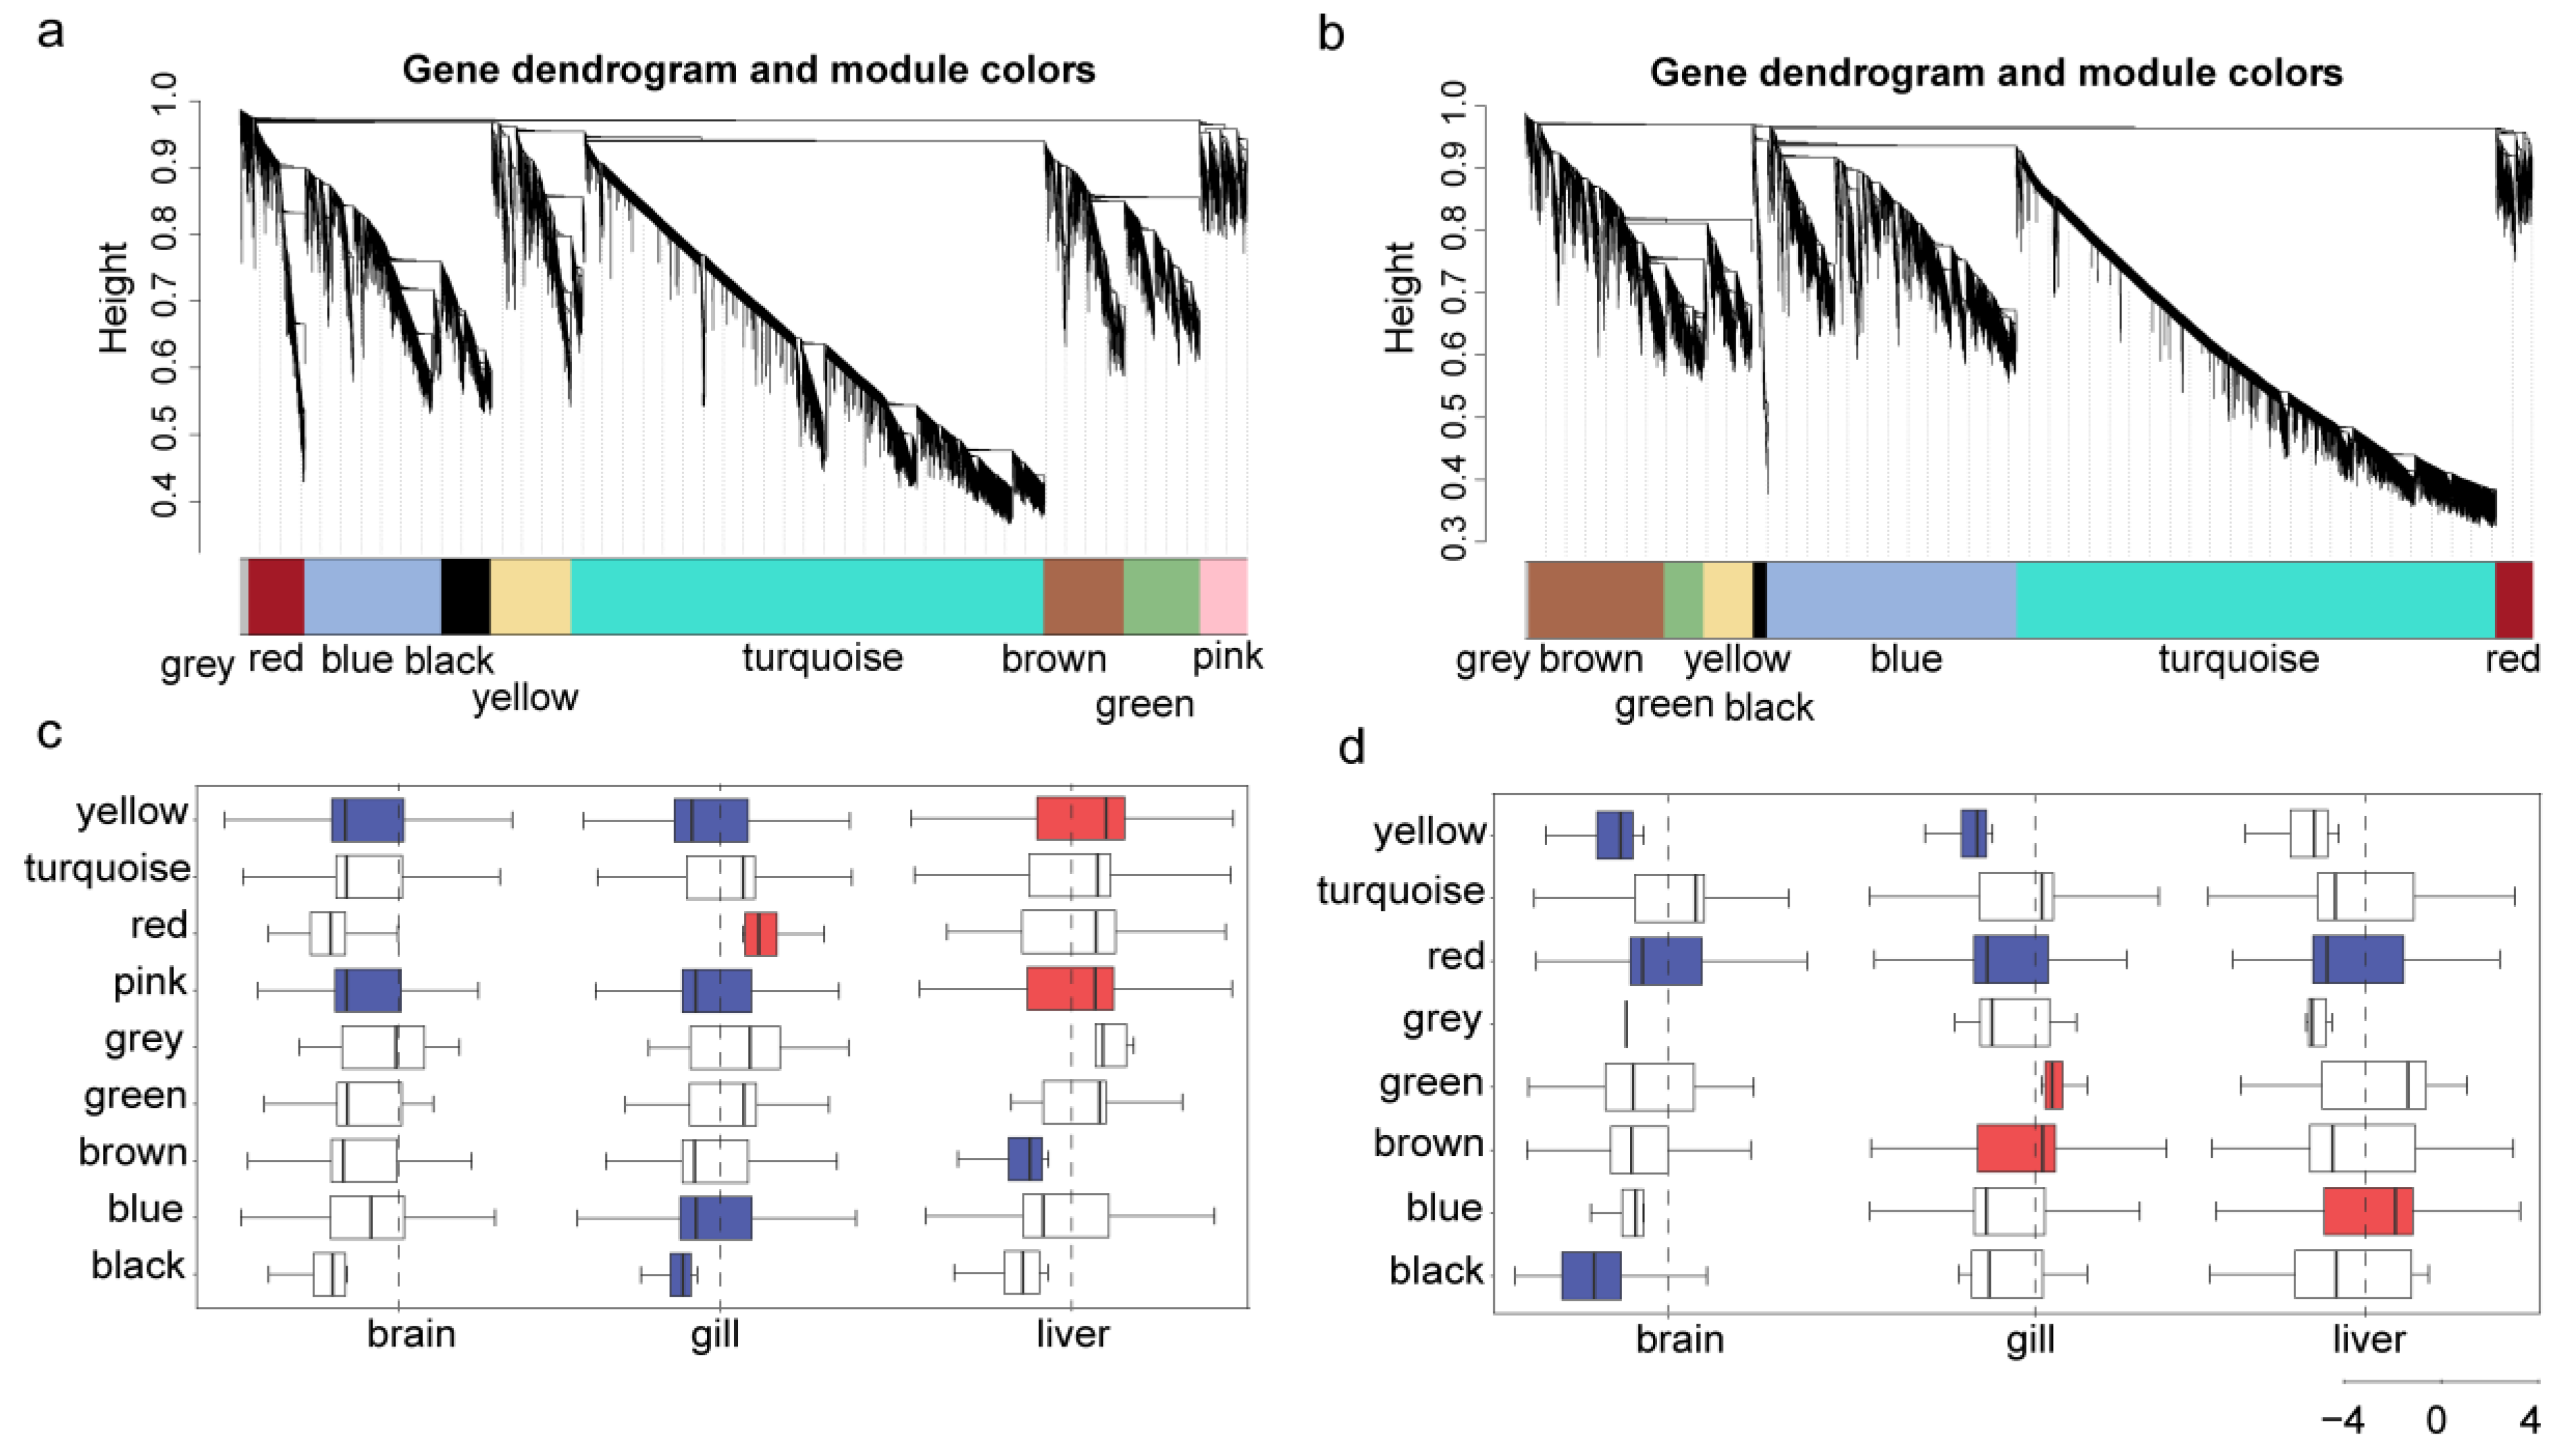
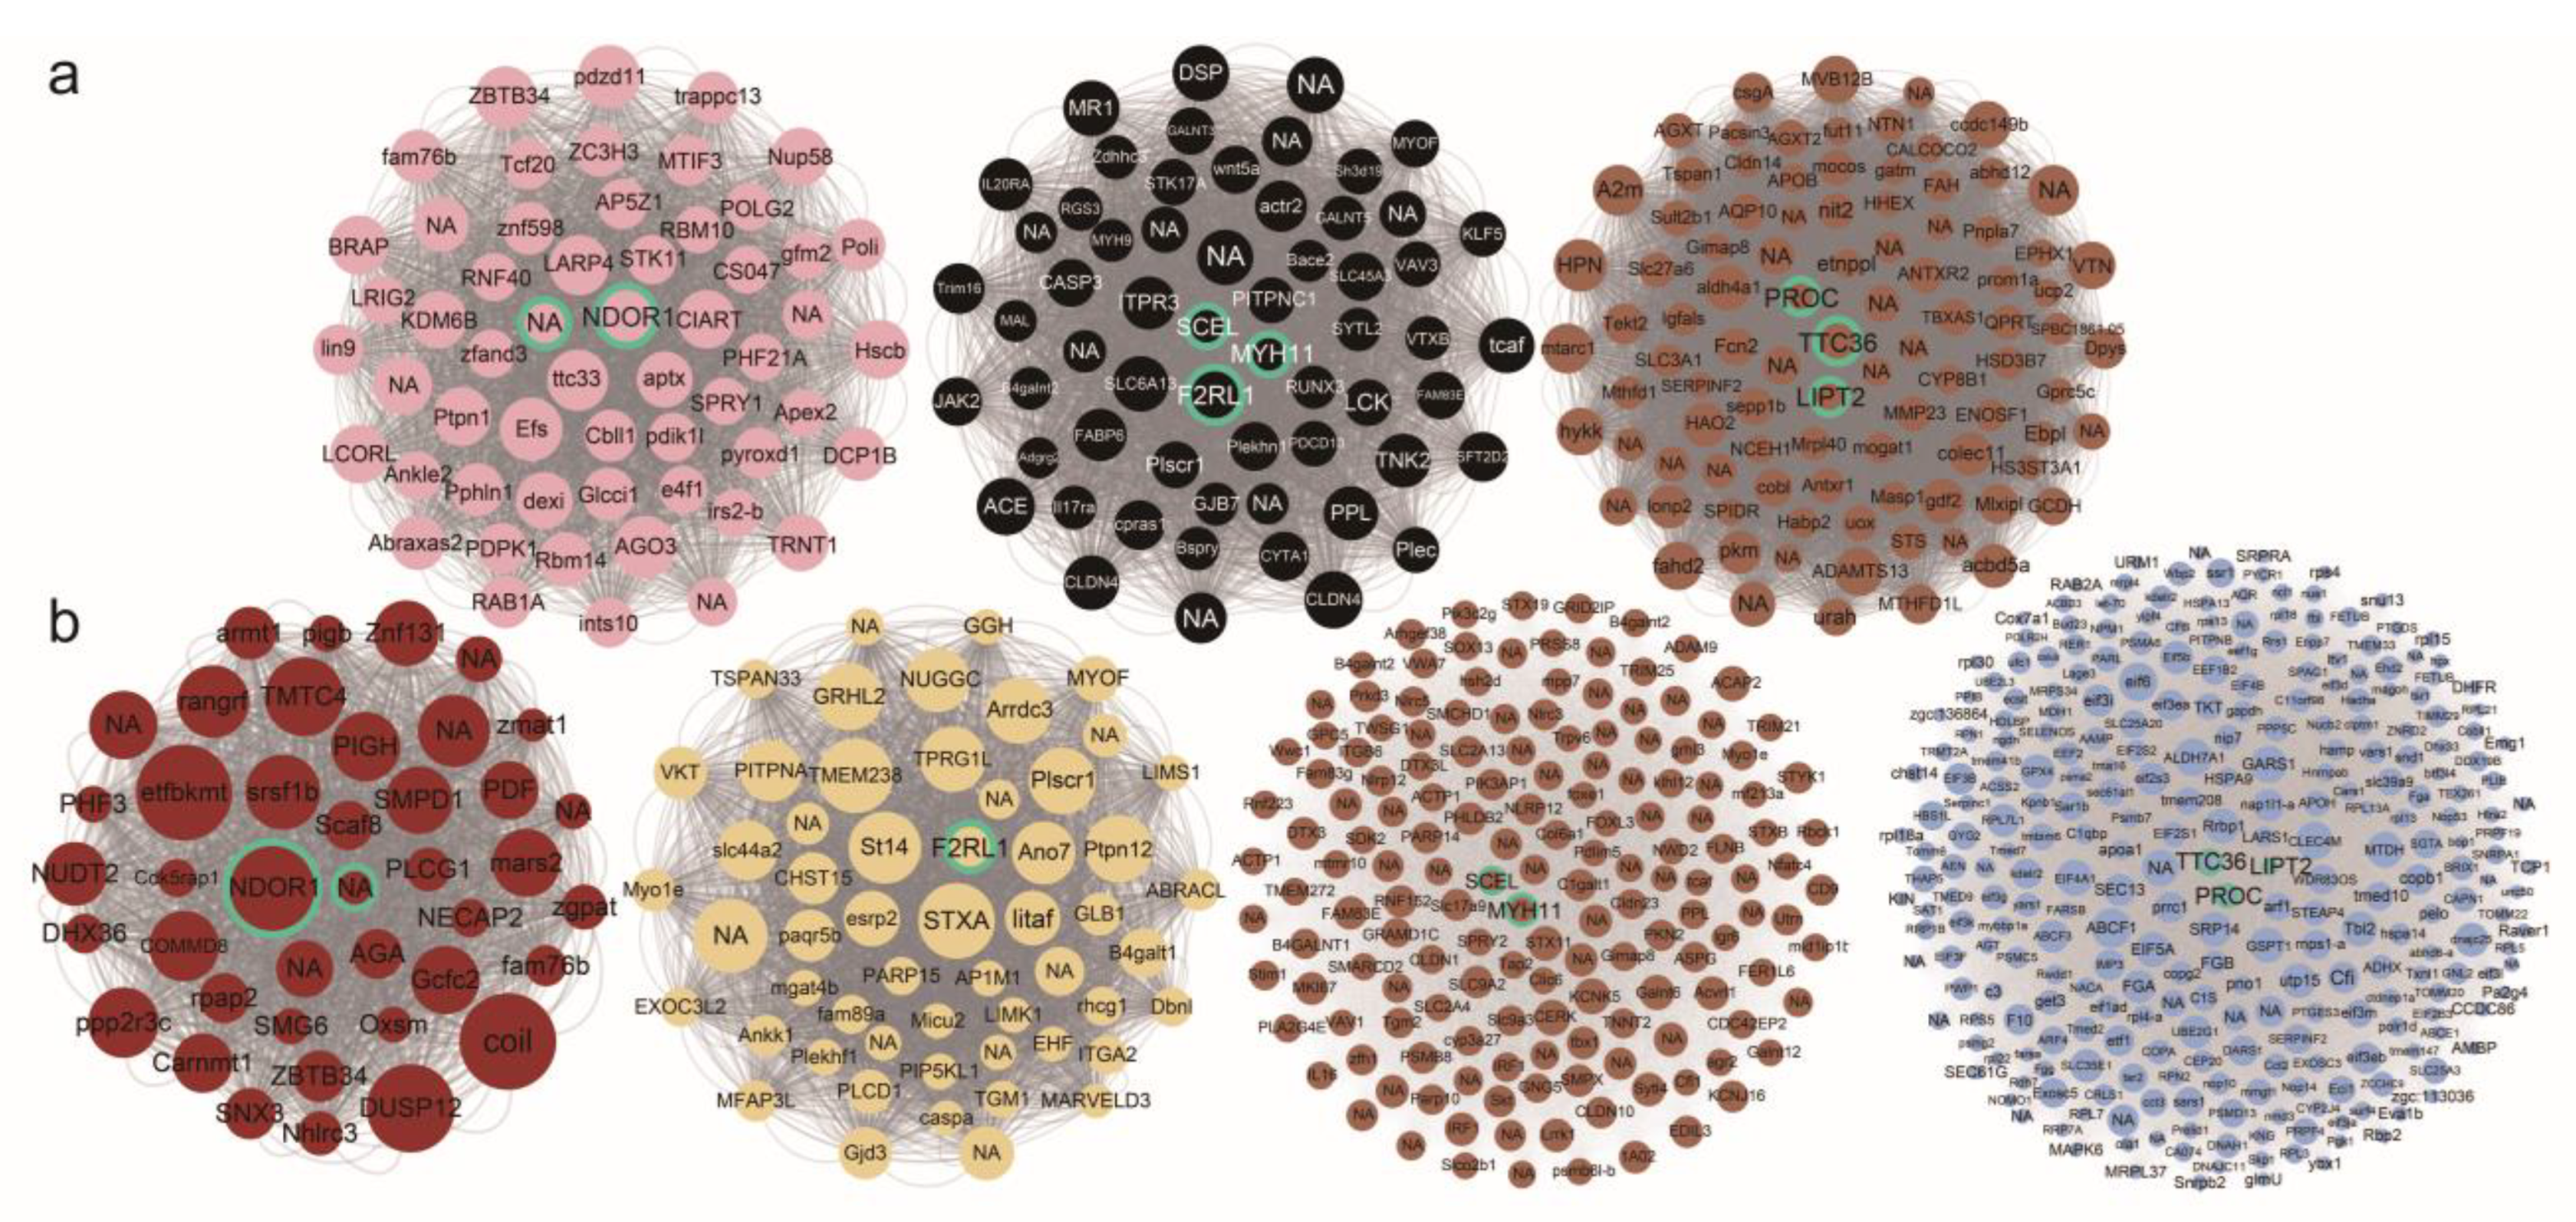
3.5. Cold Responsive Modules and Hub Genes Associated with Cold Tolerance

A total of 24,013 and 23,185 genes with the fragments per kilobase of exon model per million mapped fragments (FPKM) values ≥ 0.5 in more than 10% of the samples in O. lacepedii, and O. rebecca were selected for weighted gene co-expression network construction to identify the cold-responsive modules, respectively. The results showed that a total of nine modules with module sizes ranging from 220 (grey) to 11,290 (Figure 5a), and 8 modules with sizes ranging from 100 (grey) to 11,059 (Figure 5b) were assigned in O. lacepedii, and O. rebecca. Target modules associated with cold stress were further identified according to the hypergeometric test between DEGs and each module. The results revealed that six cold-responsive modules (CRMs) (p value < 0.05) were identified in both O. lacepedii and O. rebecca, according to the overrepresentation analysis. Among these, two, five, and three modules were identified as significantly correlated with cold stress in the brain, gills, and liver tissues in O. lacepedii (Figure 5c, Table S20), and three, four, and two modules were observed to significantly correlated with cold stress in the brain, gills, and liver tissues in O. rebecca (Figure 5d, Table S21).
A further exploration of the gene connectivity using co-expression network analysis revealed a total of 150, 437, and 245 hub genes in the CRMs of the brain, gills, and liver tissue of O. lacepedii, respectively. Similarly in O. rebecca, 114, 296, and 326 hub genes were identified, respectively, in the CRMs of the corresponding tissues. These 1049 genes were highly connected to other genes in the corresponding modules. However, most of these cold-responsive hub genes are not shared between the two eel gobies of O. lacepedii and O. rebecca in all three tissues of the brain (98.46%), gills (92.68%), and liver (95.04%). Even in the 81 hub genes that were shared between these two sister species, eight of them involving those associated with energy production (LIPT2, NDOR1), immunity response (F2RL1), and lipid metabolism (MYH11) still exhibited interspecific distinct expression trend and divergent responses to cold stress. (Figure 6).

4. Discussion

4.1. Species Divergency in Capacity of Cold Tolerance

Using the CTmin value as an indicator, the cold tolerance experiments revealed a much lower CTmin in O. lacepedii than O. rebecca, suggesting the northern cool-adapted species was more cold-tolerant than the southern warm-adapted one. This result is consistent with what could be expected from the ecological distribution of the two eel gobies along the coast of China. Such discrepancy in cold tolerance between the two species may be attributed to the contrasting latitude climate they experience, for the thermal tolerance of many organisms is usually proportional to the magnitude of variation in environmental temperature they combat [51]. Indeed, O. lacepedii in Qingdao coastal waters experiences northern temperate climates with the yearly average minimum–maximum surface water temperature of 3.0–26.7 °C (data from 2000 to 2022; https://downloads.psl.noaa.gov/Datasets/COBE/ (accessed on 1 September 2022)). In contrast, O. rebecca in Zhongshan coastal waters experiences a much more stable and warmer southern subtropical climate, with the yearly average minimum–maximum surface water temperature of 16.9–29.9 °C. Such contrasting differences in environmental thermal regimes may confer divergent thermal tolerance for mudflat inhabitants, such as the two eel gobies. Our results thereby indicate the possibilities of using latitudinal distributional information as one of the indicators for predicting the realistic patterns of species’ thermal tolerance in mudflat species, especially when their latitude distribution divergence is extreme, and thus may have positive implications for management and conservation of tidal fishery resources in the future.

4.2. Common Processes Involved in the Cold Stress Response

Since thermal stress has great biological impacts on organisms, the transcriptomic response is expected to be highly diverse across many genes in ectothermic species such as mudflat eel gobies. Our results were consistent with this expectation and found that numerous genes are differentially expressed in both species of eel gobies under cold stress. These DEGs were primarily enriched in multiple biological processes, such as nutrient metabolism, oxidation-reduction, cellular response to stimulus, circadian rhythm, DNA repair, covalent chromatin modification, apoptosis, immune response processes, cellular processes, protein folding, membrane organization, RNA processing, and energy metabolic processes (Tables S3–S14). Some DEGS include those genes (e.g., chaperones such as HSP90, HSP10) that are typically involved in cold stress response in a variety of animals [52,53]. These correspond well with previous studies, which demonstrate that all these biological processes are closely involved in cold tolerance when exposed to chilled waters in teleosts [54,55,56,57,58,59,60]. However, such transcriptomic response to cold stress was basically tissue specific both at the transcriptome or specific-gene expression level [61], as was also evident in other teleost fish when exposed to thermal stress [36,62]. The gill generally showed more DEGs up- or down-regulated under cold stress than the brain and liver (Figure 2) in O. rebecca. While the liver, instead, displayed more up- or down-regulated DEGs under cold stress than the other two tissues in O. lacepedii. The more DEGs regulated under cold stress is consistent with the expectation that gill and liver tissues are usually the main target organs of cold stress in fish and may play critical roles in their cold tolerance [63,64]. Nevertheless, a proportion of the DEGs exhibited conserved expression profiles across tissues and species, in terms of both expression levels and reaction to cold stress. These conserved genes probably represent components of the backbone of the stress response network in eel gobies that is essential for tolerance of thermal stress, which would make these genes interesting candidates to examine in other teleosts. Several genes (e.g., ACOD, and ISYNA1) associated with carbohydrate/lipid metabolism were found in this category and were significantly up-regulated in three tissues of both species during the cold stress. The carbohydrate/lipid metabolism pathway is the most frequently unveiled biological process that is closely related to cold resistance in a large variety of teleost species [3,55,60]. The parallel induction of these genes among tissues and species lent support for their roles in coping with cold stress in the eel gobies. Take ACOD as an example, this gene encodes Stearoyl-CoA desaturase that utilizes O2 and electrons from reduced cytochrome b5 to introduce the first double bond into saturated fatty acyl-CoA substrates and plays an important role in the regulation of cellular lipogenesis and membrane fluidity under temperature fluctuations [65]. In mice, ACOD deficiency will cause reduced adiposity and hence lower cold tolerance in a cold environment [66,67]. In aquatic oysters, cis- and trans-variations of stearoyl-CoA desaturase will cause large phenotypic plasticity for thermal adaptation in Crassostrea gigas and C. angulate [68]. In teleost fishes, activation of Stearoyl–CoA desaturase expression is usually parallel to the increased proportion of unsaturated fatty acids in cell membranes [69], hence the improved cold tolerance [70]. Therefore, we hypothesize that our observed up-regulation of ACOD expression may also be helpful in increasing the membrane fluidity, and hence the cold tolerance in eel gobies when exposed to cold stress possibly through lipogenesis stimulating processes.
Similarly, significant up-regulation in circadian rhythm-related genes such as transcriptional repressor (CIART), clock-interacting pacemaker (CIPC), and nuclear factor interleukin-3-regulated protein (NFIL3) were also found in in three tissues of both species during the cold stress. Circadian rhythm-related genes have been implicated in thermal resistance in a wide variety of teleost species such as Iberian chub (Squalius carolitertii) [62,71], sole (Cynoglossus semilaevis) [72], and tiger barb (Puntius tetrazona) [73]. Such correlation between circadian rhythm-related genes and thermal tolerance is hypothesized to be closely associated with the facilitating effects of circadian gene-dependent changes in cellular metabolism for cold resistance [74]. Indeed, So et al. (2022) first provided experimental evidence showing that protein encoded by NFIL3 was found to participate in adipose tissue thermogenesis, in vitro. The knockdown of NFIL3 disrupted the thermogenesis of systemic energy homeostasis in the adipocyte cell line of mice [75]. Thus, we postulated that the up-regulation of these circadian rhythm-related genes may also increase cold resistance in the eel goby by acting on the cellular metabolism processes such as energy homeostasis, as well. Further studies are needed to provide a solid linkage between the expression regulation of circadian rhythm-related genes and the phenotype of cold resistance in teleost fishes.

4.3. Distinct DEGs Corresponding with Divergent Thermal Adaptation

In addition to these common processes involved in the cold stress response, inter-specific distinct DEGs that are possibly related to the divergent cold tolerance capacity were also obvious between the two eel gobies. Our results of hierarchical clustering analysis revealed multiple clusters exhibiting species-distinct expression trends and responses to cold stress in all three tissues of the two species. Our weighted gene co-expression network construction and co-expression network analysis performed afterward also revealed numerous species-distinct cold-responsive hub genes that may be closely associated with divergent responses to temperature changes. Such interspecific distinctness in both categories and expression profiles of cold-responsive hub genes may arise from an adaptive alteration in the gene-expression-regulation network that may evolve under directional selection and confer the contrasted cold resistance capacity between the two eel gobies. This evolutionary force has been widely detected in other taxa of teleost species such as in Oncorhynchus mykiss [3] and Lota lota [76], where divergence in gene expression does not accord with genetic relatedness but is associated with phenotypic traits. Even in the hub genes that were shared between the two sister species, such interspecific variation of gene expression was also prevalent. A closer inspection of these shared hub genes exhibiting divergent expression between O. lacepedii and O. rebecca revealed that these genes were primarily associated with biological processes of nutrient metabolism, energy production, and immune response, which were typically involved in the cold stress adaptation in teleost species [55,77]. Among them, MYH11 encodes smooth muscle-specific myosin heavy chain (SM-MHC) that is typically involved in the cytoskeletal and contractile function of smooth muscle cells (SMCs) [78]. However, in recent years, MYH11 has also been found to be expressed in a variety of tissues and is closely involved in other cellular functions such as adipogenesis and thermogenesis [79,80] and plays an essential role in maintaining the body’s energy balance during cold adaptation. Our results found constant up-regulation of MYH11 expression in the gill tissue of O. rebecca from 23 °C to 15 °C and 11 °C, implying that high-level adipogenesis and thermogenesis may have been activated to supply energy for counteracting the adverse effect of cold stress. In contrast, MYH11 expression was largely down-regulated in the gill tissue of O. lacepedii from 23 °C to 15 °C, and was slightly increased from 15 °C to 11 °C. Such discrepancy in MYH11 expression profile may imply that less adipogenesis and thermogenesis activity and less energy consumption was adopted to maintain the energy homeostasis in O. lacepedii than their sister species when exposed to the same cold stress regime, and thus may contribute, at least in part, to the higher cold tolerance in O. lacepedii. A similar discrepancy was also observed in the gene expression profile in the shared hub gene of LIPT2 between the two eel gobies. LIPT2 encodes the enzyme that catalyzes the transfer of endogenously produced octanoic acid from octanoyl-acyl-carrier-protein onto the lipoyl domains of lipoate-dependent enzymes, and is closely involved in the post-translational modification of key energy metabolism enzymes in animals [81]. Mutation or abnormal expression of LIPT2 will usually cause a mitochondrial lipoylation defect [82] and mitochondrial membrane potential collapse [81], leading to severe defects in the mitochondrial energy metabolism. Our results also reveal constant up-regulation of LIPT2 expression in the liver tissue of O. rebecca from 23 °C to 15 °C and 11 °C, implying that more energy was produced to meet the body’s energy requirement in O. rebecca under cold stress. Instead, in O. lacepedii, LIPT2 expression was steadily down-regulated from 23 °C to 15 °C and 11 °C. Such ability to sufficiently reduce energy consumption by repressing the metabolic genes is believed to confer increased fitness when exposed to cold stress where energy gain is extremely limited [83]. Though the exact molecular mechanism underlying this upgraded metabolism in the O. lacepedii is unknown, such energy conservation strategies have also been frequently found in other taxa that show higher thermal tolerance than their lower tolerant counterparts [62,83]. Therefore, we hypothesize that such energy-saving strategies through repression of a small subset of metabolic genes and fine-tuning of associated metabolic processes probably represent a common physiological mechanism that confers enhanced cold resistance in teleost species when exposed to cold stress.

5. Conclusions

Our study demonstrated the strengths of comparing transcriptomes of closely related species to shed light on the underlying molecular mechanisms that have led to divergent thermal tolerance that was commonly found among teleost species. Using large-scale transcriptome data, we revealed that, despite the contrasting capacity in cold tolerance between the two eel gobies, there are still substantial DEGs that showed similar expression profiles across the species, which may indicate their core roles in cold stress response machinery in eel gobies. However, species-specific transcriptomic responses to cold stress were also observed, revealing that some genes associated with energy and nutrient metabolism, along with the immune response and apoptosis processes, may likely contribute to the enhanced cold tolerance of O. lacepedii. Among them, a subset of metabolic hub genes showing distinct down-regulation in O. lacepedii when exposed to cold stress highlighted the energy-saving strategies in the enhanced cold tolerance of eel gobies. These results may provide new information for understanding how teleosts could cope with cold stress and their potential evolutionary strategies for adapting to a changing climate in the marine realm. Such adaptative information of gene expression regulation among or within species is recommended to be taken into account in the identification of local adaptations and the development of sound conservation strategies of fishery resources in a scenario of global climate warming.

Supplementary Materials

The following supporting information can be downloaded at: https://www.mdpi.com/article/10.3390/cimb46010012/s1, Figure S1: Determination of optimum soft thresholding power; Figure S2: Venn diagram of the DEGs identified in the brain, gills, and liver tissues of O. lacepedii and O. rebecca under cold stresses; Table S1: Summary of clean RNA-seq reads generated from transcriptome sequencing of three tissues in two eel gobies; Table S2: The correlation coefficients between the biological replicates of eel gobies; Table S3: GO enrichment analysis of the DEGs identified in brain of O. lacepedii exposed to 15 °C compared with control group; Table S4: GO enrichment analysis of the DEGs identified in brain of O. lacepedii exposed to 11 °C compared with control group; Table S5: GO enrichment analysis of the DEGs identified in gill of O. lacepedii exposed to 15 °C compared with control group; Table S6: GO enrichment analysis of the DEGs identified in gill of O. lacepedii exposed to 11 °C compared with control group; Table S7: GO enrichment analysis of the DEGs identified in liver of O. lacepedii exposed to 15 °C compared with control group; Table S8: GO enrichment analysis of the DEGs identified in liver of O. lacepedii exposed to 11 °C compared with control group; Table S9: GO enrichment analysis of the DEGs identified in brain of O. rebecca exposed to 15 °C compared with control group; Table S10: GO enrichment analysis of the DEGs identified in brain of O. rebecca exposed to 11 °C compared with control group; Table S11: GO enrichment analysis of the DEGs identified in gill of O. rebecca exposed to 15 °C compared with control group; Table S12: GO enrichment analysis of the DEGs identified in gill of O. rebecca exposed to 11 °C compared with control group; Table S13: GO enrichment analysis of the DEGs identified in liver of O. rebecca exposed to 15 °C compared with control group; Table S14: GO enrichment analysis of the DEGs identified in liver of O. rebecca exposed to 11 °C compared with control group; Table S15: Common DEGs shared across all three tissues of the two eel gobies under cold stress compared with the control group; Table S16: Summary of model-based clustering analysis for DEGs identified in three tissues; Table S17: GO enrichment analysis of the DEGs exhibiting distinct expression profiles in the brain tissues between the two eel gobies when exposed to cold stress; Table S18: GO enrichment analysis of the DEGs exhibiting distinct expression profiles in the gill tissues between the two eel gobies when exposed to cold stress; Table S19: GO enrichment analysis of the DEGs exhibiting distinct expression profiles in the liver tissues between the two eel gobies when exposed to cold stress; Table S20: Overrepresentation analysis of differentially expressed genes in the modules of O. lacepedii; Table S21: Overrepresentation analysis of differentially expressed genes in the modules of O. rebecca.

Author Contributions

Conceptualization, Z.L. and J.L.; methodology, T.L., Y.W. and Y.L.; validation, L.L. and L.G.; formal analysis, B.L.; data curation, T.L.; writing—original draft preparation, J.L.; writing—review and editing, J.L.; visualization, Z.L., T.L., Y.W. and Y.L.; supervision, L.L. and L.G.; project administration, Z.L. and B.L.; funding acquisition, Z.L. All authors have read and agreed to the published version of the manuscript.

Funding

This research was funded by the National Natural Science Foundation of China (NSFC) (41976121) and (42171069).

Institutional Review Board Statement

The study was approved by the Institutional Animal Care and Use Committee of Zhengjiang Ocean University (ZOUMGREU-2023-000401), and it does not contain any studies with human participants.

Informed Consent Statement

Not applicable.

Data Availability Statement

The transcriptome datasets used in this study have been deposited in the NCBI Sequence Read Archive (SRA) BioProject PRJNA1002179.

Acknowledgments

We are grateful to all members of the National Engineering Research Center for Marine Germplasm Resources Exploration and Utilization of the College of Marine Sciences and Technology of Zhejiang Ocean University who contributed in any way to the success of this research.

Conflicts of Interest

All authors declare no conflicts of interest.

References

  1. Sikkink, K.L.; Reynolds, R.M.; Ituarte, C.M.; Cresko, W.A.; Phillips, P.C. Rapid evolution of phenotypic plasticity and shifting thresholds of genetic assimilation in the nematode Caenorhabditis Remanei. G3 Genes Genomes Genet. 2014, 4, 1103–1112. [Google Scholar] [CrossRef] [PubMed]
  2. Tomiolo, S.; Ward, D. Species migrations and range shifts: A synthesis of causes and consequences. Perspect. Plant Ecol. Evol. Syst. 2018, 33, 62–77. [Google Scholar] [CrossRef]
  3. Narum, S.R.; Campbell, N.R. Transcriptomic response to heat stress among ecologically divergent populations of redband trout. BMC Genom. 2015, 16, 103. [Google Scholar] [CrossRef] [PubMed]
  4. Gibert, P.; Moreteau, B.; Pétavy, G.; Karan, D.; David, J.R. Chill-coma tolerance, a major climatic adaptation among Drosophila species. Evolution 2001, 55, 1063–1068. [Google Scholar] [CrossRef] [PubMed]
  5. Overgaard, J.; MacMillan, H.A. The integrative physiology of insect chill tolerance. Annu. Rev. Physiol. 2017, 79, 187–208. [Google Scholar] [CrossRef]
  6. Zhao, X.; Zhang, J.; Wang, H.; Li, H.; Qu, C.; Wen, J.; Zhang, X.; Zhu, T.; Nie, C.; Li, X.; et al. Genomic and transcriptomic analyses reveal genetic adaptation to cold conditions in the chickens. Genomics 2022, 114, 110485. [Google Scholar] [CrossRef] [PubMed]
  7. Wang, L.; Gao, Y.; Wang, J.; Huang, N.; Jiang, Q.; Ju, Z.; Yang, C.; Wei, X.; Xiao, Y.; Zhang, Y.; et al. Selection signature and CRISPR/Cas9-mediated gene knockout analyses reveal ZC3H10 involved in cold adaptation in Chinese native cattle. Genes 2022, 13, 1910. [Google Scholar] [CrossRef] [PubMed]
  8. Pirri, F.; Ometto, L.; Fuselli, S.; Fernandes, F.A.N.; Ancona, L.; Perta, N.; Di Marino, D.; Le Bohec, C.; Zane, L.; Trucchi, E. Selection-driven adaptation to the extreme Antarctic environment in the Emperor penguin. Heredity 2022, 129, 317–326. [Google Scholar] [CrossRef]
  9. Donelson, J.; Sunday, J.; Figueira, W.; Gaitán-Espitia, J.D.; Hobday, A.; Johnson, C.; Leis, J.; Ling, S.; Marshall, D.; Pandolfi, J.; et al. Understanding interactions between plasticity, adaptation and range shifts in response to marine environmental change. Philos. Trans. R Soc. Lond. B Biol. Sci. 2019, 374, 20180186. [Google Scholar] [CrossRef]
  10. Zhang, W.Y.; Storey, K.B.; Dong, Y.W. Adaptations to the mudflat: Insights from physiological and transcriptional responses to thermal stress in a burrowing bivalve Sinonovacula constricta. Sci. Total Environ. 2020, 710, 136280. [Google Scholar] [CrossRef]
  11. Ma, K.; Li, Y.; Liu, X.; Song, W.; Zhou, J.; Gong, X.; Wang, M.; Li, C.; Liu, J.; Tu, Q. Bacteria rather than fungi mediate the chemodiversity of dissolved organic matter in a mudflat intertidal zone. Sci. Total Environ. 2023, 893, 164835. [Google Scholar] [CrossRef] [PubMed]
  12. Mohapatra, M.; Yadav, R.; Rajput, V.; Dharne, M.S.; Rastogi, G. Metagenomic analysis reveals genetic insights on biogeochemical cycling, xenobiotic degradation, and stress resistance in mudflat microbiome. J. Environ. Manag. 2021, 292, 112738. [Google Scholar] [CrossRef] [PubMed]
  13. Phartyal, S.; Rosbakh, S.; Poschlod, P. Seed germination of mudflat species responds differently to prior exposure to hypoxic (flooded) environments. Seed Sci. Res. 2020, 30, 268–274. [Google Scholar] [CrossRef]
  14. Dong, Y.W.; Yu, S.S.; Wang, Q.L.; Dong, S.L. Physiological responses in a variable environment: Relationships between metabolism, hsp and thermotolerance in an intertidal-subtidal species. PLoS ONE 2011, 6, e26446. [Google Scholar] [CrossRef] [PubMed]
  15. Li, X.; Dong, Y. Living on the upper intertidal mudflat: Different behavioral and physiological responses to high temperature between two sympatric cerithidea snails with divergent habitat-use strategies. Mar. Environ. Res. 2020, 159, 105015. [Google Scholar] [CrossRef] [PubMed]
  16. Campbell-Staton, S.C.; Velotta, J.P.; Winchell, K.M. Selection on adaptive and maladaptive gene expression plasticity during thermal adaptation to urban heat islands. Nat. Commun. 2021, 12, 6195. [Google Scholar] [CrossRef] [PubMed]
  17. Kassahn, K.S.; Crozier, R.H.; Pörtner, H.O.; Caley, M.J. Animal performance and stress: Responses and tolerance limits at different levels of biological organisation. Biol. Rev. Camb. Philos. Soc. 2009, 84, 277–292. [Google Scholar] [CrossRef] [PubMed]
  18. Somero, G.N. The physiology of global change: Linking patterns to mechanisms. Ann. Rev. Mar. Sci. 2012, 4, 39–61. [Google Scholar] [CrossRef]
  19. Xu, C.; Ju, X.; Song, D.; Huang, F.; Tang, D.; Zou, Z.; Zhang, C.; Joshi, T.; Jia, L.; Xu, W.; et al. An association analysis between psychophysical characteristics and genome-wide gene expression changes in human adaptation to the extreme climate at the Antarctic Dome Argus. Mol. Psychiatry 2015, 20, 536–544. [Google Scholar] [CrossRef]
  20. Swindell, W.R.; Huebner, M.; Weber, A.P. Plastic and adaptive gene expression patterns associated with temperature stress in Arabidopsis thaliana. Heredity 2007, 99, 143–150. [Google Scholar] [CrossRef]
  21. Schoville, S.D.; Barreto, F.S.; Moy, G.W.; Wolff, A.; Burton, R.S. Investigating the molecular basis of local adaptation to thermal stress: Population differences in gene expression across the transcriptome of the copepod Tigriopus californicus. BMC Evol. Biol. 2012, 12, 170. [Google Scholar] [CrossRef] [PubMed]
  22. Newton, J.R.; Zenger, K.R.; Jerry, D.R. Next-generation transcriptome profiling reveals insights into genetic factors contributing to growth differences and temperature adaptation in Australian populations of barramundi (Lates calcarifer). Mar. Genom. 2013, 11, 45–52. [Google Scholar] [CrossRef] [PubMed]
  23. Scott, G.R.; Brix, K.V. Evolution of salinity tolerance from transcriptome to physiological system. Mol. Ecol. 2013, 22, 3656–3658. [Google Scholar] [CrossRef] [PubMed]
  24. Tang, W.; Lshimatsu, A.; Fu, C.; Yin, W.; Li, G.; Chen, H.; Wu, Q.; Li, B. Cryptic species and historical biogeography of eel gobies (Gobioidei: Odontamblyopus) along the northwestern Pacific coast. Zool. Sci. 2010, 27, 8–13. [Google Scholar] [CrossRef] [PubMed]
  25. Lü, Z.; Liu, T.; Liu, Y.; Wang, Y.; Liu, J.; Liu, B.; Gong, L.; Liu, L. Climate adaptation and drift shape the genomes of two eel-goby sister species endemic to contrasting latitude. Animals 2023, 13, 3240. [Google Scholar] [CrossRef] [PubMed]
  26. Murdy, E.O.; Shibukawa, K. Odontamblyopus rebecca, a new species of amblyopine goby from Vietnam with a key to known species of the genus (Gobiidae: Amblyopinae). Zootaxa 2003, 138, 1–6. [Google Scholar] [CrossRef]
  27. Liu, Z.; Song, N.; Yanagimoto, T.; Zhou, Z.; Yang, J.; Gao, T. Identification of Odontamblyopus lacepedii via morphology and DNA barcoding. Biochem. Syst. Ecol. 2016, 66, 281–285. [Google Scholar] [CrossRef]
  28. Jiang, P.; Zhang, S.; Xu, S.; Xiong, P.; Cao, Y.; Chen, Z.; Li, M. Comparison of environmental DNA metabarcoding and bottom trawling for detecting seasonal fish communities and habitat preference in a highly disturbed estuary. Ecol. Indic. 2023, 146, 109754. [Google Scholar] [CrossRef]
  29. Zhang, C.G.; Li, Y.H.; Zhong, Y.C. Investigation on fish eggs, larvae and juveniles in Beitang River Estuary. Acta. Oceanol. Sin. 1981, 6, 856–866. (In Chinese) [Google Scholar]
  30. Wang, Q.L.; Dong, Y.W.; Qin, C.X.; Yu, S.X.; Dong, S.L.; Wang, F. Effects of rearing temperature on growth, metabolism and thermal tolerance of juvenile sea cucumber, Apostichopus japonicus Selenka: Critical thermal maximum (CTmax) and hsps gene expression. Aquac. Res. 2013, 44, 1550–1559. [Google Scholar] [CrossRef]
  31. Nyboer, E.A.; Chrétien, E.; Chapman, L.J. Divergence in aerobic scope and thermal tolerance is related to local thermal regime in two populations of introduced Nile perch (Lates niloticus). J. Fish. Biol. 2020, 97, 231–245. [Google Scholar] [CrossRef] [PubMed]
  32. Currie, R.J.; Bennett, W.A.; Beitinger, T.L. Critical thermal minima and maxima of three freshwater game-fish species acclimated to constant temperatures. Environ. Biol. Fishes 1998, 51, 187–200. [Google Scholar] [CrossRef]
  33. Hazell, S.P.; Bale, J.S. Low temperature thresholds: Are chill coma and CT(min) synonymous? J. Insect. Physiol. 2011, 57, 1085–1089. [Google Scholar] [CrossRef] [PubMed]
  34. Ospina, A.F.; Mora, C. Effect of body size on reef fish tolerance to extreme low and high temperatures. Environ. Biol. Fishes 2004, 70, 339–343. [Google Scholar] [CrossRef]
  35. Becker, C.D.; Genoway, R.G. Evaluation of the critical thermal maximum for determining thermal tolerance of freshwater fish. Environ. Biol. Fishes 1979, 4, 245–256. [Google Scholar] [CrossRef]
  36. Madeira, D.; Mendonça, V.; Dias, M.; Roma, J.; Costa, P.M.; Diniz, M.S.; Vinagre, C. Physiological and biochemical thermal stress response of the intertidal rock goby Gobius paganellus. Ecol. Indic. 2014, 46, 232–239. [Google Scholar] [CrossRef]
  37. Rio, D.C.; Ares, M.J.; Hannon, G.J.; Nilsen, T.W. Purification of RNA using TRIzol (TRI reagent). Cold. Spring Harb. Protoc. 2010, 2010, pdb-prot5439. [Google Scholar] [CrossRef]
  38. Bolger, A.M.; Lohse, M.; Usadel, B. Trimmomatic: A flexible trimmer for Illumina sequence data. Bioinformatics 2014, 30, 2114–2120. [Google Scholar] [CrossRef]
  39. Kim, D.; Langmead, B.; Salzberg, S.L. HISAT: A fast spliced aligner with low memory requirements. Nat. Methods 2015, 12, 357–360. [Google Scholar] [CrossRef]
  40. Liao, Y.; Smyth, G.K.; Shi, W. featureCounts: An efficient general purpose program for assigning sequence reads to genomic features. Bioinformatics 2014, 30, 923–930. [Google Scholar] [CrossRef]
  41. Love, M.I.; Huber, W.; Anders, S. Moderated estimation of fold change and dispersion for RNA-seq data with DESeq2. Genome Biol. 2014, 15, 550. [Google Scholar] [CrossRef] [PubMed]
  42. Benjamini, Y.; Hochberg, Y. Controlling the false discovery rate: A practical and powerful approach to multiple testing. J. R. Stat. Soc. Ser. B Stat. Methodol. 1995, 57, 289–300. [Google Scholar] [CrossRef]
  43. Team, R.D.C. R: A language and environment for statistical computing. R Foundation for Statistical Computing: Vienna, Austria. Computing 2009, 14, 12–21. [Google Scholar]
  44. Scrucca, L.; Fop, M.; Murphy, T.B.; Raftery, A.E. Mclust 5: Clustering, classification and density estimation using Gaussian finite mixture models. R. J. 2016, 8, 289–317. [Google Scholar] [CrossRef] [PubMed]
  45. Yu, G.; Wang, L.G.; Han, Y.; He, Q.Y. ClusterProfiler: An R package for comparing biological themes among gene clusters. OMICS 2012, 16, 284–287. [Google Scholar] [CrossRef] [PubMed]
  46. Li, T.; Zhang, Y.; Liu, S.; Li, M.; Yao, R.; Niu, S.; Yuan, J.; Wang, H.; Hu, J.; Bao, Z.; et al. Transcriptome and network analyses reveal key pathways and genes involved in response to carotenoid deposition in scallop muscle. Front. Mar. Sci. 2023, 10, 1158325. [Google Scholar] [CrossRef]
  47. Langfelder, P.; Horvath, S. WGCNA: An R package for weighted correlation network analysis. BMC Bioinform. 2008, 9, 559. [Google Scholar] [CrossRef] [PubMed]
  48. Zhou, X.L.; Dou, M.M.; Liu, Z.Q.; Jiao, D.C.; Li, Z.N.; Chen, J.J.; Li, J.; Yao, Y.; Li, L.F.; Li, Y.H.; et al. Screening prognosis-related lncRNAs based on WGCNA to establish a new risk score for predicting prognosis in patients with Hepatocellular carcinoma. J. Immunol. Res. 2021, 2021, 5518908. [Google Scholar] [CrossRef]
  49. Wang, B.; Li, J.; Li, X.; Ou, Y. Identifying prognosis and metastasis-associated genes associated with Ewing sarcoma by weighted gene co-expression network analysis. Oncol. Lett. 2019, 18, 3527–3536. [Google Scholar] [CrossRef]
  50. Shannon, P.; Markiel, A.; Ozier, O.; Baliga, N.S.; Wang, J.T.; Ramage, D.; Amin, N.; Schwikowski, B.; Ideker, T. Cytoscape: A software environment for integrated models of biomolecular interaction networks. Genome Res. 2003, 13, 2498–2504. [Google Scholar] [CrossRef]
  51. Yu, D.; Zhang, Z.; Shen, Z.; Zhang, C.; Liu, H. Regional differences in thermal adaptation of a cold-water fish Rhynchocypris oxycephalus revealed by thermal tolerance and transcriptomic responses. Sci. Rep. 2018, 8, 11703. [Google Scholar] [CrossRef] [PubMed]
  52. Gao, Y.; Li, J.N.; Pu, J.J.; Tao, K.X.; Zhao, X.X.; Yang, Q.Q. Genome-wide identification and characterization of the HSP gene superfamily in apple snails (Gastropoda: Ampullariidae) and expression analysis under temperature stress. Int. J. Biol. Macromol. 2022, 222, 2545–2555. [Google Scholar] [CrossRef] [PubMed]
  53. Li, Y.J.; Ma, C.S.; Yan, Y.; Renault, D.; Colinet, H. The interspecific variations in molecular responses to various doses of heat and cold stress: The case of cereal aphids. J. Insect. Physiol. 2023, 147, 104520. [Google Scholar] [CrossRef] [PubMed]
  54. Nie, M.; Tan, X.; Lu, Y.; Wu, Z.; Li, J.; Xu, D.; Zhang, P.; You, F. Network of microRNA-transcriptional factor-mRNA in cold response of turbot Scophthalmus maximus. Fish. Physiol. Biochem. 2019, 45, 583–597. [Google Scholar] [CrossRef]
  55. Liu, M.; Zhou, Y.; Guo, X.; Wei, W.; Li, Z.; Zhou, L.; Wang, Z.; Gui, J. Comparative transcriptomes and metabolomes reveal different tolerance mechanisms to cold stress in two different catfish species. Aquaculture 2022, 560, 738543. [Google Scholar] [CrossRef]
  56. Cheng, C.H.; Ye, C.X.; Guo, Z.X.; Wang, A.L. Immune and physiological responses of pufferfish (Takifugu obscurus) under cold stress. Fish Shellfish. Immunol. 2017, 64, 137–145. [Google Scholar] [CrossRef]
  57. Liu, R.; Long, Y.; Liu, R.; Song, G.; Li, Q.; Yan, H.; Cui, Z. Understanding the function and mechanism of zebrafish Tmem39b in regulating cold resistance. Int. J. Mol. Sci. 2022, 23, 11442. [Google Scholar] [CrossRef]
  58. Lyu, L.; Wen, H.; Li, Y.; Li, J.; Zhao, J.; Zhang, S.; Song, M.; Wang, X. Deep transcriptomic analysis of black rockfish (Sebastes schlegelii) provides new insights on responses to acute temperature stress. Sci. Rep. 2018, 8, 9113. [Google Scholar] [CrossRef]
  59. Wang, Z.; Dong, Z.; Yang, Y.; Wang, J.; Yang, T.; Chen, X.; Liang, L.; Mu, W. Histology, physiology, and glucose and lipid metabolism of Lateolabrax maculatus under low temperature stress. J. Therm. Biol. 2022, 104, 103161. [Google Scholar] [CrossRef]
  60. Verleih, M.; Borchel, A.; Krasnov, A.; Rebl, A.; Korytář, T.; Kühn, C.; Goldammer, T. Impact of thermal stress on kidney-specific gene expression in farmed regional and imported rainbow trout. Mar. Biotechnol. 2015, 17, 576–592. [Google Scholar] [CrossRef]
  61. Jiang, H.; Lv, W.; Wang, Y.; Qian, Y.; Wang, C.; Sun, N.; Fang, C.; Irwin, D.M.; Gan, X.; He, S.; et al. Multi-omics investigation of freeze tolerance in the amur sleeper, an aquatic ectothermic vertebrate. Mol. Biol. Evol. 2023, 40, msad040. [Google Scholar] [CrossRef] [PubMed]
  62. Jesus, T.F.; Grosso, A.R.; Almeida-Val, V.M.F.; Coelho, M.M. Transcriptome profiling of two Iberian freshwater fish exposed to thermal stress. J. Therm. Biol. 2016, 55, 54–61. [Google Scholar] [CrossRef] [PubMed]
  63. Hu, P.; Liu, M.; Liu, Y.; Wang, J.; Zhang, D.; Niu, H.; Jiang, S.; Wang, J.; Zhang, D.; Han, B.; et al. Transcriptome comparison reveals a genetic network regulating the lower temperature limit in fish. Sci. Rep. 2016, 6, 28952. [Google Scholar] [CrossRef] [PubMed]
  64. Zhang, M.; Hu, J.; Zhu, J.; Wang, Y.; Zhang, Y.; Li, Y.; Xu, S.; Yan, X.; Zhang, D. Transcriptome, antioxidant enzymes and histological analysis reveal molecular mechanisms responsive to long-term cold stress in silver pomfret (Pampus argenteus). Fish Shellfish. Immunol. 2022, 121, 351–361. [Google Scholar] [CrossRef]
  65. Vigh, L.; Los, D.A.; Horváth, I.; Murata, N. The primary signal in the biological perception of temperature: Pd-catalyzed hydrogenation of membrane lipids stimulated the expression of the desA gene in Synechocystis PCC6803. Proc. Natl. Acad. Sci. USA 1993, 90, 9090–9094. [Google Scholar] [CrossRef]
  66. Lee, S.H.; Dobrzyn, A.; Dobrzyn, P.; Rahman, S.M.; Miyazaki, M.; Ntambi, J.M. Lack of stearoyl-CoA desaturase 1 upregulates basal thermogenesis but causes hypothermia in a cold environment. J. Lipid. Res. 2004, 45, 1674–1682. [Google Scholar] [CrossRef]
  67. Sampath, H.; Flowers, M.T.; Liu, X.; Paton, C.M.; Sullivan, R.; Chu, K.; Zhao, M.; Ntambi, J.M. Skin-specific deletion of stearoyl-CoA desaturase-1 alters skin lipid composition and protects mice from high fat diet-induced obesity. J. Biol. Chem. 2009, 284, 19961–19973. [Google Scholar] [CrossRef]
  68. Wang, C.; Li, A.; Cong, R.; Qi, H.; Wang, W.; Zhang, G.; Li, L. Cis- and trans-variations of stearoyl-coA desaturase provide new insights into the mechanisms of diverged pattern of phenotypic plasticity for temperature adaptation in two congeneric oyster species. Mol. Biol. Evol. 2023, 40, msad015. [Google Scholar] [CrossRef]
  69. Schünke, M.; Wodtke, E. Cold-induced increase of Δ9- and Δ6- desaturase activities in endoplasmic membranes of carp liver. Biochim. Biophys. Acta. 1983, 734, 70–75. [Google Scholar] [CrossRef]
  70. Hsieh, S.L.; Kuo, C.M. Stearoyl-CoA desaturase expression and fatty acid composition in milkfish (Chanos chanos) and grass carp (Ctenopharyngodon idella) during cold acclimation. Comp. Biochem. Physiol. B Biochem. Mol. Biol. 2005, 141, 95–101. [Google Scholar] [CrossRef]
  71. Jesus, T.F.; Moreno, J.M.; Repolho, T.; Athanasiadis, A.; Rosa, R.; Almeida-Val, V.M.F.; Coelho, M.M. Protein analysis and gene expression indicate differential vulnerability of Iberian fish species under a climate change scenario. PLoS ONE 2017, 12, e0181325. [Google Scholar] [CrossRef]
  72. Guo, L.; Wang, Y.; Liang, S.; Lin, G.; Chen, S.; Yang, G. Tissue-overlapping response of half-smooth tongue sole (Cynoglossus semilaevis) to thermostressing based on transcriptome profiles. Gene 2016, 586, 97–104. [Google Scholar] [CrossRef] [PubMed]
  73. Liu, L.; Zhang, R.; Wang, X.; Zhu, H.; Tian, Z. Transcriptome analysis reveals molecular mechanisms responsive to acute cold stress in the tropical stenothermal fish tiger barb (Puntius tetrazona). BMC Genom. 2020, 21, 737. [Google Scholar] [CrossRef] [PubMed]
  74. Hung, I.C.; Hsiao, Y.C.; Sun, H.S.; Chen, T.M.; Lee, S.J. MicroRNAs regulate gene plasticity during cold shock in zebrafish larvae. BMC Genom. 2016, 17, 922. [Google Scholar] [CrossRef] [PubMed]
  75. So, J.; Taleb, S.; Wann, J.; Strobel, O.; Kim, K.; Roh, H.C. Chronic cAMP activation induces adipocyte browning through discordant biphasic remodeling of transcriptome and chromatin accessibility. Mol. Metab. 2022, 66, 101619. [Google Scholar] [CrossRef] [PubMed]
  76. Lou, F.; Liu, M.; Han, Z.; Gao, T. Comparative transcriptome reveals the thermal stress response differences between Heilongjiang population and Xinjiang population of Lota lota. Comp. Biochem. Physiol. Part D Genom. Proteom. 2022, 42, 100960. [Google Scholar] [CrossRef]
  77. Velmurugan, B.K.; Chan, C.R.; Weng, C.F. Innate-immune responses of tilapia (Oreochromis mossambicus) exposure to acute cold stress. J. Cell. Physiol. 2019, 234, 16125–16135. [Google Scholar] [CrossRef]
  78. Negishi, K.; Aizawa, K.; Shindo, T.; Suzuki, T.; Sakurai, T.; Saito, Y.; Miyakawa, T.; Tanokura, M.; Kataoka, Y.; Maeda, M.; et al. An Myh11 single lysine deletion causes aortic dissection by reducing aortic structural integrity and contractility. Sci. Rep. 2022, 12, 8844. [Google Scholar] [CrossRef]
  79. Zhao, J.; Tao, C.; Chen, C.; Wang, Y.; Liu, T. Formation of thermogenic adipocytes: What we have learned from pigs. Fundam. Res. 2021, 1, 495–502. [Google Scholar] [CrossRef]
  80. Kim, J.S.; Han, H.S.; Seong, J.K.; Ko, Y.G.; Koo, S.H. Involvement of a novel cAMP signaling mediator for beige adipogenesis. Metabolism 2023, 143, 155536. [Google Scholar] [CrossRef]
  81. Bernardinelli, E.; Costa, R.; Scantamburlo, G.; To, J.; Morabito, R.; Nofziger, C.; Doerrier, C.; Krumschnabel, G.; Paulmichl, M.; Dossena, S. Mis-targeting of the mitochondrial protein LIPT2 leads to apoptotic cell death. PLoS ONE 2017, 12, e0179591. [Google Scholar] [CrossRef] [PubMed]
  82. Habarou, F.; Hamel, Y.; Haack, T.B.; Feichtinger, R.G.; Lebigot, E.; Marquardt, I.; Busiah, K.; Laroche, C.; Madrange, M.; Grisel, C.; et al. Biallelic mutations in LIPT2 cause a mitochondrial lipoylation defect associated with severe neonatal encephalopathy. Am. J. Hum. Genet 2017, 101, 283–290. [Google Scholar] [CrossRef] [PubMed]
  83. Wang, W.; Hui, J.H.L.; Williams, G.A.; Cartwright, S.R.; Tsang, L.M.; Chu, K.H. Comparative transcriptomics across populations offers new insights into the evolution of thermal resistance in marine snails. Mar. Biol. 2016, 163, 92. [Google Scholar] [CrossRef]
Figure 1. Distribution and sampling location of O. lacepedii and O. rebecca. The information on the natural distribution of two eel gobies was recompiled from Tang (2010) [24] with additional information from other authors: Lü (2023) [25]; Murdy (2003) [26]; Liu (2016) [27].
Cimb 46 00012 g001
Figure 2. The number of differentially expressed genes (DEGs) in the brain, gills, and liver tissues of O. lacepedii and O. rebecca under different cold stress compared with the control groups (11-vs-23 °C, 15-vs-23 °C). (a) Number of DEGs in O. lacepedii under different cold stresses; (b) Venn diagram of the DEGs identified in the brain, gills, and liver tissues of O. lacepedii under cold stress (11 °C and 15 °C) compared to the control (23 °C); (c) Number of DEGs in O. rebecca under different cold stresses; (d) Venn diagram of the DEGs identified in the brain, gills, and liver tissues of O. rebecca under cold stress (11 °C and 15 °C) compared to the control (23 °C); The quantity of up and down-regulated genes were indicated by dark purple and red column, respectively, in the figure. L-B, L-G, and L-L represent the brain, gill, and liver tissues of O. lacepedii; R-B, R-G, and R-L represent the brain, gill, and liver tissue of O. rebecca; 11,15, 23 represent 11 °C, 15 °C, and 23 °C, respectively.
Cimb 46 00012 g002
Figure 3. Heat map displaying the distinct gene expression patterns across various temperatures and species. Each row represents a unique gene, and each column represents a unique sample. The number represents different clusters. (a) DEGs identified in the brain tissues under cold stress are divided into 12 clusters based on their divergent expression profiles between the two species; (b) DEGs identified in the gill tissues under cold stress are divided into 12 clusters according to their divergent expression profiles between the two species; (c) DEGs identified in the liver tissues under cold stress are divided into nine clusters according to their divergent expression profiles between the two species. L-B, L-G, and L-L represent the brain, gill, and liver tissues of O. lacepedii; R-B, R-G, and R-L represent the brain, gill and liver tissue of O. rebecca; 11, 15, 23 represent 11 °C, 15 °C, and 23 °C, respectively.
Cimb 46 00012 g003
Figure 4. DEGs in three tissues that showing distinct expression profiles between the two species. (a) DEGs in the brain tissues that show distinct expression profiles between the two species. (b) DEGs in the gill tissues that show distinct expression profiles between the two species. (c) DEGs in the liver tissues that show distinct expression profiles between the two species. Dynamic gene expression profiles (gray lines) are depicted based on relative gene expression levels of individual genes at the three temperatures. Median values are used to generate a representative trend line in brain (red), gill (blue), and liver (green) tissues. Genes in these clusters show distinct expression profiles across species, both in terms of expression levels and responses to cold stress. In each graph, the labels on the x-axis from left to right designate samples from O. lacepedii (L) and O. rebecca (R) with 23, 15 and 11 represent control, cold stress at 15 °C, and 11 °C, respectively.
Cimb 46 00012 g004
Figure 5. A weighted gene co-expression network analysis of genes expressed in three tissues of O. lacepedii and O. rebecca. (a) Clustering dendrogram of genes expressed in tissues of O. lacepedii. (b) Clustering dendrogram of genes expressed in tissues of O. rebecca. (c) The boxplot of nine modules identified in O. lacepedii based on the fold change of their expression levels. (d) The boxplot of eight modules identified in O. rebecca based on the fold change of their expression levels. The blue and red colors of the box represent down-regulated and up-regulated modules, respectively.
Cimb 46 00012 g005
Figure 6. Network visualization of some hub genes (top 5% highest connectivity) shared between O. lacepedii and O. rebecca in cold-responsive modules. (a) Hub genes in O. lacepedii; (b) Hub genes in O. rebecca. Each colored node represents one hub gene in each module, with the name labeled. The size of the nodes represents the intramodular strength of connectivity, the higher the strength of the connectivity, the larger the size of the node. NA represents the gene without an annotation. The hub genes F2RL1, LIPT2, NDOR1, TTC36, MYH11, SCEL, and PROC were labeled with a green border color.
Cimb 46 00012 g006
Table 1. The CTmin values measured for O. lacepedii and O. rebecca.
SpeciesSample LocationsNumberBody Mass (g)CTmin (°C)
O. lacepediiQingdao, Shandong Province
(120°19′ E, 36°16′ N; 3.0–26.7 °C)
3076.96 ± 14.090.61 ± 1.23
O. rebeccaZhongshan, Guangdong Province
(113°36′ E, 22°30′ N; 16.9–29.9 °C)
3068.34 ± 9.489.57 ± 1.19
Note: 3.0–26.7 °C and 16.9–29.9 °C are the yearly average minimum–maximum surface water temperatures in Qingdao and Zhongshan coastal waters, respectively. These data are downloaded from the website of Bio-ORACLE https://www.bio-oracle.org/downloads-to-email.php?sent=1&name=pointpy%40163.com) (accessed on 1 September 2022) (data from 2000 to 2022).
Table 2. GO Enrichment for common DEGs observed across all three tissues of the two species under cold stresses compared with the control group (p value < 0.05).
GO IDDescriptionGeneRatioBgRatiop ValueCount
GO:0016051carbohydrate biosynthetic process3/4814/69961.05 × 10−43
GO:0006629lipid metabolic process7/48192/69962.98 × 10−47
GO:0008610lipid biosynthetic process4/4859/69966.73 × 10−44
GO:0007623circadian rhythm3/4810/69962.00 × 10−33
GO:0048511rhythmic process3/4810/69962.00 × 10−33
GO:0048523negative regulation of cellular process3/4869/69961.16 × 10−23
GO:0008654phospholipid biosynthetic process2/4825/69961.25 × 10−22
GO:0048519negative regulation of biological process3/4880/69961.72 × 10−23
GO:0005975carbohydrate metabolic process4/48162/69962.45 × 10−24
GO:0006886intracellular protein transport3/48107/69963.66 × 10−23
GO:0048522positive regulation of cellular process2/4849/69964.42 × 10−22
GO:0048518positive regulation of biological process2/4851/69964.75 × 10−22
Note: GeneRatio represents the ratio of the number of DEGs annotated in the GO term to the total number of DEGs. BgRatio represents the ratio of the number of background genes annotated in the GO term to the total number of background genes.
Disclaimer/Publisher’s Note: The statements, opinions and data contained in all publications are solely those of the individual author(s) and contributor(s) and not of MDPI and/or the editor(s). MDPI and/or the editor(s) disclaim responsibility for any injury to people or property resulting from any ideas, methods, instructions or products referred to in the content.

