Article

Downregulation of Splicing Factor PTBP1 Curtails FBXO5 Expression to Promote Cellular Senescence in Lung Adenocarcinoma

1
State Key Laboratory of Systems Medicine for Cancer, Shanghai Cancer Institute, Renji Hospital, Shanghai Jiao Tong University School of Medicine, Shanghai 200032, China
2
State Key Laboratory of Genetic Engineering, Collaborative Innovation Center of Genetics and Development, Human Phenome Institute, School of Life Sciences, Fudan University, Shanghai 200438, China
*
Author to whom correspondence should be addressed.
Curr. Issues Mol. Biol. 2024, 46(7), 7730-7744; https://doi.org/10.3390/cimb46070458
Submission received: 3 June 2024 / Revised: 8 July 2024 / Accepted: 16 July 2024 / Published: 19 July 2024
(This article belongs to the Special Issue RNA Sequencing Data Research on Ageing and Age-Related Diseases)

Abstract

:
Polypyrimidine tract-binding protein 1 (PTBP1) plays an essential role in splicing and post-transcriptional regulation. Moreover, PTBP1 has been implicated as a causal factor in tumorigenesis. However, the involvement of PTBP1 in cellular senescence, a key biological process in aging and cancer suppression, remains to be clarified. Here, it is shown that PTBP1 is associated with the facilitation of tumor growth and the prognosis in lung adenocarcinoma (LUAD). PTBP1 exhibited significantly increased expression in various cancer types including LUAD and showed consistently decreased expression in multiple cellular senescence models. Suppression of PTBP1 induced cellular senescence in LUAD cells. In terms of molecular mechanisms, the silencing of PTBP1 enhanced the skipping of exon 3 in F-box protein 5 (FBXO5), resulting in the generation of a less stable RNA splice variant, FBXO5-S, which subsequently reduces the overall FBXO5 expression. Additionally, downregulation of FBXO5 was found to induce senescence in LUAD. Collectively, these findings illustrate that PTBP1 possesses an oncogenic function in LUAD through inhibiting senescence, and that targeting aberrant splicing mediated by PTBP1 has therapeutic potential in cancer treatment.

1. Introduction

Lung cancer exhibits the highest global incidence and mortality rates among cancers, with lung adenocarcinoma (LUAD) being the most common histological type [1]. Despite significant advancements in therapeutic techniques and treatment modalities, challenges associated with the treatment of LUAD remain. Therefore, exploration of the underlying mechanisms is urgently needed to identify potential targets and establish theoretical foundations for drug design and clinical decision-making.
Cellular senescence is defined as a state in which cells exhibit an irreversible growth arrest due to various stressors such as DNA damage, oxidative stress, or telomere erosion, while still retaining metabolic activity that can modulate their microenvironment. Cellular senescence has a broad impact on maintaining tissue homeostasis and disease prevention, including neurodegenerative diseases, chronic inflammation, and tumor progression [2,3,4]. Typically, serving as an anti-tumorigenic barrier, cellular senescence inhibits the abnormal growth of cells that have sustained damage [5]. Senescent cells are characterized by several features, including increased activity of senescence-associated β-galactosidase (SA-β-Gal) [6] and the ability to release a wide range of bioactive compounds, known as the Senescence-Associated Secretory Phenotype (SASP), encompassing numerous signaling molecules [7]. In addition to changes in their chemical production, senescent cells experience morphogenesis as well. Generally, senescent cells are enlarged, flattened, and occasionally multinucleated [8]. The underlying mechanism of cellular senescence is widely believed to involve the p16-RB and p53-p21 tumor suppressor pathways [9]. These pathways play a crucial role in maintaining cellular homeostasis and in the prevention of tumorigenesis. p16INK4a is a tumor suppressor protein that plays a crucial role in cell cycle regulation. As organisms age, the expression of p16INK4a often increases, leading to a higher incidence of senescent cells. Therefore, p16INK4a is considered a biomarker of cellular aging and is associated with the aging process at the cellular level [10]. In the p16-RB pathway, p16INK4a inhibits the activity of cyclin-dependent kinases 4 and 6 (CDK4/6), preventing the cyclin D-dependent phosphorylation of the retinoblastoma protein (Rb), thereby maintaining Rb in its active, hypophosphorylated state. This prevents the cell cycle from progressing from the G1 to the S phase [11]. In the p53-p21 pathway, p53 is activated in response to DNA damage and upregulates its downstream target gene p21, which inhibits the activity of CDKs, leading to the activation of Rb and cell cycle arrest, thereby inducing cellular senescence [12]. However, there are many other mechanisms related to cellular senescence that require further investigation.
Alternative splicing (AS) is a regulated molecular mechanism that enables a single gene to produce a variety of mRNAs and proteins with potentially different cellular functions or properties. Approximately 95% of human genes undergo alternative splicing, which significantly expands the diversity within the transcriptome and proteome [13]. Dysfunctional alternative splicing leads to the emergence of various splicing variants and contributes to the regulation of a host of biological processes, including cell and tissue homeostasis and organ development [14,15,16,17,18]. Notably, in addition to transcriptional and epigenetic alterations, substantial alterations in alternative splicing are commonly observed during cellular senescence and tissue aging. Particularly, it has been suggested that dysregulation of splicing, due to changes in splicing factor expression, may contribute to the mechanisms underlying aging and senescence [19,20,21,22]. However, the exact mechanisms by which specific splicing factors influence senescence-related alternative splicing events and the ways in which their dysregulation may lead to cellular senescence have yet to be fully determined.
Polypyrimidine tract-binding protein 1 (PTBP1) plays a critical role in post-transcriptional gene regulation, affecting mRNA splicing, translation, stability, and cellular distribution [23,24,25]. PTBP1 has a diverse range of molecular functions in RNA metabolism and acts as a dominant negative regulator of alternative splicing, leading to exon skipping in various pre-mRNAs [26]. Interestingly, a recent study indicated that the direct knockdown of PTBP1 leads to particular attenuation of pro-inflammatory SASP factors in a variety of cell lines in vitro and in vivo, but functionally preserved oncogene-induced or therapy-induced senescence [23]. However, currently, the association between PTBP1 and cellular senescence is still unclear and warrants further investigation. Given the link between senescence and cancer, and given that insights into how PTBP1-related alternative splicing events modulate senescence in LUAD are currently limited, here, we consider whether the regulation of PTBP1 could influence senescence in LUAD patients.
In this study, we aimed to investigate the alternative splicing profile of PTBP1 in LUAD and assess its impact on cellular senescence progression, along with its downstream effectors. We focused on one of the top misspliced targets upon PTBP1 knockdown, FBXO5, a key regulator of cell cycle progression. Previous reports have mentioned two isoforms of FBXO5 [27], but the mechanisms behind their generation and their roles in different cancers remain to be explored, as does the regulatory effect of splicing factors on FBXO5. Here, we demonstrate that PTBP1 regulates the alternative splicing and expression of FBXO5, and that PTBP1 depletion leads to exon 3 skipping of FBXO5, which, in turn, downregulates FBXO5 and triggers cellular senescence in LUAD. Our study thus suggests that PTBP1 may act as a potential novel therapeutic target for senescence-mediated tumor suppression.

2. Materials and Methods

2.1. Bioinformatics Database Sources

RNA-Seq profiles from the Tumor Immune Estimation Resource (TIMER) (https://cistrome.shinyapps.io/timer/ (accessed on 2 January 2024)) were utilized to assess PTBP1 expression in 33 cancer types. The RNA-seq data of 542 LUAD samples and 59 normal samples were retrieved from the Gene Expression Profiling Interactive Analysis (GEPIA) (http://gepia.cancer-pku.cn (accessed on 22 March 2024)) for an in-depth exploration of gene characteristics and prognostic significance in LUAD. Additionally, the replicative senescence models (GSE63577) obtained from the GEO database (https://www.ncbi.nlm.nih.gov/geo (accessed on 10 September 2023)) provided insights into the mRNA profile of PTBP1 during senescence.

2.2. Cell Culture and Transfection

The HEK293T cell line was cultured in Dulbecco’s modified Eagle’s medium (DMEM) supplemented with 10% fetal bovine serum (FBS). A549 and H1299 cell lines were cultivated in RPMI-1640 medium supplemented with 10% FBS. All cultures were incubated at a standardized 37 °C and in a 5% CO2 atmosphere. Cells were seeded onto 6-well or 12-well plates at 70–80% confluency for subsequent experiments. Stable knockdown of PTBP1 and FBXO5 in these cell lines was performed using lentiviral short hairpin RNA (shRNA). The sequences of shRNA are shown in Table 1. pLkO.1 was used as the control plasmid. Lentiviral particles were generated by co-transfecting HEK293T cells at 80% confluence in a 10 cm dish with a lentiviral vector (20 μg, pLVX: PxpAx2: PMD2g = 4:3:1:) at 37 °C for 48 h using Lip2000 (Invitrogen, Waltham, MA, USA). A549 and H1299 cells were infected with lentiviral particles, followed by drug selection (2 μg/mL puromycin for 3–5 days).

2.3. RNA Isolation and Quantitative Real-Time PCR Analysis

Total RNA was extracted from A549 and H1299 cell lines using an EZ-press RNA Purification Kit (EZBioscience, Roseville, MN, USA). Subsequent cDNA synthesis was performed with a Color Reverse Transcription Kit (EZBioscience, USA). Quantitative Real-Time PCR (RT-qPCR) was conducted on a LightCycler 480 Real-Time PCR System (Roche Applied Science, Indianapolis, IN, USA) using SYBR qPCR Master Mix (EZBioscience, USA), in accordance with the manufacturer’s instructions. The mRNA levels of target genes were normalized to the GAPDH gene. Reverse transcription-PCR (RT-PCR) was used to evaluate the mRNA levels of transcripts of target genes using 2 × Taq Master Mix (Dye Plus) (Vazyme, Nanjing, China). Primer information for RT-qPCR and RT-PCR is provided in Table 2.

2.4. Western Blot Analysis

Cells were lysed in RIPA buffer containing phosphatase and protease inhibitors. Protein quantification was conducted using a BCA Protein Assay Kit (P0012, Beyotime Biotechnology, Shanghai, China). Quantified cell lysates were separated by 10–15% SDS-PAGE and transferred to PVDF membrane, and they were then blocked with 5% BSA. Overnight incubation with primary antibodies was conducted at 4 °C, employing rabbit anti-PTBP1 (1:1000, D225103-0025, Sangon Biotech, Shanghai, China), rabbit anti-FBXO5 (1:1000, 10872-1-AP, Proteintech, San Diego, CA, USA), and anti-GAPDH (1:1000, HRP-60004, Proteintech). After incubation with HRP-linked secondary antibodies, protein detection was performed using enhanced chemiluminescence (Bio-Rad, Hercules, CA, USA).

2.5. SA-β-Gal Staining

According to the manufacturer’s protocol of a senescence-associated β-galactosidase kit (C0602, Beyotime Biotechnology, Shanghai, China), cells seeded in 12-well plates were washed twice with PBS and fixed in 4% paraformaldehyde for 15 min. Cells were then incubated overnight with the working solution of β-galactosidase plus X-Gal at 37 °C followed by three washes with PBS.

2.6. Cell Proliferation and Colony Formation Assay

The cell proliferation rate was assayed using a Cell Counting Kit-8 (CCK-8) (Dojindo, Kumamoto, Japan). Briefly, cells were transplanted into 96-well plates with 100 μL culture medium and at least 2000 cells per well at 37 °C for 72 h. Then, 10 μL of CCK-8 solution was added to each well and incubated at 37 °C for 2 h, and the OD value of each well was determined by a microplate reader (BioTEK, Winooski, VT, USA). This measurement was performed every 24 h and a cell growth curve was drawn according to the absorbance value at each time point. For each well in a 6-well plate, 2 mL complete medium containing 200 cells was prepared. After culturing cells at 37 °C with 5% CO2 for 14 days, the supernatant was discarded and the plate was washed three times with PBS. Crystal violet (0.1%, Solarbio) was used to stain colonies, and the number of colonies was counted by Image J (version 2.3.0).

2.7. Cell Migration Assay

Cell migration was assessed using a 24-well transwell plate with an 8 μm pore size (Corning Life Sciences, Corning, NY, USA), in accordance with the manufacturer’s protocol. The upper compartment of the transwell filter was seeded with cells at a density of 5 × 10⁴ cells per well, using a medium that was fortified with 1% FBS. Medium containing 10% FBS was added to the lower plate. Following incubation for 24 h, the cells that had traversed to the lower filter were fixed in 4% paraformaldehyde, washed with PBS, stained using 1% crystal violet, and enumerated microscopically. Each experiment was repeated three times.

2.8. Cell Cycle Flow Cytometric Analysis

Cells were harvested and fixed in 70% ethanol at 4 °C overnight. According to the manufacturer’s protocol (BD pharmingen, San Diego, CA, USA), these fixed cells were incubated with PI/RNase Staining Buffer for 30 min at 37 °C in the dark after washing with PBS. The cellular DNA content was then quantified by flow cytometry (BD Biosciences, Milpitas, CA, USA). Analysis of the cell cycle distribution was conducted using ModFit 3.0.

2.9. mRNA Stability Assay

Cells were treated with 10 μg/mL Actinomycin D (ActD) for 0, 2, 4, 6, and 8 h, then harvested at each respective time point. RNA was extracted from these samples and subsequently reverse-transcribed into cDNA. The mRNA levels of two splice isoforms, FBXO5-L and FBXO5-S, were quantified using RT-qPCR. Primer information is provided in Table 2.

2.10. RNA-seq and Bioinformatics Analysis Methods

PTBP1 knockdown A549 cells were applied followed by RNA sequencing. RNA-seq libraries for transcriptome-wide analysis were constructed according to the established methods [28,29]. RNA-seq libraries were sequenced using an Illumina HiSeq platform (San Diego, CA, USA). STAR [30] was used for mapping RNA-seq reads to human genome GRCh37 (https://github.com/alexdobin/STAR, accessed on 2 June 2024), and StringTie [31] was used for transcript assembly and quantification. rMATS [32] was used to analyze changes in alternative splicing including skipped exon (SE), mutually exclusive exon (MXE), alternative 3′ splice sites (A3SS), alternative 5′ splice site (A5SS), and intron retention (IR) in PTBP1 knockdown A549 cells. The DESeq2 package (Version 1.26.0) was employed to identify the differentially expressed genes (DEGs) between PTBP1-high and PTBP1-low patients from TCGA datasets. The cut-off threshold was a |log fold change (FC)| ≥ 0.5 and adjusted p-value < 0.05. Pathway enrichment analysis in this study was performed using the Database for Annotation, Visualization, and Integrated Discovery (DAVID) [33].

2.11. Statistical Analysis

Experimental data were analyzed using GraphPad Prism 8.3.0 software. Results are presented as the mean ± SD (n = 3). Differences between two groups were evaluated using an unpaired t-test. A p-value < 0.05 indicated statistical significance. * represents p < 0.05; ** represents p < 0.01; *** represents p < 0.001.

3. Results

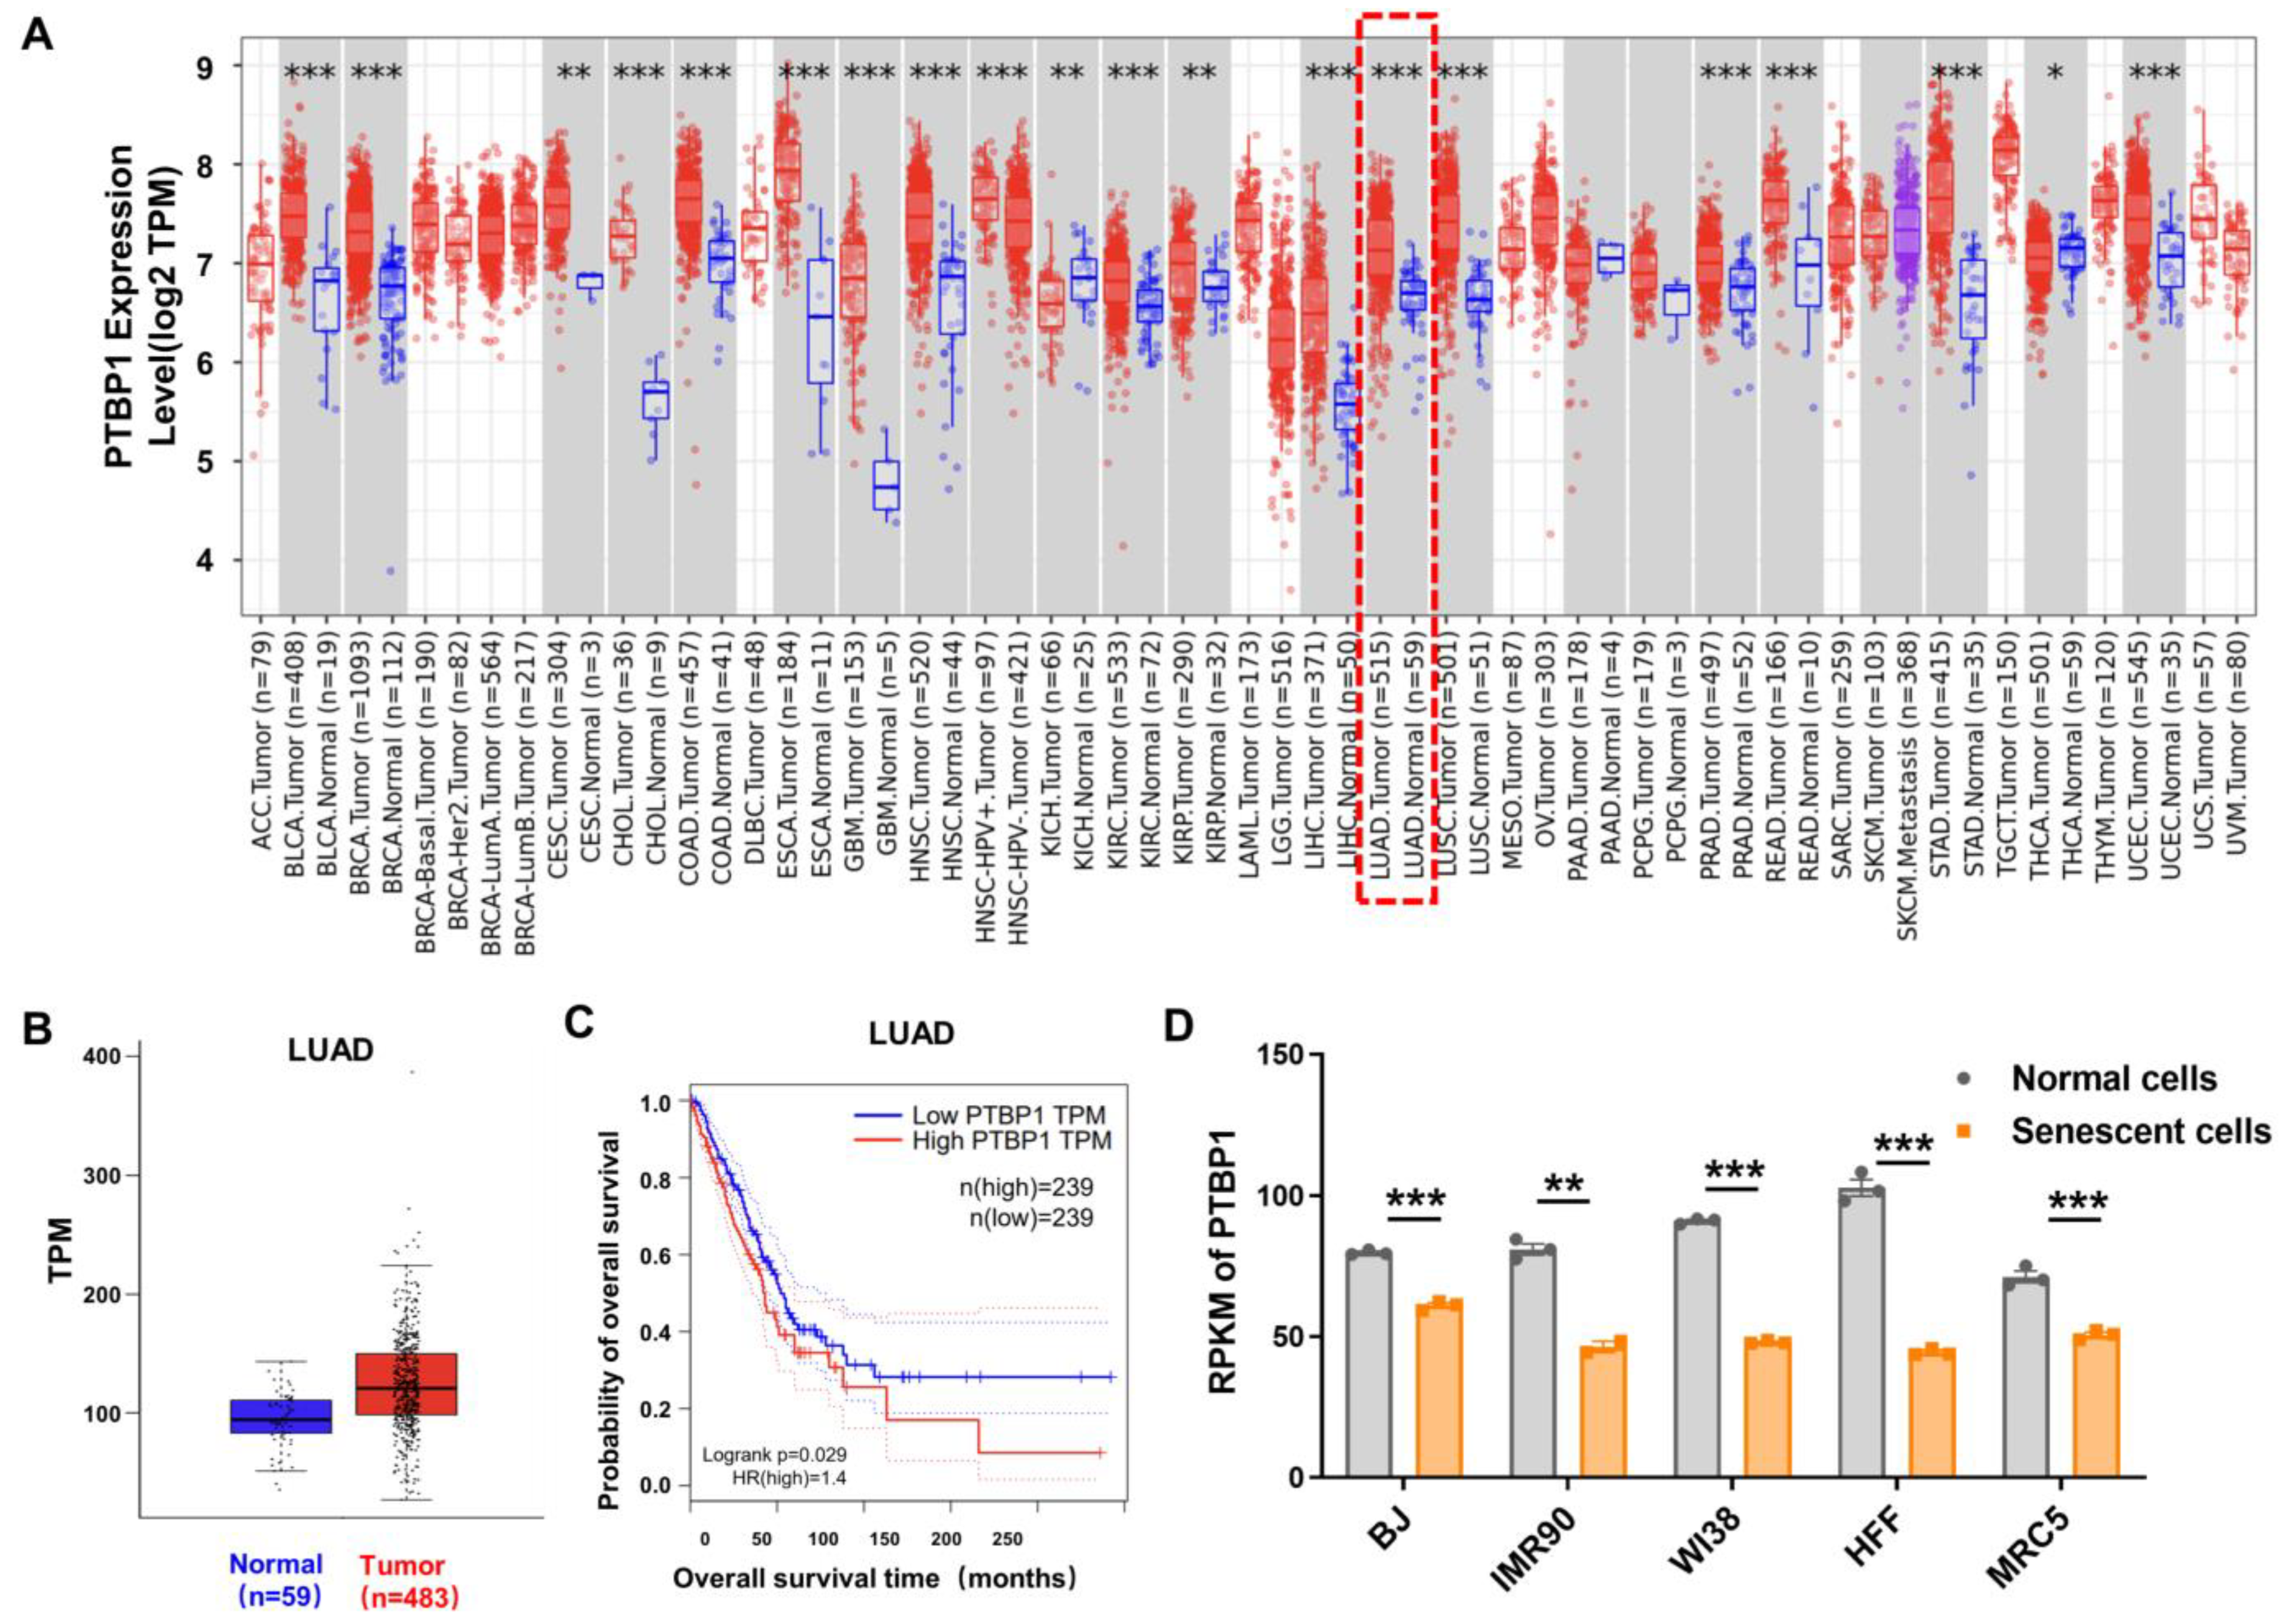
3.1. Opposite Levels of PTBP1 in LUAD and Cellular Senescence

To systematically elucidate the expression pattern of the splicing factor PTBP1 in cancers, we first analyzed the expression of PTBP1 in 33 types of cancers based on the TIMER database. The results showed that the level of PTBP1 was significantly increased in distinct tumors including LUAD (Figure 1A), suggesting that PTBP1 may play an oncogenic role in tumor development. Further comparative analysis using the GEPIA database revealed a pronounced upregulation of PTBP1 in samples of LUAD compared to non-cancerous pulmonary tissue, and higher PTBP1 levels were also associated with lower survival rates of LUAD patients (Figure 1B,C).
Given the well-established significance of cellular senescence in cancer pathogenesis, we analyzed five replicative senescent human cell lines (BJ, IMR90, WI38, HFF, and MRC5) from the GSE63577 dataset. The senescent cells exhibited a discernible reduction in PTBP1 expression (Figure 1D). Taken together, these data showed that PTBP1 had an opposite expression trend in LUAD and cellular senescence, implying that PTBP1 may affect the pathogenesis of LUAD by modulating cellular senescence.

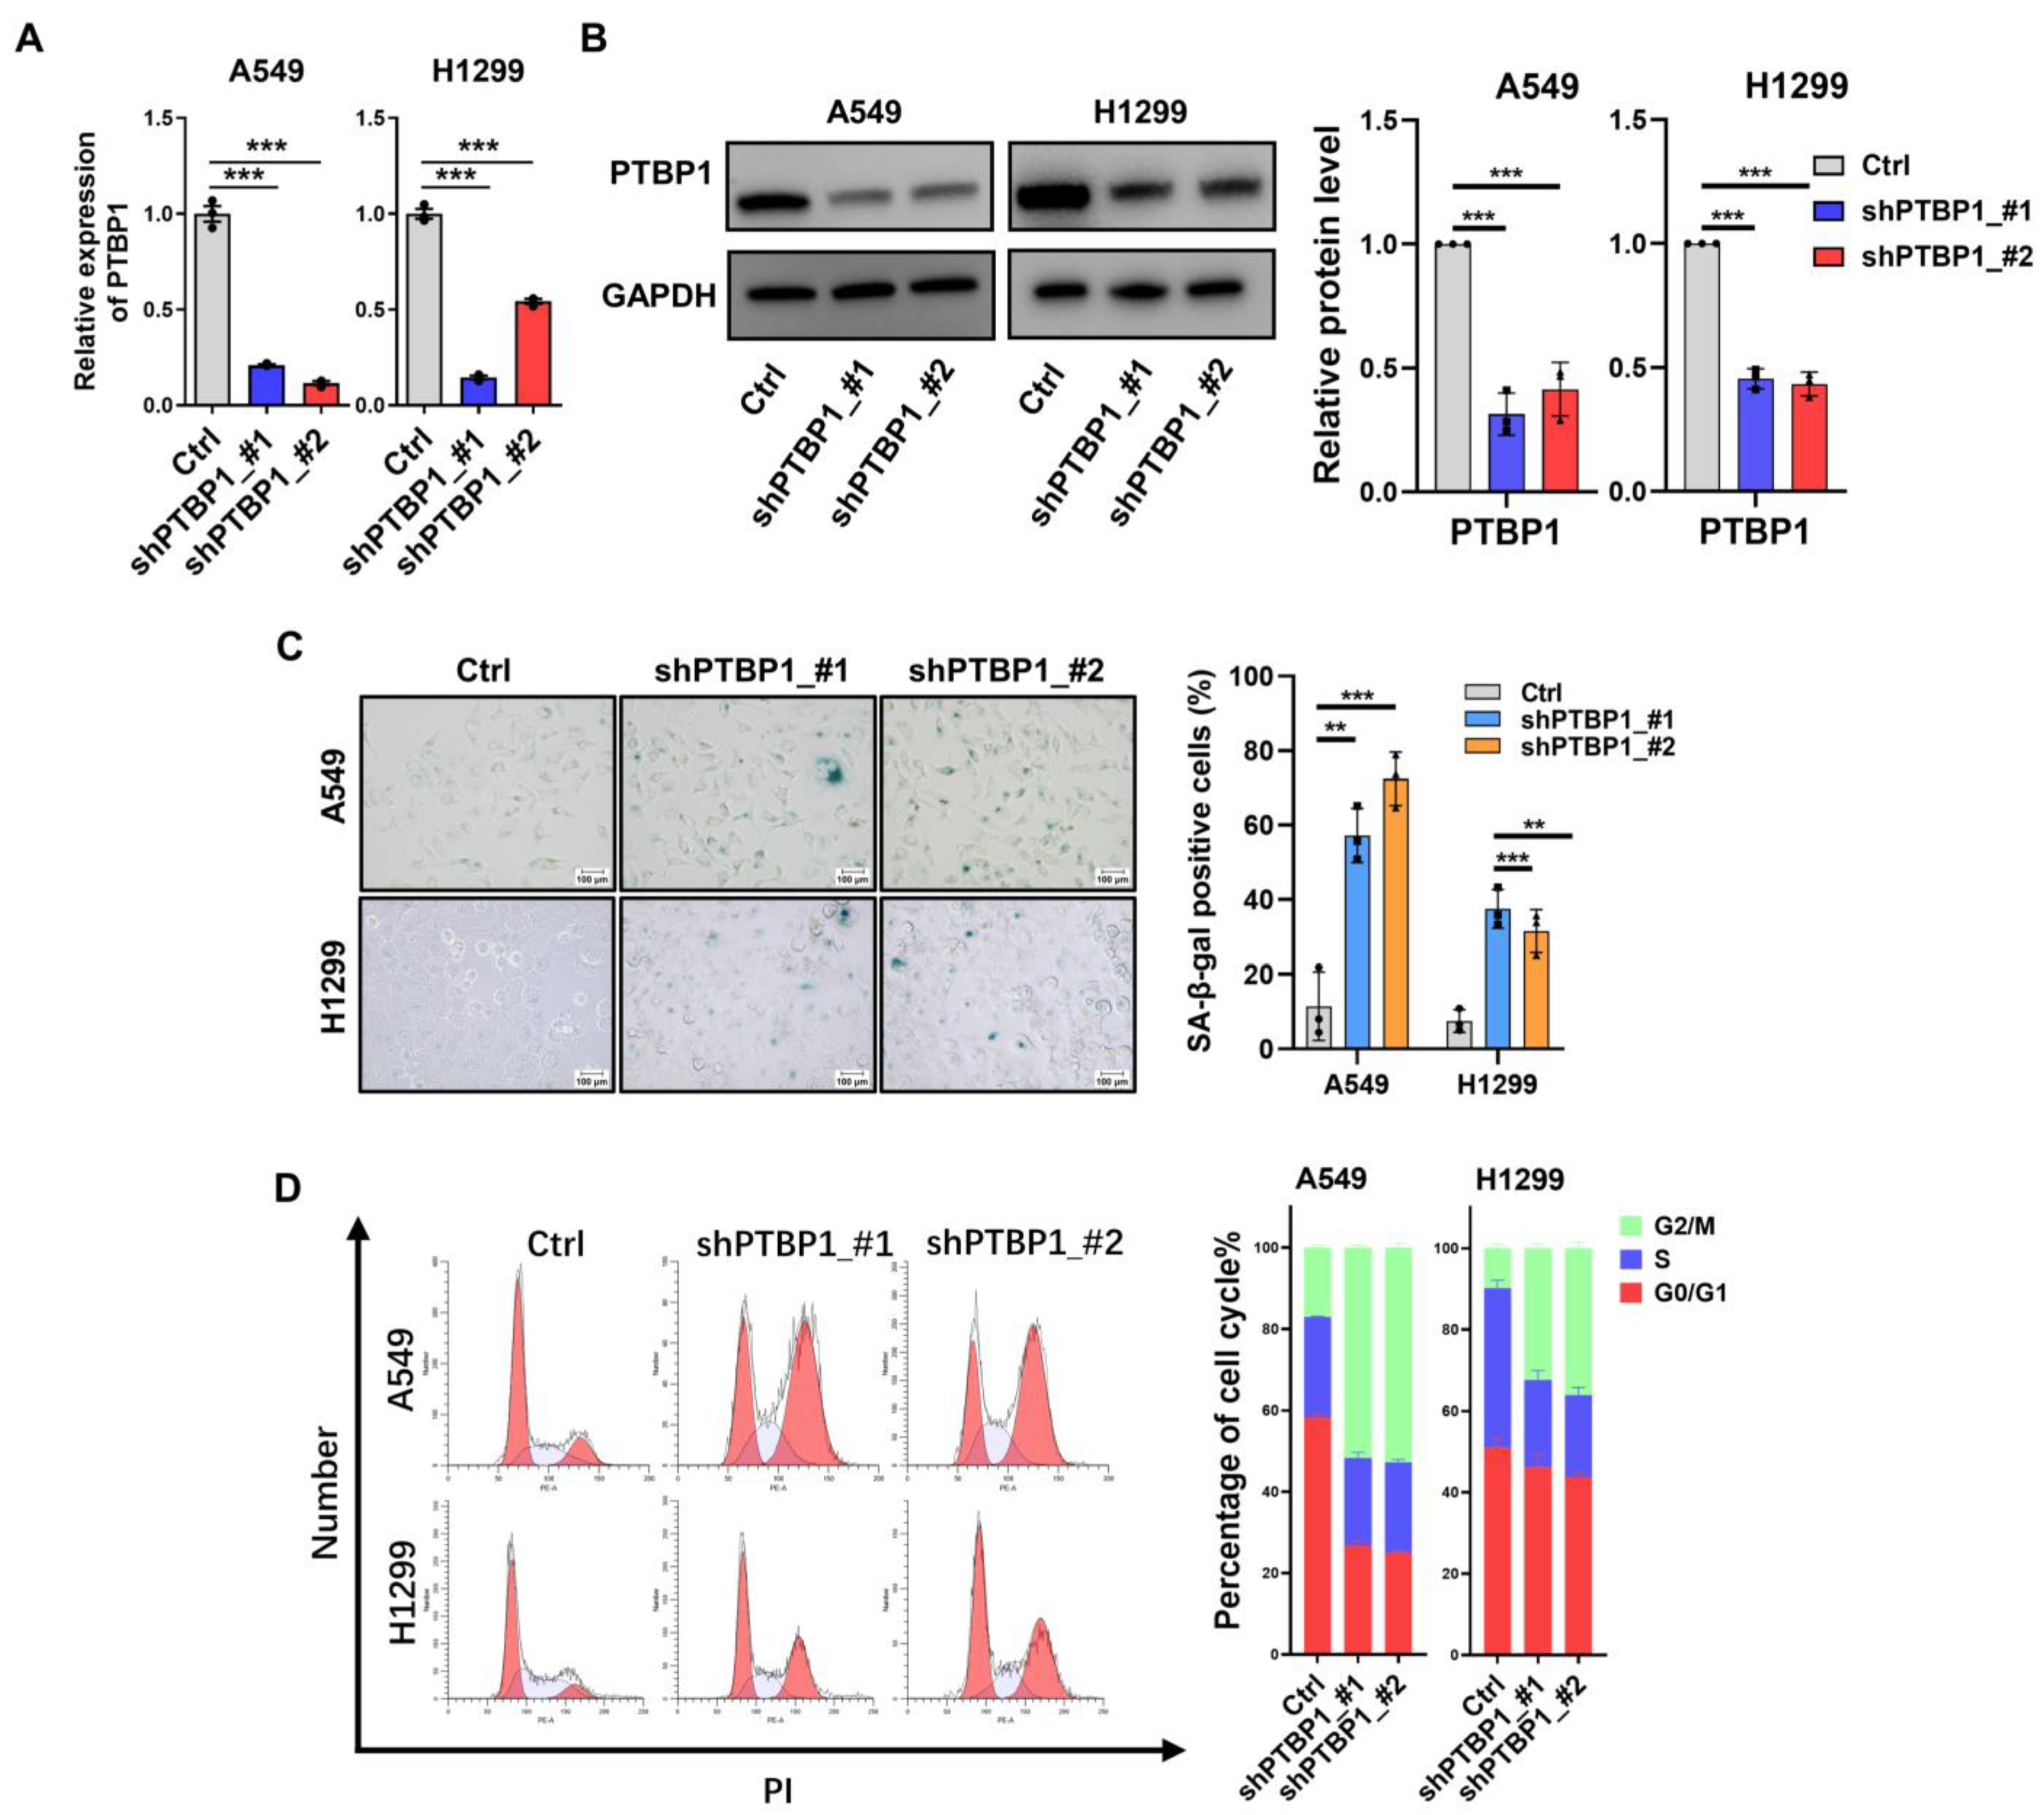
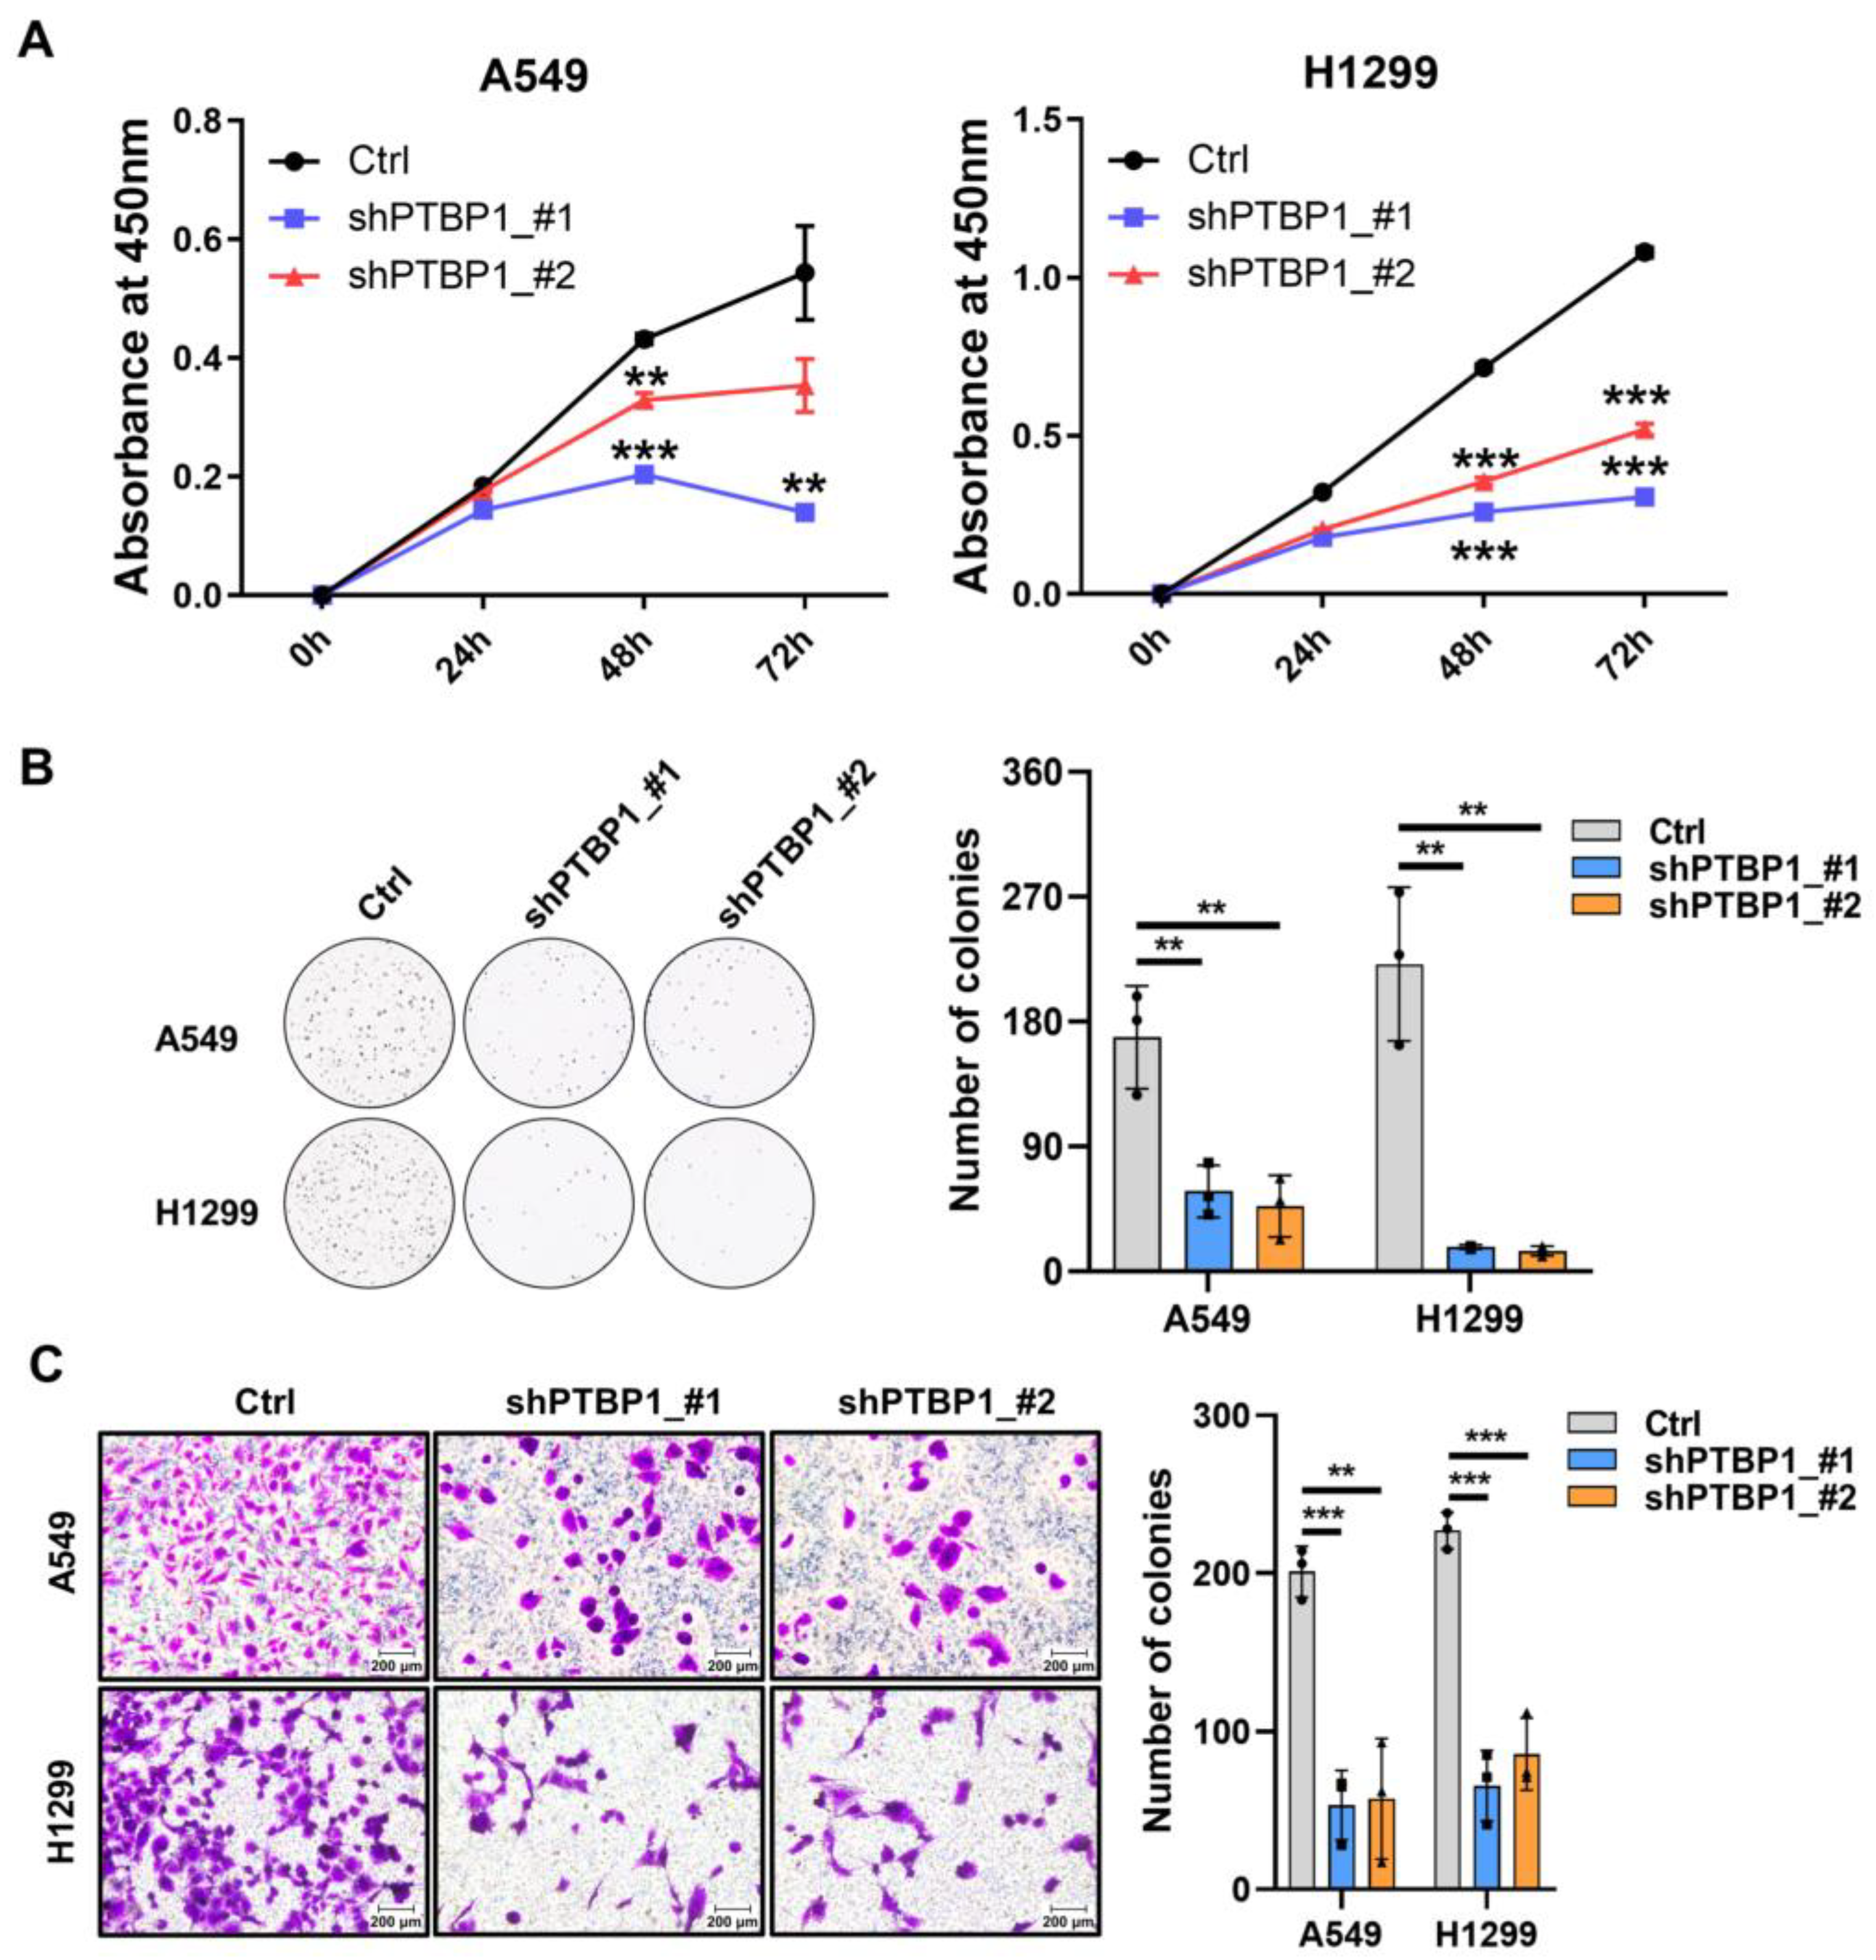
3.2. Downregulation of PTBP1 Induces Senescence in LUAD Cells

To investigate the role of PTBP1 in LUAD and senescence, we implemented a loss-of-function strategy by transfecting A549 and H1299 cell lines with two targeted shRNAs against PTBP1 (shPTBP1_#1 and shPTBP1_#2). The reduction in PTBP1 mRNA and protein levels within these cancer cell lines was demonstrated and confirmed by RT-qPCR and Western blot analyses (Figure 2A,B). Further phenotypic analyses revealed that PTBP1 knockdown (PTBP1-KD) cells displayed diminished proliferative and migratory properties (Figure 3A–C). As anticipated, SA-β-Gal staining increased in PTBP1-KD cells (Figure 2C). Additionally, an increase in the number of cells in the G2/M phase accompanied by a reduction in the G1 phase was observed following PTBP1 knockdown, suggesting that PTBP1 silencing could induce cell cycle arrest in the G2/M phase (Figure 2D). Collectively, these outcomes suggest that PTBP1 is a critical regulator of senescence-associated phenotypes in LUAD cells.

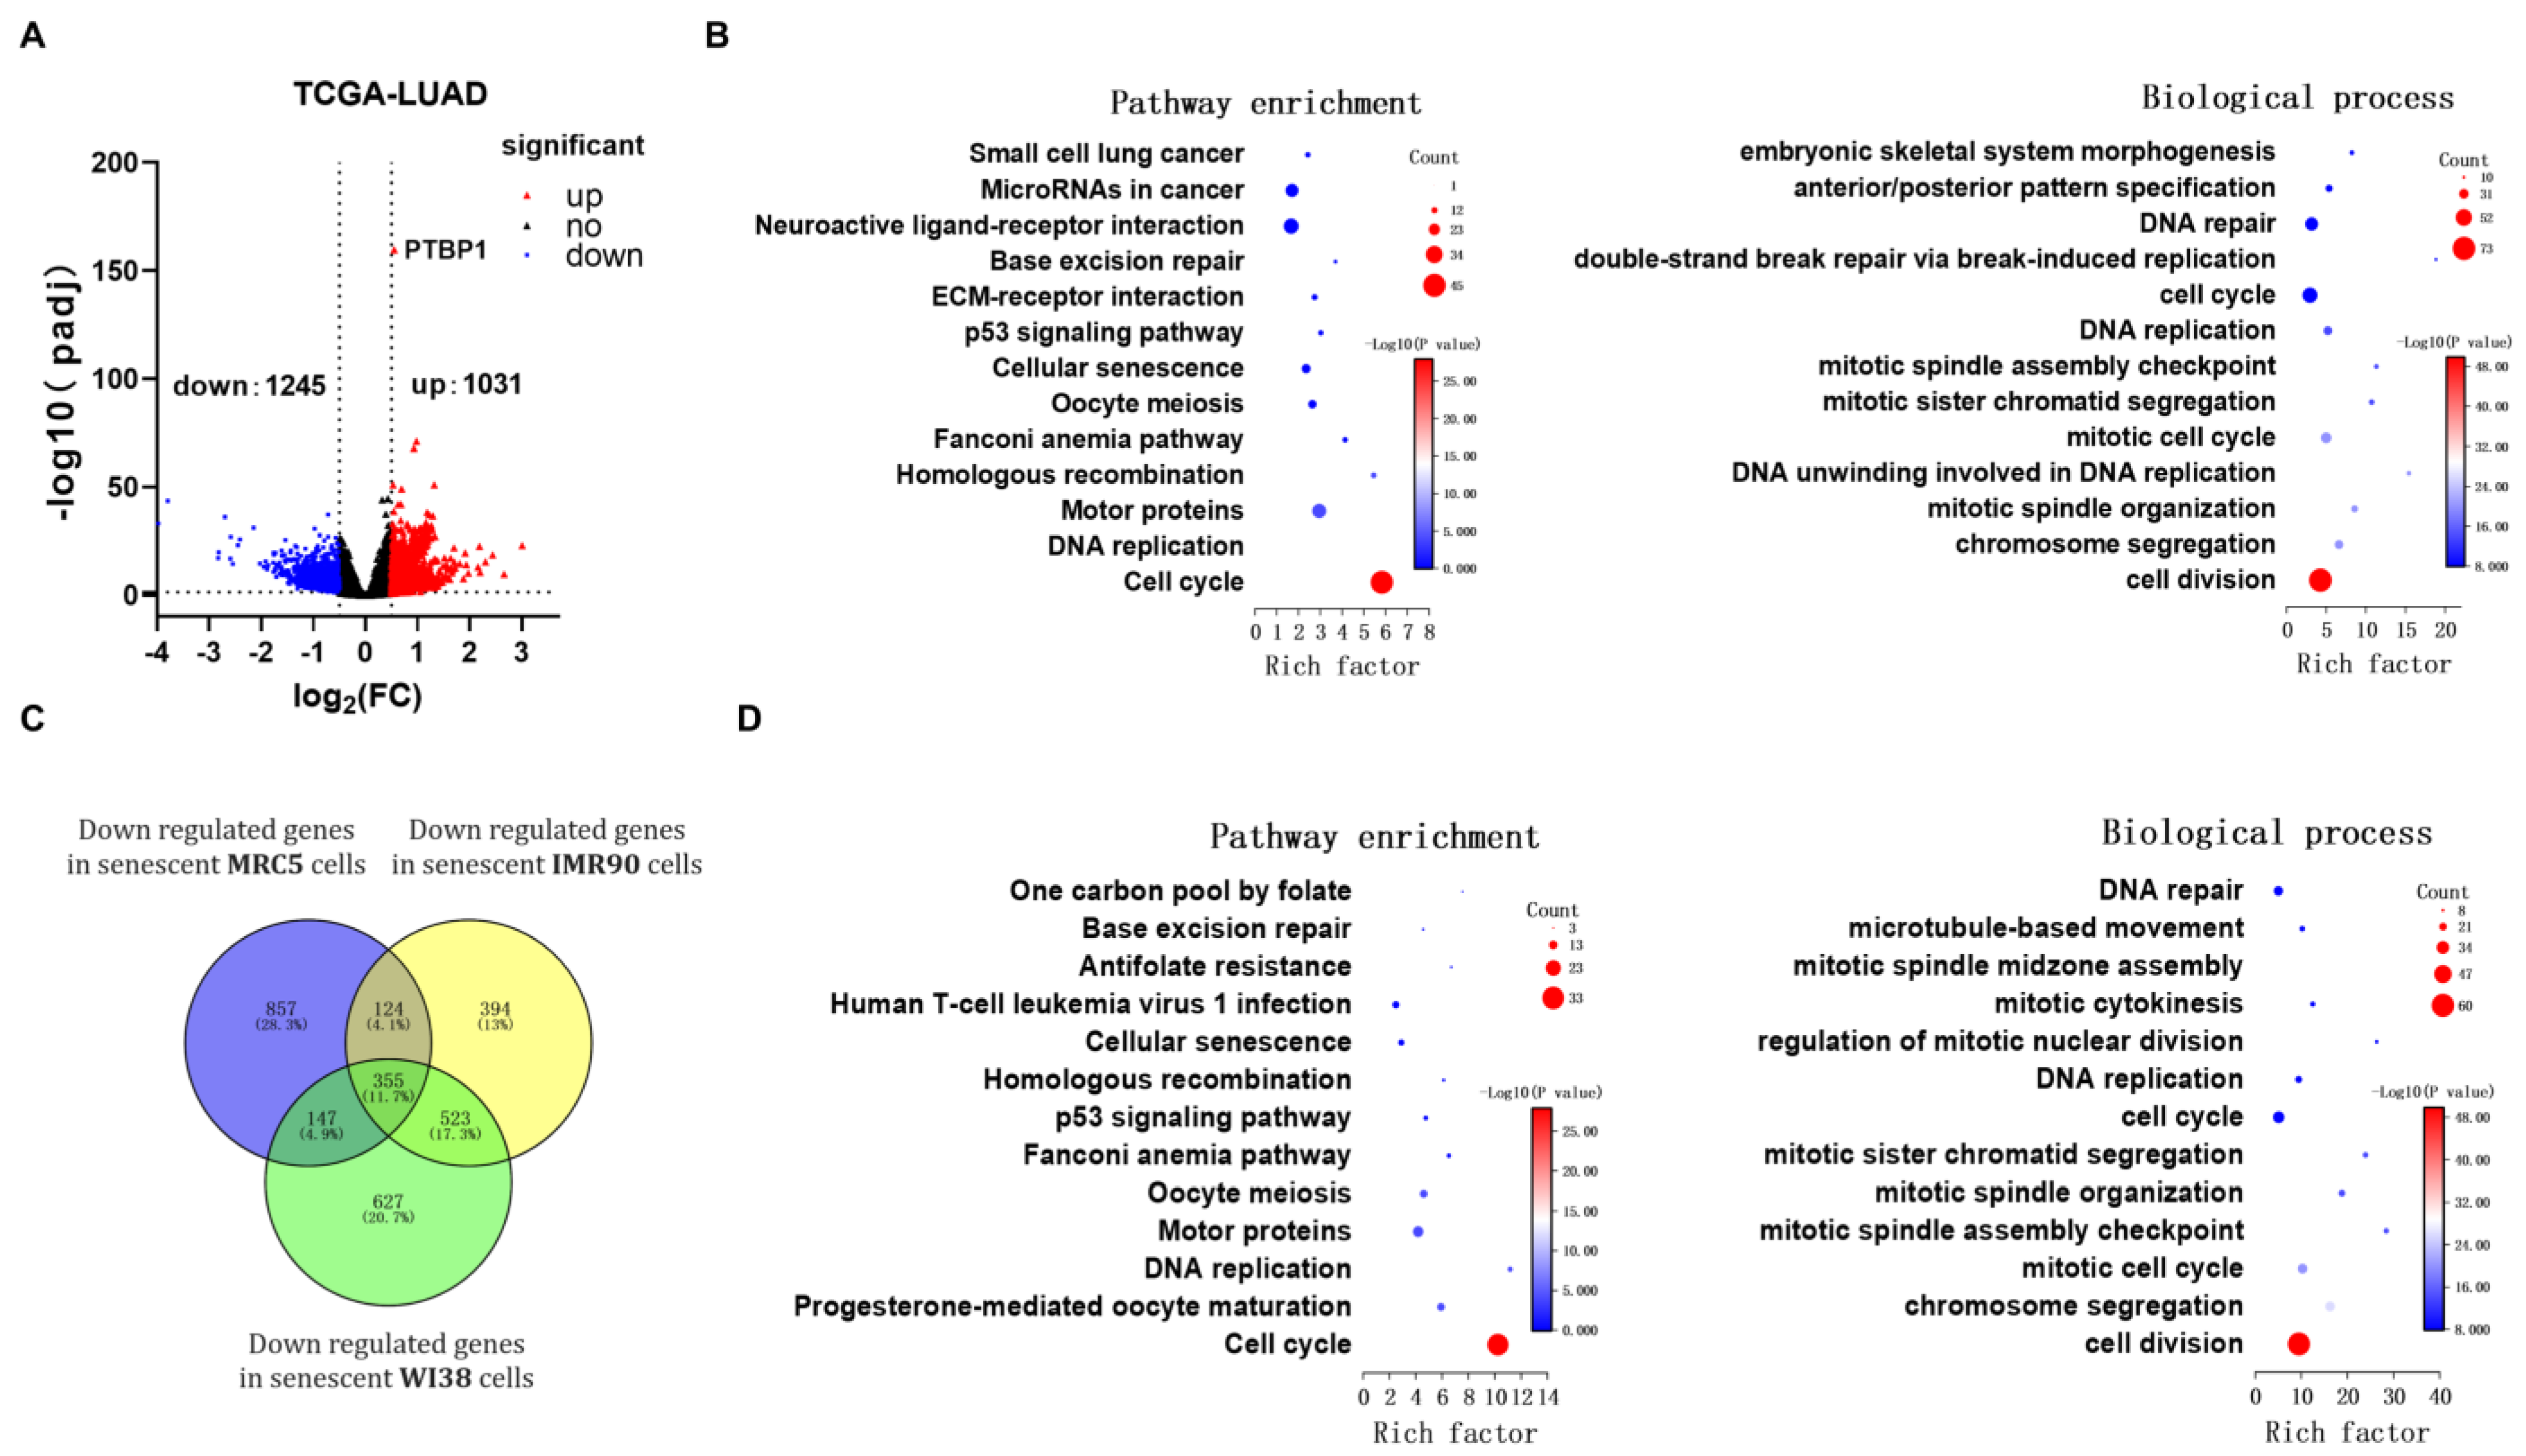
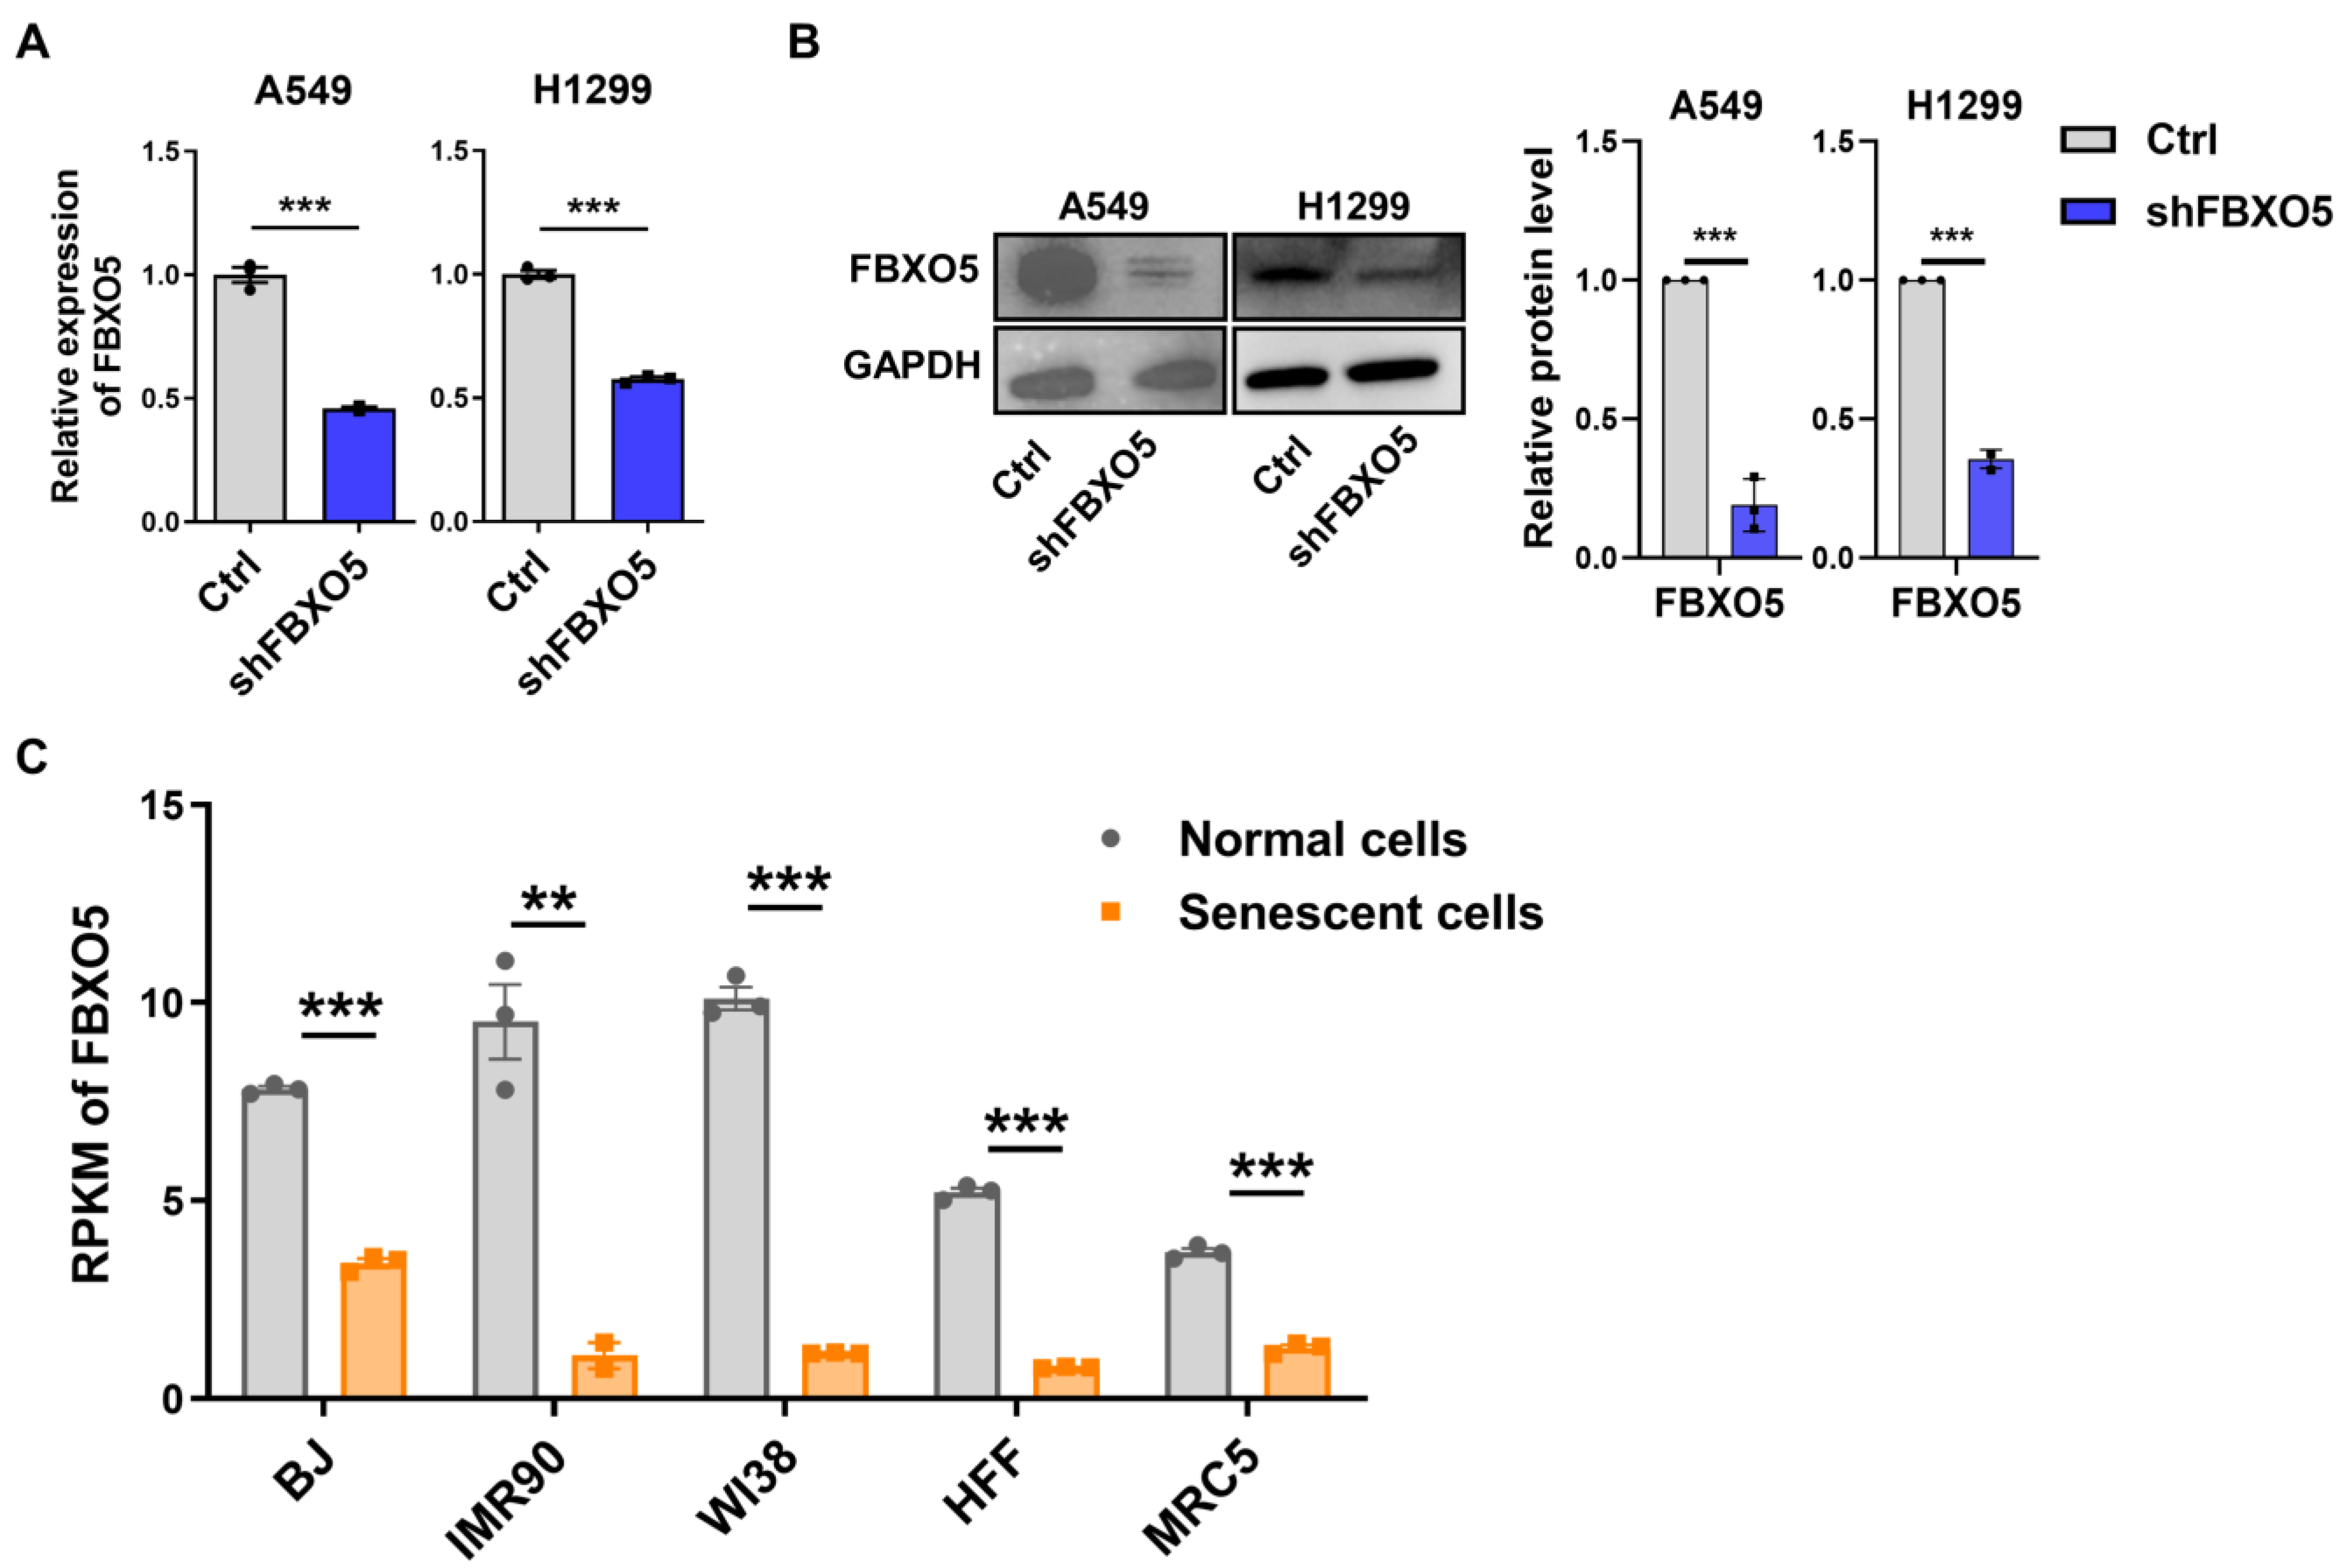
3.3. PTBP1 Regulates Expression of Cell Cycle Related Gene FBXO5 Via Alternative Splicing

To study the mechanism by which PTBP1 induces LUAD cells’ senescence, we first explored PTBP1-associated genes in LUAD and senescence based on TCGA and GEO datasets. We examined the differentially expressed genes (DEGs) between PTBP1-high and PTBP1-low patients in TCGA-LUAD, which were stratified based on the median PTBP1 mRNA level. We found that 2276 mRNAs (1031 upregulated and 1245 downregulated) were differently expressed in PTBP1-high patients compared to PTBP1-low ones (Figure 4A). We performed KEGG pathway analysis and GO enrichment analysis on PTBP1 upregulated genes in the TCGA-LUAD dataset. KEGG pathway analysis revealed that the most enriched genes are associated with the cell cycle and DNA replication. And the most significantly enriched GO terms were related to cell division and chromosome segregation, which aligned with the KEGG enrichment results (Figure 4B). Meanwhile, to further investigate senescence-related pathways, we performed functional enrichment analysis of 355 universally underexpressed genes across replicative senescence cell lines of three types of human embryonic lung fibroblasts: MRC5, IMR90, and WI38 (Figure 4C). KEGG enrichment analysis indicated that the target genes were primarily associated with the cell cycle, and the main terms of the GO analysis involved cell division, which was consistent with the PTBP1-related pathway (Figure 4D). This indicated that PTBP1 might function in cellular senescence by regulating cell-cycle-related genes.
As PTBP1 is a member of a splicing factor family, the splicing changes in its target genes may help explain PTBP1-KD-induced senescence. Accordingly, we next analyzed the alternative splicing patterns affected by PTBP1 using RNA-seq. We identified 756 alternative splicing events in PTBP1-KD A549 cells compared to control ones by analyzing the RNA-seq data with rMATS (Figure 5A). Subsequently, to identify genes related to the cell cycle that are affected by PTBP1 through its influence on alternative splicing, we took genes from the intersection of alternative splicing events identified in PTBP1-KD A549 cells and genes involved in the cell cycle pathway. The green circle represents differential alternative splicing events. The blue and yellow circles represent genes positively correlated with PTBP1 expression in TCGA-LUAD samples and genes downregulated during replicative senescence in three human embryonic lung fibroblasts (MRC5, IMR90, and WI38) that are involved in the cell cycle pathway from KEGG enrichment. Eventually, FBXO5 was selected as a candidate (Figure 5B).
FBXO5 (F-box protein 5), also known as Early Mitotic Inhibitor 1 (Emi1), plays an essential role in the cell cycle, particularly during mitosis. It is indispensable for the assembly of cyclins and the accumulation of cell cycle regulatory factors during the S and G2 phases [35,36]. PTBP1 depletion markedly decreased the mRNA and protein expression of FBXO5 through RT-qPCR and Western blotting in A549 and H1299 cells (Figure 5C,D). Additionally, knockdown of FBXO5 could induce senescence and G2/M-phase arrest in A549 and H1299 cells (Figure 5E,F and Figure 6A,B). FBXO5 also displayed decreased expression in five replicative senescence models we previously referenced (Figure 6C). These results suggest that FBXO5 might be a critical downstream target of PTBP1 in LUAD.

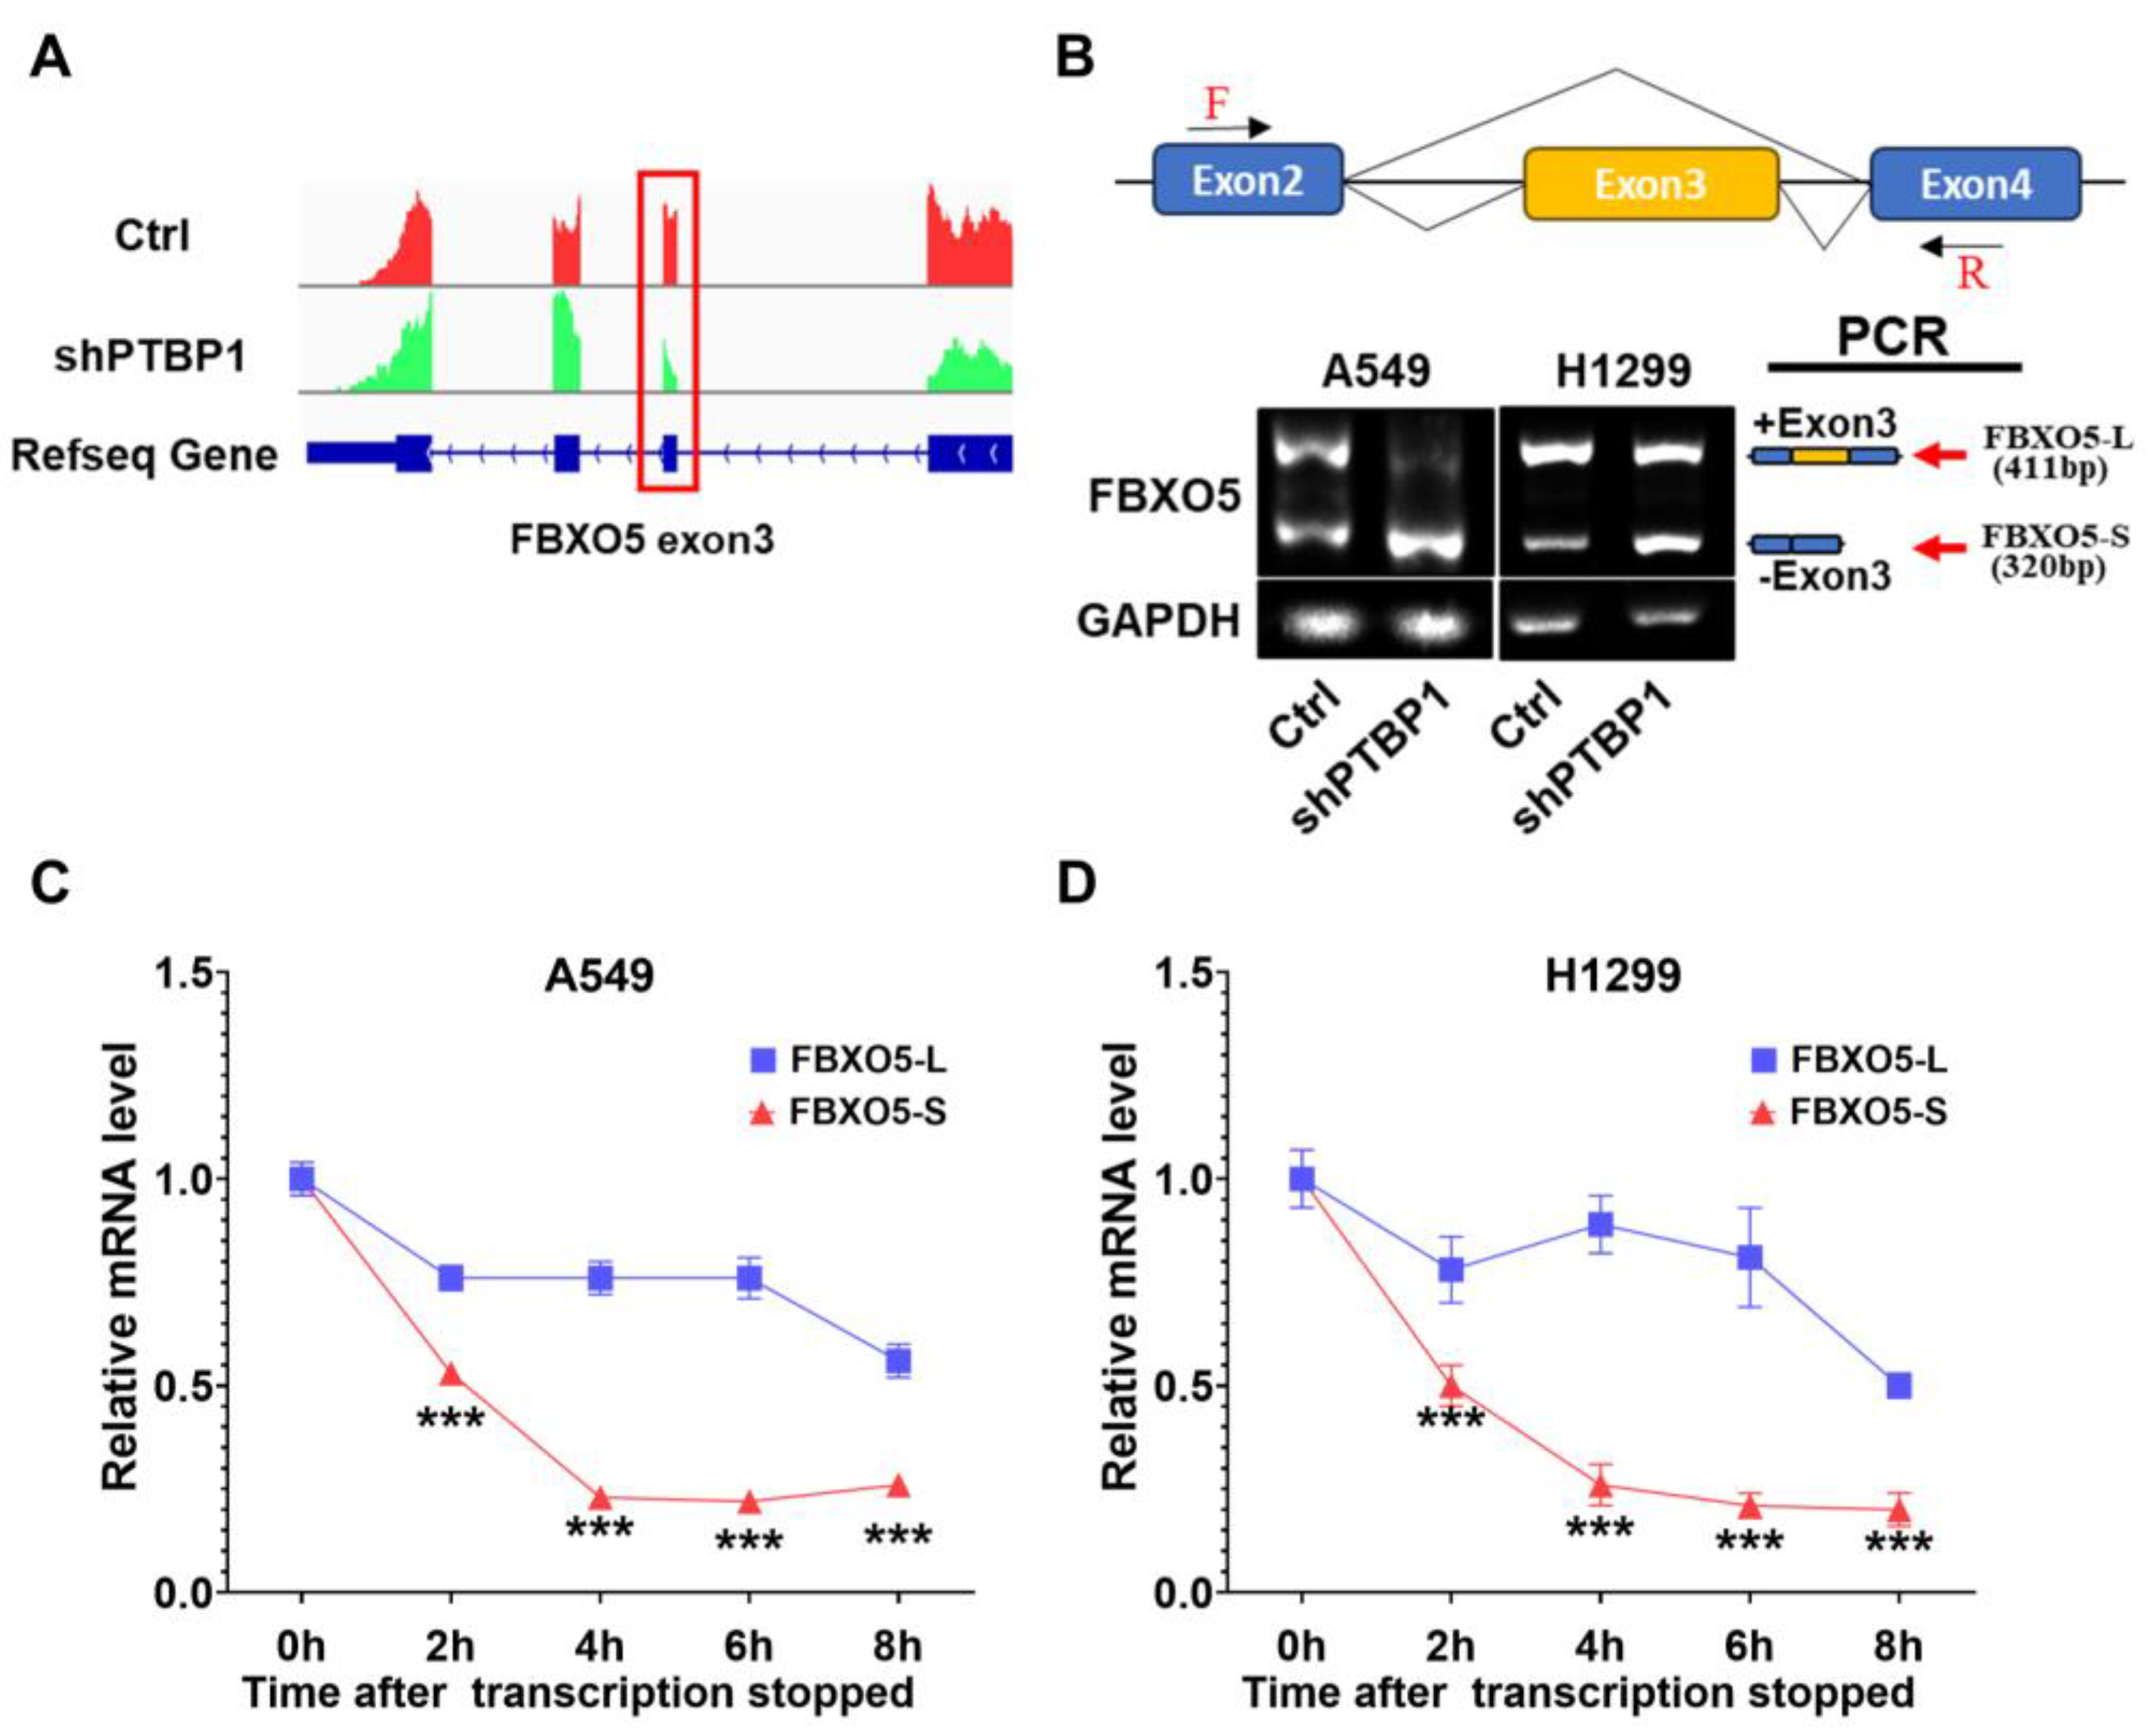
3.4. PTBP1 Mediates Exon 3 Skipping of FBXO5 Pre-mRNA in LUAD

After analyzing the alternative splicing pattern of FBXO5 in the RNA-seq data using the rMATS algorithm, we found that PTBP1 knockdown promoted exon 3 skipping to generate the short-length isoform of FBXO5 (FBXO5-S) relative to the full-length isoform of FBXO5 (FBXO5-L) (Figure 7A). We then validated the alternative splicing pattern of FBXO5 by RT-PCR using primers designed within exon 2 and exon 4 spanning exon 3 of FBXO5. The results showed that the level of FBXO5-S was increased after PTBP1 knockdown in A549 and H1299 cells (Figure 7B).
Although, as mentioned above, PTBP1 depletion markedly decreased the mRNA and protein expression of FBXO5, whether the reduced protein level could be attributed to faster RNA degradation or weakened translational efficiency was unclear. To answer this question, we performed an RNA stability assay and found that FBXO5-S had a significantly faster mRNA degradation rate compared to FBXO5-L in A549 and H1299 cells (Figure 7C,D), indicating that RNA stability may explain the reduced mRNA and protein levels of FBXO5. These data indicate that PTBP1 knockdown facilitated splicing of FBXO5 pre-mRNA into an unstable transcript.

4. Discussion

Investigating the tumor-related mechanisms of PTBP1 is essential, as dysregulation in its expression has been involved in disease promotion, including colorectal cancer invasion, breast and ovarian cancer cell growth, and Parkinson’s disease [37,38,39,40]. However, the influence of PTBP1 on cellular senescence remains to be elucidated. We found that PTBP1 exhibited prevalently increased expression in various cancer types and decreased expression in multiple cellular senescence models. Subsequently, we verified that elevated levels of PTBP1 are commonly observed and associated with a poor prognosis in patients with LUAD. Further research indicated that the depletion of PTBP1 triggered senescence and hindered LUAD progression.
A growing number of studies have identified that deregulated splicing factors lead to the formation of splice variants, including senescence-associated ones [41,42]. In this study, we revealed that the exon 3 skipping of FBXO5 was induced by knockdown of PTBP1 in LUAD cells. FBXO5 is an endogenous inhibitor of APC/C, which is initially synthesized during the G1-S transition, accumulated in the S and G2 phases, and ultimately degraded by the SCFβ-trcp pathway [36,43]. Evidence suggests that FBXO5 is involved in oncogenesis and the progression of various malignancies [44,45,46]. A study has pointed out that FBXO5 significantly influences the development and prognosis of lung squamous cell carcinoma (SqCC) [47]. Additionally, cluster statistical analysis revealed that FBXO5 expression is more pronounced in malignant tumors compared to benign tumors, indicating that there is a significant dysregulation of mitotic APC/C substrates in malignancies, which is absent in benign growths [48]. Two isoforms of FBXO5, transcript a and transcript b, have been reported to promote migration and osteogenic differentiation in human periodontal ligament mesenchymal stem cells [27]. However, the relationship between senescence-associated splice variants of FBXO5 and cellular senescence remains unclear. In our study, we demonstrate that depletion of PTBP1 induces exon 3 skipping in FBXO5, resulting in the generation of the unstable RNA splice variant FBXO5-S and the consequent reduction in FBXO5 expression. Although, in our study, the regulation of the transition between FBXO5-L and FBXO5-S by PTBP1 could be considered a cause of cellular senescence, the mechanisms underlying FBXO5’s influence on senescence warrant further investigation.
Cellular senescence, a critical process in aging and disease, is marked by indicators such as SA-β-Gal, SASP, P16, and P21 [49]. In our research, we found that knocking down PTBP1 increases SA-β-Gal staining, which is considered the gold standard for cellular aging. Intriguingly, PTBP1 has been identified as a regulator of alternative splicing for genes implicated in intracellular trafficking, including EXOC7, which is instrumental in controlling SASP expression. Targeting PTBP1 for inhibition is linked to a decreased risk of tumorigenesis and the attenuation of SASP’s pro-tumorigenic properties [23]. SASP factors are known for their dual role in both promoting and inhibiting tumorigenesis, depending on the context [7]. Consequently, the silencing of PTBP1 may induce cellular senescence and suppress the release of tumor-associated SASP, indicating that the repression of PTBP1 may exert an anti-tumorigenic effect by promoting senescence while deterring its cancer-promoting potential. Future studies will evaluate the potential role of PTBP1 in the influence of the tumor-promoting aspects of SASP in LUAD.

Author Contributions

Conceptualization, Q.J. and H.L.; methodology, Q.J., H.L., X.S., and Y.L.; validation, H.L.; formal analysis, H.L.; investigation, Q.J. and H.L.; resources, Q.J. and T.N.; data curation, H.L.; writing—original draft preparation, H.L.; writing—review and editing, Q.J., H.L., W.Q., and H.J.; visualization, Q.J. and H.L.; supervision, G.W., W.Q., and H.J.; project administration, Q.J.; funding acquisition, Q.J. and Y.L. All authors have read and agreed to the published version of the manuscript.

Funding

The research of the authors was funded by grants from the National Natural Science Foundation of China (82203449) and Shanghai Municipal Health Commission (20204Y0103).

Institutional Review Board Statement

Not applicable.

Informed Consent Statement

Not applicable.

Data Availability Statement

The GSE datasets were obtained from the GEO profiles section at https://www.ncbi.nlm.nih.gov (accessed on 10 September 2023).

Conflicts of Interest

The authors declare no conflict of interest.

References

  1. Siegel, R.L.; Miller, K.D.; Jemal, A. Cancer Statistics, 2020. CA Cancer J. Clin. 2020, 70, 7–30. [Google Scholar] [CrossRef]
  2. Soreq, L.; UK Brain Expression Consortium; North American Brain Expression Consortium; Rose, J.; Soreq, E.; Hardy, J.; Trabzuni, D.; Cookson, M.R.; Smith, C.; Ryten, M.; et al. Major Shifts in Glial Regional Identity Are a Transcriptional Hallmark of Human Brain Aging. Cell Rep. 2017, 18, 557–570. [Google Scholar]
  3. Li, X.; Ma, L. From Biological Aging to Functional Decline: Insights into Chronic Inflammation and Intrinsic Capacity. Ageing Res. Rev. 2024, 93, 102175. [Google Scholar] [CrossRef]
  4. Montégut, L.; López-Otín, C.; Kroemer, G. Aging and Cancer. Mol. Cancer 2024, 23, 106. [Google Scholar] [CrossRef]
  5. van Deursen, J.M. The Role of Senescent Cells in Ageing. Nature 2014, 509, 439–446. [Google Scholar] [CrossRef]
  6. Dimri, G.P.; Lee, X.; Basile, G.; Acosta, M.; Scott, G.; Roskelley, C.; Medrano, E.E.; Linskens, M.; Rubelj, I.; Pereira-Smith, O. A Biomarker That Identifies Senescent Human Cells in Culture and in Aging Skin in Vivo. Proc. Natl. Acad. Sci. USA 1995, 92, 9363–9367. [Google Scholar] [CrossRef]
  7. Faget, D.V.; Ren, Q.; Stewart, S.A. Unmasking Senescence: Context-Dependent Effects of SASP in Cancer. Nat. Rev. Cancer 2019, 19, 439–453. [Google Scholar] [CrossRef]
  8. Cho, K.A.; Ryu, S.J.; Oh, Y.S.; Park, J.H.; Lee, J.W.; Kim, H.-P.; Kim, K.T.; Jang, I.S.; Park, S.C. Morphological Adjustment of Senescent Cells by Modulating Caveolin-1 Status. J. Biol. Chem. 2004, 279, 42270–42278. [Google Scholar] [CrossRef]
  9. Gorgoulis, V.; Adams, P.D.; Alimonti, A.; Bennett, D.C.; Bischof, O.; Bishop, C.; Campisi, J.; Collado, M.; Evangelou, K.; Ferbeyre, G.; et al. Cellular Senescence: Defining a Path Forward. Cell 2019, 179, 813–827. [Google Scholar] [CrossRef]
  10. Takeuchi, S.; Takahashi, A.; Motoi, N.; Yoshimoto, S.; Tajima, T.; Yamakoshi, K.; Hirao, A.; Yanagi, S.; Fukami, K.; Ishikawa, Y.; et al. Intrinsic Cooperation between p16INK4a and p21Waf1/Cip1 in the Onset of Cellular Senescence and Tumor Suppression In Vivo. Cancer Res. 2010, 70, 9381–9390. [Google Scholar] [CrossRef]
  11. Ohtani, N.; Yamakoshi, K.; Takahashi, A.; Hara, E. The p16INK4a-RB Pathway: Molecular Link between Cellular Senescence and Tumor Suppression. J. Med. Investig. 2004, 51, 146–153. [Google Scholar] [CrossRef]
  12. Beauséjour, C.M.; Krtolica, A.; Galimi, F.; Narita, M.; Lowe, S.W.; Yaswen, P.; Campisi, J. Reversal of Human Cellular Senescence: Roles of the P53 and P16 Pathways. EMBO J. 2003, 22, 4212–4222. [Google Scholar] [CrossRef]
  13. Zhang, J.; Manley, J.L. Misregulation of Pre-mRNA Alternative Splicing in Cancer. Cancer Discov. 2013, 3, 1228–1237. [Google Scholar] [CrossRef] [PubMed]
  14. Shirai, C.L.; Ley, J.N.; White, B.S.; Kim, S.; Tibbitts, J.; Shao, J.; Ndonwi, M.; Wadugu, B.; Duncavage, E.J.; Okeyo-Owuor, T.; et al. Mutant U2AF1 Expression Alters Hematopoiesis and Pre-mRNA Splicing In Vivo. Cancer Cell 2015, 27, 631–643. [Google Scholar] [CrossRef] [PubMed]
  15. Basile, K.J.; Le, K.; Hartsough, E.J.; Aplin, A.E. Inhibition of Mutant BRAF Splice Variant Signaling by Next-Generation, Selective RAF Inhibitors. Pigment. Cell Melanoma Res. 2014, 27, 479–484. [Google Scholar] [CrossRef]
  16. Dutertre, M.; Sanchez, G.; De Cian, M.-C.; Barbier, J.; Dardenne, E.; Gratadou, L.; Dujardin, G.; Le Jossic-Corcos, C.; Corcos, L.; Auboeuf, D. Cotranscriptional Exon Skipping in the Genotoxic Stress Response. Nat. Struct. Mol. Biol. 2010, 17, 1358–1366. [Google Scholar] [CrossRef]
  17. House, A.E.; Lynch, K.W. Regulation of Alternative Splicing: More than Just the ABCs. J. Biol. Chem. 2008, 283, 1217–1221. [Google Scholar] [CrossRef]
  18. Braunschweig, U.; Gueroussov, S.; Plocik, A.M.; Graveley, B.R.; Blencowe, B.J. Dynamic Integration of Splicing within Gene Regulatory Pathways. Cell 2013, 152, 1252–1269. [Google Scholar] [CrossRef] [PubMed]
  19. Kwon, S.M.; Min, S.; Jeoun, U.; Sim, M.S.; Jung, G.H.; Hong, S.M.; Jee, B.A.; Woo, H.G.; Lee, C.; Yoon, G. Global Spliceosome Activity Regulates Entry into Cellular Senescence. FASEB J. 2021, 35, e21204. [Google Scholar] [CrossRef]
  20. Holly, A.C.; Melzer, D.; Pilling, L.C.; Fellows, A.C.; Tanaka, T.; Ferrucci, L.; Harries, L.W. Changes in Splicing Factor Expression Are Associated with Advancing Age in Man. Mech. Ageing Dev. 2013, 134, 356–366. [Google Scholar] [CrossRef]
  21. Lee, B.P.; Pilling, L.C.; Emond, F.; Flurkey, K.; Harrison, D.E.; Yuan, R.; Peters, L.L.; Kuchel, G.A.; Ferrucci, L.; Melzer, D.; et al. Changes in the Expression of Splicing Factor Transcripts and Variations in Alternative Splicing Are Associated with Lifespan in Mice and Humans. Aging Cell 2016, 15, 903–913. [Google Scholar] [CrossRef]
  22. Tabrez, S.S.; Sharma, R.D.; Jain, V.; Siddiqui, A.A.; Mukhopadhyay, A. Differential Alternative Splicing Coupled to Nonsense-Mediated Decay of mRNA Ensures Dietary Restriction-Induced Longevity. Nat. Commun. 2017, 8, 306. [Google Scholar] [CrossRef]
  23. Georgilis, A.; Klotz, S.; Hanley, C.J.; Herranz, N.; Weirich, B.; Morancho, B.; Leote, A.C.; D’Artista, L.; Gallage, S.; Seehawer, M.; et al. PTBP1-Mediated Alternative Splicing Regulates the Inflammatory Secretome and the Pro-Tumorigenic Effects of Senescent Cells. Cancer Cell 2018, 34, 85. [Google Scholar] [CrossRef] [PubMed]
  24. Lan, C.; Zhang, H.; Wang, K.; Liu, X.; Zhao, Y.; Guo, Z.; Zhang, N.; Zhou, Y.; Gao, M.; Gu, F.; et al. The Alternative Splicing of Intersectin 1 Regulated by PTBP1 Promotes Human Glioma Progression. Cell Death Dis. 2022, 13, 835. [Google Scholar] [CrossRef]
  25. Cho, C.-Y.; Chung, S.-Y.; Lin, S.; Huang, J.-S.; Chen, Y.-L.; Jiang, S.-S.; Cheng, L.-C.; Kuo, T.-H.; Lay, J.-D.; Yang, Y.-Y.; et al. PTBP1-Mediated Regulation of AXL mRNA Stability Plays a Role in Lung Tumorigenesis. Sci. Rep. 2019, 9, 16922. [Google Scholar] [CrossRef]
  26. Ge, Z.; Quek, B.L.; Beemon, K.L.; Hogg, J.R. Polypyrimidine Tract Binding Protein 1 Protects mRNAs from Recognition by the Nonsense-Mediated mRNA Decay Pathway. Elife 2016, 5, e11155. [Google Scholar] [CrossRef]
  27. Liu, L.; Liu, K.; Yan, Y.; Chu, Z.; Tang, Y.; Tang, C. Two Transcripts of FBXO5 Promote Migration and Osteogenic Differentiation of Human Periodontal Ligament Mesenchymal Stem Cells. Biomed. Res. Int. 2018, 2018, 7849294. [Google Scholar] [CrossRef] [PubMed]
  28. Zhong, S.; Joung, J.-G.; Zheng, Y.; Chen, Y.; Liu, B.; Shao, Y.; Xiang, J.Z.; Fei, Z.; Giovannoni, J.J. High-Throughput Illumina Strand-Specific RNA Sequencing Library Preparation. Cold Spring Harb. Protoc. 2011, 2011, 940–949. [Google Scholar] [CrossRef] [PubMed]
  29. Jin, L.; Li, G.; Yu, D.; Huang, W.; Cheng, C.; Liao, S.; Wu, Q.; Zhang, Y. Transcriptome Analysis Reveals the Complexity of Alternative Splicing Regulation in the Fungus Verticillium Dahliae. BMC Genom. 2017, 18, 130. [Google Scholar] [CrossRef]
  30. Dobin, A.; Davis, C.A.; Schlesinger, F.; Drenkow, J.; Zaleski, C.; Jha, S.; Batut, P.; Chaisson, M.; Gingeras, T.R. STAR: Ultrafast Universal RNA-Seq Aligner. Bioinformatics 2013, 29, 15–21. [Google Scholar] [CrossRef]
  31. Pertea, M.; Pertea, G.M.; Antonescu, C.M.; Chang, T.-C.; Mendell, J.T.; Salzberg, S.L. StringTie Enables Improved Reconstruction of a Transcriptome from RNA-Seq Reads. Nat. Biotechnol. 2015, 33, 290–295. [Google Scholar] [CrossRef]
  32. Shen, S.; Park, J.W.; Lu, Z.; Lin, L.; Henry, M.D.; Wu, Y.N.; Zhou, Q.; Xing, Y. rMATS: Robust and Flexible Detection of Differential Alternative Splicing from Replicate RNA-Seq Data. Proc. Natl. Acad. Sci. USA 2014, 111, E5593–E5601. [Google Scholar] [CrossRef] [PubMed]
  33. Huang, D.W.; Sherman, B.T.; Lempicki, R.A. Systematic and Integrative Analysis of Large Gene Lists Using DAVID Bioinformatics Resources. Nat. Protoc. 2009, 4, 44–57. [Google Scholar] [CrossRef]
  34. Tang, Z.; Li, C.; Kang, B.; Gao, G.; Li, C.; Zhang, Z. GEPIA: A Web Server for Cancer and Normal Gene Expression Profiling and Interactive Analyses. Nucleic Acids Res. 2017, 45, W98–W102. [Google Scholar] [CrossRef]
  35. Reimann, J.D.R.; Jackson, P.K. Emi1 Is Required for Cytostatic Factor Arrest in Vertebrate Eggs. Nature 2002, 416, 850–854. [Google Scholar] [CrossRef] [PubMed]
  36. Margottin-Goguet, F.; Hsu, J.Y.; Loktev, A.; Hsieh, H.M.; Reimann, J.D.R.; Jackson, P.K. Prophase Destruction of Emi1 by the SCF(betaTrCP/Slimb) Ubiquitin Ligase Activates the Anaphase Promoting Complex to Allow Progression beyond Prometaphase. Dev. Cell 2003, 4, 813–826. [Google Scholar] [CrossRef]
  37. Wang, Z.-N.; Liu, D.; Yin, B.; Ju, W.-Y.; Qiu, H.-Z.; Xiao, Y.; Chen, Y.-J.; Peng, X.-Z.; Lu, C.-M. High Expression of PTBP1 Promote Invasion of Colorectal Cancer by Alternative Splicing of Cortactin. Oncotarget 2017, 8, 36185–36202. [Google Scholar] [CrossRef] [PubMed]
  38. He, X.; Arslan, A.D.; Ho, T.-T.; Yuan, C.; Stampfer, M.R.; Beck, W.T. Involvement of Polypyrimidine Tract-Binding Protein (PTBP1) in Maintaining Breast Cancer Cell Growth and Malignant Properties. Oncogenesis 2014, 3, e84. [Google Scholar] [CrossRef]
  39. He, X.; Yuan, C.; Yang, J. Regulation and Functional Significance of CDC42 Alternative Splicing in Ovarian Cancer. Oncotarget 2015, 6, 29651–29663. [Google Scholar] [CrossRef]
  40. Qian, H.; Kang, X.; Hu, J.; Zhang, D.; Liang, Z.; Meng, F.; Zhang, X.; Xue, Y.; Maimon, R.; Dowdy, S.F.; et al. Reversing a Model of Parkinson’s Disease with in Situ Converted Nigral Neurons. Nature 2020, 582, 550–556. [Google Scholar] [CrossRef]
  41. Yano, K.; Takahashi, R.-U.; Shiotani, B.; Abe, J.; Shidooka, T.; Sudo, Y.; Yamamoto, Y.; Kan, S.; Sakagami, H.; Tahara, H. PRPF19 Regulates P53-Dependent Cellular Senescence by Modulating Alternative Splicing of MDM4 mRNA. J. Biol. Chem. 2021, 297, 100882. [Google Scholar] [CrossRef] [PubMed]
  42. Tang, Y.; Horikawa, I.; Ajiro, M.; Robles, A.I.; Fujita, K.; Mondal, A.M.; Stauffer, J.K.; Zheng, Z.-M.; Harris, C.C. Downregulation of Splicing Factor SRSF3 Induces P53β, an Alternatively Spliced Isoform of P53 That Promotes Cellular Senescence. Oncogene 2013, 32, 2792–2798. [Google Scholar] [CrossRef] [PubMed]
  43. Robu, M.E.; Zhang, Y.; Rhodes, J. Rereplication in Emi1-Deficient Zebrafish Embryos Occurs through a Cdh1-Mediated Pathway. PLoS ONE 2012, 7, e47658. [Google Scholar] [CrossRef] [PubMed]
  44. Liu, Y.; Pan, B.; Qu, W.; Cao, Y.; Li, J.; Zhao, H. Systematic Analysis of the Expression and Prognosis Relevance of FBXO Family Reveals the Significance of FBXO1 in Human Breast Cancer. Cancer Cell Int. 2021, 21, 130. [Google Scholar] [CrossRef] [PubMed]
  45. Guan, C.; Zhang, J.; Zhang, J.; Shi, H.; Ni, R. Enhanced Expression of Early Mitotic Inhibitor-1 Predicts a Poor Prognosis in Esophageal Squamous Cell Carcinoma Patients. Oncol. Lett. 2016, 12, 114–120. [Google Scholar] [CrossRef]
  46. Min, K.-W.; Park, M.H.; Hong, S.R.; Lee, H.; Kwon, S.Y.; Hong, S.H.; Joo, H.J.; Park, I.A.; An, H.J.; Suh, K.S.; et al. Clear Cell Carcinomas of the Ovary: A Multi-Institutional Study of 129 Cases in Korea with Prognostic Significance of Emi1 and Galectin-3. Int. J. Gynecol. Pathol. 2013, 32, 3–14. [Google Scholar] [CrossRef] [PubMed]
  47. Wang, K.; Qu, X.; Liu, S.; Yang, X.; Bie, F.; Wang, Y.; Huang, C.; Du, J. Identification of Aberrantly Expressed F-Box Proteins in Squamous-Cell Lung Carcinoma. J. Cancer Res. Clin. Oncol. 2018, 144, 1509–1521. [Google Scholar] [CrossRef] [PubMed]
  48. Lehman, N.L.; Tibshirani, R.; Hsu, J.Y.; Natkunam, Y.; Harris, B.T.; West, R.B.; Masek, M.A.; Montgomery, K.; van de Rijn, M.; Jackson, P.K. Oncogenic Regulators and Substrates of the Anaphase Promoting Complex/Cyclosome Are Frequently Overexpressed in Malignant Tumors. Am. J. Pathol. 2007, 170, 1793–1805. [Google Scholar] [CrossRef]
  49. Hernandez-Segura, A.; Nehme, J.; Demaria, M. Hallmarks of Cellular Senescence. Trends Cell Biol. 2018, 28, 436–453. [Google Scholar] [CrossRef]
Figure 1. Expression levels of PTBP1 in LUAD and senescent cells. (A) The expression of PTBP1 among normal and tumor tissues including LUAD from TIMER. The expression of PTBP1 in LUAD is marked by a red box. The red dots and blue dots within the rectangle represent tumor tissues and normal tissues, respectively, while the purple dots represent metastatic tissues. (B) Changes in mRNA levels of PTBP1 in LUAD and matched normal tissues derived from GEPIA [34]. (C) Results from GEPIA showed that higher mRNA levels of PTBP1 were associated with lower survival rates in LUAD patients. The solid line depicts the survival curve, and the dotted line represents the 95% confidence interval. A Log-rank test with a p-value < 0.05 is considered to indicate a statistically significant difference. (D) Decreased mRNA levels of PTBP1 in five human senescent models compared to younger ones (* p < 0.05, ** p < 0.01, *** p < 0.001, t-test).
Cimb 46 00458 g001
Figure 2. Knockdown of PTBP1 induces senescence and cell cycle arrest in LUAD cells. PTBP1 expression was validated by RT-qPCR (A) and Western blotting (B) in A549 and H1299 cells transfected with two different shRNAs (shPTBP1_#1 and shPTBP1_#2), with GAPDH serving as the internal control for both mRNA and protein levels. (C) SA-β-Gal staining in A549 and H1299 cells with PTBP1 knockdown. (D) Cell cycle detection for A549 and H1299 cells with PTBP1 knockdown. In the graph on the left side, red represents cells in the G1 and G2 phases. (** p < 0.01, *** p < 0.001, t-test).
Cimb 46 00458 g002
Figure 3. PTBP1 knockdown inhibits the proliferation and migration of LUAD cells. (A) Cell proliferation rate of A549 and H1299 cells with PTBP1 knockdown. (B) Colony formation capacity of A549 and H1299 cells with PTBP1 knockdown. (C) Cell migration ability in A549 and H1299 cells with PTBP1 knockdown (** p < 0.01, *** p < 0.001, t-test).
Cimb 46 00458 g003
Figure 4. Functional annotation of PTBP1-related genes in LUAD and senescence. (A) Profile of differentially expressed genes (DEGs) based on the median level of PTBP1 mRNA, as presented in volcano plots. LUAD patients from the TCGA-LUAD dataset were stratified into PTBP1-high and PTBP1-low groups. The dotted lines indicates the threshold for |log fold change (FC)| ≥ 0.5 and adjusted p-value < 0.05. (B) KEGG pathway analysis and Gene Ontology (GO) term enrichment for genes upregulated by PTBP1 in TCGA-LUAD dataset. (C) Venn diagram demonstrating the intersections of downregulated genes across replicative senescence cell lines of three human embryonic lung fibroblasts, MRC5, IMR90, and WI38. (D) KEGG pathway analysis and Gene Ontology (GO) term enrichment for overlapping genes across three replicative senescence cell lines.
Cimb 46 00458 g004
Figure 5. PTBP1 regulates the expression of cell-cycle-related gene FBXO5 via alternative splicing. (A) Statistics for differential events of alternative splicing following PTBP1 knockdown in A549 cells (FDR ≤ 0.01, |IncLevelDifference| ≥ 0.1). (B) Venn diagram showing overlapping genes between differential differentially spliced genes and cell-cycle-related genes after PTBP1 knockdown in A549 cells. (C) RT-qPCR analysis for mRNA level of FBXO5 after PTBP1 depletion in A549 and H1299 cells. (D) Western blot analysis of FBXO5 after PTBP1 knockdown in A549 and H1299 cells. (E) SA-β-Gal staining for A549 and H1299 cells with FBXO5 knockdown. (F) Cell cycle analysis for A549 and H1299 cells with FBXO5 knockdown. In the graph on the left side, red represents cells in the G1 and G2 phases. (* p < 0.05, ** p < 0.01, *** p < 0.001, t-test).
Cimb 46 00458 g005
Figure 6. FBXO5 shows downregulation in senescent cells. FBXO5 expression was validated in A549 and H1299 cells transfected with shFBXO5 by RT-qPCR (A) and Western blotting (B). GAPDH served as the internal control for both mRNA and protein. (C) Decrease in FBXO5 mRNA in five human senescent models compared to younger ones (** p < 0.01, *** p < 0.001, t-test).
Cimb 46 00458 g006
Figure 7. Knockdown of PTBP1 promotes exon skipping and degradation of FBXO5. (A) RNA-seq read coverage plots of the gene FBXO5 in A549 cells after PTBP1 depletion. Exon numbers and transcript identification numbers of FBXO5 in the RefSeq annotation are shown. (B) RT-PCR was performed to analyze exon 3 skipping of FBXO5 upon PTBP1 knockdown in LUAD cells. Primers designed against exon 2 and exon 4 of FBXO5 are shown above in schematic representation of FBXO5 splicing variants. Schematic of alternative spliced isoform structures for each PCR product is shown next to the gel image. A higher band intensity of PCR products indicates a higher production of the specific transcript isoform. GAPDH served as the endogenous control. (C,D) RNA stability assay in A549 (C) and H1299 (D) cells (*** p < 0.001, t-test).
Cimb 46 00458 g007
Table 1. Details of shRNA sequences used for cell transfection.
TargetPrimer Sequence
shPTBP1_#15′-CTCAACGTCAAGTACAACAAT-3′
shPTBP1_#25′-AGCAAACGGAAATGACAGCAA-3′
shFBXO55′-CCAGACCAATATCCCAACAAA-3′
Table 2. PCR primer lists.
TargetPrimer Sequence
RT-qPCR
GAPDHForward: CTGGGCTACACTGAGCACC
Reverse: AAGTGGTCGTTGAGGGCAATG
PTBP1Forward: AGCGCGTGAAGATCCTGTTC
Reverse: CAGGGGTGAGTTGCCGTAG
FBXO5Forward: CAGCGAACTCTTTCGAAGGGGACTC
Reverse: GTGAATTACAGCGAATACAGGCTTTGAGGC
FBXO5-SForward: GCACAACTCAGTGACATGGACTTAATCAAGAAAAC
Reverse: CTGCTGATTTCTGAACAGAAGCCAGTGG
FBXO5-LForward: CCAGTTGTACAGTAAAGCAATACAAAGAGTTACCGAAAAC
Reverse: CTGCTGATTTCTGAACAGAAGCCAGTGG
RT-PCR
GAPDHForward: CTGGGCTACACTGAGCACC
Reverse: AAGTGGTCGTTGAGGGCAATG
FBXO5exon 2-exon 4Forward: CAGCGAACTCTTTCGAAGGGGACTC
Reverse: GGTGAATTACAGCGAATACAGGCTTTGAGGC
Disclaimer/Publisher’s Note: The statements, opinions and data contained in all publications are solely those of the individual author(s) and contributor(s) and not of MDPI and/or the editor(s). MDPI and/or the editor(s) disclaim responsibility for any injury to people or property resulting from any ideas, methods, instructions or products referred to in the content.

