Article

Stand Biomass at Treeline Ecotone in Russian Subarctic Mountains Is Primarily Related to Species Composition but Its Dynamics Driven by Improvement of Climatic Conditions

by
Pavel A. Moiseev
1,
Frank Hagedorn
2,
Dmitry S. Balakin
1,
Maxim O. Bubnov
1,
Nadezhda M. Devi
1,
Vladimir V. Kukarskih
1,
Valery S. Mazepa
1,
Sergey O. Viyukhin
1,
Arina A. Viyukhina
1 and
Andrey A. Grigoriev
1,*
1
Institute of Plant and Animal Ecology, Ural Branch, Russian Academy of Sciences, 620144 Yekaterinburg, Russia
2
Swiss Federal Institute for Forest Snow and Landscape Research WSL, 8903 Birmensdorf, Switzerland
*
Author to whom correspondence should be addressed.
Forests 2022, 13(2), 254; https://doi.org/10.3390/f13020254
Submission received: 22 December 2021 / Revised: 27 January 2022 / Accepted: 2 February 2022 / Published: 6 February 2022
(This article belongs to the Section Forest Ecology and Management)

Abstract

:
Climate change effects are strongest in forest ecosystems at the limit of their distributions. Despite the evidence that treelines have shifted upwards by hundreds of meters, knowledge of the associated changes in the stand biomass is limited. In this study, stand biomass and changes to it during the last centuries were estimated along 20 altitudinal transects reaching from the historical (located in the 1950s–1960s) closed forest line up to the current treelines on mountain slopes of three subarctic regions of Russia (Kola Peninsula, Polar Urals, and Putorana Plateau) along a 2200 km long longitudinal gradient. The estimates were based on allometric measurements of 139 trees of five species (Betula pubescens Ehrh. ssp. tortuosa, Pinus sylvestris L., Picea abies Ledeb. ssp. obovata, Larix sibirica Ledeb., and Larix gmelinii Rupr.), stand structure assessments, and the demographic patterns of 9300 trees. During the 20th century, the growth and establishment of trees at the forest–mountain tundra transition (340–500 m width) increased exponentially. Since 1910 forest expansion and densification led to an accumulation of 621–748 tons of aboveground stand biomass per km of treeline length. The accumulation was two times higher below than above the contemporary closed forest line. Data analysis of weather stations showed that the 20th century’s climate had changed in a similar manner in the three study regions, namely vegetation periods became longer (8–10 days) and warmer (0.6–0.9 °C) and more snow fell in the cold period (+10–30%). Our results indicate that regional patterns in stand biomass at the treeline ecotone are primarily related to tree species composition as determined by macroclimatic conditions (e.g., continentality, sunshine hours), snowpack depth, and growing season duration. However, the stand biomass accumulation was driven by increases of early summer temperatures and early winter precipitation during the last century.

1. Introduction

The global average surface temperature increased by 0.85 °C from 1880 to the present and is expected to continue to rise (possibly by 1–3.5 °C), with the most significant changes occurring in the high latitude [1] and altitude regions of the world [2]. Vegetation responses to global warming are expected to be fastest and most pronounced in boundary ecosystems, where climatic and soil conditions rapidly change over a relatively short distance, surpassing critical thresholds in high latitude and altitude systems [3,4]. Thus, an increase in air temperature by a few degrees can cause a shift in climatic boundaries by hundreds of meters in elevation, which exceeds the average width of some vegetation belts and will provoke significant changes in biota. On the one hand, this can lead to the extinction of many alpine species [5,6,7], but on the other hand, this can increase carbon sequestration in biomass and change in carbon cycling both at the local [8,9] and regional levels [10]. Based on this, a study of the processes occurring in high elevation systems is highly relevant. The upper boundary of woody vegetation is particularly sensitive as it is considered the most important biogeographical and indicator boundary on mountains [11].
The length of the upper border of forests in the mountainous regions of the world is tens of thousands of kilometers and in many regions the open and closed forest lines have shifted (Figure 1) along the slopes by hundreds of meters [4,12,13,14,15,16,17], which increased forested area to thousands of square kilometers. Nevertheless, quantitative studies of the biomass accumulation and the dynamics of stands at the upper boundaries of their growth are extremely rare. The large knowledge gap is likely due to the enormous field efforts and logistical challenges associated with estimating biomass in remote high-altitude locations. For this reason, the biomass of treeline ecotone stands was mainly studied on one mountain slope [8,18,19,20,21,22], but the interregional comparison of such data was done only in one study [23].
In the last years, remote sensing methods have increasingly been used to try to estimate vegetation biomass [10,24]. However, the resolution of satellite images is still too coarse to assess year-by-year biomass changes, and the use of UAV aerial photos or LiDAR survey data requires ground validation [25,26,27] through time-consuming tree morphometry estimates. Thus, detailed research of biomass of tree stands at the upper limit of their growth is strongly needed to improve our understanding of C cycling in high elevation ecosystems, as well as for forecasting how these systems will be transformed by climate change.
Our study is one of the first assessments of stand biomass changes at multiple subarctic treeline sites. We combine demographic information with detailed biomass measurements of five key tree species to estimate stand biomass and its changes in zones between historical closed forest lines and sparse tree stand lines in three climatically contrasting subarctic regions of Eurasia: the Kola Peninsula, the Polar Urals, and the Putorana Plateau. Our objectives were (1) to quantify the prevailing aboveground biomass of tree stands along elevation gradients, (2) to estimate year-by-year stand biomass changes over the last centuries, and (3) to identify the factors affecting the structure of treeline stands in subarctic mountain regions by linking obtained data to regional climate records and local site conditions. We hypothesized that the amount of biomass of tree stands at the upper limit of their distribution is primarily associated with the dominant species and general regional climate features (continentality, sunshine hours), while biomass increases in the last century have been driven by improving climatic conditions.

2. Materials and Methods

2.1. Study Sites

Our studies were carried out in three Russian subarctic mountain regions: (1) the Kola Peninsula (Khibiny massif), (2) the Polar Urals (Tchernaya, Slantzevay, and Malikpe mountains), and (3) the Putorana Plateau (Sukhie Gory massif) (Figure 2a, Table 1).
The Khibiny massif (highest peak at 1201 m a.s.l.) is located in the band of the highest central uplands of the Kola Peninsula (Figure 2b), which is characterized by great amplitudes in elevation (up to 800 m) and a complex geological structure with prevailing plutonic rock. The climate of the Khibiny depends on air masses coming from the never-frozen North Atlantic Ocean and Barents Sea, which bring warm, snow-rich winters and rainy, cold summers. The mean air temperature in July is +13.5 °C and in January is −12.6 °C. The average annual precipitation is 928 mm, one third of which falls in summer. The mountain tundra of the Khibiny massif is dominated by mosses and lichens with an admixture of dwarf shrubs (Cassiope sp., Ledum palustre L., Empetrum sp. Arctous alpine L., Dryas sp.). Within the treeline ecotone (320–660 m a.s.l.), mountain birch (Betula pubescens Ehrh. ssp. tortuosa (Ledeb.) Nyman) and Scotch pine (Pinus sylvestris L.) stands alternate with open areas where shrubs (Betula nana L., Salix sp.) and dwarf shrubs (Vaccinium sp., Empetrum sp.) prevail. The lower parts of the slopes are dominated by Siberian spruce (Picea obovata Ledeb.) and Scotch pine.
In the Polar Ural mountains, our study sites are located on the east-facing macroslope in the Sob’ River and Schuchiya River basins (Figure 2c). In the Sob’ River basin, the highest mountains are the Rai-Iz massif (peridotite, up to 1260–1290 m a.s.l.) and Mt. Chernaya (gabbro, 1030 m a.s.l.). There is a chain of gentle-sloped hills (300–460 m a.s.l.) extending along their southeastern slopes. The east-facing slopes of the Rai-Iz massif are framed with the Slantsevaya, Yar-Keu, and Pour-Keu mountains (crystalline shales, 400–880 m a.s.l.). In the Schuchiya River basin, study sites are located on the southern slopes of Mt. Malikpe (graphitoid, quartzite, sandstone arkosic, 696 m a.s.l.). The climate of the western macroslope of the Polar Urals is more strongly affected by Atlantic and Arctic air masses than the eastern one and, therefore, cloudy days are more frequent (200 vs. 170 days). The mean air temperature in July is +14.2 °C and in January is −22.1 °C. The average annual precipitation is 460 mm, one third of which falls in summer. The vegetation that forms the mountain tundra and dominates in the open areas between groups of larches (Larix sibirica Ledeb.) in the treeline ecotone (180–350 m a.s.l.) consists of various shrubs and dwarf shrubs (Betula nana L., Salix sp., Vaccinium sp., Empetrum nigrum L., Arctous alpine L., and Dryas sp.) and herbs. On some slopes within the treeline ecotone, birch (Betula pubescens Ehrh. ssp. tortuosa (Ledeb.) Nyman) and alder (Duschekia fruticose (Rupr.) Pouzar) prevail. In the valleys, Siberian spruce increases in abundance and in some areas it forms almost pure spruce forests.
The most eastern site of our longitudinal transect of study areas is the northwestern part of the Putorana Plateau (the Sukhie Gory massif in the eastern part of Lake Lama), which is the largest monolithic mountain range in the Russian polar region, with almost the entire area being north of the Arctic Circle (Figure 2d). With respect to the geological and geomorphological features, it is a flat-topped basalt crystalline massif with elevations averaging 900–1200 m and reaching a maximum of 1701 m a.s.l. in the central part (Mt. Kamen). Multiple uplifts on the Putorana Plateau have generated deep (up to 800–1000 m) radial tectonic fractures in this area in the form of narrow gorges and canyons with trappean structures of slopes. The climate of the Putorana Plateau is strictly continental, but nevertheless it is influenced by the Atlantic Ocean along the Arctic front, especially in its western part. The mean air temperature of the warmest summer month (July) is +12.8 °C. Winter is extremely cold (January temperature −28 °C) and begins in the second half of September. The average annual precipitation is 547 mm, half of which falls in summer. In the treeline ecotone ranging from 250 to 710 m a.s.l., tree stands are formed by Gmelin larch (Larix gmelinii (Rupr.) Rupr.). Shrub phytocenoses with Alnaster fruticosa (Rupr.) Ledeb., Juniperus sibirica Burgsd., Betula nana L., and mountain tundra communities (Cassiope tetragona (L.) D.Don, Dryas octopetala L., Empetrum subholarcticum V.N. Vassil.) are also widespread here. In the mountain forest belt, the largest areas are occupied by mixed forests of Larix sibirica, Picea obovata, and Betula tortuosa.

2.2. Trees and Stands Data Sampling and Calculation

In 2002–2019, we established 20 altitudinal transects of study plots along the forest–mountain tundra transition in the three subarctic regions: nine in the Khibiny massif, six in the Polar Urals, and five on the Putorana Plateau (Table 2).
The transects were located on shallow and steep (3–34°), evenly inclined slopes with different aspects. On each transect on the Khibiny massif and the Putorana Plateau, series of plots were installed on four altitudinal levels (according to Shiyatov et al. [28] and Hagedorn et al. [16]): (1) sparse tree stand lines (individual trees or islands of multi- and single-stemmed trees with heights of more than 2 m, distances between trees from 20 to 60 m, and a total crown cover of 5%–10%); (2) open forest lines (distances between trees from 7 to 30 m and a total crown cover of 20%–30%); (3) closed forest lines (continuous forest with distances between trees of less than 7 m and a total crown cover greater than 50%; and (4) closed forest (50%–80%) on 15–70 m of altitude below contemporary closed forest lines (in many cases these coincide with the altitudinal positions of closed forest lines in the 1950s–1960s as depicted on historical topographic maps) (Figure 3). In the Polar Urals, series of plots were installed on Level 4 on one transect (SLA), but at others, transect surveys were undertaken only on the first three upper levels (see Table 2). At each altitudinal level, we established 2–17 plots (282 in total), each 200–400 m2 in area (in total 9.62 ha) depending on stand density. The horizontal distances between the upper and lower elevational levels cover approximately 200 to 1900 m (Table 2). In each plot, all saplings taller than 20 cm and all trunks of single- or multi-stemmed trees were recorded (n = ca. 9300 in total). We mapped the location of each tree and measured its height, the basal diameter of each trunk, and crown diameter. The standard statistics of the morphometric parameters of tree stands for each altitudinal level of transects were calculated.
In each plot, we took a single tree core from every single-stemmed living tree and from every fourth stem of every multi-stemmed tree at the stem bases (0–30 cm) of trees with a diameter exceeding 3 cm. From every second tree taller than 0.2 m but less than 3 cm in basal diameter, we sampled stem disks at the root collar. All tree cores were mounted on wooden strips. Cores and stem disks were cleaned with both a paper knife and a shaving blade (ca. 8900) (for sample numbers for each transect see Table 2). After enhancing the ring boundary contrasts with white powder, samples were measured on a LINTAB-V measuring table (F. Rinn S.A., Heidelberg, Germany) to a precision of 0.01 mm and were cross-dated using the TSAP-3.5 [29] and Cofecha [30] computer programs. For cores hitting the pith, the distance to the center of the tree was estimated by fitting a circular template to the innermost curved ring [31]. Tree ages were estimated with the use of earlier developed methods [16,32].
The stem diameters of all examined trees were reconstructed for each year of their lives, considering geometric relations (see Moiseev et al. [8]), and according to the following formula:
DN = (RN/ROTR) × DF
where DN is the calculated tree diameter in a given year, RN is the radius of the corresponding annual ring, calculated as the sum of all ring widths from the core of a tree trunk to this ring border, ROTR is the radius of the outer tree ring, calculated as the sum of all ring widths from the pith to the border of the outer ring, and DF is the current tree diameter measured on the site.
In 2003–2019, trees of each dominant species were sampled from the immediate vicinity of study plots at open and contemporary closed forest lines to estimate the relationships of their biomass with morphometric parameters. These model trees were selected to cover the range of diameters, heights, and crown sizes occurring at a given altitudinal transect (139 trees in total; 11–53 individuals per site for Picea obovata, B. pubescens, and Pinus sylvestris at Khibiny, Larix sibirica in the Polar Urals, and L. gmelinii at Putorana; Table 3). The aboveground biomass of the model trees was determined by separating felled trees into stem wood and bark, branch wood and bark, needles or leaves, and dead branches, as described by Moiseev et al. [8] and Hagedorn et al. [23]. The fresh mass of stems, including bark, was determined in the field by cutting them into 1 or 2 m sections and weighing them to a precision of 50 g. The percentage of dry matter in this wood and the bark biomass fraction was determined for cross-cut samples from the butt end of the sections. These sections were weighed in the field to a precision of 0.1 g and then transported to the laboratory to measure dry weight. To determine the biomass of the tree crown and its structural components, all branches (including leaves) were cut off and divided into three groups with respect to their location in the upper, middle, or lower section of the crown. The total fresh mass of each group was measured in the field, and then the crown was divided into foliage-bearing and foliage-less parts and weighed separately. For a sample from the foliage-bearing part (20–30% of total fresh crown mass), the foliage was removed from the branches and weighed. A sample from the foliage-less part (5–10% of total crown fresh mass) was used to determine the proportions of wood and bark in the branches. The fraction of dry matter in the foliage was determined for 20 g samples from each section of the crown.
Allometric relationships were estimated for the model trees by applying regression equations relating the amounts of aboveground biomass to the diameter at the stem base. The exponential equation y = axb provided the best fit for these allometric relationships. The statistical parameters of these equations was calculated separately for each region and tree species (Table 3). These equations were combined with data on contemporary or reconstructed stem basal diameters of all trees in the plots (200–400 m2) to estimate the aboveground stand biomass on an area basis along the altitudinal transects, as at the present time and for each year since the start of tree stand formation on the sites.
Long-term air temperature data were reconstructed using temperatures monitored during individual years and long-term records from the closest weather stations (Kandalaksha for Khibiny, Elestkaya and Salekhard for the Polar Urals, and Dudinka for the Putorana Plateau) using linear regressions with recorded in situ temperatures. For each studied region, the mean air temperatures for summer and winter were calculated for the years 1970–2006. Additionally, the mean temperature for each day of the year was averaged over this period. Using these average values, the days of the year when the air temperature first rose above (in spring) and fell below (in autumn) 5 °C for more than three consecutive days were identified to determine the growing seasons. The durations (in days) were determined for this period. We additionally calculated the mean growing degree days (GDD5) for the period 1970–2006 as the sum of effective temperatures (daily average temperature −5 °C) accumulated during the growing season.
Because precipitation data were available from weather stations located on the plains or the tops of mountains (at the Khibiny on Mt. Ukspor, in the Polar Urals on Mt. Rai-Iz, and on the Putorana Plateau on the Peninsula Kamennyi on Lake Lama), we calculated the values for the treeline ecotone sites based on regional pluviometric gradients (with annual precipitation changing by 69, 53, and 15 mm per 100 m of altitude, respectively). In addition, we estimated the sum of hours with sunshine over the summer months using data from weather stations at lower elevations close to the studied mountains in each region for the period 1970–2006.
The snowpack depth was measured on at least 40 points using a special metal avalanche probe tool, which has marks every 1 cm, in the months of maximum snow accumulation (at the end of March on Khibiny Mountain, and at the end of April on the Putorana Plateau).

3. Results

3.1. Current Stand Structure and Biomass in Forest-Tundra Transition of Three Subarctic Regions

Based on the measurement data of ca. 9300 trees and the application of allometric functions developed with the use of morphometry and biomass data of 139 model trees (Table 3), we estimated that aboveground stand biomass averaged 22.8 ± 2.3 t ha−1 (mean ± 1 SE, averaged across the four elevation levels) along the transects in the three subarctic regions. Across the forest–tundra transition, aboveground stand biomass increased from 1.6–2.5 t ha−1 at the sparse tree stand line to 15.3–50.8 t ha−1 at the contemporary closed forest line and to 27.5–100.8 t ha−1 at the historic closed forest line.
Analysis of the morphometric parameters of trees, the sum of the crown projections, tree density, and aboveground stand biomass indicated that there was a highly significant increase in all variables with decreasing elevation from the contemporary sparse tree stands to the open forest and closed forest to the historical closed forest line (Figure 4, Table 4).
The interregional comparison shows that with the increasing longitude from the Kola Peninsula to the Putorana Plateau there was a substantial increase of the average values of tree basal stem diameters and heights by a factor of 1.3 to 2.6. Aboveground stand biomass increased with longitude by a factor of 1.4 to 2.5 and aboveground tree mass (obtained by dividing stand biomass by tree number) by a factor of 1.5 to 5.2 (Table 4). However, there was no systematic difference between the Polar Urals and the Putorana Plateau.
In contrast to the individual tree level, at stand-level there were no similar increases of parameters with longitude—the sum of crown projections did not show similar trends on all levels, and stand density (stem number per ha) even slightly declined on the low parts of the transects (Table 4).
Net long-term stand productivity, estimated by dividing biomass through mean tree age, exhibited the same trend as stand biomass, showing an increase by a factor of 1.1 to 1.5 (Table 4) from the western to the eastern sites of the longitudinal gradient. This demonstrates that the longitudinal pattern in aboveground stand biomass was partly caused by differences in tree ages among regions and transects. The mean age of trees increased slightly with increasing longitude in the upper half of transects (by a factor of 1.1 to 1.3), but more strongly at the contemporary and historical closed forest lines (by a factor of 1.6 to 2.2).

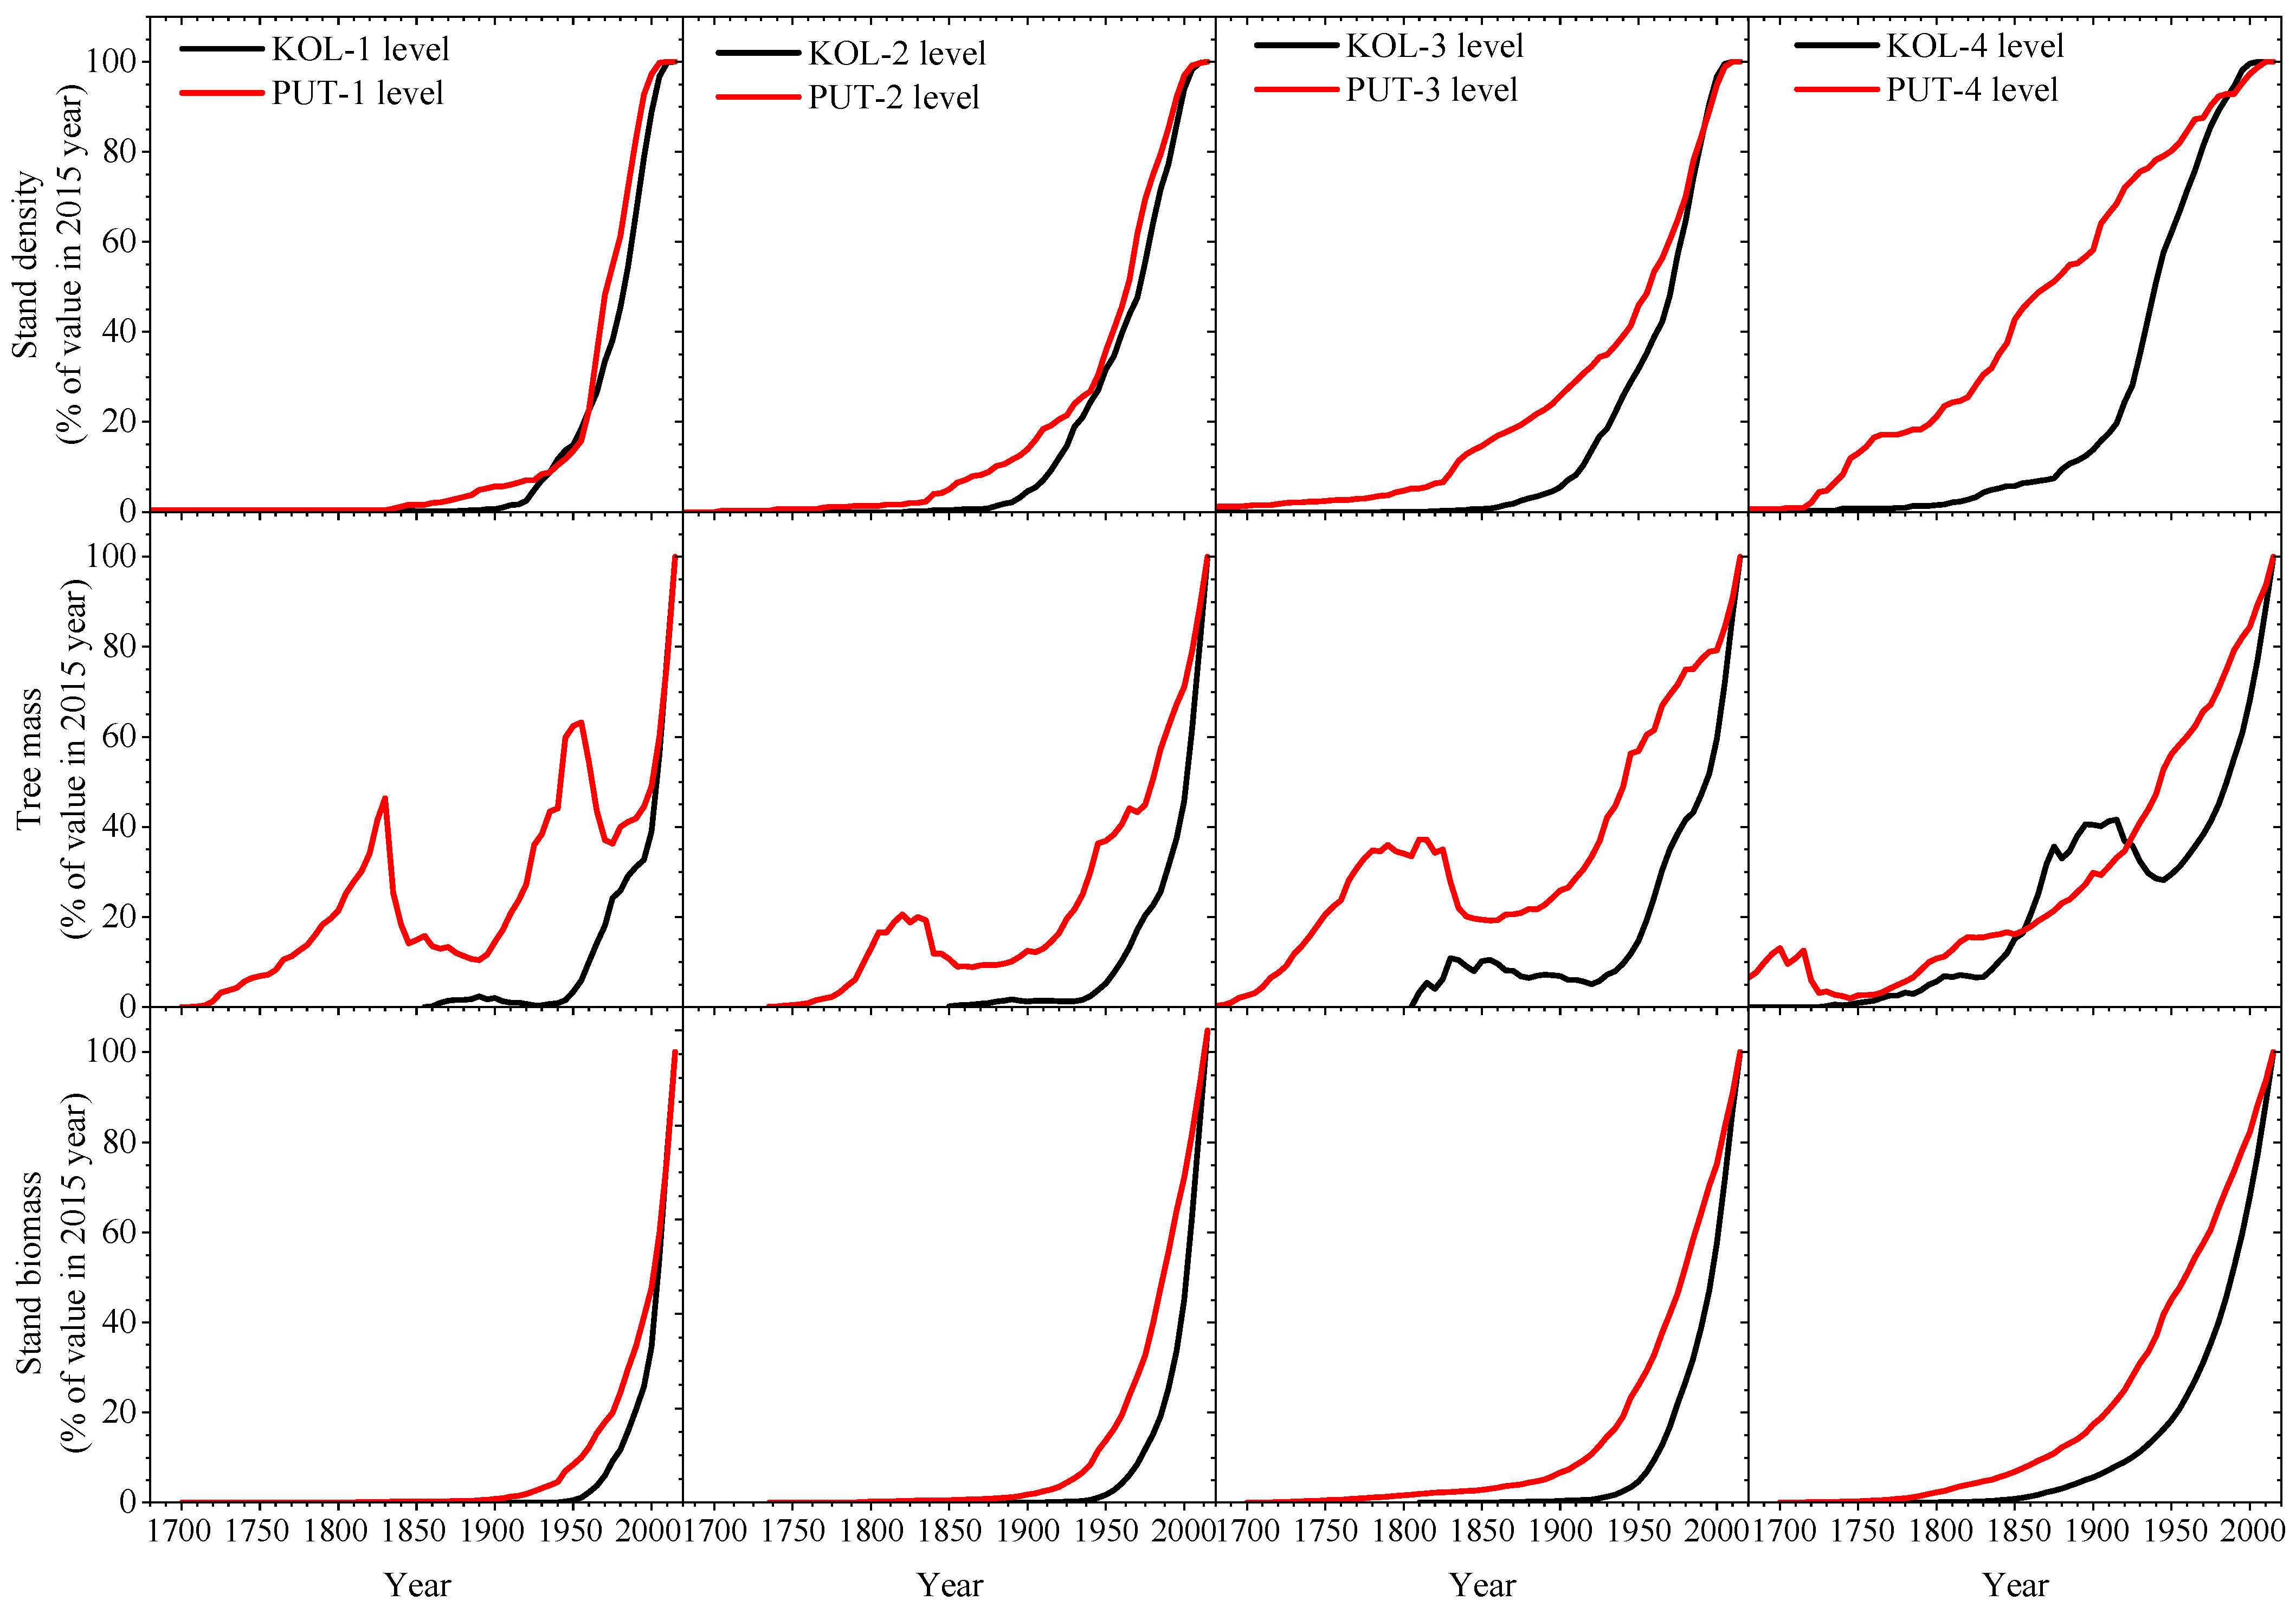
3.2. Changes of Tree Stand Density and Productivity over Last Centuries at Climatically Contrast Regions

On the Kola Peninsula (Khibiny massif) with birch dominating, an assessment of stand density changes along the altitudinal transects revealed that there has been a noticeable rise in stem density over the last centuries at all altitudinal levels (Figure 5).
The most striking changes occurred in the lower half of the studied transects (at and below the contemporary closed forest lines). From the beginning of the 18th century, when the now-living trees first appeared, until 1880, average density increased here very slowly (2–4 stems per 5 years). By 1915 the recruitment rate had risen to 30–40 stems per 5 y−1. In the 1920s–1960s, tree establishment intensified at the historical and present-time closed forest lines (up to 57–123 and 50–63 stems per 5 y−1, respectively). However, only in 1935 and 1960 did stand density reach values that are now occurring at the sparse tree stand lines (637 stem ha−1). Currently, tree density is more than 1529 stems per ha−1 and 1723 stems per ha−1 at the historical and present-time closed forest lines, respectively. The first trees that are now growing at the open forest line appeared in the 1820s, but active tree regeneration started in the 1910s and showed a similar rate as at the contemporary closed forest line, reaching the same value as in the sparse tree stands in 1975. Over the next five decades, stem quantity increased significantly and now equals 1248 per hectare. On the sparse tree stand line (uppermost level of transect), tree establishment was very slow until the middle of the 19th century and intensified only in the 1970s–1980s when the recruitment rate reached 30–40 stems per 5 y−1.
Reconstruction of stand biomass accumulation at all altitudinal transects on the Khibiny massif shows pronounced changes during the 20th century. For instance, the historical closed forest line had a similar small biomass as the contemporary sparse tree stand line (1.3–1.7 t ha−1) in 1905–1910 (Figure 5). In 1960–1965, its biomass corresponded to that of the contemporary open forest line (5.3–6.5 t ha−1) and, in 1990–1995, it had similar values as on the contemporary closed forest line (11.9–13.7 t ha−1). At contemporary closed forest lines, stand biomass had similar values as those observed on sparse tree stand lines in 1960–1965 and on open forest lines in 1990–1995. At the open forest line, stand biomass had similar values as those observed on sparse tree stand lines in 1990–1995.
On the Putorana Plateau (Sukhie Gory massif), analysis of changes of the stand-level parameters over the last centuries shows that, here also, stand density significantly increased on all altitudinal levels (Figure 6). The greatest increases occurred at the historical closed forest lines. Nevertheless, the first trees now living appeared at these parts of the transects in the beginning of the 17th century, tree establishment started to increase in the first half of the 19th century by up to 10–20 stems per 5 y−1, and by the 1905, it reached the stand densities of the current sparse tree stands (460–480 stems per ha−1). The present tree density is 722 trees per ha−1.
At the contemporary closed forest line, stand density was very low in the 17th–18th centuries. Since 1825, regeneration has intensified and the recruitment rate has grown to 10–20 stems per 5 y−1. By 1920, stem density reached the same value as in the current sparse tree stands. After 1950, the recruitment rate increased to 50–70 stems per 5 y−1 and in the 1970s, stand density passed value that now observed at the open forest line (750–800 stems per ha−1). At the present time, stems number more than 1300 stems per ha−1. At the open forest line, larch settlement started in the beginning of the 18th century, but until the 1830s, stand density was very low (less than 20 stems per ha−1). In the 1840s–1940s, recruitment rates increased by 5–15 stems per 5 y−1. After 1950, recruitment rates rose to 30–50 stems per 5 y−1, and by 1970, stem density reached the same values as on the current sparse tree stands. On the upper level, the now-living trees first appeared at the end of the 17th century, but their numbers increased very slowly and passed the value of 50 stems per ha−1 in 1950, after which the numbers started to grow by 30–50 stems per 5 y−1.
On the Putorana Plateau (Sukhie Gory massif), estimations of stand biomass development show that the biomass of the historical closed forest line corresponded to that of the current sparse tree stand line (about 2.0 t ha−1) in the 1810s (Figure 6). Its biomass was similar to that of the current open forest line (more than 12 t ha−1) in the 1900s and to that of the contemporary closed forest line (more than 43 t ha−1) in the 1980s. At the current closed forest line, stand biomass had similar values to those observed at sparse tree stand lines in the 1880s and at the open forest line in the 1950s. At the open forest line, stand biomass had similar values as those observed at the sparse tree stands line in the 1950s.
The year-by-year changes of aboveground stand biomass along the studied transects allowed the calculation of the biomass increments from 1910 until 2017 for the belt across the treeline ecotone reaching from the sparse tree stand to the contemporary closed forest line with a length of 1 km and an average width of 300 m on the Khibiny massif (Kola Peninsula) and of 239 m on the Sukhie Gory (Putorana Plateau). Results showed that despite the regional differences in the altitudes of the upper limits of the closed forests and the steepness, as well as rockiness, of the slopes in these mountain regions, the two regions showed similar values of stand biomass increments of 220 and 285 t km−1 over 107 years, respectively (Table 5). In the same period, but in the 1 km belt of tree stands below the closed forests line, the increase of stand biomass was more pronounced. On the slopes of the Khibiny massif (width 202 m) and Sukhie Gory (width 104 m), the increase in stand biomass was 1.6–1.8 times greater than in the belt above the contemporary treeline ecotone (Table 5).

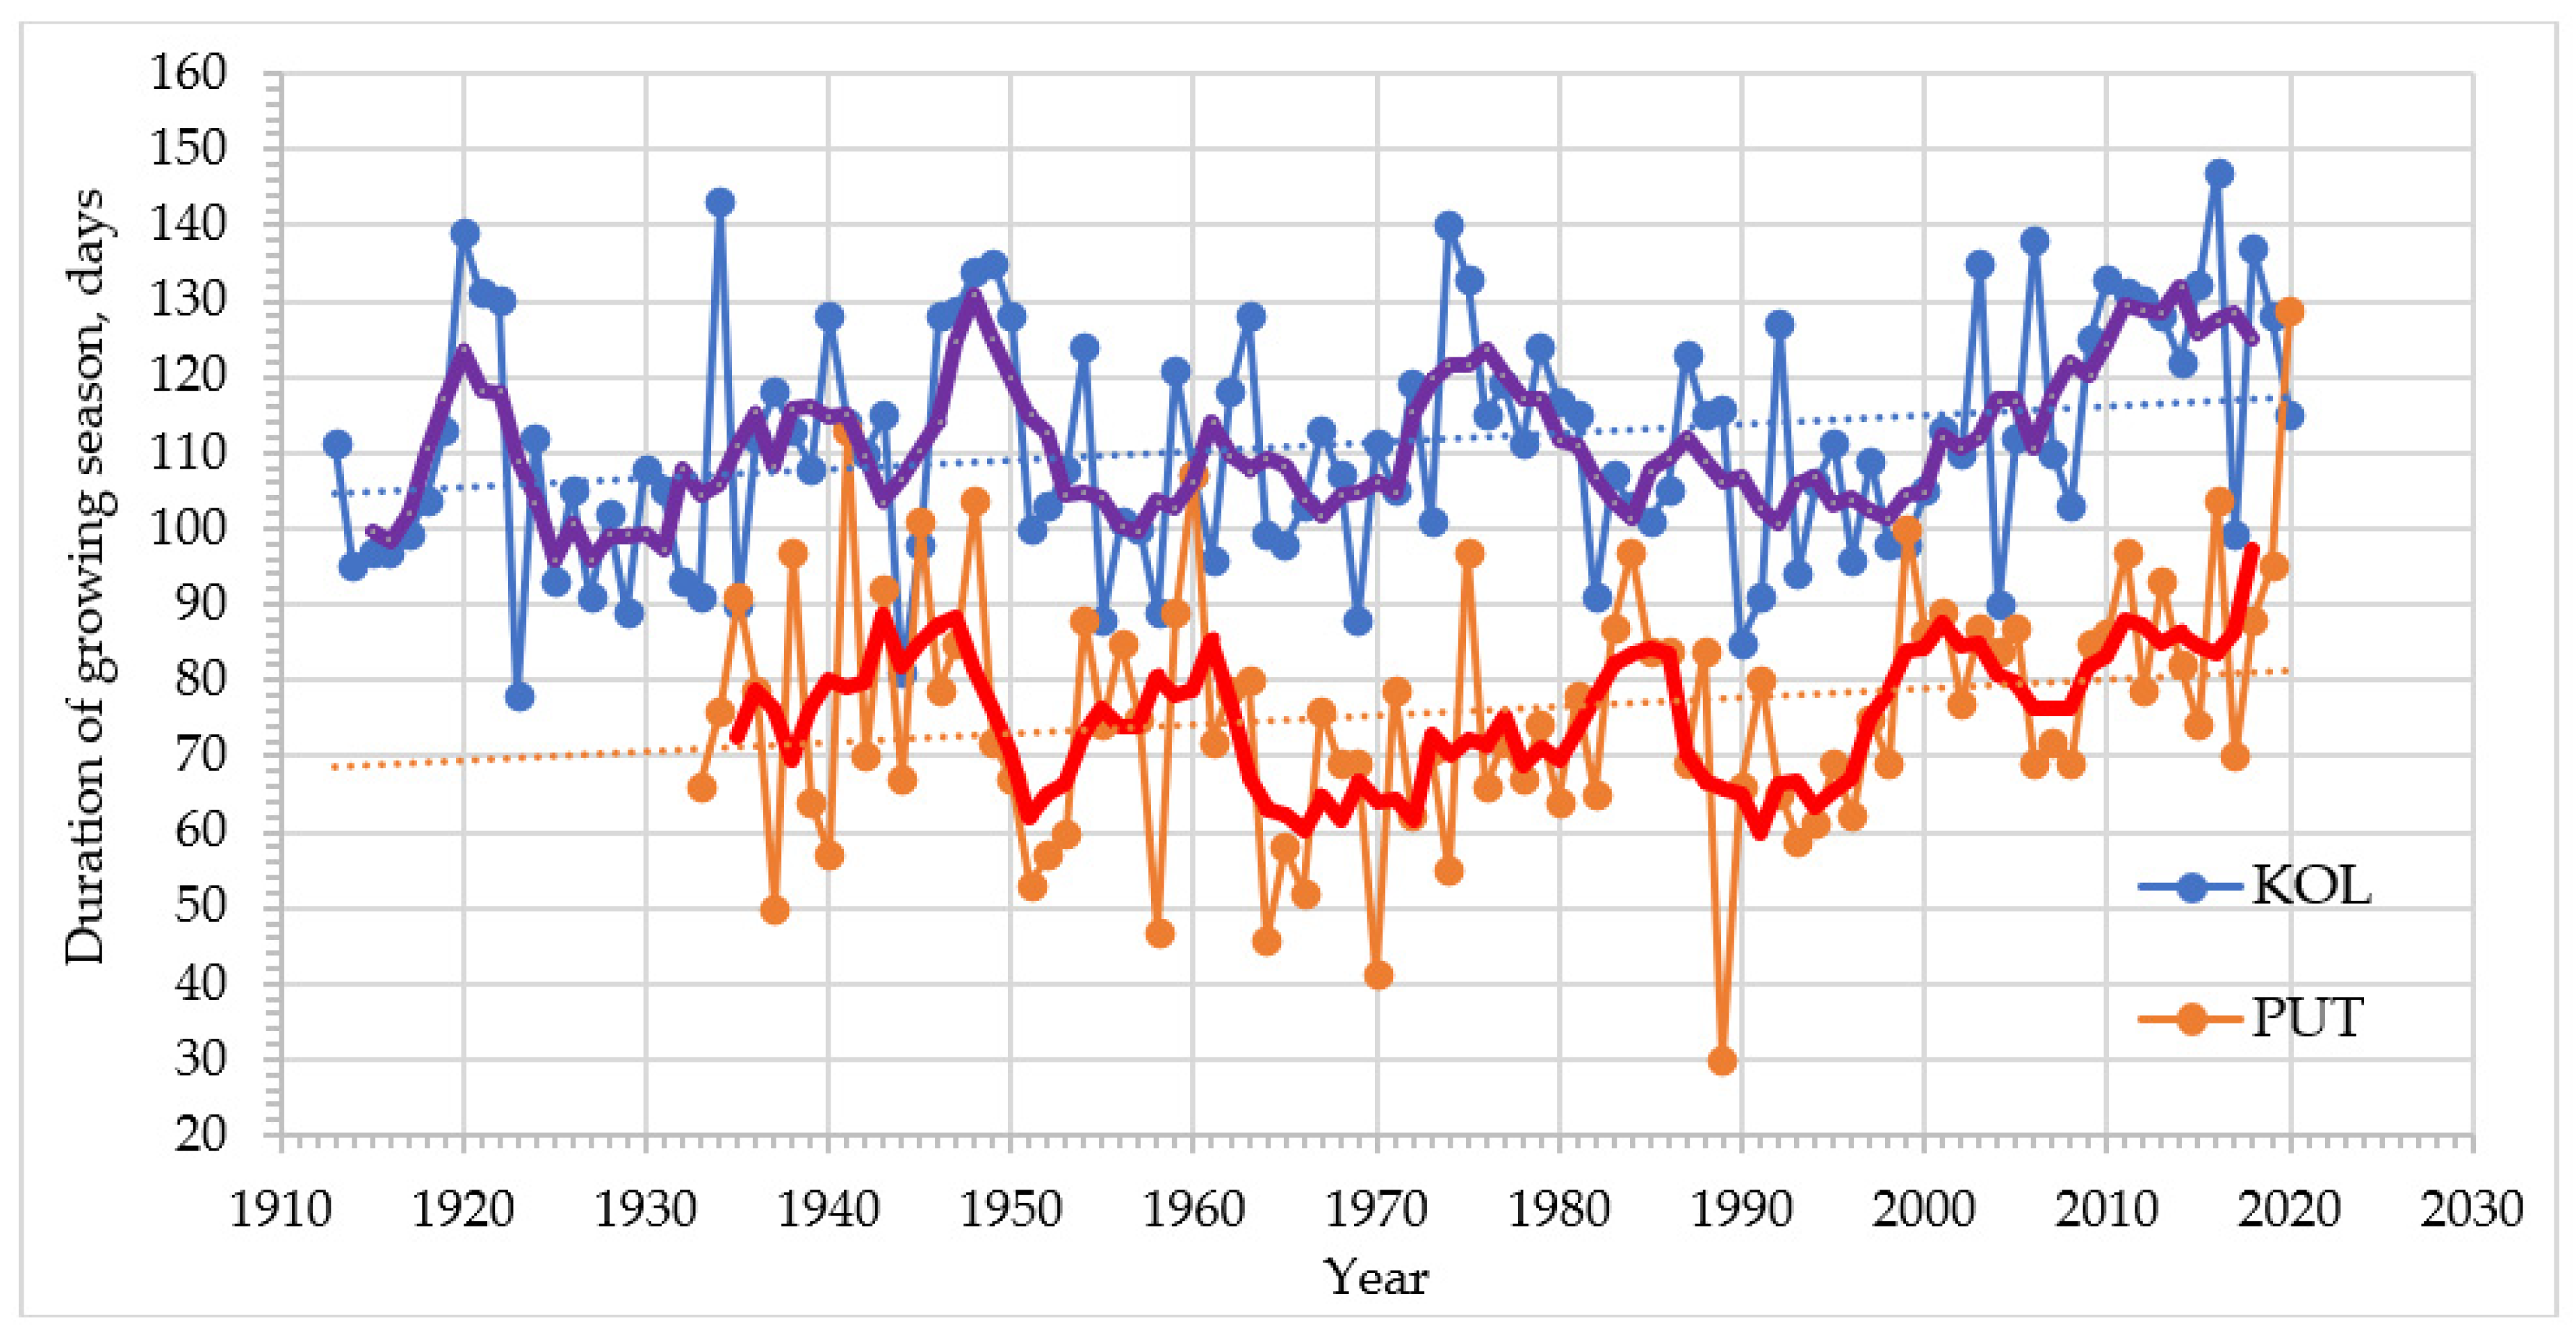
3.3. Climatic Conditions on Treeline Ecotone Sites in Three Subarctic Regions

Air temperatures at the open forest line, extrapolated from climate stations (Kandalaksha on the Kola Peninsula, Salekhard in the Polar Urals, and Dudinka on the Putorana Plateau), based on the close correlations with data measured in situ, showed rather different mean values in three study regions. On the Kola Peninsula, summers were comparably cold while winters were warmer as compared to the other regions. The Polar Urals had warm summers and comparably cold winters, while the coldest conditions occurred on the Putorana Plateau both in summer and winter (Table 6).
The growing season length (based on air temperatures exceeding 5 °C) showed a decline from the Kola Peninsula (104 days extrapolated for Khibiny), to the Polar Urals (101 days extrapolated for Tchernaya), and to the Putorana Plateau (73 days extrapolated for Sukhie Gory) (Table 6). Growing degree days (GDD5) had the same pattern as mean summer temperatures and declined by one third from 543 °C on the Kola Peninsula and 552 °C in the Polar Urals to the Putorana Plateau.
Annual and seasonal precipitations on the treeline sites, as extrapolated from climate stations with the use of region-specific increases with altitude (mm per 100 m), show considerable declines from west to east (38–44%). In contrast, the sum of hours of sunshine during summer increased by 15–19% from west to east.
Temperature loggers placed at 10 cm soil depth for 2–5 years indicated that mean soil temperatures in July (the main month of the short growing season) were comparable to but had a different altitudinal pattern within the treeline ecotone in the three regions (Table 6). Mean values increased from 10.3 to 12.4 °C from the sparse to the closed forest line in the Khibiny Mountains (Kola Peninsula), varied between 11.7 and 14.5 °C without consistent elevational pattern at Tchernaya (Polar Urals), and declined from 11.5 to 8.6 °C with decreasing elevation on the slopes of the Sukhie Gory (Putorana Plateau). Regional differences of soil temperatures in February were greater than in July, especially on the upper parts of the altitudinal transects, where they ranged from +0.6 °C at Khibiny to −16.7 °C at Putorana.

4. Discussion

4.1. Climatic, Site Conditions, and Dominant Species at Treeline

Our investigations along the 2200 km west–east transect (33.25–90.95° E) in the mountains of the subarctic regions of Eurasia at similar latitudes (67.55–69.45° N) show that the altitudinal positions of the forest–tundra ecotone occur at similar summer soil temperatures, while other climate characteristics, dominant trees species, and stand structures differ greatly among the three mountain ranges. The climate on the western side of the transect, in the Khibiny Mountains (Kola Peninsula), is close to maritime with a strong influence from the Gulf Stream. As a consequence, there is less sunshine during the summer (Table 6) and winters are warmer and richer in snow than in other regions, which results in comparably high air and soil temperatures and the formation of deep snow cover on the mountain slopes. Under these conditions, which also occur on the western macroslope of the North Ural treelines [16,32], mountain birch prevails on most of the slopes. However, on some of the southern slopes of wind-loaded ridges with shallow snowpacks and stony soils, Scotch pine dominates. In the Polar Urals, climatic conditions differ among the macroslopes because of a stronger influence from Atlantic and Arctic air masses on the western than on the eastern ones. This is probably the main reason for the higher mean treeline position on the eastern slope and the shift from mountain birch and Siberian spruce to Siberian larch toward the east. The climate observed on the western part of the Putorana Plateau is the most unfavorable for tree growth at the treeline because the growing season and GDD decrease to one third of the values of the Kola Peninsula and Polar Urals. In these conditions, Gmelin larch prevails on the upper limit of the mountain forests. Nevertheless, mean summer soil temperatures were comparable among the three regions, which supports the findings along a latitudinal gradient in the Ural Mountains [16,23] and on a global scale [33] that these temperatures are decisive for the elevational positions of treelines.
Our results show that mountain birch dominates in the regions and macroslopes with relatively warm cloudy weather in summer and warm snowy weather in winter and in locations with comparably deep snowpack, late dates of snow disappearance, and generally unfrozen soils (Table 7). Because of its high flexibility, mountain birch is able to tolerate a heavy snow load and it may also sprout from its base if the main stems have been destroyed [11]. In these regions on south-faced slopes with shallow snowpack and comparably dry and warm soils in summer, Scotch pine dominates. In some regions with relatively low amounts of snowfall, such as on the western macroslope of the Polar Urals, Siberian spruce can be dominant beside birch on some southern slopes. Siberian larch dominates at the treeline in the regions and macroslopes with warm and slightly cloudy weather in summer and moderately cold and little snowy winters in locations with comparably middle snowpack depths, moderate dates of its disappearance, and not-strongly frozen soils. In these regions on slopes with deep snowpacks, late dates of snow disappearance, and generally unfrozen soils, mountain birch prevails. Gmelin larch dominates in the regions and macroslopes with cold and little cloudy weather during the short summers and with cold and moderately snowy weather in winter in locations with comparably middle snowpack depth, early dates of its disappearance, and strongly frozen soils. In such regions no other tree species occur in the treeline ecotone.
Our previous studies on treelines in the Urals [23] strongly support the concept that the treeline altitudinal position is mainly related to growing season temperatures [33,34], most likely through thermal limitations on xylogenesis and the metabolization of assimilates in the roots [34,35,36]. While the Khibiny Mountains and the Polar Urals have comparable thermal conditions when integrated over the entire growing season (with 543 and 553 GDD5, respectively), conditions seem to be harsher on the more continental Putorana Plateau with only 364 GDD5. Also, winter air and soil temperatures clearly decline with longitude toward the east. This phenomenon can only be explained by the fact that in areas to the east of the Yenisei River an increasingly continental climate and the occurrence of permafrost lead to tree species change from the Siberian to the Gmelin larch, which is a species better adapted to short growing seasons and to soils with deep freezing in winter. This is probably partly compensated by an increase in the number of hours of sunshine in summer (from 753 to 792), which contributes to greater illumination and the warming of the aboveground parts of trees and the upper layers of the soil. The importance of this factor for the growth of larch is indicated by the fact that in the Polar Urals larch abundance sharply increases within the transition from the western to the eastern macroslope, and with the number of hours of sunshine increasing from 690 to 753.
The observed changes of species at the treelines in response to changes in macroclimatic conditions are in agreement with findings in various mountain regions. For instance, on the western slope of the North Urals, which is characterized by a milder and more humid climate, birch forms the upper timberline, while on the comparatively more continental eastern side, Siberian larch prevails [32,37]. Also, in the Scandinavian mountains of northern Finland, the dominant tree species at the treeline changes from mountain birch to European spruce [38,39].

4.2. Little Longitudinal Patterns in Stand Biomass

Our data analysis reveals that although there are substantial differences in aboveground stand biomass and average stem mass per tree among the various transects, there is no systematical pattern with longitude. The largest biomass was observed for the Siberian larch stands in the Polar Urals in the middle of the longitudinal gradient. We interpret this finding as an indication that macroclimatic changes associated with increasing continentality from west to east had a minor influence on stand biomass and productivity. In contrast, tree species identity appears to exert a major influence. In support, Pinus sylvestris stands had a greater biomass than Betula stands in the Khibiny Mountains (Figure 4). Here, the species distribution seemed to be driven by local conditions (e.g., a thick snowpack on leeward slopes favoring Betula), which overrode larger-scale changes in continentality.

4.3. Altitudinal Changes of Microclimate and Stand Biomass

Our analysis of the productivity of tree stands at the upper limit in the mountains of the Kola Peninsula, the Polar Urals, and the Putorana Plateau reveals a nonlinear decrease of aboveground stand biomass from the mountain forest belt to the sparse tree stand lines (Figure 4). Most interestingly, the greatest reduction in productivity was observed in the lower part of the treeline ecotone from the historical to contemporary closed forest lines, whereas relatively gradual decreases occurred toward the sparse tree stand lines. This does not correspond to the linear trend of decreasing air temperatures with an elevational elapse rate of 0.5–0.7 °C for every 100 m of altitude. We assume that this inconsistency in the Khibiny Mountains might be related to a declining availability of soil nutrients in relation to altitude [40,41], as well as to a shortening of the growing season (by 4–7 days) and the harsher survival conditions for tree tissues above the snowpack in winter with greater wind exposure on canopy-free terrain [16]. In the upper part of the treeline ecotone on the Putorana Plateau, the soil temperatures in the summer and winter months were lower than the air temperatures by only a few degrees and showed similar daily dynamics. This implies high soil heating in summer and cooling in winter, which is extremely unfavorable for the survival of tree sprouts and seedlings. In contrast, at the lower part of the treeline ecotone, daily changes of air temperature are smoothed out. As a result, soil temperatures decrease in summer because of shading by tree crowns and increase significantly in winter because of the protective effect of snow cover [40]. The conditions for the development of seedlings and saplings are currently optimal in the middle part of the treeline ecotone, where soils are warmed better than in the lower part but do not dry up in summer and are cooled to a lesser extent in winter than soils in the upper part of the ecotone.

4.4. Climate and Stands Changes

Comparisons of stand density changes since 1610 on different levels in forest–tundra transitions on the slopes of the Khibiny Mountains (Kola Peninsula) and the Putorana Plateau show that at the historic closed forest line, maximum tree age is about 280 and 410 years, respectively. Since the middle of the 18th century, tree numbers started to increase in the Khibiny Mountains and on the Putorana Plateau, but the recruitment rate in the eastern mountains was significantly greater than in the western ones (Figure 7). As a result, by the beginning of the 20th century there was a 58% proportion of trees of the current ones on Putorana Plateau at this level, but at Khibiny, only 14%. Although at the contemporary closed forest line, the oldest trees appeared from 175 to 360 years ago, there was an exponential increase of tree numbers in both regions only in the last century. While the maximum tree age differs significantly in the Khibiny Mountains and on the Putorana Plateau, in the open forest and sparse tree stand lines, the recruitment rates started to become very close since the middle of the 20th century in both regions. Based on these findings, we conclude that tree establishment in the lower half of the forest–tundra transition started 170–200 years earlier and was more gradual on the Putorana Plateau than in the Khibiny Mountains, while on the upper half it began 60–120 years later in the Khibiny Mountains than on the Putorana Plateau, but became synchronized since the 1930s–1950s.
Comparisons of stand biomass changes since the 17th century on the slopes of the two regions revealed that the acceleration of the exponential biomass increases differed among parts of the forest–tundra transition. Stand biomass accelerated to increase after 1930 and 1900 at the historical closed forest line, after 1950 and 1935 at the contemporary closed forest line year, after 1960 and 1940 at the open forest line, and after 1965 and 1950 at the sparse tree stand line, respectively. However, this acceleration was mainly driven by an increase of tree mass at the historical closed forest line, where the tree establishment rate was comparably low in the second half of the 20th century, while in the contemporary treeline ecotone (encompassing the upper elevational levels), it was related to changes in tree numbers and tree mass.
Given that stand structure and biomass changes took place in two distant regions with similar trends during the last century, we suppose that the predominant drivers were cross-regional changes in climatic conditions. In both regions, summers became warmer and winters became snowier during the past century [16]. In the Khibiny Mountains (on Mt. Lovchorr, 1091 m a.s.l.) the mean long-term temperatures from 1991–2010 increased by 0.6 °C in June–August, by 0.9 °C in November–March, and by 0.4 °C in April–May as compared to the period 1961–1990 [42]. Analysis of data from the Dudinka weather station, located 180 km west of the study area on the Putorana Plateau, showed that from the first decade of the 20th century to the present time, the average air temperatures of June–July increased by 1.5–2.5 °C, but only by 0.2–0.4 °C in August–September. In October–May, average air temperatures increased by 0.9 °C [43]. Overall, current warming led to a significant prolongation of the growing season with an average increase of 8–10 days from the 1940s–1960s until the 2000s–2020s (Figure 8). This prolongation is primarily related to an earlier onset, as well as to an increase in heat supply, which is extremely important for tree growth. The amount of precipitation in the summer months varied during the 20th century in both regions, showing a general tendency toward a strong increase in Khibiny (+4.9 mm decade−1), but a slight decrease by 5% on the Putorana Plateau. In contrast, the cold-period precipitation significantly increased by +14.6 mm per decade−1 in Khibiny and by +19.2 mm per decade−1 on the Putorana Plateau. Consequently, the snow cover depth at the beginning of the cold period also increased significantly by +3.3 cm per decade−1 and by +5.2 cm per decade−1, respectively.
For the Khibiny Mountains, we observed a high positive correlation between tree recruitment (birch and pine) and precipitation in July and during the beginning of the cold period (November–December), as well as with the snow depth at the beginning of the cold period [44]. Correlation analysis also showed that on the Putorana Plateau there were positive relations between the number of larches recruiting between 1910 and 2010 and the temperature indicators for the warm period, total precipitation at the beginning of the cold period (October–December), and snow depth at the end of December [44].
Previous investigations in the Polar Urals [9] showed that more than 90% of the living larches and spruces appeared after 1900 at the upper part of the treeline ecotone. During this period, the stands became denser and the treeline moved 50 m upward. In the last decades of the 20th century, the trees grew faster and the recruitment rate was at maximum. It was revealed that the upward shift coincided with a slight increase of May–August precipitation and a near doubling of September–April precipitation, while the growth enhancement matched an early growing season warming. This increase in radial growth, combined with stand densification, led to a 6 to 90 times increase of stand biomass since 1950.
In agreement with the Russian investigations, studies at alpine treeline ecotones in the Canadian Rocky Mountains [17] revealed that a widespread increase in radial growth, establishment frequency, and stand density started in the mid-20th century, coinciding with a period of rising summer temperatures and favorable moisture availability. However, relationships with seasonal climate variables varied between species and the rates of treeline movement lagged behind those of temperature warming in most cases. Thus, the establishment of Abies lasiocarpa (Hook.) Nutt. and Larix lyallii Parl. was favored by periods of higher than average winter snowfall and by warm summers with adequate moisture. Picea engelmannii Parry establishment was positively related to mean summer temperatures and to the interaction between summer temperatures and precipitation, but Pinus albicaulis Engelm. dynamics was driven only by summer temperatures.
Studies in other subarctic regions provide evidence for a climate-induced increase in forest productivity in the second half of the 20th century and, on the other hand, for a drop in the rates of biomass accumulation in the early 21st century [45,46,47]. The results of our research are indicative of a consistent increase in the rates of stand biomass accumulation (Table 3, Figure 6), which is particularly noticeable in the upper part of the current treeline ecotone. Kirdyanov et al. [46] showed that current climate changes led to upslope advances of larch forests in the northern part of the Putorana Plateau (Bolishoy Avam River) and that tree regeneration in the upper and middle parts of the treeline ecotone was most abundant in the second half of the 20th century, i.e., in the same period as our altitudinal transects in the western part of this region. The aforementioned authors attribute the observed dynamics and increase in tree stand productivity at the upper treeline with climatic warming in the subarctic.
Our findings indicate that even a relatively minor warming (0.6–0.9 °C) in the last century, a shift of the onset of the growing season (by 8–10 days), and increasing precipitation in the winter could contribute to the considerable acceleration of the growth and establishment of trees. Overall, this results in an exponential increase of stand biomass at the forest–tundra transition in the Russian subarctic regions during the past centuries.

4.5. Consequences for C Sequestration

Our results show that stand biomass on the Kola Peninsula is 1.4 to 2.5 times smaller than on the Putorana Plateau. However, because the transition between historical closed forest lines and sparse tree stand lines is wider on the Kola Peninsula (500 vs. 341 horizontal m), the total increment of stand biomass since the beginning of the 20th century is similar and amounts to 621 vs. 748 tons per kilometer of treeline length. Based on these data and the length of the upper closed forest boundaries shown on historical topographic maps (created in the 1950s–1960s) on the entire Kola Peninsula and in the northwestern and western parts of the Putorana Plateau (11′602 and 11′203 km accordingly), we calculated that the total increment of stand biomass that has accumulated from 1910 until 2017 above the historical closed forest line amounted to 7,204,842 and 8,379,844 tons, respectively.

5. Conclusions

Our study is one of the first assessments of stand biomass changes at multiple subarctic treeline sites that may serve as the basis to estimate carbon accumulation in forests at their upper growth limit. Our results showed that the growth and establishment of trees has strongly accelerated in the 340–500 m wide forest–mountain tundra transition, resulting in an exponential increase of aboveground stand biomass in the three subarctic mountain ranges. Per each km of treeline length, a total of 621–748 tons of biomass accumulated from 1910 until 2017. In agreement with our hypothesis, data from weather stations located in the three subarctic regions of Eurasia reveal that the biomass increase was likely caused by climatic changes since the beginning of the 20th century in an analogous manner. Namely, vegetation periods became longer (8–10 days) and warmer (0.6–0.9 °C) and the cold periods received more snowfall (by 10%–30%). Our results also demonstrate that the substantial differences of aboveground stand biomass in the forest–tundra ecotone among the three subarctic regions was primarily driven by species composition, as well as by the ages and morphometric structure of stands. The species composition at the mountain treelines in subarctic regions is related to the regional climates driven by continentality, snowpack depth, and growing season duration. Therefore, the obtained ground data provided here could facilitate large-scale estimations of stand biomass changes on regional levels using novel remote sensing and spatial upscaling techniques.

Author Contributions

P.A.M. conceived and coordinated the overall project; M.O.B., N.M.D., A.A.G., S.O.V., D.S.B., V.V.K., A.A.V., P.A.M., V.S.M. sampled and treated materials; A.A.G., P.A.M. analyzed the data; A.A.G., P.A.M. and F.H. prepared tables, figures and wrote the manuscript. All authors have read and agreed to the published version of the manuscript.

Funding

This study was supported by Russian Scientific Foundation under grant RSF–17–14–01112 for the sampling and analysis of collected materials and under grant RSF-21–14-00137 for preparation of the manuscript.

Acknowledgments

The authors thank many colleagues for their help in setting up the field sites and sampling in the field (Danilov K.V., Devi S.A., Golikov D.Yu, Egorov E.V., Iliyasov M.V., Kozhevnikon M.R., Konstantinov A.A., Komelin K.E., Motorin A.G., Nechaev L.V., Ovsyanikova D.D., Ranyul M.N., Solodyankin D.V., Surkov A.Y., Surkov I.A., Shetkin M., Underskikh M.G., and Volkov K.A.), and for analysis in the laboratory (Volkov K.A., and Konstantinov A.A.).

Conflicts of Interest

The authors declare no conflict of interest. The funders had no role in the design of the study, in the collection, analyses, or interpretation of data, in the writing of the manuscript, or in the decision to publish the results.

References

  1. IPCC. 2021: Summary for Policymakers. In Climate Change 2021: The Physical Science Basis. Contribution of Working Group I to the Sixth Assessment Report of the Intergovernmental Panel on Climate Change; Masson-Delmotte, V., Zhai, P., Pirani, A., Connors, S.L., Péan, C., Berger, S., Caud, N., Chen, Y., Goldfarb, L., Gomis, M.I., et al., Eds.; Cambridge University Press: Cambridge, UK, 2021; ISBN 978-92-9169-158-6. [Google Scholar]
  2. Pepin, N.; Bradley, R.S.; Diaz, H.F.; Baraer, M.; Caceres, E.B.; Forsythe, N.; Fowler, H.; Greenwood, G.; Hashmi, M.Z.; Liu, X.D.; et al. Elevation-dependent warming in mountain regions of the world. Nat. Clim. Chang. 2015, 5, 424–430. [Google Scholar] [CrossRef] [Green Version]
  3. Hudson, J.M.G.; Henry, G.H.R. Increased plant biomass in a high arctic heath community from 1981 to 2008. Ecology 2009, 90, 2657–2663. [Google Scholar] [CrossRef] [PubMed]
  4. Körner, C. Alpine Treelines: Functional Ecology of the Global High Elevation Tree Limits; Springe: Basel, Switzerland, 2012; ISBN 978-3034-80395-3. [Google Scholar]
  5. Dirnböck, T.; Essl, F.; Rabitsch, W. Disproportional risk for habitat loss of high-altitude endemic species under climate change. Glob. Chang. Biol. 2011, 17, 990–996. [Google Scholar] [CrossRef]
  6. Pauli, H.; Gottfried, M.; Dullinger, S.; Abdaladze, O.; Akhalkatsi, M.; Alonso, J.L.B.; Coldea, G.; Dick, J.; Erschbamer, B.; Calzado, R.F.; et al. Recent plant diversity changes on Europe’s mountain summits. Science 2012, 336, 353–355. [Google Scholar] [CrossRef] [Green Version]
  7. Greenwood, S.; Jump, A.S. Consequences of Treeline Shifts for the Diversity and Function of High Altitude Ecosystems. Arctic. Antarct. Alp. Res. 2014, 46, 829–840. [Google Scholar] [CrossRef] [Green Version]
  8. Moiseev, P.A.; Bubnov, M.O.; Devi, N.M.; Nagimov, Z.Y. Changes in the structure and phytomass of tree stands at the upper limit of their growth in the Southern Urals. Russ. J. Ecol. 2016, 47, 219–227. [Google Scholar] [CrossRef]
  9. Devi, N.M.; Kukarskih, V.V.; Galimova, A.A.; Mazepa, V.S.; Grigoriev, A.A. Climate change evidence in tree growth and stand productivity at the upper treeline ecotone in the Polar Ural Mountains. For. Ecosyst. 2020, 7, 2–16. [Google Scholar] [CrossRef] [Green Version]
  10. Shevtsova, I.; Herzschuh, U.; Heim, B.; Schulte, L.; Stünzi, S.; Pestryakova, L.; Zakharov, E.; Kruse, S. Recent above-ground biomass changes in central Chukotka (Russian Far East) using field sampling and Landsat satellite data. Biogeosciences 2021, 18, 3343–3366. [Google Scholar] [CrossRef]
  11. Holtmeier, F.-K. Mountain Timberlines: Ecology, Patchiness, and Dynamics; Springer: Berlin/Heidelberg, Germany, 2009; ISBN 1402097042. [Google Scholar]
  12. Payette, S. Contrasted dynamics of Northern Labrador tree lines caused by climate change and migrational lag. Ecology 2007, 88, 770–780. [Google Scholar] [CrossRef]
  13. Holtmeier, F.K.; Broll, G. Altitudinal and polar treelines in the northern hemisphere causes and response to climate change. Polarforschung 2009, 79, 139–153. [Google Scholar] [CrossRef]
  14. Wieser, G. Alpine and Polar Treelines in A Changing Environment. Forest 2020, 11, 254. [Google Scholar] [CrossRef] [Green Version]
  15. Harsch, M.A.; Hulme, P.E.; McGlone, M.S.; Duncan, R.P. Are treelines advancing? A global meta-analysis of treeline response to climate warming. Ecol. Lett. 2009, 12, 1040–1049. [Google Scholar] [CrossRef] [PubMed]
  16. Hagedorn, F.; Shiyatov, S.G.; Mazepa, V.S.; Devi, N.M.; Grigor’ev, A.A.; Bartysh, A.A.; Fomin, V.V.; Kapralov, D.S.; Terent’ev, M.; Bugman, H.; et al. Treeline advances along the Ural mountain range – driven by improved winter conditions? Glob. Chang. Biol. 2014, 20, 3530–3543. [Google Scholar] [CrossRef] [PubMed]
  17. Davis, E.L.; Brown, R.; Daniels, L.; Kavanagh, T.; Gedalof, Z. Regional variability in the response of alpine treelines to climate change. Clim. Change 2020, 62, 1365–1384. [Google Scholar] [CrossRef]
  18. Bernoulli, M.; Körner, C. Dry matter allocation in treeline trees. Phyt.-Ann. Rei Bot. 1999, 39, 7–12. [Google Scholar]
  19. Grafius, D.R.; Malanson, G.P. Biomass distributions in dwarf tree, krummholz, and tundra vegetation in the alpine treeline ecotone. Phys. Geogr. 2015, 36, 337–352. [Google Scholar] [CrossRef]
  20. Xin, L.; Yu, N.; Gao-qiang, K.; Tia, L. Contrasting changes in above- and below ground biomass allocation across treeline ecotones in southeast Tibet. J. Mt. Sci. 2016, 13, 2036–2045. [Google Scholar] [CrossRef]
  21. Rai, I.D.; Padalia, H.; Singh, G.; Adhikari, B.S.; Rawat, G.S. Vegetation dry matter dynamics along treeline ecotone in Western Himalaya, India. Trop. Ecol. 2020, 61, 116–127. [Google Scholar] [CrossRef]
  22. Speed, J.D.M.; Martinsen, V.; Hester, A.J.; Holand Mulder, J.; Mysterud, A.; Austrheim, G. Continuous and discontinuous variation in ecosystem carbon stocks with elevation across a treeline ecotone. Biogeosciences 2015, 12, 1615–1627. [Google Scholar] [CrossRef] [Green Version]
  23. Hagedorn, F.; Dawes, M.A.; Bubnov, M.O.; Devi, N.M.; Grigoriev, A.A.; Mazepa, V.S.; Nagimov, Z.Y.; Shiyatov, S.G.; Moiseev, P.A. Latitudinal decline in stand biomass and productivity at the elevational treeline in the Ural mountains despite a common thermal growth limit. J. Biogeogr. 2020, 47, 1–16. [Google Scholar] [CrossRef]
  24. Rees, W.G.; Tomaney, J.; Tutubalina, O.; Zharko, V.; Bartalev, S. Estimation of boreal forest growing stock volume in russia from sentinel-2 msi and land cover classification. Remote Sens. 2021, 13, 4483. [Google Scholar] [CrossRef]
  25. Coops, N.C.; Morsdorf, F.; Schaepman, M.E.; Zimmermann, N.E. Characterization of an alpine tree line using airborne LiDAR data and physiological modeling. Glob. Chang. Biol. 2013, 19, 3808–3821. [Google Scholar] [CrossRef] [PubMed]
  26. Montesano, P.M.; Nelson, R.F.; Dubayah, R.O.; Sun, G.; Cook, B.D.; Ranson, K.J.R.; Næsset, E.; Kharuk, V. The uncertainty of biomass estimates from LiDAR and SAR across a boreal forest structure gradient. Remote Sens. Environ. 2014, 154, 398–407. [Google Scholar] [CrossRef]
  27. Bolton, D.K.; Coops, N.C.; Hermosilla, T.; Wulder, M.A.; White, J.C. Evidence of vegetation greening at alpine treeline ecotones: Three decades of Landsat spectral trends informed by lidar-derived vertical structure. Environ. Res. Lett. 2018, 13, 084022. [Google Scholar] [CrossRef]
  28. Shiyatov, S.G.; Terent’ev, M.M.; Fomin, V.V.; Zimmermann, N.E. Altitudinal and horizontal shifts of the upper boundaries of open and closed forests in the Polar Urals in the 20th century. Russ. J. Ecol. 2007, 38, 223–227. [Google Scholar] [CrossRef]
  29. Rinn, F. TSAP V 3.5: Computer Program for Tree-Ring Analysis and Presentation; RinnTech: Heidelberg, Germany, 1998. [Google Scholar]
  30. Holmes, R.L. Dendrochronological Program Library (Computer Program); University of Arizona, Laboratory of Tree Ring Research: Tuscon, AZ, USA, 1995. [Google Scholar]
  31. Braeker, O.U. Der Alterstrend bei Jahrringdichten und Jahrringbreiten von Nadelhölzern und sein Ausgleich. Mitt. Forstl. Bundes-Vers. Wien 1981, 142, 75–102. [Google Scholar]
  32. Moiseev, P.A.; Bartysh, A.A.; Nagimov, Z.Y. Climate changes and tree stand dynamics at the upper limit of their growth in the North Ural mountains. Russ. J. Ecol. 2010, 41, 486–497. [Google Scholar] [CrossRef]
  33. Körner, C.; Paulsen, J. A world-wide study of high altitude treeline temperatures. J. Biogeogr. 2004, 31, 713–732. [Google Scholar] [CrossRef]
  34. Hoch, G. Reciprocal root-shoot cooling and soil fertilization effects on the seasonal growth of two treeline conifer species. Plant Ecol. Divers. 2013, 6, 21–30. [Google Scholar] [CrossRef]
  35. Hoch, G.; Körner, C. Global patterns of mobile carbon stores in trees at the high-elevation tree line. Glob. Ecol. Biogeogr. 2012, 21, 861–871. [Google Scholar] [CrossRef]
  36. Rossi, S.; Deslauriers, A.; Anfodillo, T.; Carraro, V. Evidence of threshold temperatures for xylogenesis in conifers at high altitudes. Oecologia 2007, 152, 1–12. [Google Scholar] [CrossRef] [PubMed]
  37. Gorchakovsky, P.L.; Shiaytov, S.G. The Upper Forest Limit in the Mountains of the Boreal Zone of the USSR. Arct. Alp. Res. 1978, 10, 349–363. [Google Scholar] [CrossRef]
  38. Juntunen, V.; Neuvonen, S.; Norokorpi, Y.; Tasanen, T. Potential for timberline advance in northern Finland, as revealed by monitoring during 1983–99. Arctic 2002, 55, 348–361. [Google Scholar] [CrossRef] [Green Version]
  39. Kullman, L.; Öberg, L. Post-Little Ice Age tree line rise and climate warming in the Swedish Scandes: A landscape ecological perspective. J. Ecol. 2009, 97, 415–429. [Google Scholar] [CrossRef]
  40. Kammer, A.; Hagedorn, F.; Shevchenko, I.; Leifeld, J.; Guggenberger, G.; Goryacheva, T.; Rigling, A.; Moiseev, P. Treeline shifts in the Ural mountains affect soil organic matter dynamics. Glob. Chang. Biol. 2009, 15, 1570–1583. [Google Scholar] [CrossRef]
  41. Hagedorn, F.; Gavazov, K.; Alexander, J.M. Above- and belowground linkages shape responses ofmountain vegetation to climate change. Science 2019, 365, 1119–1123. [Google Scholar] [CrossRef]
  42. Moiseev, P.A.; Galimova, A.A.; Bubnov, M.O.; Devi, N.M.; Fomin, V.V. Tree Stands and Their Productivity Dynamics at the Upper Growing Limit in Khibiny on the Background of Modern Climate Changes. Russ. J. Ecol. 2019, 50, 431–444. [Google Scholar] [CrossRef]
  43. Grigor’ev, A.A.; Devi, N.M.; Kukarskikh, V.V.; V’yukhin, S.O.; Galimova, A.A.; Moiseev, P.A.; Fomin, V.V. Structure and Dynamics of Tree Stands at the Upper Timberline in the Western Part of the Putorana Plateau. Russ. J. Ecol. 2019, 50, 311–322. [Google Scholar] [CrossRef]
  44. Grigoriev Andrey, A.; Shalaumova Yulia, V.; Vyukhin Sergey, O.; Balakin Dmitriy, S.; Kukarskikh Vladimir, V.; Vyukhina Arina, A.; Camarero, J.; Julio, M.P.A. Upward treeline shifts in two regions of subarctic Russia are governed by summer thermal and winter snow conditions. Forests 2022, 13, 174. [Google Scholar] [CrossRef]
  45. Bunn, A.G.; Goetz, S.J.; Kimball, J.S.; Zhang, K. Northern high-latitude ecosystems respond to climate change. Eos 2007, 88, 333–335. [Google Scholar] [CrossRef]
  46. Kirdyanov, A.V.; Hagedorn, F.; Knorre, A.A.; Fedotova, E.V.; Vaganov, E.A.; Naurzbaev, M.M.; Moiseev, P.A.; Rigling, A. 20th century tree-line advance and vegetation changes along an altitudinal transect in the Putorana Mountains, northern Siberia. Boreas 2012, 41, 56–67. [Google Scholar] [CrossRef]
  47. Tømmervik, H.; Johansen, B.; Riseth, J.Å.; Karlsen, S.R.; Solberg, B.; Høgda, K.A. Above ground biomass changes in the mountain birch forests and mountain heaths of Finnmarksvidda, northern Norway, in the period 1957-2006. For. Ecol. Manag. 2009, 257, 244–257. [Google Scholar] [CrossRef]
Figure 1. View of a section of the slope of the Lovozerskie Tundry massif (Kola Peninsula), adjacent to Lake Seidozero from the north (69.82° N, 34.94° E). The photos were taken in 1887 by Wilhelm Ramsay during the Great Kola Expedition and in 2017 by Dmitry Moiseev.
Forests 13 00254 g001
Figure 2. Study site locations at the north-western part of Eurasia (a), Kolar Peninsula (b), Polar Urals (c), Putorana Plateau (d).
Forests 13 00254 g002
Figure 3. General scheme of the forest–tundra transition with locations of study plots (F); 1—sparse tree stands line; 2—open forests line; 3—contemporary closed forests line; 4—the closed forests line in the 1950s–1960s. Areas with prevailing covers of: (A)—trees; (B)—shrubs; (C)—meadow species; (D)—tundra species; (E)—stony fields.
Forests 13 00254 g003
Figure 4. Aboveground biomass of stands dominated by different species (PO—Picea obovate, BP—Betula pubescens ssp. tortuosa, PSy—Pinus sylvestris, LS—Larix sibirica, LG—Larix gmelinii) on four altitudinal levels (1—sparse tree stands line; 2—open forests line; 3—contemporary closed forest line; and 4—historical (in 1950s–1960s) closed forest line) of forest–tundra transition in three subarctic regions of Russia (KOL—Kola Peninsula; PUR—Polar Urals; and PUT—Putorana Plataeu). Lines represent fitted polynomial regressions.
Forests 13 00254 g004
Figure 5. Changes of average tree mass, stand density, and biomass since the year 1800 on different levels of the forest–tundra transition on the slopes of the Khibiny massif (Kola Peninsula) with mountain birch and Siberian spruce dominating (on the low parts): 1—sparse tree stand line; 2—open forest line; 3—present-time closed forest line; and 4—historical (in 1950–1960s) closed forest line.
Forests 13 00254 g005
Figure 6. Changes of average trees mass, stand density, and biomass since the year 1800 on different levels in the forest–tundra transition on the slopes of the Sukhie Gory massif (Putorana Plateau) with Gmelin larch dominating: 1—sparse tree stand line; 2—open forest line; 3—contemporary closed forest line; and 4—historical (in 1950–1960s) closed forest line.
Forests 13 00254 g006
Figure 7. Comparison of changes of average tree mass, stand density, and biomass since the year 1680 on different levels in the forest–tundra transition on the slopes of the Kola Peninsula (KOA) and the Putorana Plateau (PUT): 1 level—sparse tree stand line; 2 level—open forest line; 3 level—contemporary closed forest line; and 4 level—historical (in 1950s–1960s) closed forest line.
Forests 13 00254 g007
Figure 8. Changes of the period with air temperatures above 5 °C on the slopes of the Kola Peninsula (KOL) and the Putorana Plateau (PUT) in the years 1913–2020.
Forests 13 00254 g008
Table 1. General information on the target regions.
RegionKola PeninsulaPolar UralsPutorana Plateau
Local name of studied mountainsKhibiny massifTchernaya, Slantzevay, MalikpeSukhie Gory massif
Geographical coordinates
N
E
67.55°–67.95°
33.25°–34.40°
66.75°–67.95°
65.50°–66.95°
69.34°–69.45°
90.50°–90.95°
GeologyPlutonic rockGabbro, shale phyllitic; quartzite; sandstone arkosicCrystalline basalt
Mean July air temperature, °C 1+13.5 (+8.8)+14.2 (+8.5)+12.8 (+8.5)
Mean January air temperature, °C 1−12.6 (−12.1)−22.1 (−17.9)−28.0 (−26.7)
Annual precipitation, mm 1928 (1342)460 (881)579 (699)
Snowpack depth, cm1.0–1.50.8–1.00.6–0.8
Snow cover duration, days220–250230–250240–270
Prevailing winds in summerW, SWW, SWW, NW
Prevailing winds in winterW, NW,W, NW,S, SE
Mean altitude and range of treeline, m a.s.l.397 (320–660)242 (180–350)409 (250–710)
Dominant tree species within treeline ecotone 2BP, PO, PSyLS, BPLG
1 Weather conditions in valleys and on mountain tops (800–1000 m a.s.l.); 2 PO, Picea obovata, BP, Betula pubescens ssp. tortuosa, PSy, Pinus sylvestris, LS, Larix sibirica; and LG, Larix gmelinii.
Table 2. General description of studied altitudinal transects.
RegionTransect NameLatitude (°N)Longi-tude (°E)Altitudinal Range
(m a.s.l.) 1
Horizontal
Distance (m)
Slope (%)Aspect (°)Prevail Species 4Instal-Led PlotsStudied Area, m2Sampled Trees
Low Part 2Upper Part 3Low Part 2Upper Part 3
Kola Penin-sulaIMA-I67.8333.34365–391–4109911615.39.4180PSy122400857
IMA-II67.8433.34345–370–41410324014.010.60BP122400323
KOA-I67.5934.08265–323–40947440915.39.4112BP103200968
KOA-II67.5934.07281–334–43422630711.519.0123BP103200577
KOA-III67.5834.07306–343–44713543316.013.8152BP82800696
VUD-I67.6633.58479–497–6022214344.514.085BP122400285
VUD-II67.6733.58446–481–5522923976.810.2107BP122400225
VUD-III67.6733.57490–542–63013515822.634.2169BP122400342
VUD-IV67.6833.62514–569–66310521731.225.7257BP122400560
Polar UralsPUR166.8165.58  189–31018793.7127LS5421,600699
PUR266.7965.52  230–2675354.055LS93600217
PUR366.7765.50  241–29210032.9175LS93600145
SLA66.9165.75230–260–31016022010.612.8270LS3413,300546
SHU167.8566.87  259–2972289.6193LS124800294
SHU267.8566.84  237–28521712.9180LS52000188
Putorana PlateauLAM-I69.4090.75515–563–604899532.426.1210LG124800450
LAM-II69.4190.69358–413–5509726034.530.6110LG156000464
LAM-III69.3690.73570–614–70810018925.930.1197LG93600192
LAM-IV69.4190.88458–530–63017720624.229.1270LG124800547
LAM-V69.4290.89230–258–4005623030.330.5335LG114500320
1 Altitude of low level—contemporary closed forest line—upper level of transect; 2 Part of transect between historical closed forest line and contemporary closed forest line; 3 Part of transect between contemporary closed forest line and sparse tree stands line; 4 PO, Picea obovata; BP, Betula pubescens ssp. tortuosa; PSy, Pinus sylvestris; LS, Larix sibirica; and LG, Larix gmelinii.
Table 3. Parameters of exponential equations (y = axb) modeling the dependency of total above-ground biomass (kg tree−1) on stem basal diameter for Picea obovata (PO), Betula pubescens ssp. tortuosa, (BP), Pinus sylvestris (PSy), Laric sibirica (LS), and Larix gmelinii (LG) growing in the treeline ecotone in the study regions. Parameters were determined for different tree species, for trees with single-stemmed (single), or multi-stemmed (multi) growth forms (Kola Peninsula only). The number of model trees used to establish the relationship (n) and the coefficient of determination (R2) for the relationship in these models are given.
RegionSpeciesGrowth FormabnR2
Kola PeninsulaPOsingle0.03652.221110.99
BPmulti0.01452.509530.98
PSysingle0.01392.685160.98
Polar UralsLSsingle0.01412.587210.99
Putorana PlateauLGsingle0.01162.725380.99
Table 4. Stand parameters (mean ± SD (max)) on different altitudinal levels in forest–tundra transition in subarctic regions of Russia.
LevelsKola PeninsulaPolar UralsPutorana Plateau
Sum of crown projections, m2 ha−1
11303 ± 879 (2860)900 ± 861 (2583)1013 ± 696 (1570)
24656 ± 1351 (6759)4526 ± 2442 (7669)3416 ± 2847 (4702)
36581 ± 1564 (10,244)7483 ± 2986 (11,743)8461 ± 3120 (13,096)
410,743 ± 1524 (13,301)6137 ± 1251 (7065)
Stand density, trees ha−1
1356 ± 188 (733)303 ± 318 (838)481 ± 303 (727)
21099 ± 450 (1526)835 ± 379 (1363)684 ± 322 (1217)
31366 ± 686 (2525)840 ± 335 (1475)1149 ± 420 (1475)
41580 ± 341(2500)898 ± 363 (1467)
Stem basal diameter, cm
14.1 ± 1.2 (6.2)6.0 ± 3.1 (10.0)7.4 ± 1.9 (9.0)
26.0 ± 1.4 (8.5)12.2 ± 5.3 (20.2)11.0 ± 3.0 (15.3)
37.0 ± 2.0 (9.1)19.2 ± 4.4 (25.1)14.3 ± 7.2 (17.6)
48.9 ± 1.5 (11.5)23.6 ± 1.8 (29.9)
Tree height, m
11.4 ± 0.5 (2.4)2.5 ± 0.8 (3.7)3.1 ± 0.6 (3.8)
22.2 ± 0.4 (2.8)5.7 ± 1.9 (9.0)5.0 ± 1.0 (6.6)
32.9 ± 0.9 (3.7)7.5 ± 2.2 (11.0)6.2 ± 2.5 (7.4)
45.6 ± 1.0 (7.4)9.8 ± 3.4 (12.7)
Tree age, years
145 ± 13 (72)38 ± 13 (66)51 ± 15 (56)
258 ± 19 (92)94 ± 38 (156)78 ± 14 (91)
362 ± 16 (91)134 ± 34 (189)100 ± 58 (151)
485 ± 10 (107)187 ± 67 (252)
Aboveground stand biomass, t ha−1
11.6 ± 1.6 (5.5)2.1 ± 2.1 (5.7)2.2 ± 2.1 (3.9)
27.6 ± 3.0 (8.8)16.1 ± 8.4 (45.4)12.3 ± 8.1 (24.3)
315.3 ± 7.4 (20.7)40.6 ± 12.1 (99.6)38.2 ± 18.3 (56.4)
427.5 ± 10.6 (37.7)61.5 ± 12.5 (76.1)
Aboveground tree mass, kg stem−1
13.7 ± 1.9 (7.4)5.2 ± 3.9 (11.3)5.4 ± 3.7 (9.7)
27.8 ± 3.9 (17.9)22.0 ± 12.3 (40.8)21.0± 10.7 (47.0)
314.8 ± 11.6 (44.7)55.0 ± 26.8 (97.1)34.8 ± 19.3 (46.8)
417.1 ± 4.6 (24.5)-88.2 ± 35.3 (147.1)
Annual individual tree productivity, kg tree−1 yr−1
10.083 (0.175)0.138 (0.332)0.107 (0.186)
20.135 (0.498)0.234 (0.502)0.269 (0.626)
30.237 (0.553)0.411 (0.630)0.347 (0.564)
40.200 (0.255)0.473 (0.727)
Long-term net stand productivity, t ha−1 yr−1
10.04 ± 0.03 (0.11)0.05 ± 0.06 (0.17)0.04 ± 0.02 (0.07)
20.15 ± 0.08 (0.22)0.16 ± 0.05 (0.56)0.16 ± 0.09 (0.32)
30.26 ± 0.15 (0.32)0.33 ± 0.14 (0.85)0.38 ± 0.04 (0.44)
40.31 ± 0.09 (0.44)0.34 ± 0.10 (0.47)
1—sparse tree stand line; 2—open forest line; 3—contemporary closed forest line; 4—historical (in 1950s–1960s) closed forest line.
Table 5. Increment of aboveground stand biomass (ton on each km of length) (mean ± SD) above and below the contemporary closed forest line on the slopes of the Khibiny massif (Kola Peninsula) and Sukhie Gory (Putorana Plateau) between 1910 and 2017.
MassifPosition by Relation to Closed Forest LineWidth of Transect PartWithin General Width
of Transect Part
Per 1 m
of Transect Part
1985–20171955–20171910–20171985–20171955–20171910–2017
Khibinyabove300 ± 121175 ± 84215 ± 97222 ± 970.6 ± 0.30.7 ± 0.30.8 ± 0.3
below202 ± 125264 ± 173358 ± 224397 ± 2451.4 ± 0.71.8 ± 0.82.1 ± 1.0
Sukhie goryabove239± 117148 ± 55236 ± 78285 ± 950.7 ± 0.21.1 ± 0.31.3 ± 0.3
below104 ± 44207 ± 67342 ± 124463 ± 1932.2 ± 0.93.5 ± 1.14.6 ± 1.1
Table 6. Local conditions on the treeline sites in different studied subarctic regions of Russia.
Regional LocationCenter of Kola PeninsulaWestern Slope of Polar UralsEastern Slope of Polar UralsWest of Putorana Plateau
Treeline altitudes (mean and range), m a.s.l.397
(320–660)
210
(160–270)
242
(180–350)
409
(250–710)
June–August air temperature, °C+11.0 ± 1.2+10.4 ± 1.7+11.5 ± 2.2+8.6 ± 1.4
November–March air temperature, °C−7.4 ± 1.0−16.5 ± 2.1−15.9 ± 2.0−19.2 ± 1.3
Season with temperatures >5 °C, days10410110172
Growing degree days (>5 °C), GDD543524552364
June–August precipitation, mm276 ± 92214 ± 73212 ± 60168 ± 48
November–March precipitation, mm521 ± 125205 ± 46155 ± 31304 ± 92
Sum of sunshine hours during summer659 ± 131690 ± 127740 ± 108786 ± 136
Mean July soil temperature, °C (year)2018201820052018
in tundra+10.3 ± 1.4+11.6 ± 3.0+12.1 ± 3.0+11.5 ± 3.5
on sparse stand line+10.8 ± 1.2+14.5 ± 1.9+10.8 ± 3.0
on open forest line+11.3 ± 1.2+11.7 ± 1.9+10.4 ± 2.0
on closed forest line+12.4 ± 1.5+13.6 ± 3.3+8.6 ± 1.5
Mean February soil temperature, °C (year)2018201820042018
in tundra+0.3 ± 0.2−5.8 ± 2,5−12.4 ± 2.4−19.8 ± 1.9
on sparse stand line+0.4 ± 0.2−8.6 ± 1.7−16.7 ± 1.0
on open forest line+0.6 ± 0.2−1.9 ± 0.7−6.2 ± 0.3
on closed forest line+0.6 ± 0.3−1.4 ± 0.3−5.3 ± 0.3
Snow depth, cm (year)2019201820062019
in tundra107 ± 35 (29–234)76 ± 2619 ± 4 (3–30)21 ± 7 (0–105)
on sparse stand line114 ± 34 (87–160)33 ± 7 (5–66)42 ± 21 (1–136)
on open forest line168 ± 38 (128–208)171 ± 18 (100–260)114 ± 41 (33–198)
on closed forest line155 ± 30 (124–185)140 ± 19 (75–215)119 ± 36 (58–211)
in tree stands below closed forest line137 ± 18 (119–156)137 ± 18 (89–165)132 ± 7 (83–200)
Table 7. Dominant species on the upper part of the treeline ecotones depending on site conditions.
RegionCentral Part
of Kola Peninsula
Western Macroslope of Polar UralsEastern Macroslope of Polar UralsWestern Part
of Putorana Plateau
SummerWinterSummerWinterSummerWinterSummerWinter
Climatic
and site conditions
moderately warmwarmmoderately coldmoderately coldwarmmoderately coldcoldextremely cold
cloudycloudymoderately cloudymoderately cloudyslightly
cloudy
slightly
cloudy
little cloudylittle cloudy
rainysnowymoderately rainyslightly snowymoderately rainylittle
snowy
slightly rainymoderately snowy
Extremely deep snowpack, late snowmelt, unfrozen soilsBPBP, DFBP, DFDF
Deep snowpack, normal snowmelt, slightly frozen soilsBPBP, POBP, LSLG
Middle snowpack, early snowmelt, frozen soils in winter, comparably wet summerBPPOLSLG
Shallow snowpack, early snowmelt, frozen soils in winter, dry and warm in summerPSyLSLSLG
PO—Picea obovata, BP—Betula tortuosa, PSy—Pinus sylvestris, LS—Larix sibirica, LG—Larix gmelinii, DF—Duschekia fruticose.
Publisher’s Note: MDPI stays neutral with regard to jurisdictional claims in published maps and institutional affiliations.

