Article

Sensory and Nutraceutical Properties of Infusions Prepared with Grape Pomace and Edible-Coated Dried–Minced Grapes

1
Chemistry Research Center (CQ-VR), Department of Applied Biology, School of Life and Environmental Sciences, University of Trás-os-Montes and Alto Douro, 5000-801 Vila Real, Portugal
2
Chemistry Research Center (CQ-VR), Department of Food Engineering, School of Life and Environmental Sciences, University of Trás-os-Montes and Alto Douro, 5000-801 Vila Real, Portugal
3
CITAB, Centre for the Research and Technology of Agro-Environmental and Biological Sciences and Inov4Agro, Department of Applied Biology, Institute for Innovation, Capacity Building and Sustainability of Agrifood Production, School of Life and Environmental Sciences, University of Trás-os-Montes and Alto Douro, 5000-801 Vila Real, Portugal
*
Author to whom correspondence should be addressed.
Coatings 2022, 12(4), 443; https://doi.org/10.3390/coatings12040443
Submission received: 26 February 2022 / Revised: 20 March 2022 / Accepted: 21 March 2022 / Published: 24 March 2022
(This article belongs to the Special Issue Edible Coatings and Films for Food and Medical Applications)

Abstract

:
Grapes and grape/wine byproducts such as non-fermented/semi-fermented or fermented grapes, skins, and seeds are a rich source of polyphenols, known to have nutraceutical properties. Grape byproducts present a great potential for the development of new beverages, such as infusions and tisanes. This work aimed to study the effects of different drying temperatures on the sensory and chemical properties of fermented grape pomace infusions, and to evaluate the same sensory and chemical characteristics on infusions of dried–minced grapes coated with different organic matrices. At the end of the work, it was possible to conclude that the presence of some coating agents results in changes in the sensory characteristics of the infusions, also altering the recorded antioxidant activity. However, all matrices seemed suitable for coating, and none showed negative characteristics in the infusions. Furthermore, of the three infusions (50, 60, and 70 °C), the one prepared with dehydrated grape pomace at 70 °C was the one with the highest pH value, highest °Brix value, and significantly greater concentration of phenolic compounds. In the sensory analysis, the constant presence of a bitter taste and astringent sensation stood out, which are not positive aspects from a sensory point of view. However, the addition of natural flavors—especially honey—made the infusion more sensorially pleasant. Overall, grape pomace dehydrated at 70 °C made it possible to obtain a product with phenolic compounds and antioxidant capacity that is more promising to integrate into human food, particularly via the preparation of infusions. Furthermore, the consumer may, if they so choose, add honey or another agent as a natural flavoring, making the final infusion more pleasant from a sensory point of view.

1. Introduction

Grapes are among the most produced fruits in the world, with approximately 78 million tons produced each year [1]. Being one of the most consumed fruits, only one-third of grapes are consumed fresh; their main use—almost 50% of the production—is to make wine [2], out of which 20–30% represents waste products [3,4]. According to Kalli [5], in Mediterranean countries, the annual production of grape pomace can reach 1200 tons per year. The grape pomace is the solid material that remains after the pressing and the fermentation processes, and accounts for 20% of the original grape weight [6]. This waste consists of skins, remaining pulp, seeds, and stalks [7]. Such a large volume of waste generates serious environmental and economic concerns in the wine industry, and there is a need to make this industry sustainable throughout the supply chain. Indeed, the valorization of byproducts is one of the biggest challenges of the food industry, and giving new life to wine waste is important, as it will allow waste to be minimized as much as possible. One possible application is the use of dried non-fermented/semi-fermented and even fermented grapes in the preparation of infusions or tisanes [8].
Numerous studies have shown that grapes and their byproducts—in this case, grape pomace—have preventive and medicinal nutritional characteristics, which give them applications in a variety of products [9,10]. Based on its polyphenolic contents—namely, anthocyanins, flavan-3-ols, flavonols, stilbenes, and phenolic acids [11,12]—grape pomace is recognized as having high antioxidant activity [13,14,15]. The polyphenols’ action can reduce the onset of diseases associated with oxidative stress, such as cancer and coronary heart disease [16], in addition to other effects, such as anti-inflammatory, anticancer, antimicrobial, antiviral, cardioprotective, neuroprotective, and hepatoprotective activities [17]. Infusions prepared with dried grapes or grape pomace can be a sustainable way of valorizing these products, and also, a sustainable way of extracting nutraceutical compounds [18]. However, according to [19], drying grape pomace can affect the antioxidant capacity due to the significant degradation of polyphenols.
Dehydrated and minced grapes are perishable materials and are difficult to preserve—even in the fridge. Over time, and due to sugars, the material can form clumps that are difficult to break up, or can even be spoiled by fungi [18]. One way to control and prevent such contamination is by encapsulating or coating the dried grapes in organic matrices, thus preventing contact with the air [20]. Encapsulation consists of coating the material to be protected with polymeric materials, with a size in the order of micrometers, so as to guarantee protection against adverse environmental conditions, changes in pH, temperature, and/or light, ensuring greater material stability [21]. Encapsulation has been increasingly used in a diverse range of industries, including pharmaceuticals, cosmetics, and food. Alginate is a low-cost, nontoxic, biocompatible, biodegradable, biostable, hydrophilic polymer [22,23] with wide industrial use, mainly due to its ability to form hydrogels, spheres, fibers, or films—especially in the presence of calcium [24]; it is mainly used in the food and biomedical domains as films or edible coatings to improve and stabilize the structure of foods, or for controlled drug delivery and cell encapsulation devices, respectively [23]. Some of the products that are often coated/encapsulated in alginate via the extrusion method include probiotics [25]. Another polymer that stands out for these contributions is agar-agar, as it is inert, biocompatible, nontoxic, and cheap; furthermore, as an encapsulating/coating agent, it has high gelling power and high gel strength at low concentrations [26]. Arabic gum is an emulsifier and food stabilizer widely used in the food industry due to its easy incorporation into foods and beverages; it is an ideal compound to use in food coatings because it has high solubility and low viscosity, the biggest advantage being the fact that it does not affect the original flavor and texture of the food. The addition of this compound will improve the coating efficiency and stability of the final product [27]. Chitosan is a polysaccharide that can be easily processed into films [28,29]. This compound has several advantages, such as high bioavailability, biodegradability, low toxicity, bio-adhesiveness, and the ability to bind to cell membranes [30]. These characteristics justify the fact that it is so widely used in the encapsulation of cosmetics, drugs, and food products [31]. It is important to point out that economical sources of chitosan are available from crustacean processing byproducts, allowing the realization of sustainable actions and ecological solutions for the encapsulation of food/food supplements [32]. Due to its biocompatibility, biodegradability, low cost, and film-forming capacity, the properties of gelatin have also been widely studied [33] as coating agents; furthermore, its barrier properties against oxygen, carbon dioxide, and lipids make its use favorable as an edible material for food packaging, thus increasing shelf life [34,35]. In this study, we used extrusion as a coating technique. This technique is one of the oldest, cheapest, and simplest; it is also one of the most widely used in the transformation of hydrocolloids into capsules, simply incorporating the material to be coated into a solution of the encapsulating material. As this is a technique that does not use organic solvents, it does not cause changes to the material to be coated, which is preferable when dealing with food or even pharmaceutical compounds [36,37]. This technique is increasingly used in pharmaceutics, cosmetics, and the food industry.
This study aimed to (1) evaluate the sensory and chemical characteristics of infusions of dried grapes of the Moscatel Galego and Touriga Nacional Vitis vinifera varieties, and those coated with different organic matrices, including agar-agar, alginate, Arabic gum, chitosan, and gelatin, and (2) study the effects of different drying temperatures on the sensory and chemical properties of infusions prepared from the pomace of fermented and dried grapes of the Moscatel Galego variety.

2. Materials and Methods

2.1. Plant Material

The plant material used for encapsulation belonged to the Moscatel Galego and Touriga Nacional Vitis vinifera varieties. The grape pomace was obtained from the Moscatel Galego variety.
Grapes and grape pomace, harvested in 2020, were kindly provided by a producer in the Alijó region (north Portugal). This material was immediately stored at −30 °C to prevent enzymatic degradation of the polyphenols until further use.

2.2. Grapes Encapsulation and Grape Pomace Drying

2.2.1. Encapsulation of Grapes

The grapes used in the encapsulation were previously dehydrated in a ventilated oven at 60 °C (Blinder, FD, USA) and minced.
The organic matrices used are described in Table 1, including agar-agar, alginate, chitosan, gelatin, and three different Arabic gums, usually used in wine-fining, commercialized by SAI. As the amount of the Moscatel Galego grape variety was reduced, it was not possible to carry out the encapsulation in all of the organic matrices under study.
Small balls of dried and minced grape samples (1500 g) were constructed and stored in sterilized (autoclave, 121 °C, 15 min) Petri dishes. Each Petri dish contained 6 replicas (6 balls), with a sterilized toothpick (autoclave, 121 °C, 15 min) inserted to facilitate a posterior coating process (Figure 1a).
The preparation of the encapsulating/coating agents was carried out following very similar steps. All of the coating agents were prepared according to the concentrations expressed in Table 1 and adapted as described in the work of Vilela et al. [38].
The encapsulating agents were mixed with 100 mL of boiling distilled water and stirred with a magnetic stirrer (100 rpm). To the Arabic gums, we added gelatin (4 leaves of gelatin/100 mL of Arabic gum) to increase their viscosity. In the chitosan solutions, it was necessary to acidify the medium in order to obtain a completely homogeneous solution and allow the complete solubilization of the chitosan, so 6–14 drops (one drop ≅ 0.05 mL) of 37% HCl (v/v) were added. After obtaining the perfectly homogeneous solutions, they were left to cool for 20 min until encapsulation.
During the encapsulation process, the sample was held by the sterilized sticks and dipped into the matrix solution. When removing, the excess of the coating agent was dropped and the sample was placed in the sterilized Petri dish for 10 min, repeating the process (Figure 1b). After encapsulation, the samples were stored in a refrigerator at 4 °C until preparation of the infusions. The controls consisted of samples of each grape variety without encapsulation.

2.2.2. Grape Pomace Drying

The grape pomace samples were obtained after fermentation and pressing of the grape must of the Moscatel Galego grape variety. To study the effects of different grape pomace drying temperatures on the sensory and chemical characteristics of the infusions, the material was dried at three different temperatures (50, 60, and 70 °C) using a ventilated oven (Blinder, FD, USA). The weight was recorded daily until it had stabilized, so as to calculate the water loss percentage. The drying process took 2–4 days, depending on the temperature. After drying, the grape pomace samples were stored in a refrigerator at 4 °C.

2.3. Preparation of Infusions

2.3.1. Preparation of Encapsulated/Coated Grape Infusions

The infusions were prepared in accordance with the results of previous work, in which infusion time and temperature were optimized for this plant material [8].
For physicochemical determinations, one coated ball, previously weighed on a precision balance (Table 2), was added to 100 mL of boiling water and stirred with the aid of a glass stick. After 5 min, the infusion was filtered using a filter paper equivalent to Whatman Nº1 (11 µm pore) and kept in glass cups with lids for later use.

2.3.2. Grape Pomace Infusions

The process of preparing the infusions was similar to that described above, with 3 g of each sample (50, 60, and 70 °C) being added to 500 mL of boiling water. After being filtered, the infusions were also kept in glass cups with lids.

2.4. Sugar (°Brix) Content, pH, and Colorimetric Parameters

The determination of infusions’ pH was performed via potentiometry, and the °Brix was measured using a pocket refractometer. The system used for color determination was the CIELAB method, and a calibrated colorimeter (Spectrophotometer CM-2300d, Konica Minolta, Langenhagen, Germany) was used.

2.5. Total Phenolic Content Quantification

The methodology of Singleton and Rossi [39], with minor modifications, was used for total phenolic quantification—20 µL of extract, 100 µL of Folin–Ciocalteu phenol reagent (1:10 in double-distilled H2O), and 80 µL of 7.5% Na2CO3 were mixed in a 96-well microplate (Multiskan™ FC Microplate Photometer, Waltham, MA, USA). The microplate was incubated for 15 min at 45 °C, in the dark. Afterward, the absorbance values against a blank were recorded at 765 nm using a microplate reader (Multiskan GO Microplate Spectrophotometer, Thermo Scientific, Vantaa, Finland). A standard curve with gallic acid (R2 = 0.9985) at different concentrations was constructed, and total phenolic results were expressed as mg/mL gallic acid equivalents (mg/mL GAE) as the mean ± standard deviation (SD) of three replicates.

2.6. Antioxidant Activity (AA)

The 2,2-azino-bis(3-ethylbenzothiazoline-6-sulfonic) acid (ABTS) radical scavenging activity was evaluated in a 96-well microplate using the method of Re et al. [40]. This assay is based on the reaction of the formation of ABTS + cation radicals, which absorb light at a wavelength of 734 nm. The presence of antioxidant compounds in samples can be monitored by the inhibition of the color development of the resulting ABTS + radicals, which is proportional to the concentration of such antioxidants. The ABTS solution was prepared by mixing 7 mM ABTS at pH 7.4 (5 mM NaH2PO4, 5 mM Na2HPO4, and 154 mM NaCl) with 2.5 mM potassium persulfate, and allowing the mixture to stand in the dark at room temperature for 16 h. This mixture was then diluted with ethanol to give an absorbance of 0.70 ± 0.02 units at 734 nm, and became the ABTS working solution. Using a 96-well microplate, 15 µL of the extract was mixed with 285 µL of the freshly prepared ABTS working solution and incubated at room temperature in the dark for 10 min. Absorbance values were measured at 734 nm, with ABTS radical scavenging activity expressed from a linear calibration curve (R2 = 0.9991) of Trolox as µg Trolox equivalent/g DW, as the mean ± standard deviation (SD) of three replicates.

2.7. Infusions’ Sensory Profiles

All of the tastings were carried out in a sensory laboratory [41] by a panel of tasters made up of 10 panelists, all belonging to the panel of tasters of DeBA/ECVA-UTAD, with training in sensory evaluation of food and beverages. For samples presentation, ISO tasting glasses [42] were used. The infusions were served at room temperature (20–22 °C). To clean the palate between the evaluation of samples, mineral water and toast were provided. A spittoon was also provided to the tasters.

2.7.1. Sensory Evaluation of Moscatel Galego Grape Pomace Infusions

The analysis used to test the infusions with Moscatel Galego grape pomace was quantitative descriptive analysis (QDA), which allowed us to describe and quantify the sensory characteristics of the infusions. In the first tasting session, the panel of tasters sensorially analyzed 3 infusions that were differentiated by the drying temperature of the grape pomace. To carry out the test, several parameters were selected and scored from 1 to 5, where 1 indicates that the sensory characteristic is not perceived, and 5 indicates that the sensory characteristic is intense and perceived. The test form had 4 basic parameters (appearance, aroma, taste/flavor, and texture in the mouth), within which other parameters were included that should be scored as mentioned above. The appearance parameter consisted of color intensity and turbidity, while the aroma parameter consisted of herbaceous aroma, smoked/burnt aroma, natural dry leaf aroma, and grape aroma. The taste/flavor parameter includes other parameters, namely, sweet, sour, bitter, herbaceous, astringent, and grape flavors. Finally, in the texture parameter, the body is classified.
After the first tasting session, it was perceived that, in sensory terms, the infusion of Moscatel Galego grape pomace was not very appealing to the panel of tasters. Thus, from the sample with the drying temperature that showed the highest content of total phenolic compounds and antioxidant activity, five other infusions were prepared—one with pomace alone, and the other four containing grape pomace and other flavors, namely, cinnamon, ginger, honey, and mint, in order to find a more sensorially attractive infusion for the tasters. Thus, a second tasting session was performed, using the same panel, the same tasting sheet, and these new grape pomace infusions.
In addition, in both tasting sessions, we asked the taster’s preference as follows: “After tasting the infusions, which one do you prefer”?

2.7.2. CATA Test of Infusions Prepared with Coated Grapes

For the tasting, infusions were prepared using 2 balls of the minced grape sample, already coated, in 500 mL of boiling water. They were left to rest for 5 min, filtered with a traditional tea strainer, and stored in blue screw-on glass bottles until the moment of tasting.
To carry out the third tasting session, a white sheet was placed on the tasting table to help the taster to have a more realistic and differentiated access perception of the color of the infusion. The tasting glasses—ISO standards [42]—with the infusions properly identified, were then placed (Figure 2a). The test sheet was also placed on the test table (Figure 2b).
The test used in the coated samples was the qualitative descriptive analysis test CATA (check all that apply). In this test, tasters were exposed to a list of characteristics that may be present in the sample, and were asked to select those that they could perceive. The frequency of citation of each characteristic was used to derive the final description of the product [43].

2.8. Data Analysis

To ensure statistical representation, all of the experiments were performed at least in triplicate. The results were submitted to analysis of variance (ANOVA), Duncan’s tests (sensory analysis data), and Tukey’s tests (physicochemical analyses) at 5% significance. A spider graph was constructed to represent the infusions’ sensory profiles after QDA analysis. Principal component analysis (PCA), based on correlation matrices, was also performed. All analyses were conducted using the Statistica 13 software (TIBCO Software Inc., Palo Alto, CA, USA, 2017, version 13.3.0.).

3. Results

3.1. Sugar (°Brix) Content and pH

According to Table 3, it is possible to verify that the infusions present pH values in the acidic range (pH 3.5–5). Moreover, the pH of the grape pomace infusions of the Moscatel Galego variety presents an increase according to the increase in the temperature used for drying the grape pomace. Regarding the infusions prepared with dried, minced, and coated Moscatel Galego and Touriga Nacional grapes, there are significantly different pH values between the infusions prepared with the control or prepared with coated grapes, meaning that almost all matrices may affect the infusions’ final pH.
The Brix shows the approximate sugar content in the infusion samples. Refractometry, using the Brix scale, is a physical method used to measure the concentration of soluble solids present in the sample. Soluble solids are the total solids dissolved in water, consisting mostly of sugars; therefore, the Brix scale is considered to be a scale for measuring sugars [44]. The Brix values obtained from Moscatel Galego grape pomace, as shown in the final three lines of Table 3, were close to 0 (zero). This result is explained by the fact that the grape pomace comes from the finished alcoholic fermentation of Moscatel Galego grape must. However, drying at higher temperatures (70 °C) probably led to the release of sugars still present in the woody part of the grape pomace, which explains the slight—although not significant—increase in the Brix of the infusions when the drying temperature was higher.
Regarding infusions prepared with coated material, the Brix values of the infusions are between 0.8–1.4. The control samples both presented a value of 1.13, with a drastic decrease in the value of Brix in the samples containing Arabic gum—except for Sweet Gum, which seems to have a sugary composition. This same decrease was also observed in the presence of chitosan and agar (Table 3).

3.2. Infusions’ Colorimetric Parameters

The colorimetric parameters L*, a*, and b* were evaluated using the CIELAB color system. This technique is used to quantify color and eliminate possible errors from visual quantification. The a* coordinate varies between green (−a*) and red (+a*), while the b* varies between blue (−b*) and yellow (+b*). The L* coordinate evaluates the luminosity, and varies from black (0%) to white (100%) [45]. Through the CIELAB color system, it was also possible to obtain the values of the parameters C and H; these parameters are obtained from parameters a* and b*. The H parameter indicates the tonality of the infusion, while the C gives us the saturation or chromaticity [46].
In Table 4, we can see that there are significant differences (p ≤ 0.05) in the mean values of the coordinates L*, a*, b*, C, and H of the different infusions.
In the coated grape infusions (Table 4), comparing the L* parameter of the control infusions (MG control and TN control) with the infusions from coated samples, we can see that there are significant differences between all samples, between grape varieties, and between encapsulating agents. Higher L* values represent lighter colors; thus, compared to the others, the lightest infusion was from the Touriga Nacional variety coated with chitosan (TN Ch 2.5%). The encapsulating agent that caused the greatest variation in the L* parameter was gelatin, since it causes a more accentuated decrease in lightness in both varieties, which leads us to verify that gelatin darkens the infusions.
Regarding parameter a*, it shows a positive value in all of the infusions, which means that they have a reddish color, and there is no encapsulating agent that makes the infusions greenish in color.
In terms of the parameter b*, it appears that there were significant differences between practically all of the infusions. Furthermore, infusions prepared with the Touriga Nacional grape variety in the presence of chitosan (TN Ch 0.6%; 1.5% and 2.5% and TN Al + Ch 0.4%) showed a significantly more intense yellow color, thus standing out from the others. It is likely that the presence of chitosan, given its yellowish hue, can significantly change the color of the infusion, making it more yellow.
There were also significant differences between samples in terms of tonality (H). However, when looking at Table 4, no infusion stands out due to the difference in tone; it is only observed that the infusions of both varieties prepared with balls coated with agar generally present higher hue values.
Regarding the chromaticity © parameter, similar to what was seen with the b* parameter, there was a marked increase in the chromaticity level in the Touriga Nacional infusions prepared with chitosan. This fact is probably due not only to the encapsulating agent, but also to the fact that the Touriga Nacional grapes are red and, therefore, give rise to infusions with more color. As can be seen from the chromaticity value of the control infusion of Touriga Nacional (TN control), this had a significantly higher C value (5.94) than the control infusion for the Moscatel Galego (MG control) variety (4.36) (see Table 4).
Concerning grape pomace infusions, at the end of Table 4, the results obtained show significant differences between the three infusions for all parameters evaluated. High L* values represent lighter colors, with grape pomace at 50 °C representing the lightest color compared to other infusions.
Comparing the three infusions, the infusion of grape pomace at 50 °C is the one that has the highest values of the parameters b* and C, followed by the infusions at 70 °C and 60 °C. The parameter a* has negative values, with the infusion prepared with the grape pomace sample dehydrated at 70 °C showing the most negative value, followed by the infusion at 50 °C and, finally, the infusion at 60 °C. As the values of a* are negative, the color of the infusion is greenish. Concerning b*, positive values were obtained, thus giving the infusions a yellowish color (Table 4).
In terms of the parameter H, as can be seen in Table 4, with increasing temperature the H parameter increased, and the infusion with dehydrated grape pomace at 70 °C was the one with a significantly higher hue value.

3.3. Total Phenolic Content and Antioxidant Activity (AA) Quantification

3.3.1. In Infusions Prepared with Dried–Minced Coated Grapes

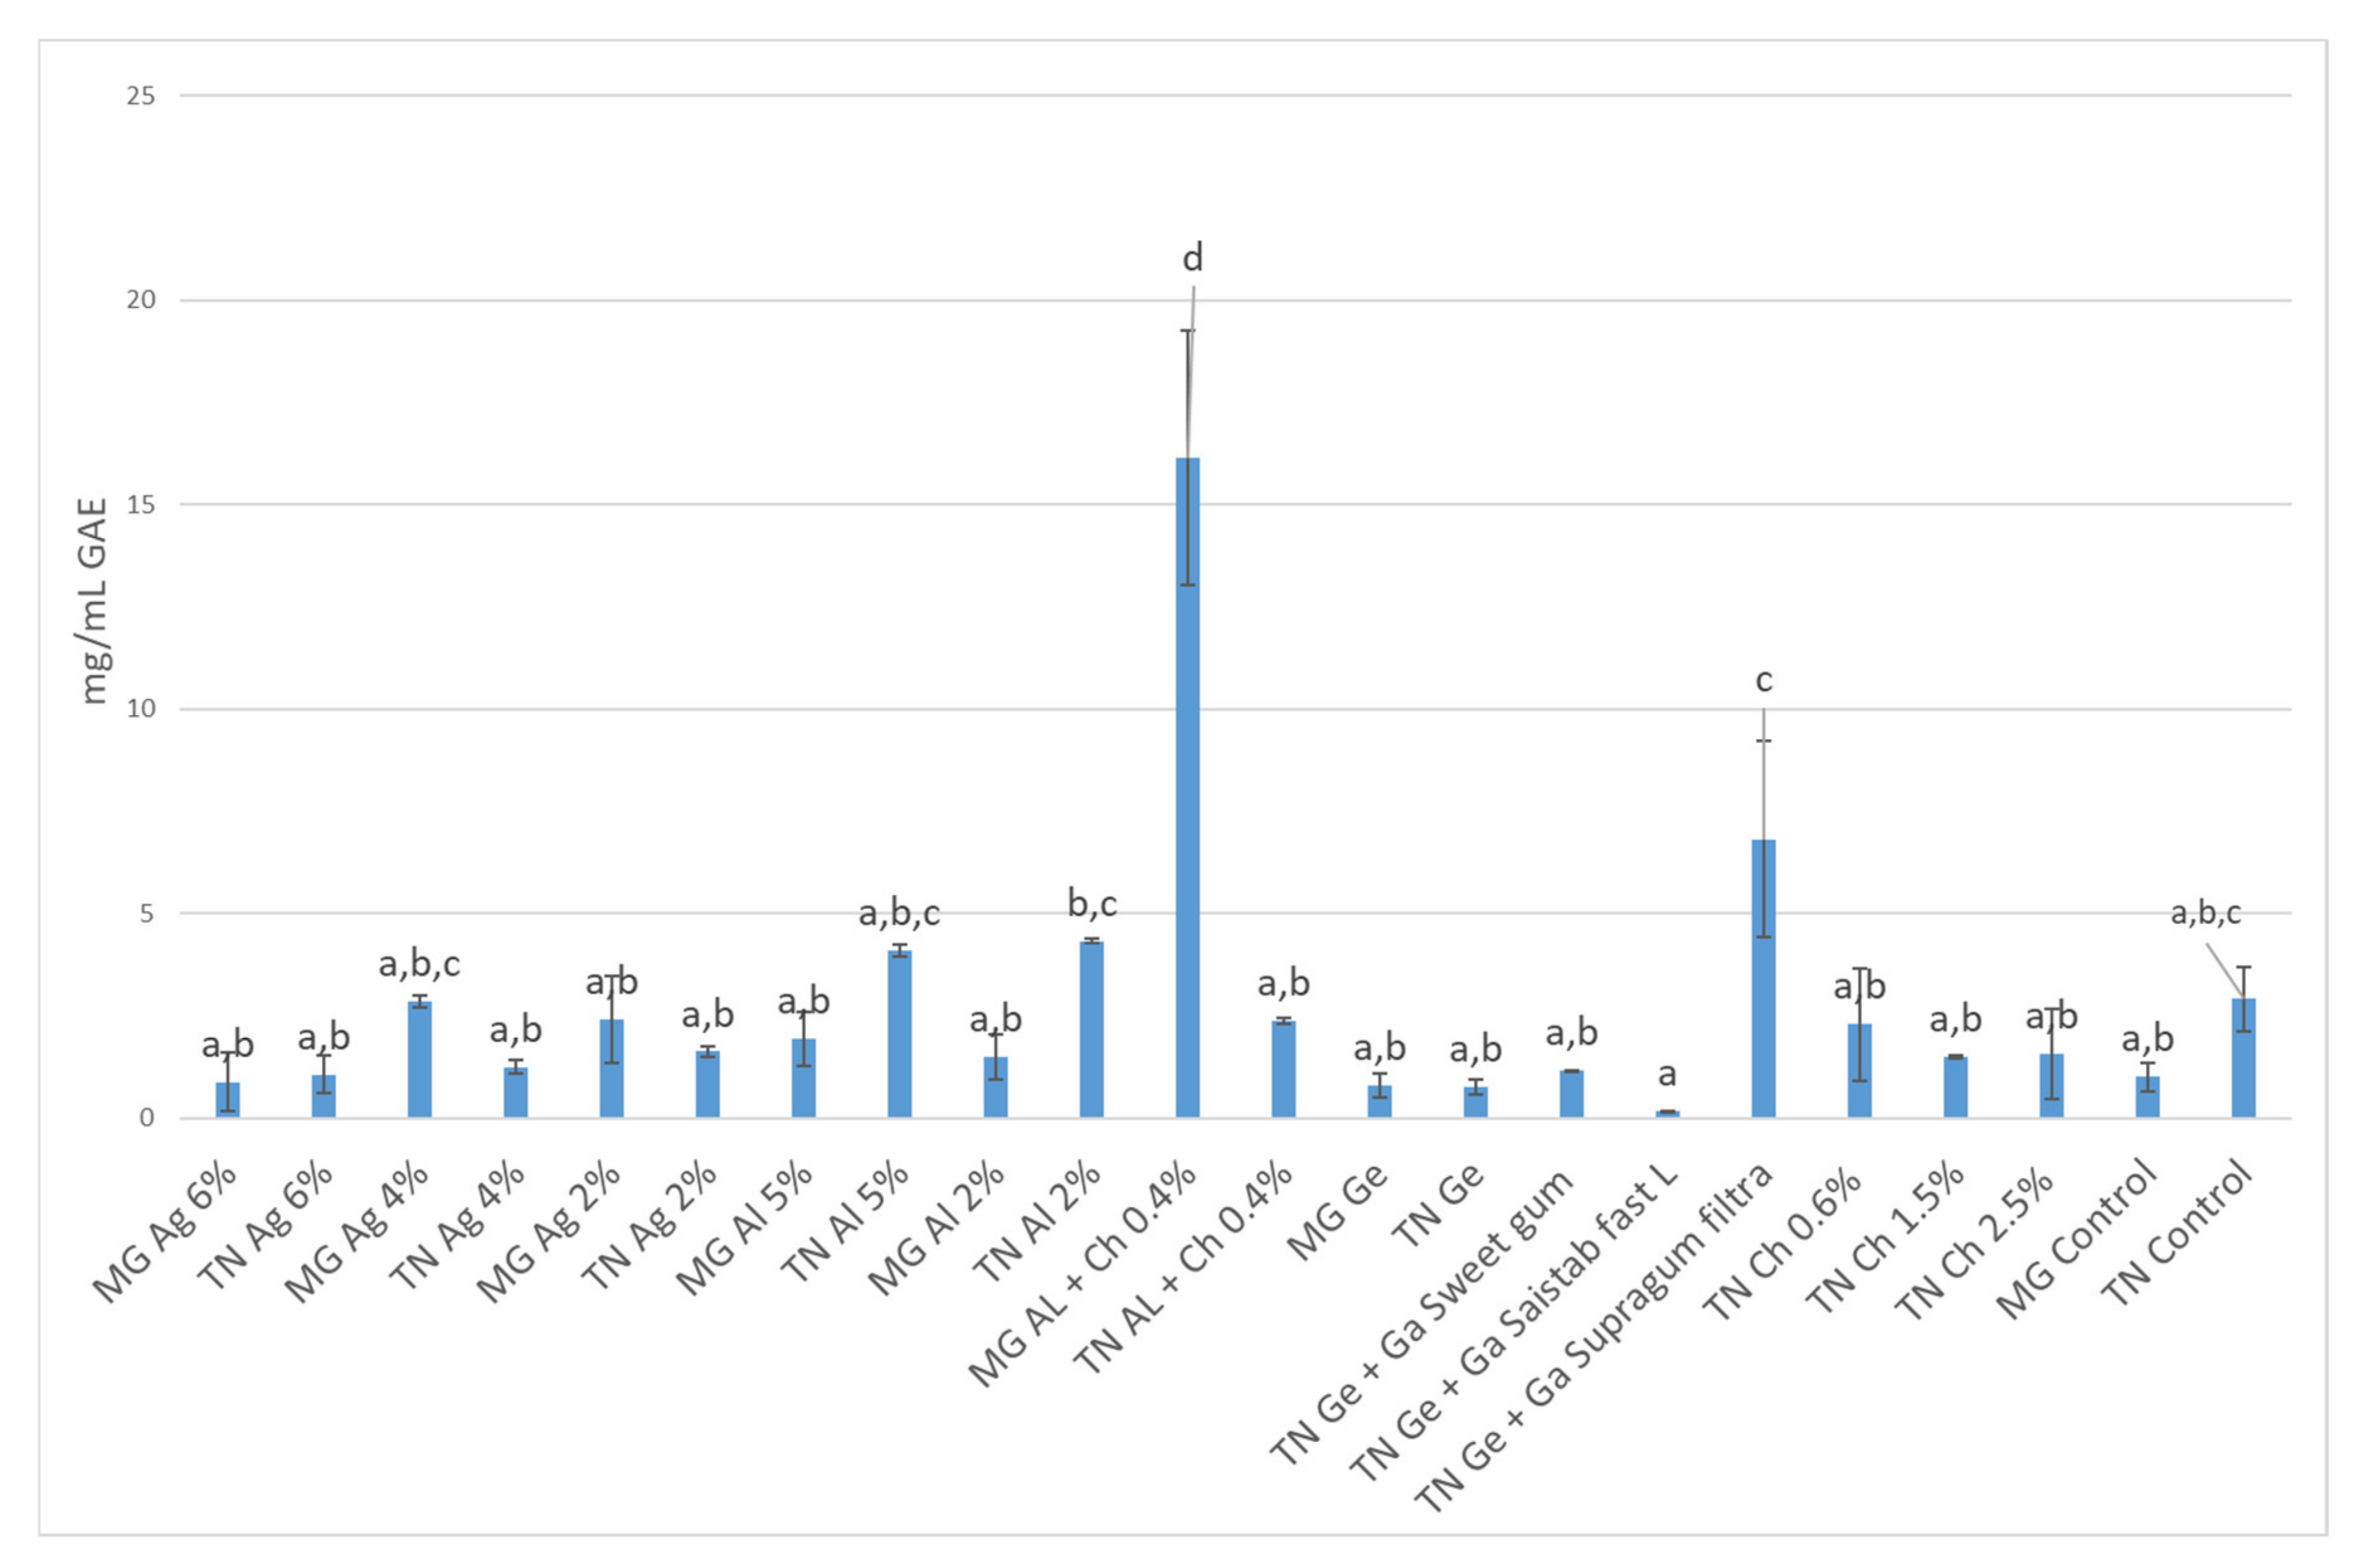
To quantify the total phenolic compounds, the method of Folin and Ciocalteu was used, adopted as the official method by the OIV [47] for wines and musts. Figure 3 presents the average concentration in total phenols of the different samples. It can be seen that the Touriga Nacional variety generally presented a higher concentration of total phenols than the Moscatel Galego variety, which was to be expected, since it is a red variety [48]. However, there was no trend concerning the varieties in terms of total phenolic concentrations; that is, there was not a range of similar values in infusions from the same variety.
This fact gave rise to two possible explanations: (1) the encapsulating agents also have in their composition phenolic compounds that can interfere with the quantification of total phenols; (2) encapsulating agents do not contain phenolic compounds, but may contain compounds that react with the Folin–Ciocalteu reagent (a mixture of phosphomolybdate and phosphotungstate) in their composition, thus providing a false quantification.
The most probable hypothesis seemed to be the latter. It is already described in the literature that the Folin–Ciocalteu reagent not only measures total phenols, but also reacts with any reducing substance, thus measuring the total reducing capacity of a sample and not just the level of phenolic compounds. The reagent may also react with some nitrogen-containing compounds, such as hydroxylamine and guanidine [49], as well as other compounds, such as thiols, amino acids, proteins, some vitamins, and inorganic ions [50,51,52,53].
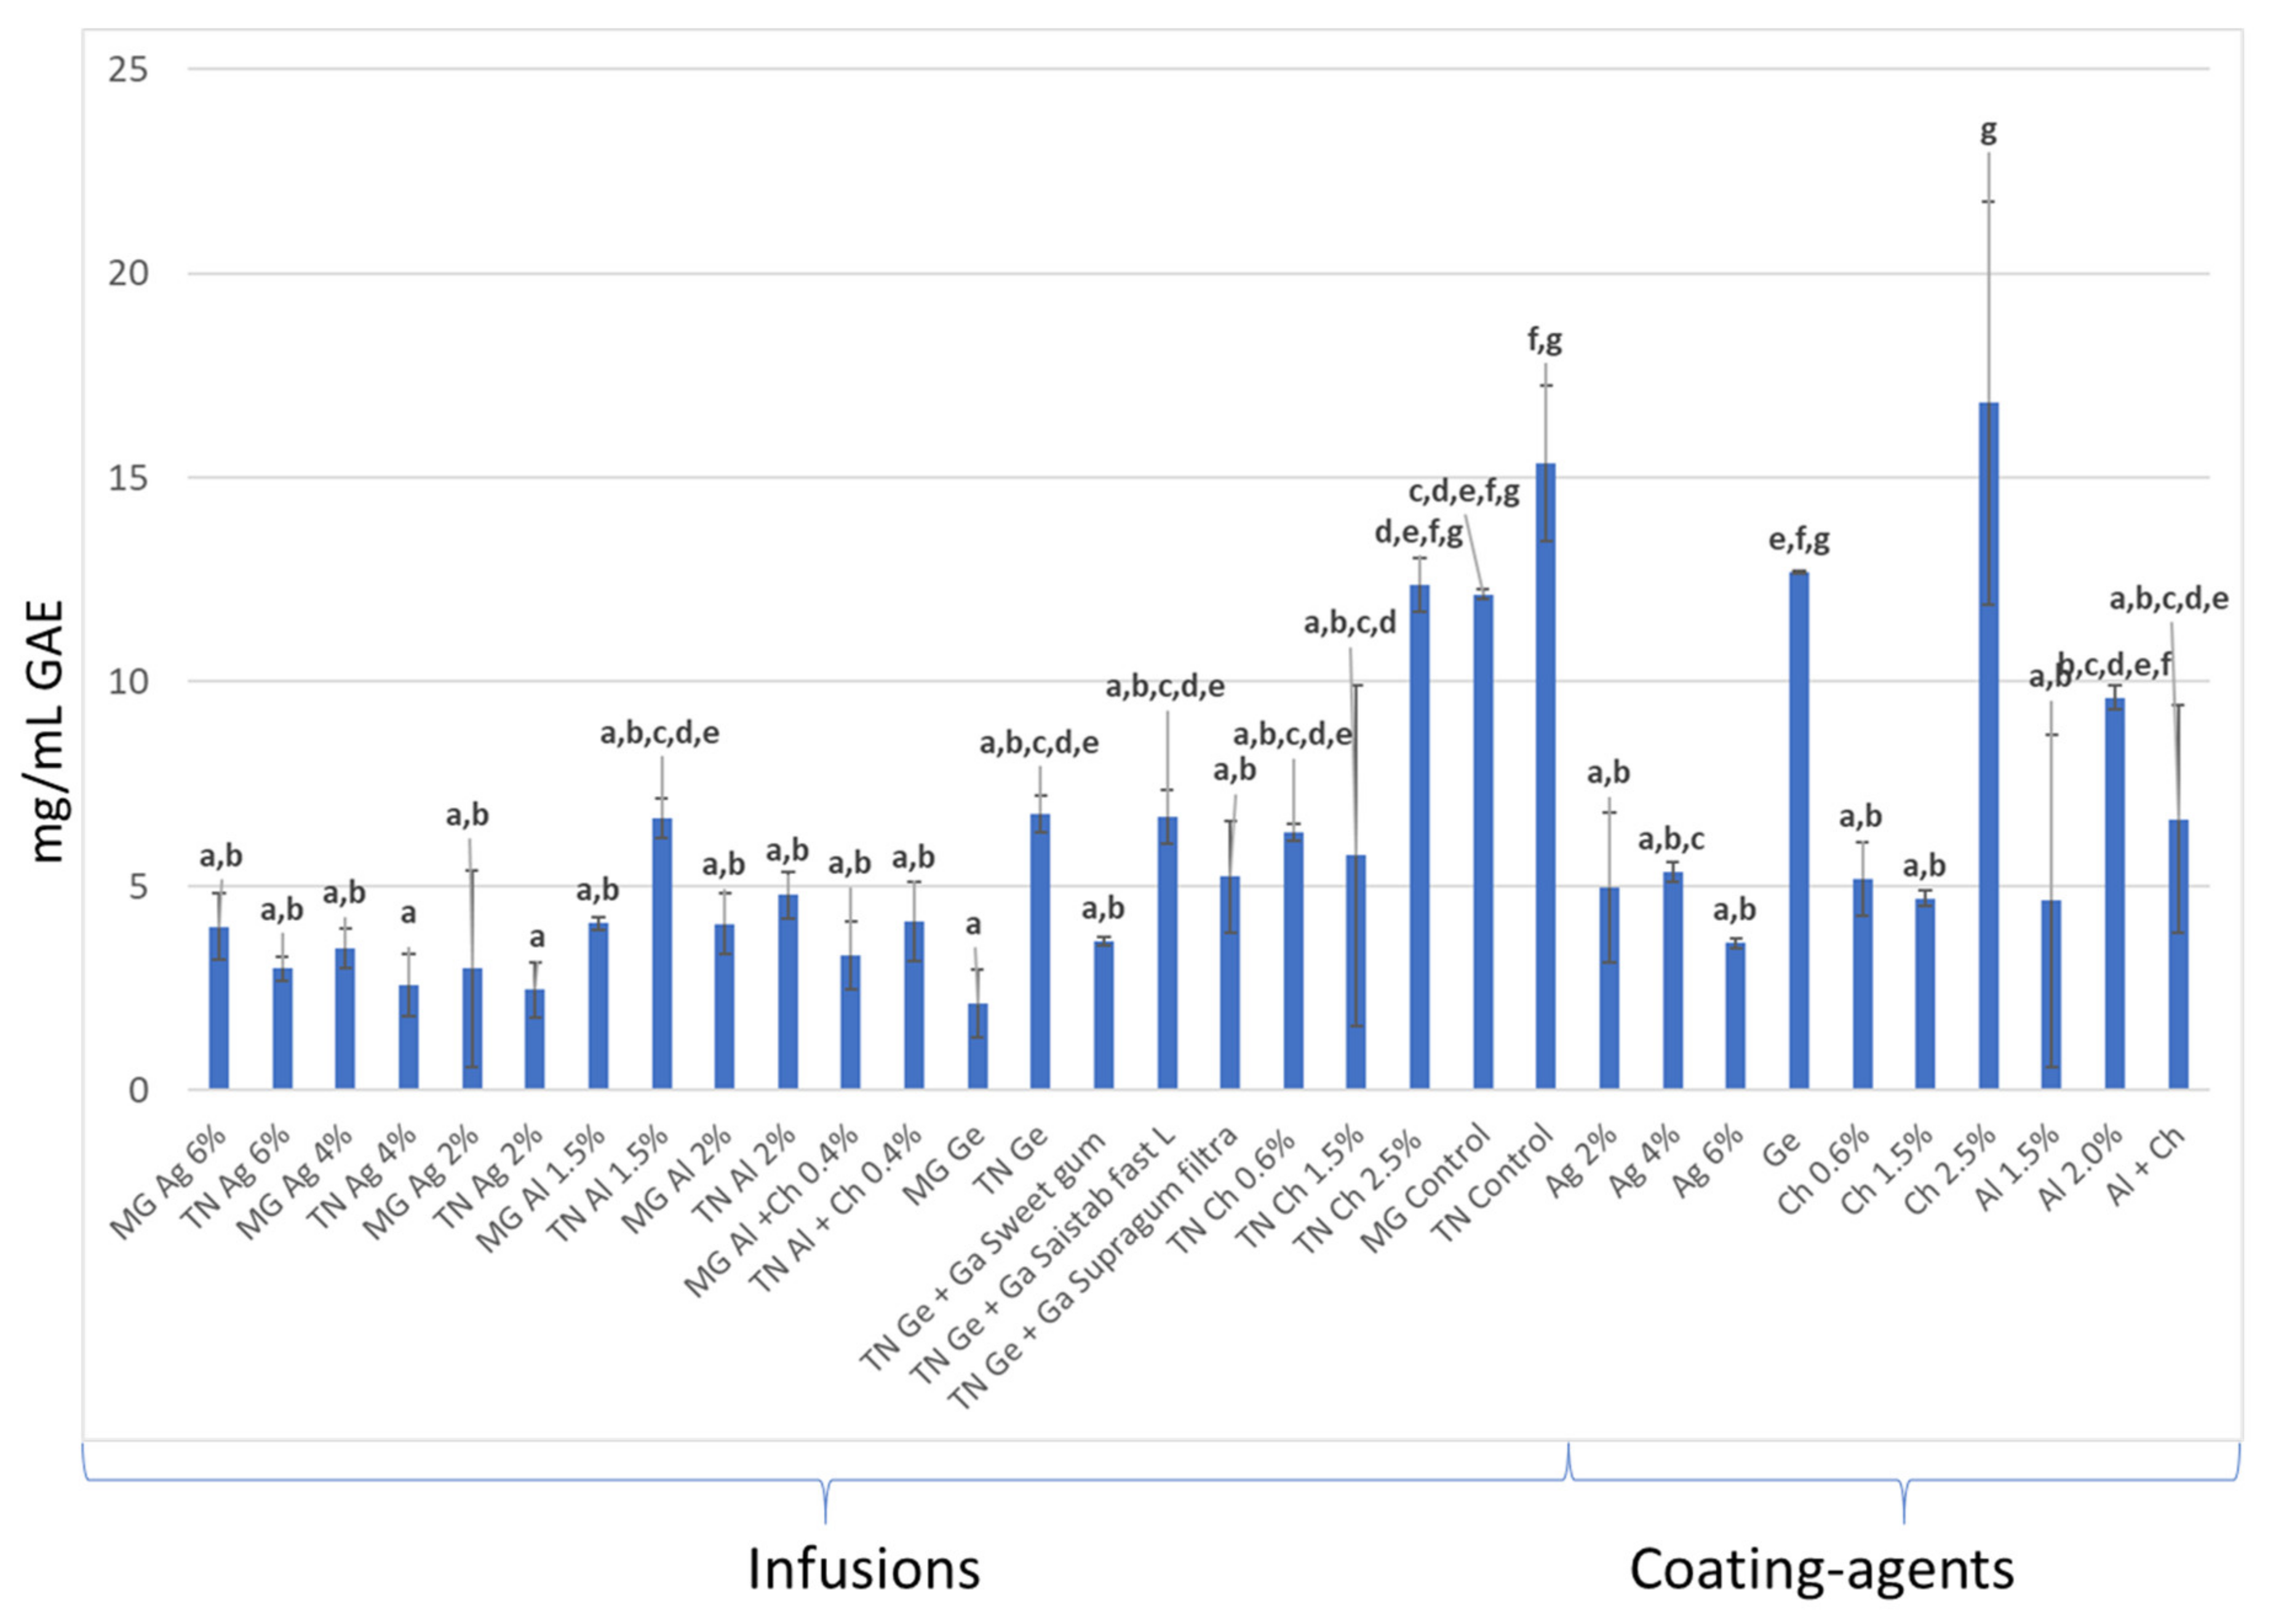
Thus, and in order to verify a possible interference of the encapsulating agents, new determinations were carried out, both for the infusions and for the matrices used in the encapsulation, via the same protocol that was initially used for the samples. Figure 4 shows the results obtained regarding the second quantification of total phenols. As can be seen, the dispersion of values is not identical to the first determination, indicating that this method may not be the correct one for the determination of the total phenolic composition of the infusions. Furthermore, in the encapsulating solutions, phenolic compounds were also detected which may indicate the presence of reducing substances, as mentioned above.
It is known that grape phenols exert an antioxidant effect under different conditions of oxidative stress in vivo, and can induce an intracellular reduction of reactive oxygen species (ROS) in different cell types [54]. Thus, determining the antioxidant activity (AA) of the infusions is important.
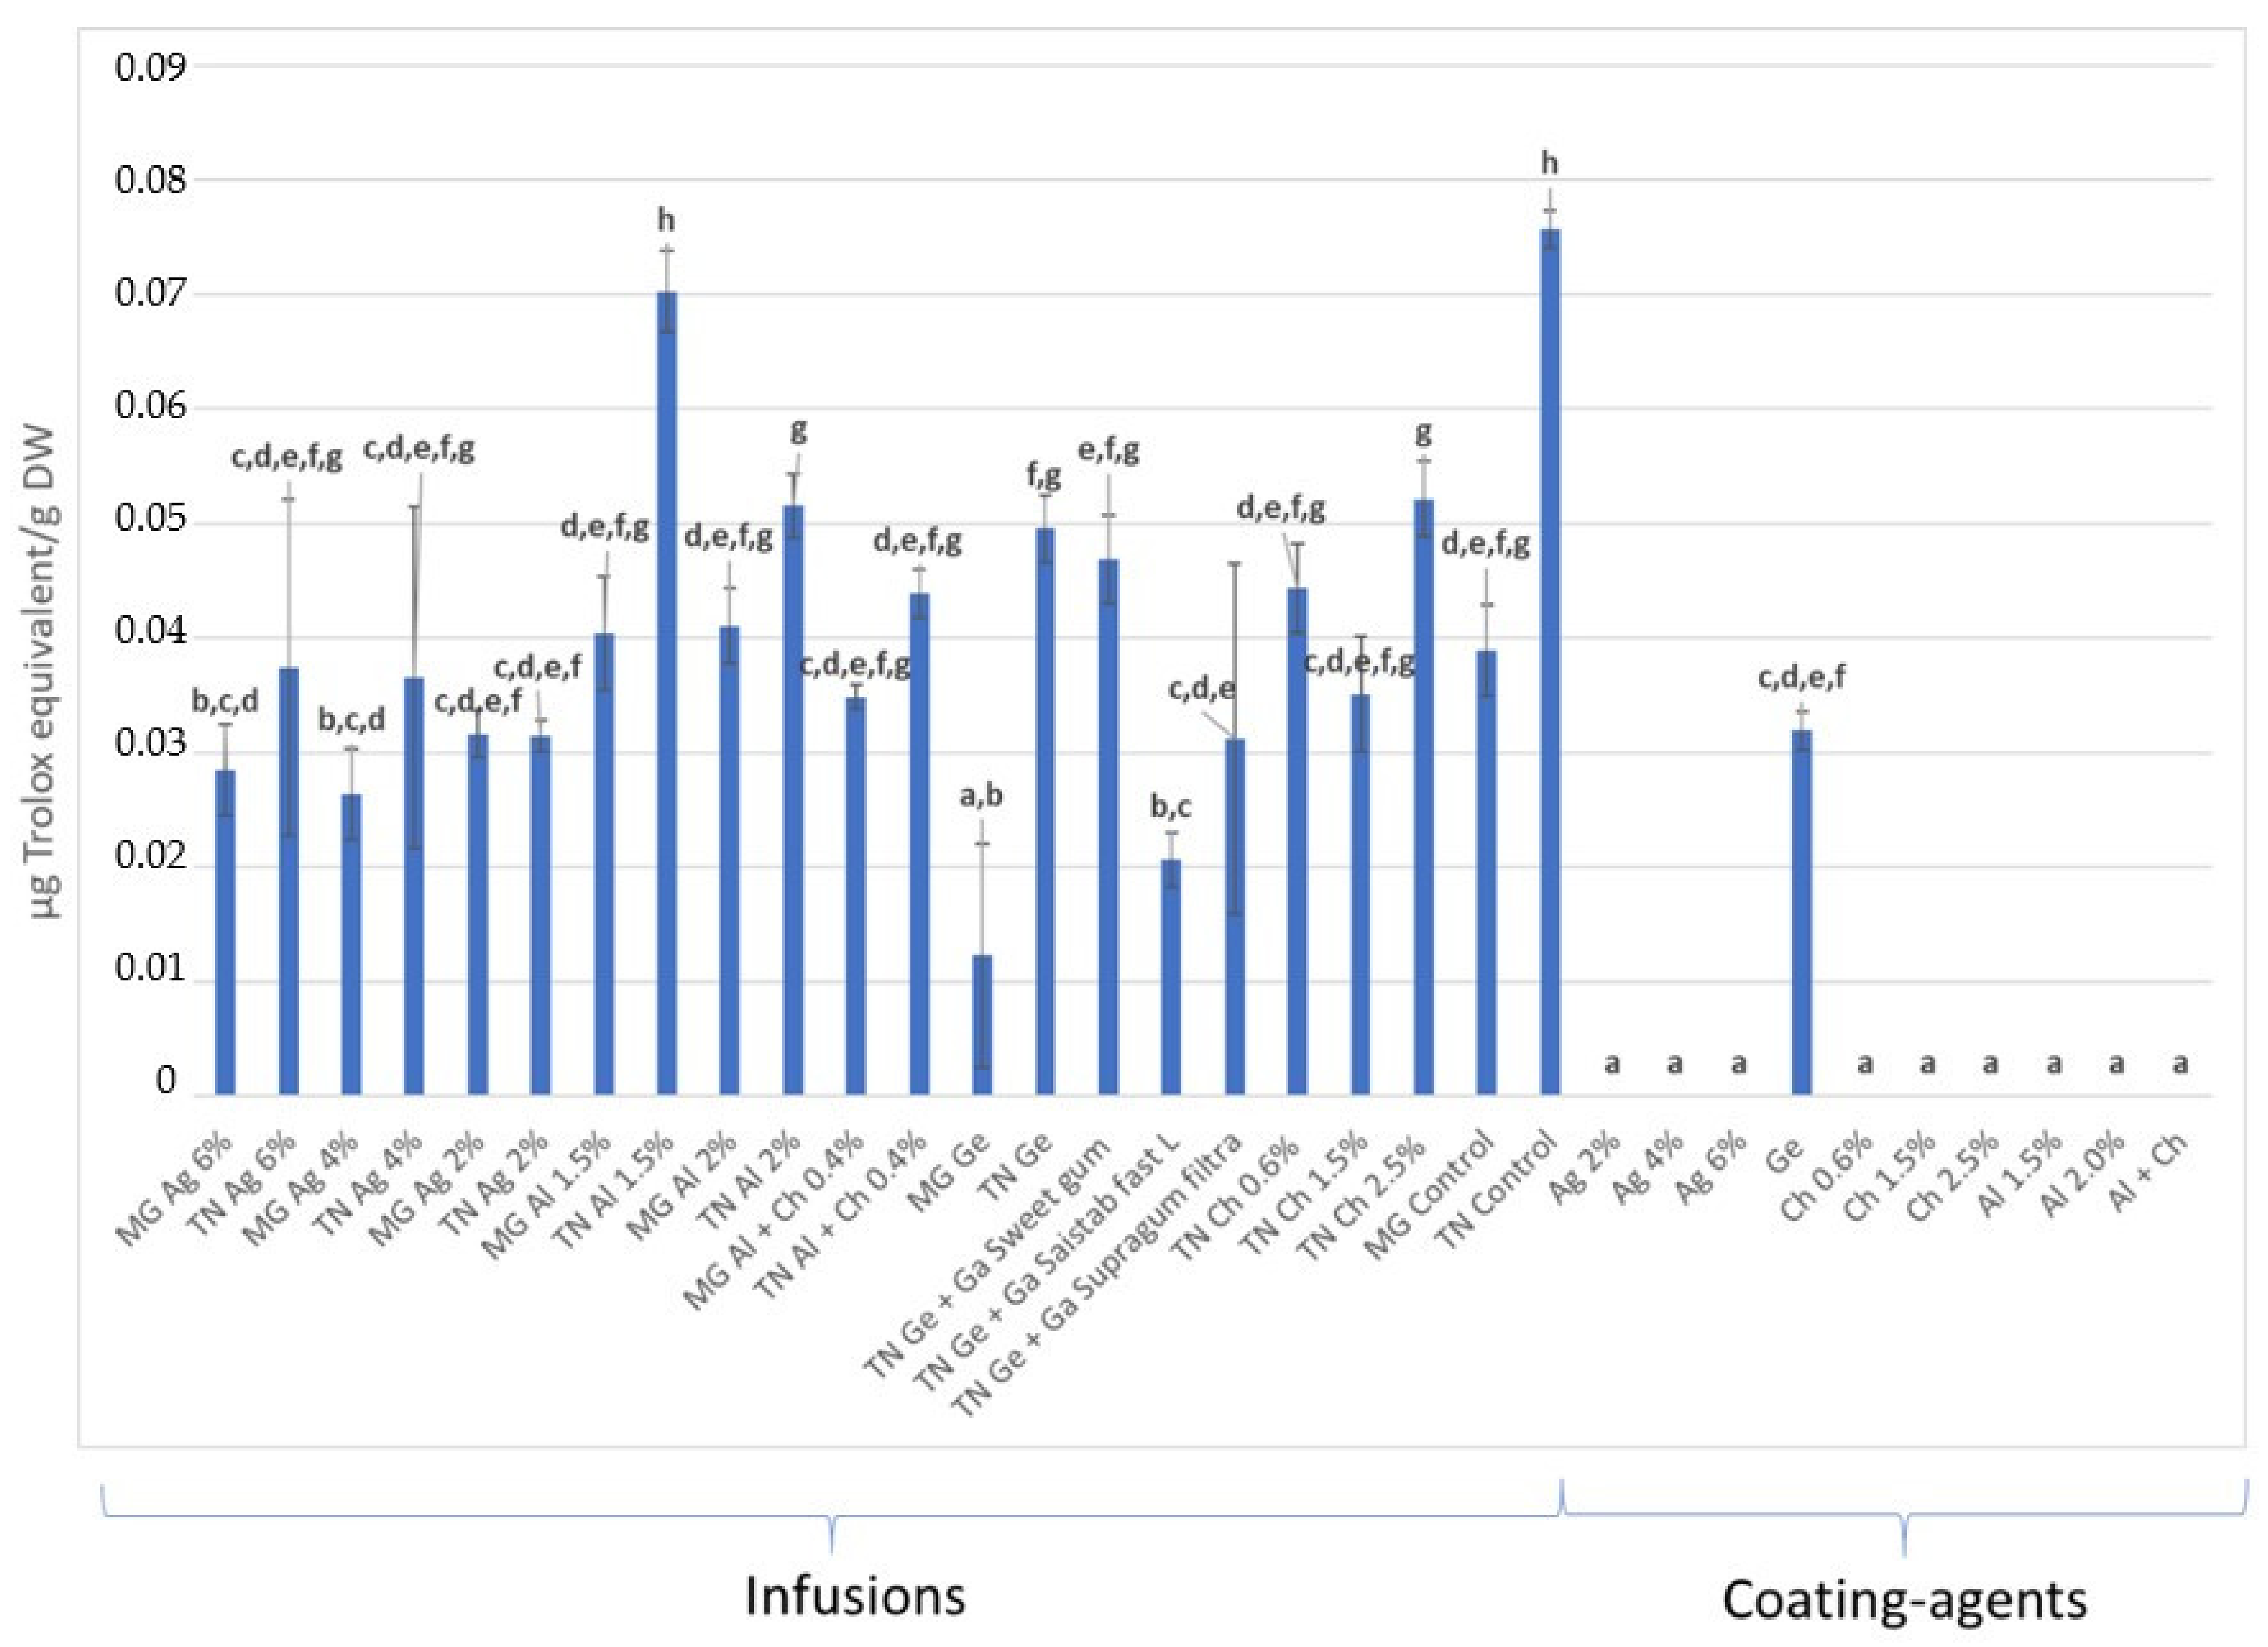
The first, most pertinent observation is that the AA of the infusions is very low—in the medium range of 0.03 µg Trolox equivalents/g DW (Figure 5).
Observing the results of the Touriga Nacional variety, all encapsulating agents significantly reduced the AA of the infusions, except for the infusion prepared with dried–minced grapes coated with 1.5% alginate (TN Al 1.5%). In the Moscatel Galego variety, the AA values were lower than those presented by the Touriga Nacional infusions, which is to be expected given that, being a white variety, they will have a lower concentration of compounds with antioxidant activity.
It was also possible to verify that, in the set of organic matrices (encapsulating agents), only in the gelatin solution was antioxidant activity detected. This fact may be due to an error of determination, since in the literature it has not yet been determined whether simple gelatin, for cooking purposes, presents compounds with antioxidant activity.

3.3.2. In Infusions Prepared with Dried Grape Pomace at Different Temperatures

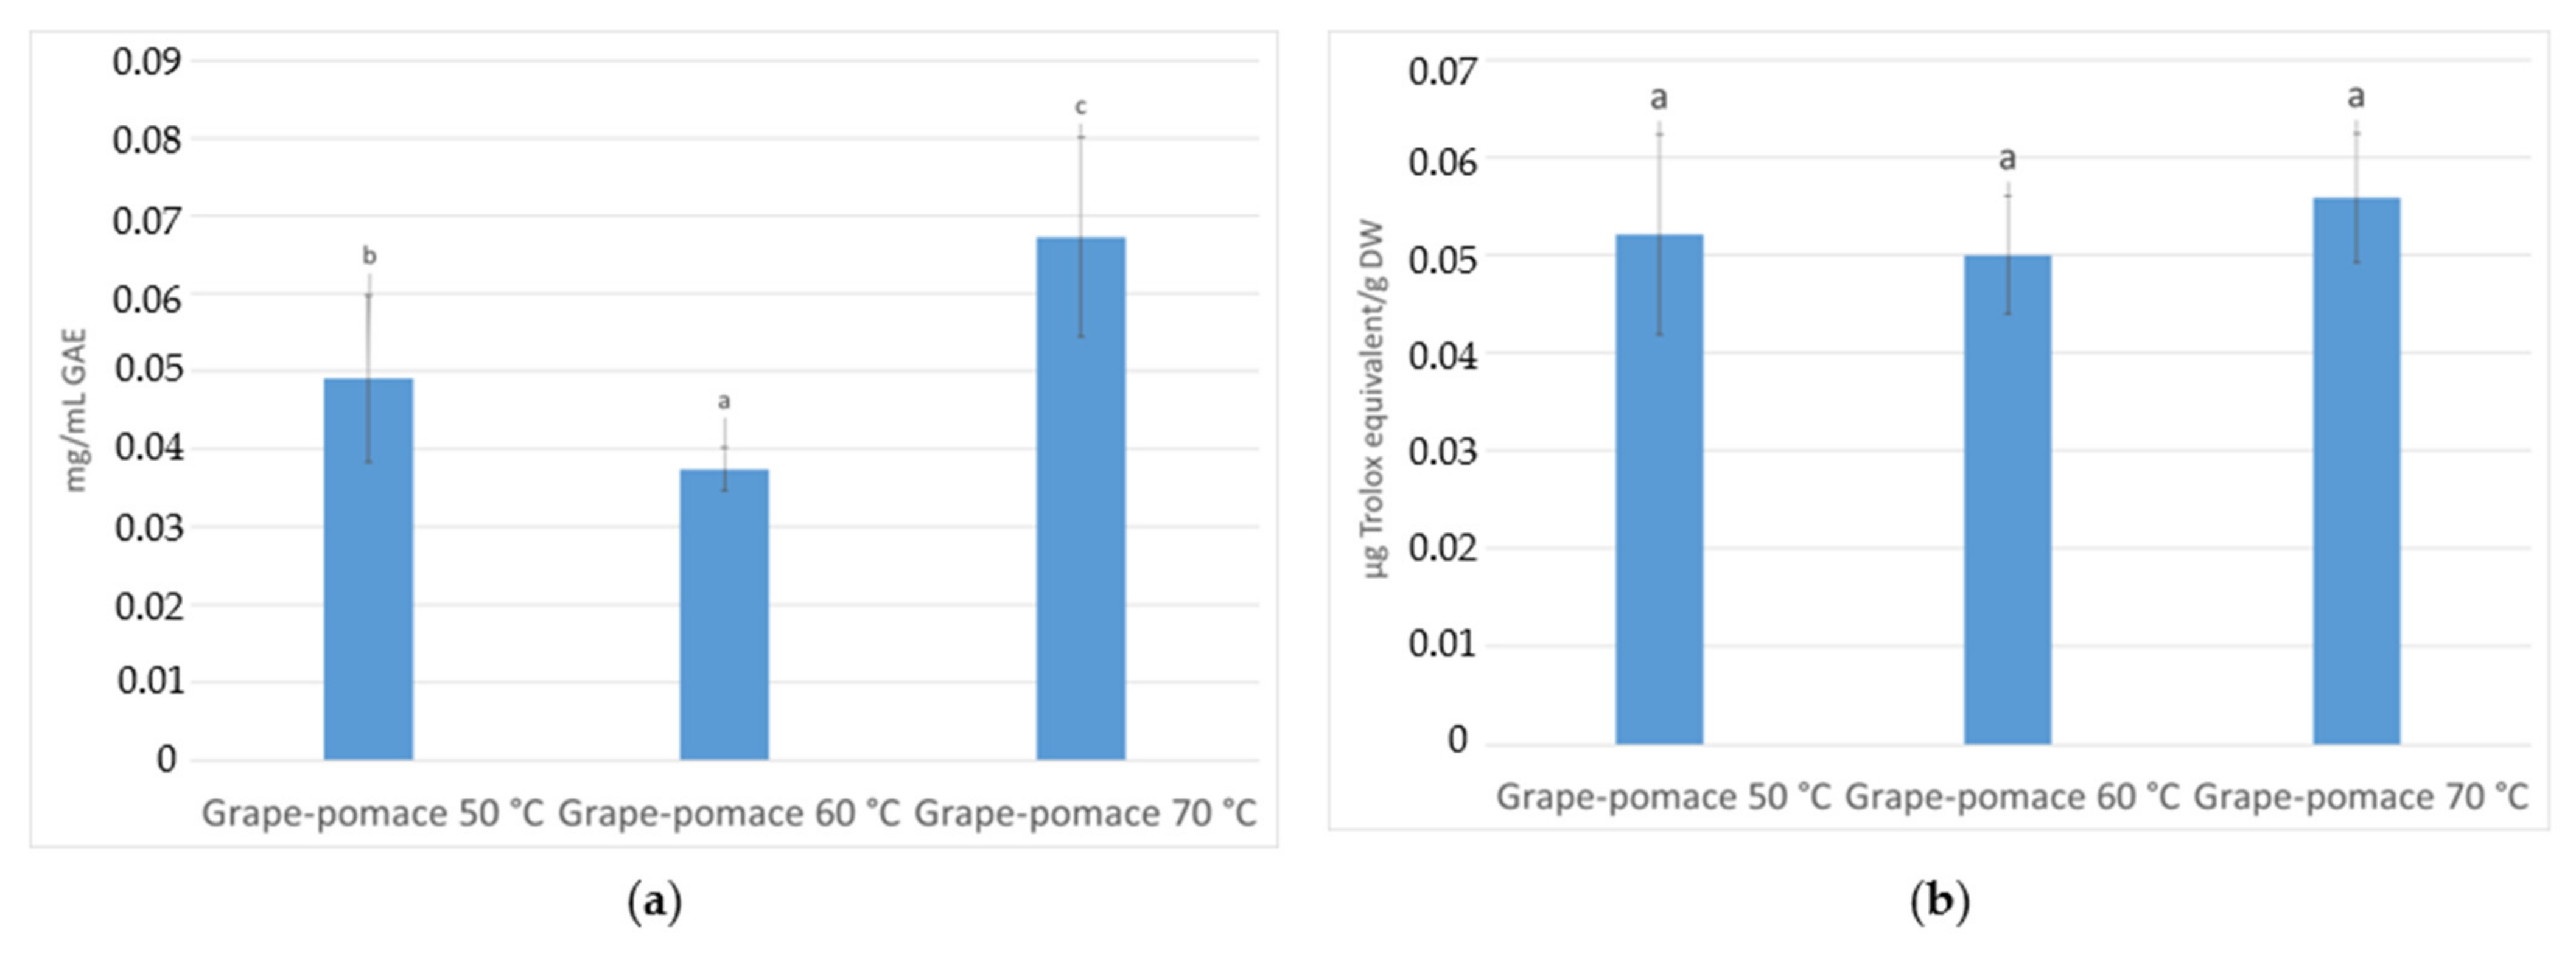
The content of total phenolic compounds was also determined for the infusions prepared with grape pomace dehydrated at 50, 60, and 70 °C, using the method described above. The results are shown in Figure 6a. The results regarding the antioxidant capacity are shown in Figure 6b.
The infusion prepared with dehydrated pomace at 70 °C had a higher amount of total phenols—significantly different from the infusions prepared with dehydrated berries at 50 °C and 60 °C. It was also observed that the dehydrated infusion at 60 °C was the one that showed the lowest content of total phenols. This result contradicts what was exposed by Roshanak et al. [55], who studied different drying temperatures in a ventilated oven for Camellia sinensis (the tea plant), and found that the temperature of 60 °C provided a greater amount of total phenols.
On the other hand, Prathapan et al. [56], when studying the effect of heat treatment on the total phenolic content of fresh saffron rhizome, concluded that the content of phenolic compounds gradually increased when the samples were heated from 60 to 80 °C, corroborating the results obtained in this study.
Considering the results obtained and represented in Figure 6b, it can be seen that there were no significant differences between the infusions. However, there was a marked tendency for the infusion prepared with bagasse dehydrated at 70 °C to have greater antioxidant activity, which is consistent with the results regarding the content of total phenols. These results are also consistent with the finds of Paixão et al. [57], who found that total phenolic content and antioxidant activity were highly correlated, which gives us evidence that phenolic compounds are a plausible source of antioxidant compounds in the infusions.

3.4. Infusions Sensory Evaluation

3.4.1. CATA Test of the Dried–Minced Coated Grape Infusions

For the sensory analysis, the infusions were prepared using two “balls” in 500 mL of boiling water. The infusions were then evaluated sensorially by the panel of tasters of DeBA-ECVA/UTAD—a panel with training and experience in the sensory evaluation of foods and beverages, having already participated in many research works, some of them published [58,59,60,61,62].
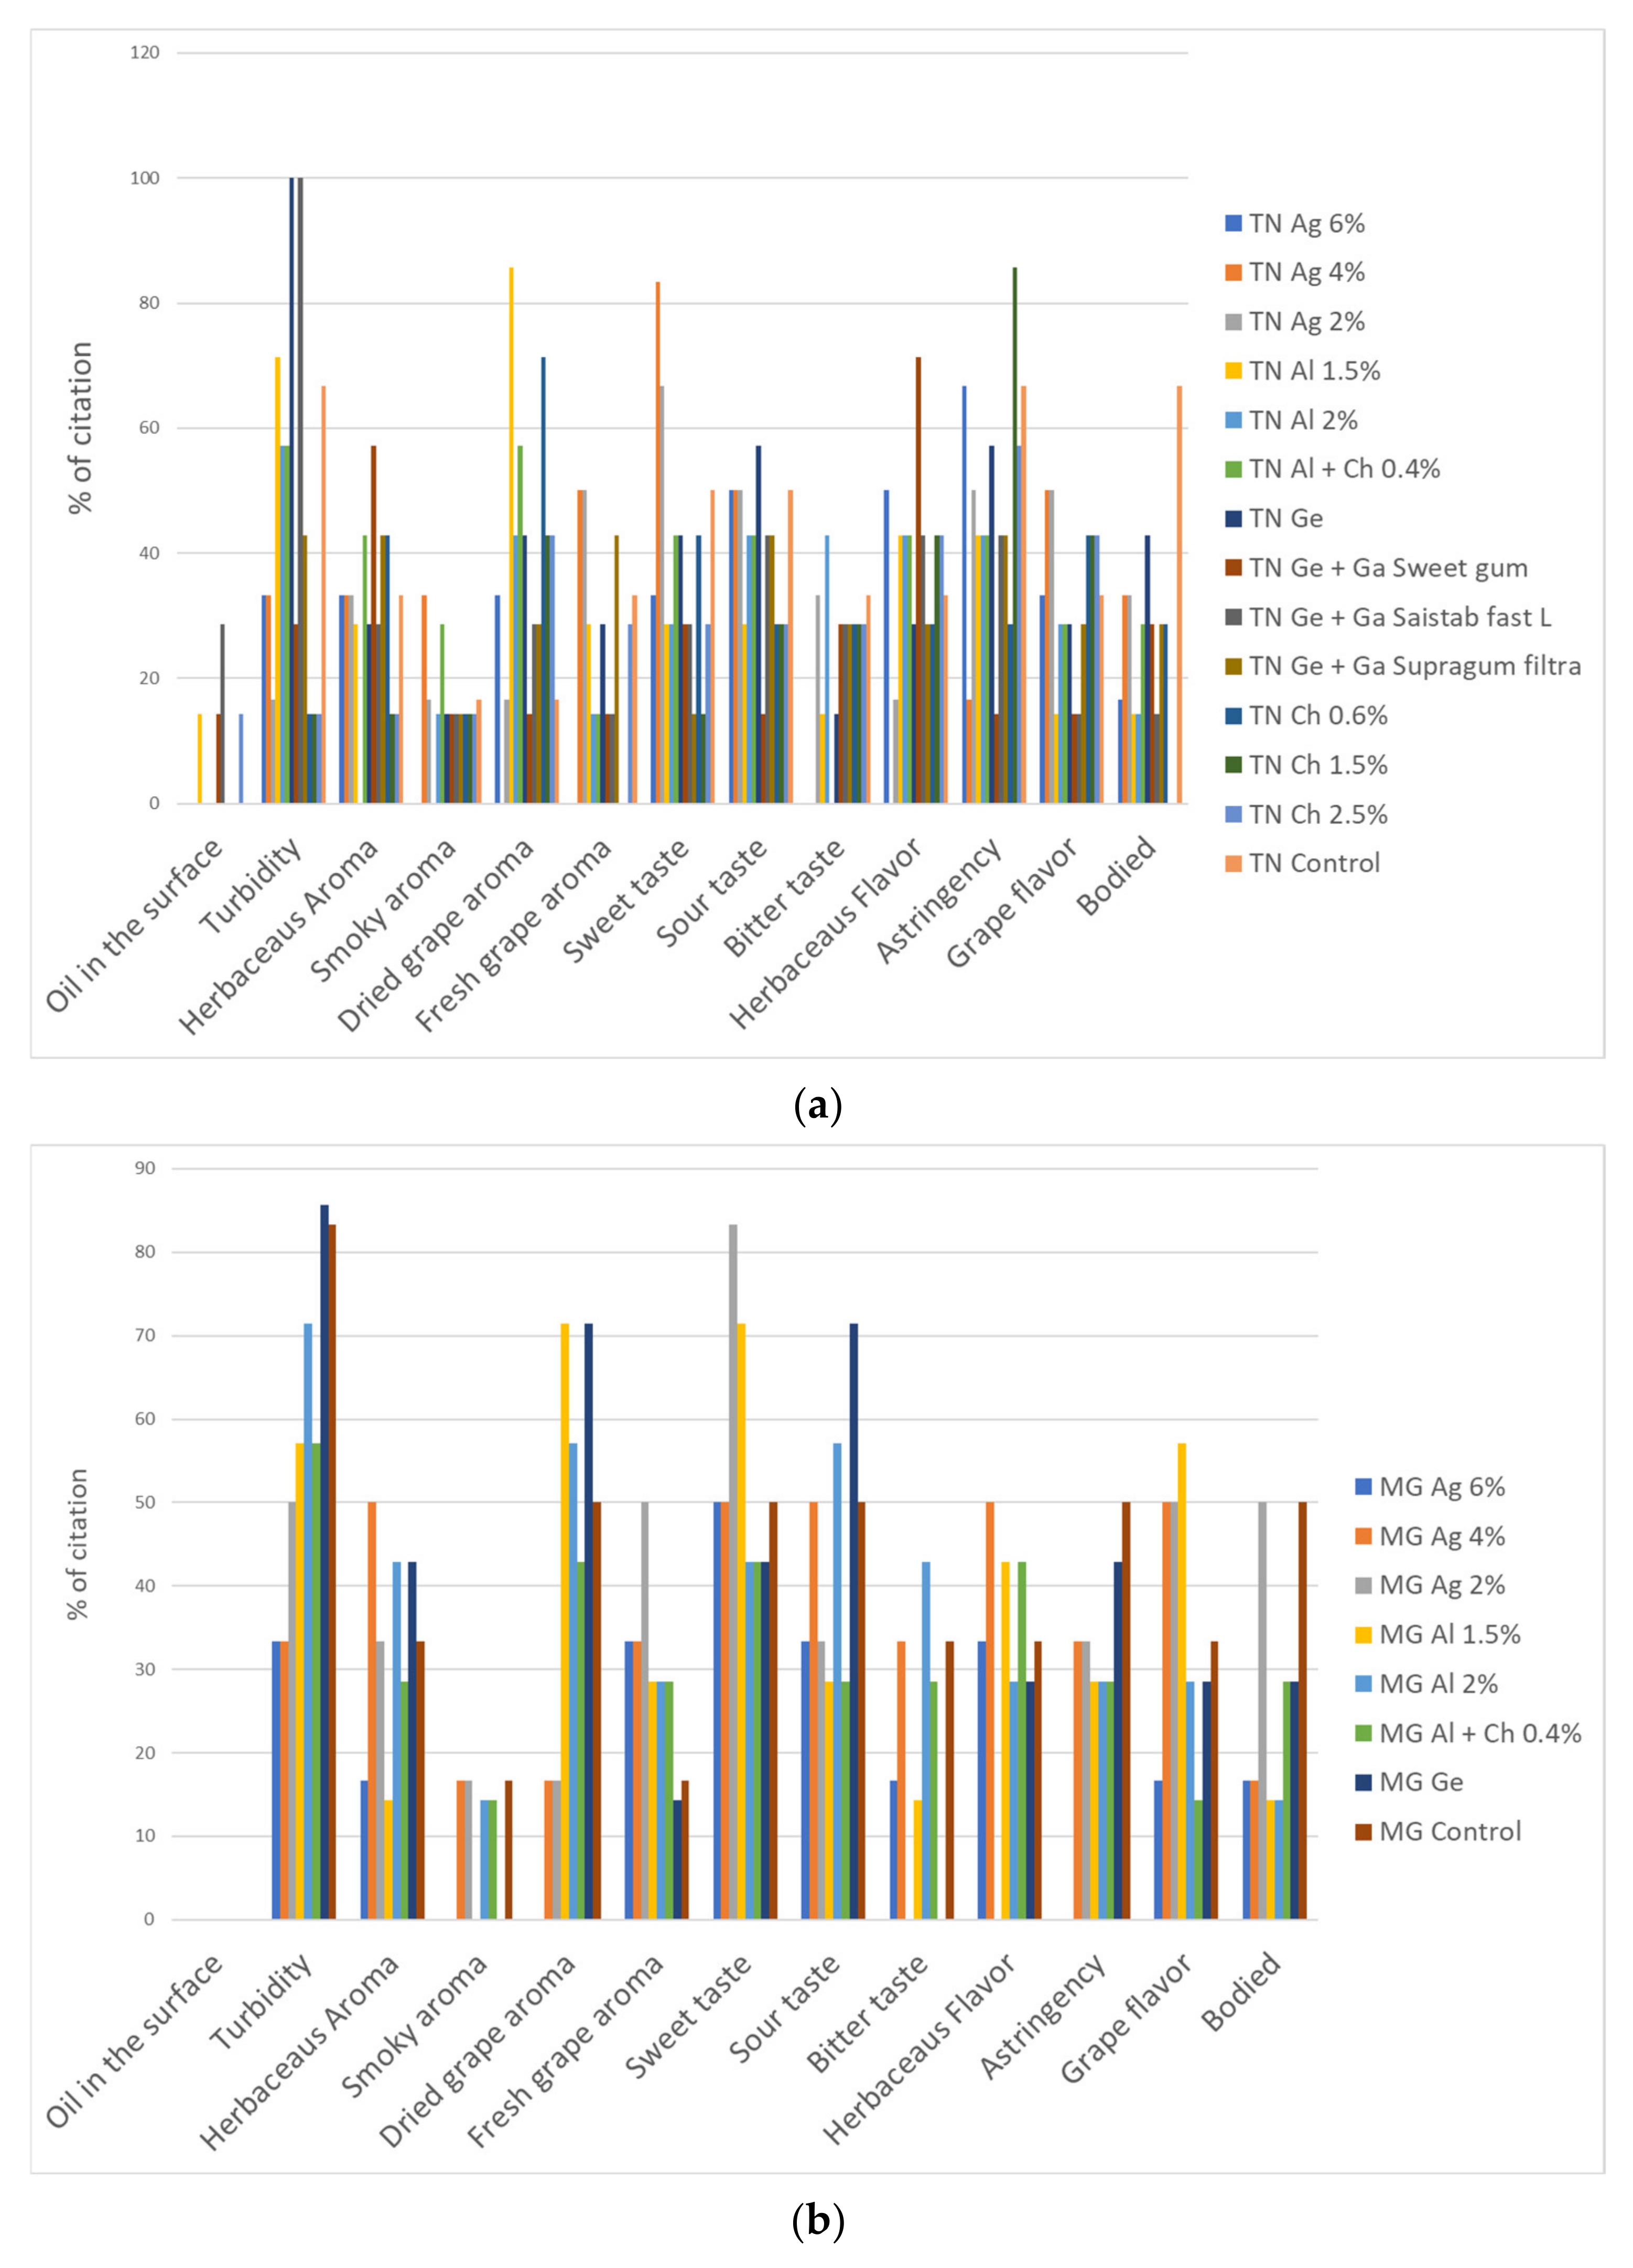
The infusions were tasted in glasses, properly identified, using a CATA test tasting sheet. Figure 7a presents the percentages of citations of each descriptor identified by the panel of tasters in the infusions of the Touriga Nacional variety, while Figure 7b shows the data from the infusions of the Moscatel Galego variety.
Concerning Touriga Nacional infusions (Figure 7a), we can verify that the presence of “turbidity” stands out when the encapsulating agent includes gelatin, alone or together with Arabic gum. However, since a large percentage of the citations of the characteristic “turbidity” occurred even in the control infusion, it was expected that this characteristic would be verified in all encapsulating agents.
A “sweet” tendency was also possible to assess in infusions in which the grape berries were coated with agar (TN Ag 4% and 2%), and there was an emphasis on the “sour” characteristic in infusions in which the encapsulating agent was gelatin. The most astringent infusion was the one made with chitosan (1.5%, w/v), and the most “bodied” was the one made with the control sample. The Arabic gum “Supragum Filtra” imprinted the presence of the “herbaceous flavor” characteristic.
A negative aspect observed was the appearance of an oily film on the surface of some infusions—namely, those prepared with alginate (1.5%, w/v), with the Arabic gums, and with chitosan (2.5%, w/v)—probably because some grape balls were thicker than others, so it was not possible to manually determine the thickness of the encapsulating film. A thicker ball gives the infusion a higher percentage of encapsulating agent, which may be perceived as an “oily film” on the surface of the glass. Moreover, the oiliness will increase with the decrease in the infusion’s temperature. Some panelists mentioned that the “oily film” was only perceived at the end of the tasting session when the infusions were colder.
In the infusions of the Moscatel Galego variety (Figure 7b), there was also a high percentage of citation of the “sweet” characteristic when the encapsulating agent was agar—especially in the sample MG Ag 2%—and a high frequency of citation of the attribute “sour” in the presence of gelatin. Interestingly, when determining the Brix degree, the infusions prepared with agar—especially those of the Moscatel Galego variety—also showed higher Brix values when compared to the others. However, there did not seem to be a direct correlation between the degree of Brix and the sweet taste perceived in the infusions by the tasting panel.
A dried grape aroma flavor was noticed in both grape varieties when the encapsulating agent was alginate (TN Al 1.5% and MG Al 1.5%).

3.4.2. QDA Test of the Grape Pomace Infusions

In the first sensory test of the grape pomace infusions, three samples were presented, of which “Sample A” represented the infusion prepared with dehydrated bagasse at 50 °C, “Sample B” was the infusion prepared with dehydrated bagasse at 60 °C, and “Sample C” was the infusion prepared with dehydrated bagasse at 70 °C.
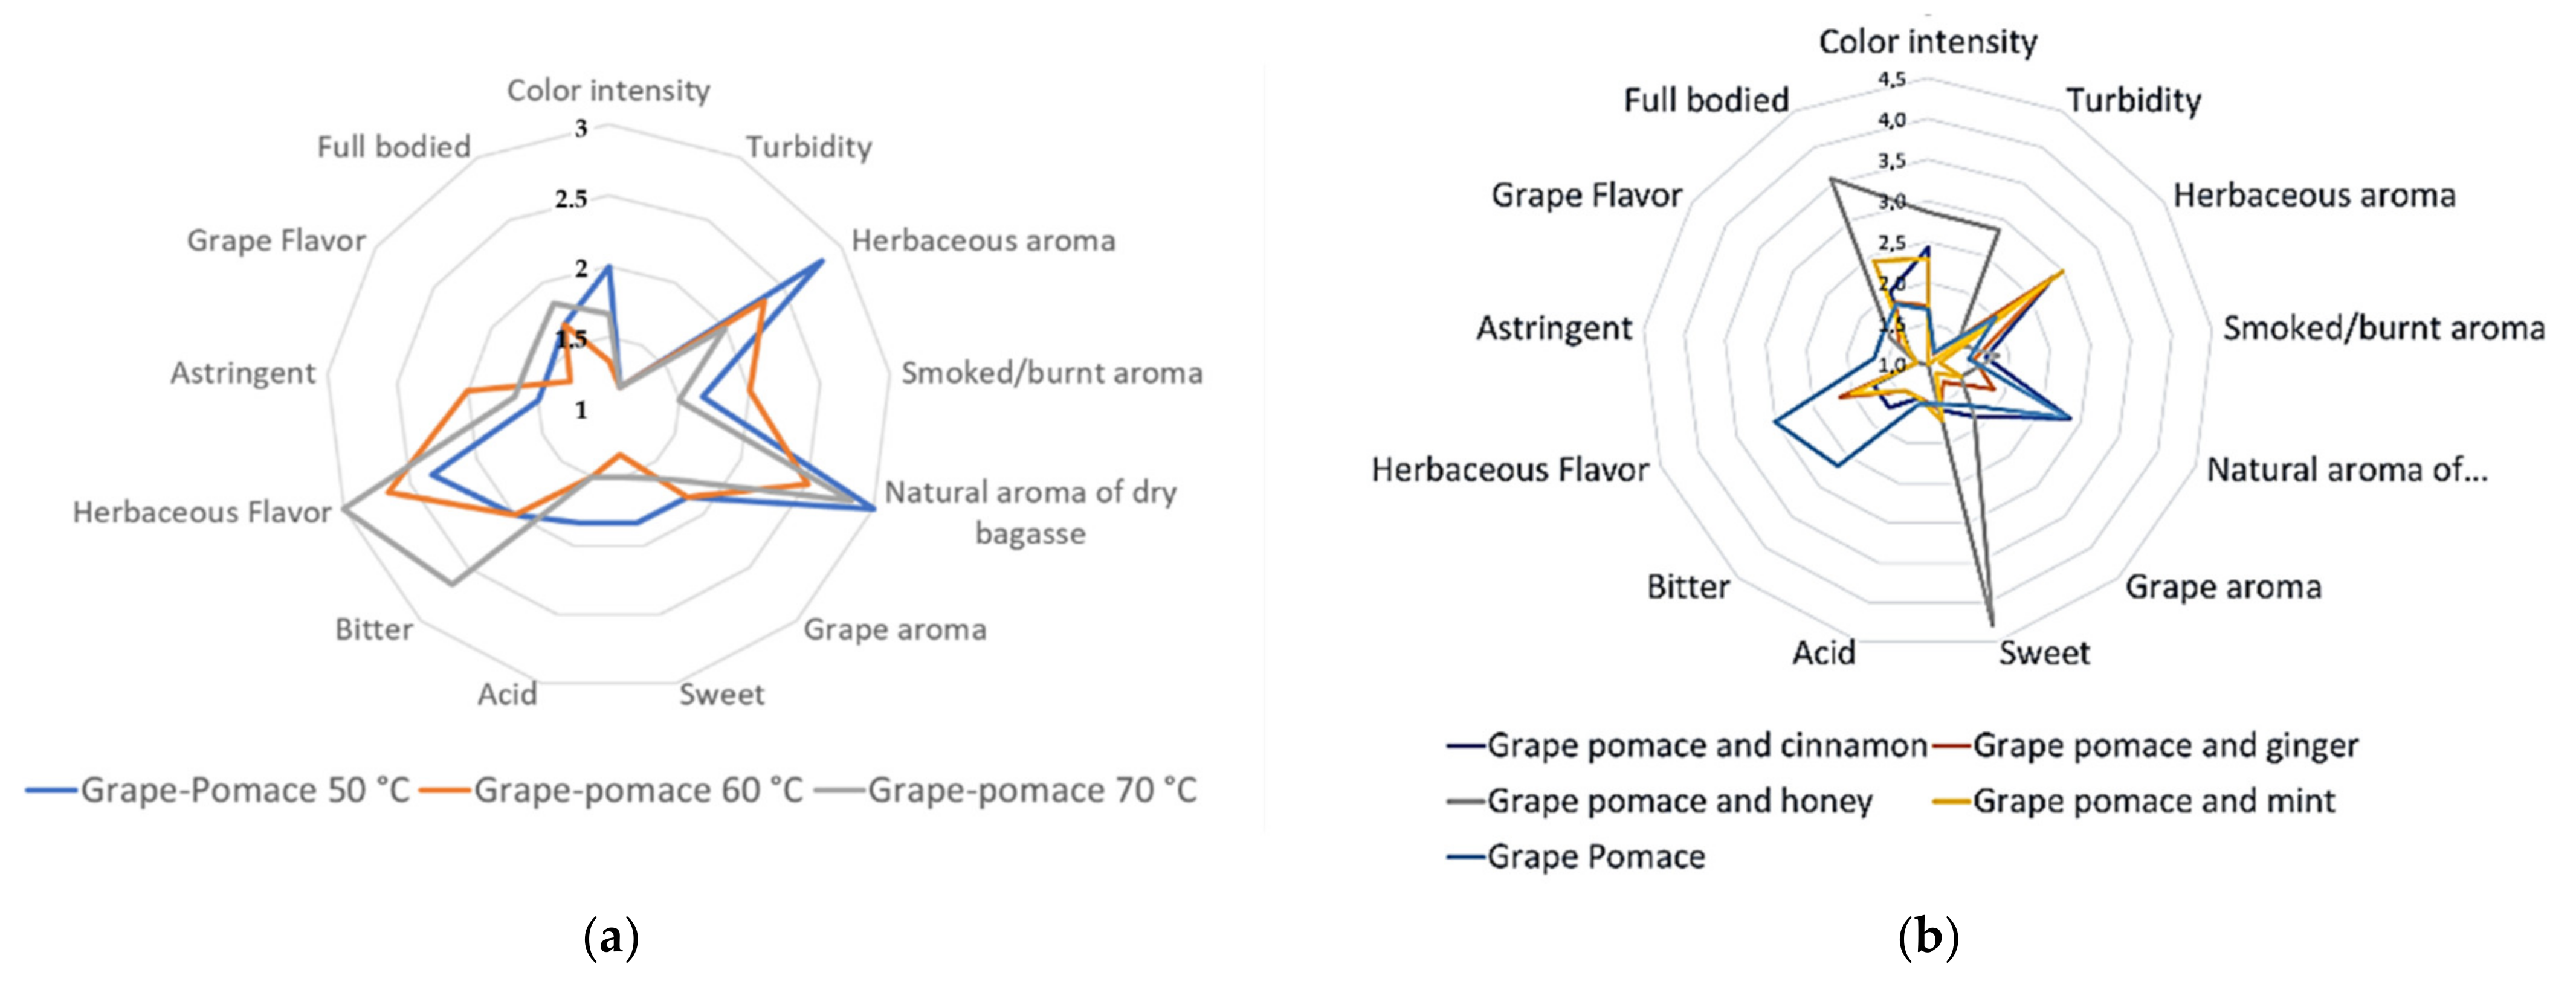
Figure 8a shows the sensory profiles of the evaluated infusions, obtained from the average of the scores for each attribute given by the tasters.
From Figure 8a, it is possible to see that the infusion prepared with grape pomace dried at 60 °C was the sample that stood out the least, except for the astringency attribute. The infusions have similar classifications, with no significant differences between them; however, the infusion with grape pomace at 50 °C stands out in terms of color intensity, herbaceous aroma, natural aroma of dry pomace, and sweet flavor, while in the infusion with grape pomace at 60 °C the smoked/burnt aroma and the astringent taste/flavor were evident. The infusion with grape pomace at 70 °C stands out in terms of its bitter and herbaceous flavor.
In the second sensory test of grape pomace infusions, four infusions were presented, in which grape pomace at 70 °C was used as the base and the control. This temperature was chosen because the highest concentration of total phenols was present in this infusion. In the first sample, cinnamon was added to the infusion; in the second, we added ginger; in the third, honey; and in the last, we added mint. The fifth infusion contained only grape pomace dehydrated at 70 °C, as the control (Figure 8a).
As can be seen from Figure 8a, the grape pomace and honey infusion stood out in terms of sweet taste/flavor, in the incorporation of texture in the mouth, and the turbidity that the infusion presented. One of the aspects evident with the addition of aromas was the decrease in scores concerning the parameters of astringency, bitter taste/flavor, herbaceous flavor, and acidic flavor compared to the infusion that contained only grape pomace at 70 °C. Table 5 shows the average scores given by the tasters for each sensory descriptor.
From Table 5 it can be concluded that there were significant differences between the grape pomace infusion at 70 °C and the infusions with the addition of aromas. More specifically, with the addition of honey, significant differences were found in turbidity, the natural aroma of the dry pomace, bitter taste/flavor, herbaceous flavor, and texture in the mouth (full-bodied). The pomace and cinnamon infusion stood out in terms of the natural aroma of dry pomace, having similar values to the infusion with grape pomace at 70 °C. The grape pomace infusion at 70 °C had a more acidic, bitter taste/flavor and a greater herbaceous flavor compared to the infusions with aromas, not being as sensorially pleasant as the infusions where aromas were added.
In addition, the panel of tasters was asked to choose which infusion they preferred. Thus, in the first sensory test, 50% of the tasters chose the infusion that contained bagasse at 50 °C, while the other 50% were divided between the infusion at 60 °C and the infusion at 70 °C.
In the second test, the results were different and more encouraging, since the infusion of grape pomace and honey was the preferred one, and was chosen by 70% of the tasters, while the remaining 30% were undecided on what to choose (the bagasse and mint infusion was chosen by one person, one person was undecided between the bagasse and ginger infusion and the bagasse and honey infusion, and another person was undecided between the bagasse and cinnamon infusion and the bagasse and mint infusion).
Tasters could also comment on the infusions on the test sheet. There was a difference between the two tests, since in the first test the comments were negative, with great emphasis on the astringent and bitter attributes, while in the second test the comments were mostly positive, noting that the infusions had pleasant aromas. Another note left by the tasters in the second sensory analysis test was that the ginger was not perceptible in the infusion, and it was necessary to apply a greater quantity for the flavor to be perceived.

3.5. PCA Integrated Analysis of Coated Dried–Minced Grape Infusions Data

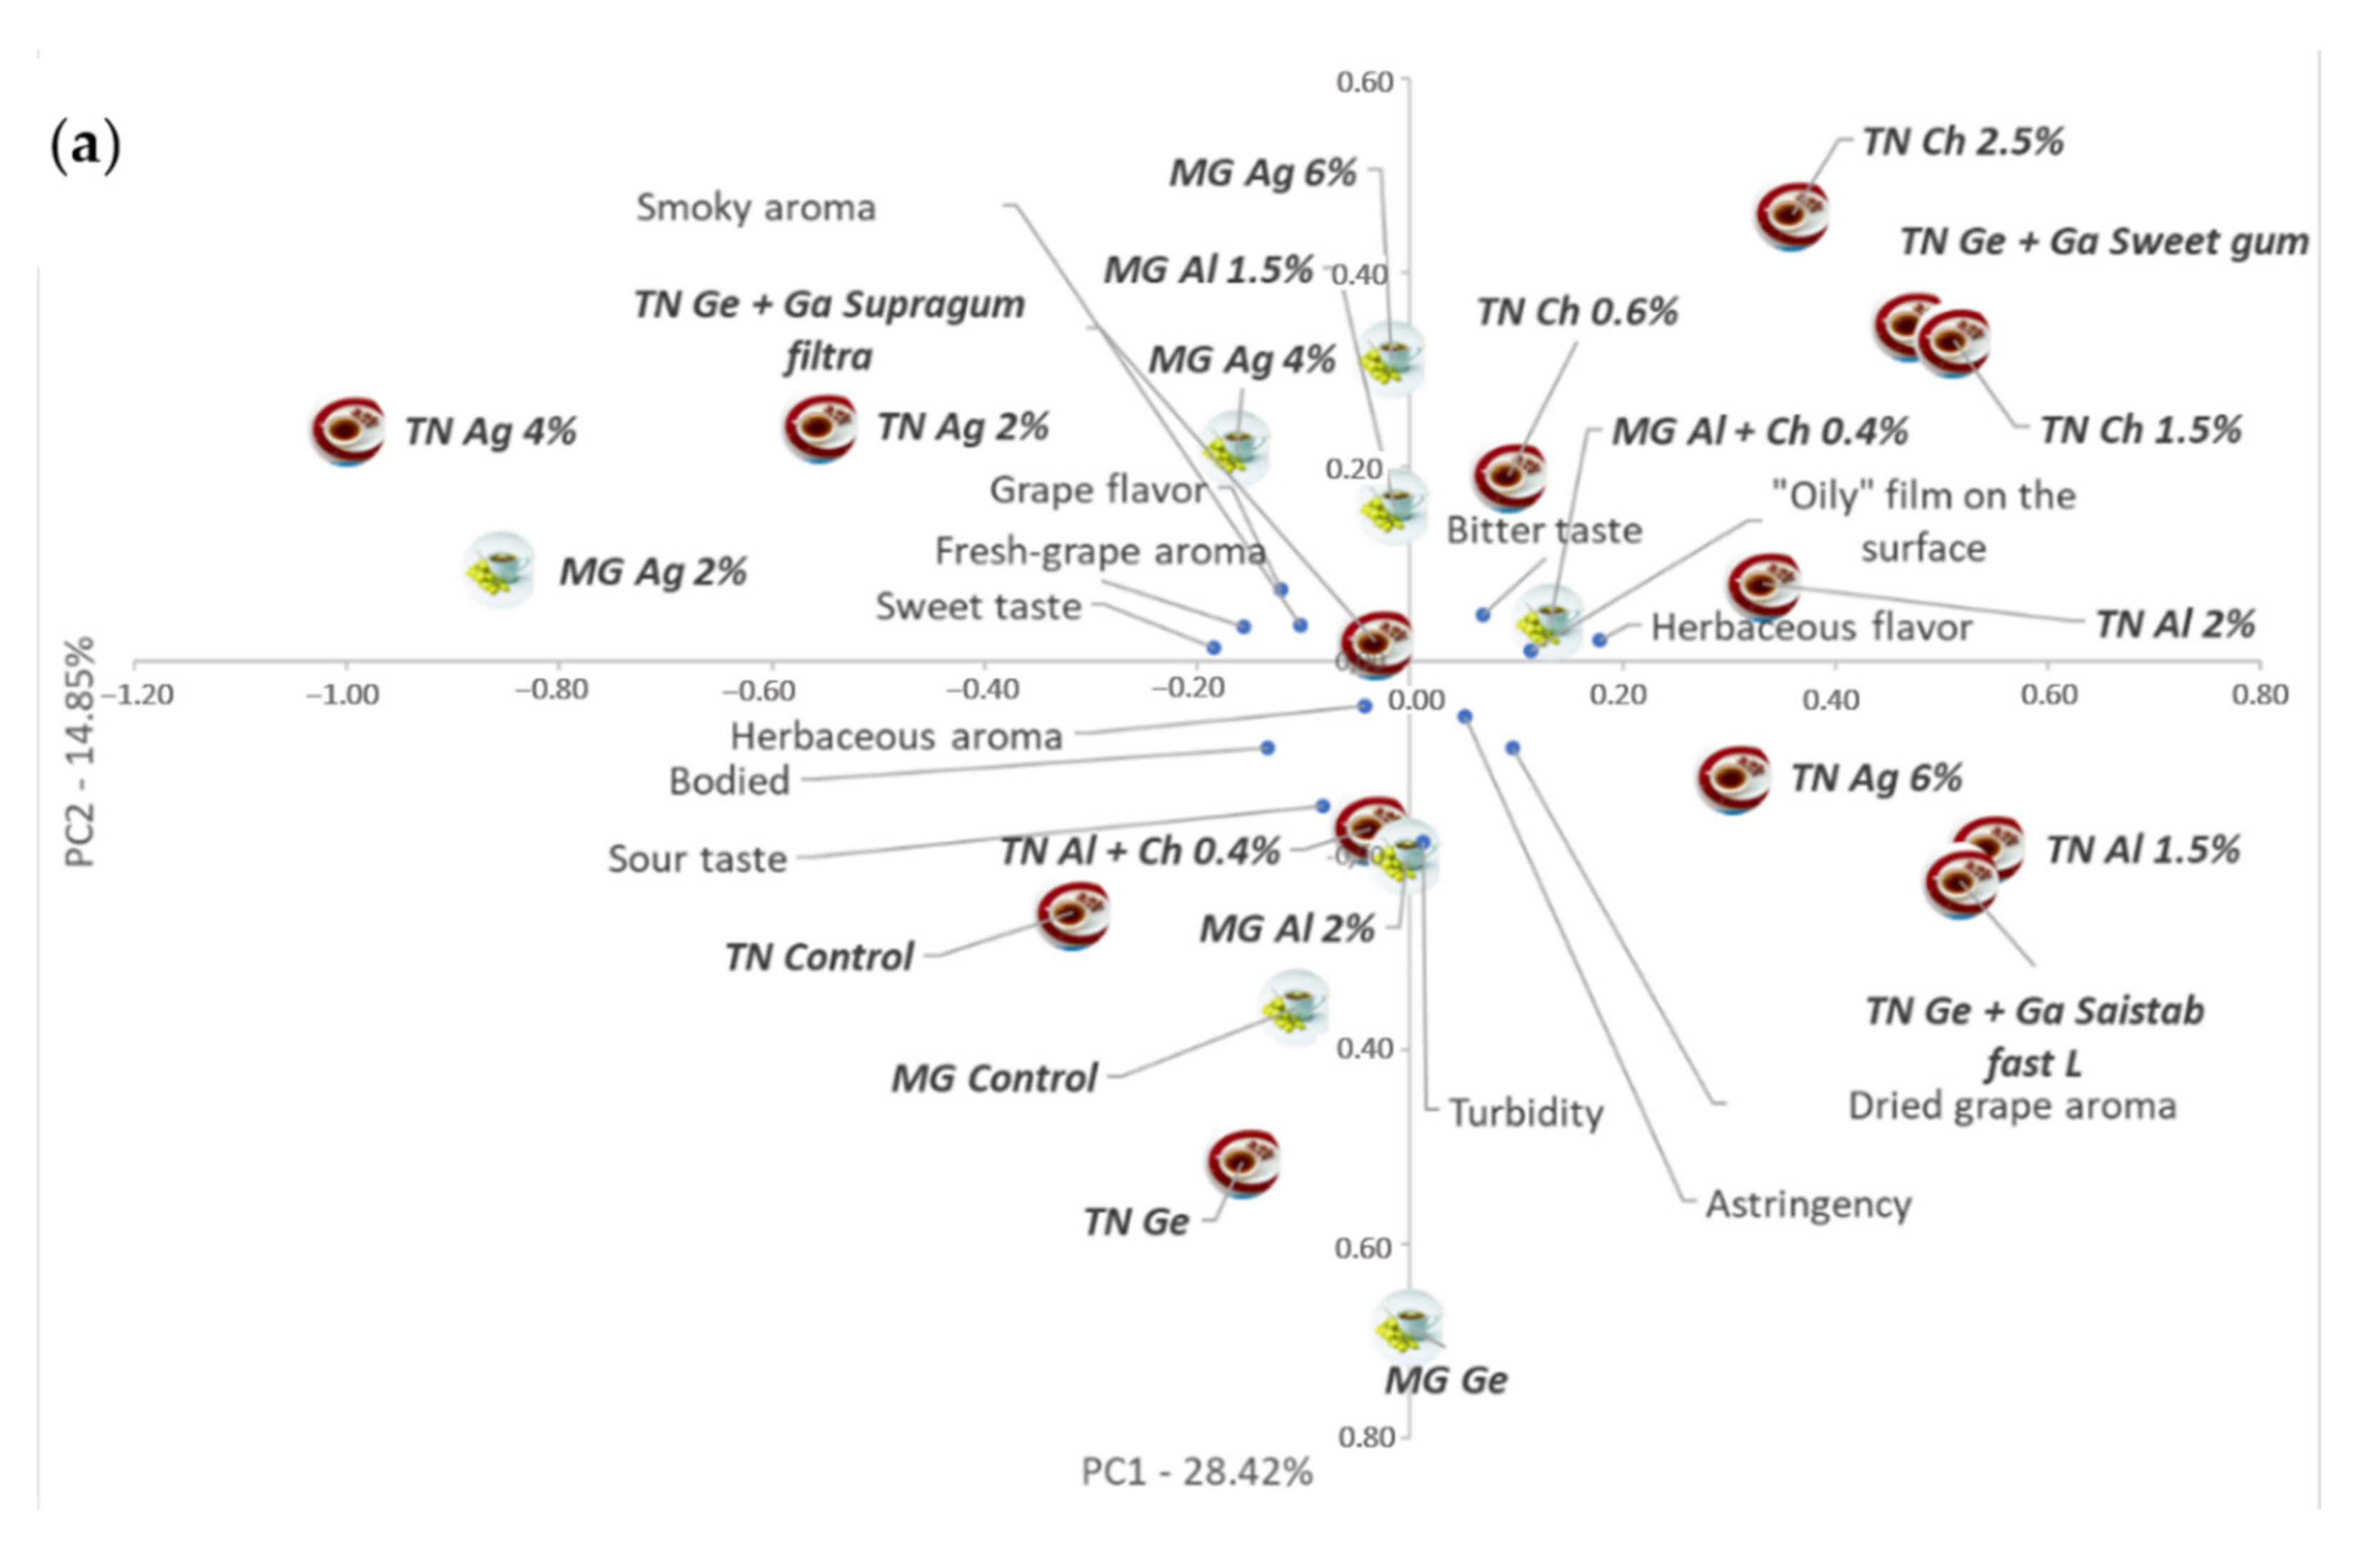
Given the amount of data and samples (infusions) prepared with coated material, two principal component analyses (PCAs) were performed based on data correlation. Figure 9a shows the projection of samples and sensory descriptors in the two PCA axes (PC1 and PC2). The first projection was based on the correlation of sensory data, while the PCA projection in Figure 9b was based on the correlation of the physicochemical data.
In Figure 9a,b it is possible to observe the projection of the results of the samples and the sensory and physicochemical parameters obtained after the data correlation analysis (PCA). In this figure, it can be seen that both principal components (PC1 and PC2) account for 43% of the total variance. The infusions of the Moscatel Galego variety are distributed across quadrants 1, 3, and 4 of the PCA, with only one sample being found in the first quadrant (MG Al + Ch 0.4%), which is characterized by its bitter taste and herbaceous flavor. The samples present in the third quadrant (MG Ge and MG Al 2%) present both negative factors 1 and 2, and are characterized by herbaceous aroma, full-bodied texture in the mouth, and acidic flavor. Finally, the samples present in the fourth quadrant (MG Ag 2%, 4%, and 6%; MG Al 1.5%) have in common their sweet taste, grape aroma, grape flavor, and smoky aroma.
The infusions of the Touriga Nacional grape variety are distributed in the four quadrants of the PCA. In the first quadrant, with positive PC1 and PC2, we can find TN chitosan infusions of 0.6%, 1.5%, 2.5%; TN Al 2%, and TN Ge + Sweet Gum, all sensorially characterized by their bitter taste, the presence of an “oily film on the surface”, and herbaceous flavor. In the second quadrant, the samples TN Ge + Ga Saistab Fast L, TN Al 1.5%, and TN Ag 0.6% are present, which are characterized by the natural aroma of dried grapes and astringency in the mouth. In the third quadrant, the samples TN Al + Ch 0.4% and TN Ge, as well as the control sample (without encapsulation), are present; this group presents a herbaceous aroma, full-bodied texture in the mouth, and acidic flavor as its main sensory characteristics. Finally, the samples present in the fourth quadrant (TN Ag 2%, 4%; TN Ge + Ga Supragum Filter) are characterized by their sweet taste, grape aroma, grape flavor, and smoky aroma.
Thus, it was possible to verify that there was a distribution of the samples according to the encapsulating agent, regardless of the grape variety used, which indicates that the organic matrix used in the encapsulation of the grapes can influence the infusions’ sensory characteristics.
By analyzing the work of Oliveira et al. [63], which aimed at the elaboration and physicochemical and sensory characterization of concentrated pineapple pulp structures, it is possible to verify that the formulation that contained the encapsulating agent agar received a higher score, which leads to the conclusion that the encapsulating agents may confer different sensory characteristics capable of influencing the flavor of the final product. Furthermore, from the study by Han et al. [64], it is possible to verify that chitosan, when added to control ingredients, changed its flavor, generating positive characteristics, which is consistent with the results obtained in the present study, since there is a separation of the infusions depending on the coating agent used.
From Figure 9b, it is possible to observe the projection of the samples according to their physicochemical characteristics. In this case, the separation of the infusions according to the variety is visible. Furthermore, both principal components (PC1 and PC2) account for 70% of the total variance.
The samples of Touriga Nacional variety are located in quadrants 2, 3, and 4—except for the sample TN Ag 2%, which is found in the first quadrant—while the infusions of the Moscatel Galego variety are mostly distributed in the first quadrant, and this distribution seems to be due to the colorimetric parameter H.
Thus, it can be summarized that, contrary to what happens with the sensory characteristics, the physicochemical parameters of the infusions essentially depend on the grape variety, and not on the organic matrix used in the encapsulation.

4. Final Remarks

One of the main objectives of this work was to find an organic matrix (encapsulating agent) that could be used to protect the dehydrated and crushed grapes, preventing their degradation over time.
Regarding the colorimetric parameters, apart from the infusions prepared with chitosan, the infusions did not show major color changes when compared with the control infusion, with very low amounts of sugars found, and pH levels in the acidic range.
The presence of some encapsulating agents can result in changes in the sensory characteristics of the infusions, which also alters the recorded antioxidant activity.
Thus, it can be concluded that, in general, all of the matrices seem suitable for encapsulation/coating, since all of them maintained their integrity after 2 months of encapsulation, and none of the matrices showed negative characteristics in the infusions. Thus, this seems to be an interesting and innovative process that can be used to protect dried and crushed grapes, preserving their sensory and nutraceutical characteristics, and providing the consumer with an innovative way to prepare a grape infusion.
Another objective of this work was the valorization of the grape pomace that is wasted, given that several physicochemical parameters were studied to analyze the possible valorization of the grape pomace of Moscatel Galego.
Of the three infusions (50, 60, and 70 °C), the one prepared with dehydrated grape pomace at 70 °C was the one with the highest pH value, highest Brix value, and significantly greater concentration of phenolic compounds; therefore, this was the infusion that stood out among all of the parameters evaluated in this work.
In the sensory analysis, in which only infusions prepared with dehydrated grape pomace at different temperatures were presented, the constant presence of bitter taste and astringent sensation stood out, which are not positive aspects from a sensory point of view. However, the addition of natural flavors—especially honey—made the infusion more sensorially pleasant.
Overall, grape pomace dehydrated at 70 °C made it possible to obtain a product with phenolic compounds and antioxidant capacity that is more promising to integrate into human food, and especially in the preparation of infusions. Furthermore, the consumer may, if they so choose, add honey or another agent as a natural flavoring, making the final infusion more pleasant from a sensory point of view.

Author Contributions

Conceptualization, A.V. and T.P.; methodology, A.V., I.C., I.O., A.P. and T.P.; formal analysis, A.V., I.C., I.O., A.P. and T.P.; investigation, A.V., I.C., I.O., A.P. and T.P.; writing—original draft preparation A.V., I.C., I.O., A.P. and T.P.; writing—review and editing, A.V., I.C., I.O., A.P. and T.P.; supervision, A.V. and T.P. All authors have read and agreed to the published version of the manuscript.

Funding

This research was funded by the National Funds FCT Portuguese Foundation for Science and Technology, Portugal, and COMPETE, under the projects UIDB/00616/2020, UIDP/00616/2020, and UIDB/04033/2020; and by the e-Flavor Project, operation POCI-01-0247-FEDER-049337, financed by the FEEI, under the Competitiveness and Internationalization Operational Program. The authors would like to thank the Chemistry Center (CQ-VR) and CITAB/Inov4Agro Center for the Research and Technology of Agro-Environmental and Biological Sciences/Institute for Innovation, Capacity Building, and Sustainability of Agri-Food Production for their financial support.

Institutional Review Board Statement

Not applicable.

Informed Consent Statement

Not applicable.

Data Availability Statement

Not applicable.

Acknowledgments

The authors acknowledge Filipe Ribeiro from SAI for providing the Arabic gums, and Mário Pinto for the organic grape materials (grapes and grape pomace).

Conflicts of Interest

The authors declare no conflict of interest.

References

  1. OIV, International Organisation of Vine and Wine Intergovernmental Organisation. Statistical Report on World Vitiviniculture. 2019. Available online: https://www.oiv.int/en/oiv-life/oiv-2019-report-on-the-world-vitivinicultural-situation (accessed on 23 February 2021).
  2. FAOSTAT. Food and Agriculture Organization of the United Nations. 2018. Available online: http://www.fao.org/faostat/en/#data/QC (accessed on 31 July 2020).
  3. García-Lomillo, J.; González-SanJosé, M.L. Applications of Wine Pomace in the Food Industry: Approaches and Functions. Compr. Rev. Food Sci. Food Saf. 2017, 16, 3–22. [Google Scholar] [CrossRef] [PubMed]
  4. Bender, A.B.B.; Speroni, C.S.; Salvador, P.R.; Loureiro, B.B.; Lovatto, N.M.; Goulart, F.R.; Lovatto, M.T.; de Miranda, M.Z.; da Silva, L.P.; Penna, N.G. Grape Pomace Skins and the Effects of Its Inclusion in the Technological Properties of Muffins. J. Culin. Sci. Technol. 2017, 15, 143–157. [Google Scholar] [CrossRef]
  5. Kalli, E.; Lappa, I.; Bouchagier, P.; Tarantilis, P.A.; Skotti, E. Novel application and industrial exploitation of winery by-products. Bioresour. Bioprocess. 2018, 5, 46. [Google Scholar] [CrossRef]
  6. Beres, C.; Costa, G.N.S.; Cabezudo, I.; da Silva-James, N.K.; Teles, A.S.C.; Cruz, A.P.G.; Mellinger-Silva, C.; Tonon, R.V.; Cabral, L.M.C.; Freitas, S.P. Towards integral utilization of grape pomace from winemaking process: A review. Waste Manag. 2017, 68, 581–594. [Google Scholar] [CrossRef]
  7. Balbinoti, T.C.V.; Stafussa, A.P.; Haminiuk, C.W.I.; Maciel, G.M.; Sassaki, G.L.; Jorge, L.M.D.M.; Jorge, R.M.M. Addition of grape pomace in the hydration step of parboiling increases the antioxidant properties of rice. Int. J. Food Sci. Technol. 2020, 55, 2370–2380. [Google Scholar] [CrossRef]
  8. Vilela, A.; Pinto, T. Grape Infusions: The Flavor of Grapes and Health-Promoting Compounds in Your Tea Cup. Beverages 2019, 5, 48. [Google Scholar] [CrossRef] [Green Version]
  9. Pinto, T.; Vilela, A. Healthy Drinks with Lovely Colors: Phenolic Compounds as Constituents of Functional Beverages. Beverages 2021, 7, 12. [Google Scholar] [CrossRef]
  10. Abbas, M.; Saeed, F.; Anjum, F.M.; Afzaal, M.; Tufail, T.; Bashir, M.S.; Ishtiaq, A.; Hussain, S.; Suleria, H.A.R. Natural polyphenols: An overview. Int. J. Food Prop. 2017, 20, 1689–1699. [Google Scholar] [CrossRef] [Green Version]
  11. Negro, C.; Tommasi, L.; Miceli, A. Phenolic compounds and antioxidant activity from red grape marc extracts. Bioresour. Technol. 2003, 87, 41–44. [Google Scholar] [CrossRef]
  12. Makris, D.P.; Boskou, G.; Andrikopoulos, N.K. Polyphenolic content and in vitro antioxidant characteristics of wine industry and other agri-food solid waste extracts. J. Food Compos. Anal. 2007, 20, 125–132. [Google Scholar] [CrossRef]
  13. Boussetta, N.; Lanoisellé, J.-L.; Bedel-Cloutour, C.; Vorobiev, E. Extraction of soluble matter from grape pomace by high voltage electrical discharges for polyphenol recovery: Effect of sulphur dioxide and thermal treatments. J. Food Eng. 2009, 95, 192–198. [Google Scholar] [CrossRef]
  14. Rockenbach, I.I.; Rodrigues, E.; Gonzaga, L.V.; Caliari, V.; Genovese, M.I.; de Souza Schmidt Gonçalves, A.E.; Fett, R. Phenolic compounds content and antioxidant activity in pomace from selected red grapes (Vitis vinifera L. and Vitis labrusca L.) widely produced in Brazil. Food Chem. 2011, 127, 174–179. [Google Scholar] [CrossRef]
  15. Rockenbach, I.I.; Gonzaga, L.V.; Rizelio, V.M.; Gonçalves, A.E.D.S.S.; Genovese, M.I.; Fett, R. Phenolic compounds and antioxidant activity of seed and skin extracts of red grape (Vitis vinifera and Vitis labrusca) pomace from Brazilian winemaking. Food Res. Int. 2011, 44, 897–901. [Google Scholar] [CrossRef]
  16. Braibante, M.; Silva, D.; Braibante, H.; Pazinato, M. A Química Dos Chás. Quím. Nova Esc. 2014. Available online: http://qnesc.sbq.org.br/online/prelo/QS-47-13.pdf (accessed on 31 July 2020).
  17. Cosme, F.; Pinto, T.; Vilela, A. Oenology in the Kitchen: The Sensory Experience Offered by Culinary Dishes Cooked with Alcoholic Drinks, Grapes and Grape Leaves. Beverages 2017, 3, 42. [Google Scholar] [CrossRef] [Green Version]
  18. Vilela, A.; Pinto, T. Grape Infusions: Between Nutraceutical and Green Chemistry. Sustain. Chem. 2021, 2, 25. [Google Scholar] [CrossRef]
  19. Vashisth, T.; Singh, R.K.; Pegg, R.B. Effects of drying on the phenolics content and antioxidant activity of muscadine pomace. LWT—Food Sci. Technol. 2011, 44, 1649–1657. [Google Scholar] [CrossRef]
  20. Vilela, A.; Cruz, I.; Moreira, J.; Pinto, T. Grape-infusions made with dried grape berries immobilized in organic matrices: Preservation of flavour and nutritional characteristics. In Proceedings of the XV Encontro de Química dos Alimentos, Funchal, Portugal, 5–8 September 2021; Universidade da Madeira: Funchal, Portugal; pp. 223–224, PC-A12. ISBN 978-989-8805-68-3. [Google Scholar]
  21. Souza, V. Extração e Encapsulação por Coacervação Complexa das Proantocianidinas da Canela (Cinnamomum zeylanicum Blume). Ph.D. Thesis, Faculty of Animal Science and Food Engineering, University of São Paulo, Pirassununga, Brazil, 2016. [Google Scholar]
  22. Lee, K.Y.; Mooney, D.J. Alginate: Properties and biomedical applications. Prog. Polym. Sci. 2012, 37, 106–126. [Google Scholar] [CrossRef] [Green Version]
  23. Kothale, D.; Verma, U.; Dewangan, N.; Jana, P.; Jain, A.; Jain, D. Alginate as Promising Natural Polymer for Pharmaceutical, Food, and Biomedical Applications. Curr. Drug Deliv. 2020, 17, 755–775. [Google Scholar] [CrossRef]
  24. Rinaudo, M. Biomaterials based on a natural polysaccharide: Alginate. TIP Revista Especializada en Ciencias Químico-Biológicas 2014, 17, 92–96. [Google Scholar] [CrossRef] [Green Version]
  25. Lou, X.; Guo, X.; Wang, K.; Wu, C.; Jin, Y.; Lin, Y.; Xu, H.; Hanna, M.; Yuan, L. Phenolic profiles and antioxidant activity of Crataegus pinnatifida fruit infusion and decoction and influence of in vitro gastrointestinal digestion on their digestive recovery. LWT 2020, 135, 110171. [Google Scholar] [CrossRef]
  26. Park, S.H.; Lee, C.-R.; Hong, S.-K. Implications of agar and agarase in industrial applications of sustainable marine biomass. Appl. Microbiol. Biotechnol. 2020, 104, 2815–2832. [Google Scholar] [CrossRef]
  27. Adsare, S.R.; Annapure, U.S. Microencapsulation of curcumin using coconut milk whey and Gum Arabic. J. Food Eng. 2021, 298, 110502. [Google Scholar] [CrossRef]
  28. No, H.; Meyers, S.; Prinyawiwatkul, W.; Xu, Z. Applications of Chitosan for Improvement of Quality and Shelf Life of Foods: A Review. J. Food Sci. 2007, 72, R87–R100. [Google Scholar] [CrossRef]
  29. Yoshida, C.M.P.; Junior, E.N.O.; Franco, T.T. Chitosan tailor-made films: The effects of additives on barrier and mechanical properties. Packag. Technol. Sci. 2009, 22, 161–170. [Google Scholar] [CrossRef]
  30. Zhao, D.; Yu, S.; Sun, B.; Gao, S.; Guo, S.; Zhao, K. Biomedical Applications of Chitosan and Its Derivative Nanoparticles. Polymers 2018, 10, 462. [Google Scholar] [CrossRef] [Green Version]
  31. Matté, G.; Rosa, S. A Tecnologia da microencapsulação através de microesferas de quitosana. Rev. Iberoam. Polim. 2013, 14, 206–218. [Google Scholar]
  32. Liu, J.; Sun, H.; Dong, F.; Xue, Q.; Wang, G.; Qin, S.; Guo, Z. The influence of the cation of quaternized chitosans on antioxidant activity. Carbohydr. Polym. 2009, 78, 439–443. [Google Scholar] [CrossRef]
  33. Liu, Z.; Ge, X.; Lu, Y.; Dong, S.; Zhao, Y.; Zeng, M. Effects of chitosan molecular weight and degree of deacetylation on the properties of gelatine-based films. Food Hydrocoll. 2012, 26, 311–317. [Google Scholar] [CrossRef]
  34. Etxabide, A.; Uranga, J.; Guerrero, P.; de la Caba, K. Development of active gelatin films by means of valorisation of food processing waste: A review. Food Hydrocoll. 2017, 68, 192–198. [Google Scholar] [CrossRef]
  35. Wang, Y.; Zhang, R.; Qin, W.; Dai, J.; Zhang, Q.; Lee, K.; Liu, Y. Physicochemical properties of gelatin films containing tea polyphenol-loaded chitosan nanoparticles generated by electrospray. Mater. Des. 2020, 185, 108277. [Google Scholar] [CrossRef]
  36. Etchepare, M.A.; Menezes, M.F.D.S.C.D.; Rodrigues, L.Z.; Codevilla, C.F. Microencapsulação de compostos bioativos pelo método de extrusão. Ciência e Natura 2015, 37, 97. [Google Scholar] [CrossRef] [Green Version]
  37. Brasileiro, J. Microencapsulação de Compostos Bioativos: Inovação em Diferentes Areas. Master’s Thesis, Faculty of Health Sciences, University Fernando Pessoa, Porto, Portugal, 2011. [Google Scholar]
  38. Vilela, A.; Schuller, D.; Mendes-Faia, A.; Côrte-Real, M. Reduction of volatile acidity of acidic wines by immobilized Saccharomyces cerevisiae cells. Appl. Microbiol. Biotechnol. 2013, 97, 4991–5000. [Google Scholar] [CrossRef] [PubMed]
  39. Singleton, V.; Rossi, J. Colorimetry of total phenolics with phosphomolybdicphosphotungstic acid reagents. Am. J. Enol. Vitic. 1965, 16, 144–158. [Google Scholar]
  40. Re, R.; Pellegrini, N.; Proteggente, A.; Pannala, A.; Yang, M.; Rice-Evans, C. Antioxidant activity applying an improved ABTS radical cation decolorization assay. Free. Radic. Biol. Med. 1999, 26, 1231–1237. [Google Scholar] [CrossRef] [PubMed]
  41. ISO 8589; Sensory Analysis—General Guidance for the Design of Test Rooms. ISO: Geneva, Switzerland, 2007. Available online: https://www.iso.org/standard/36385.html (accessed on 1 June 2021).
  42. ISO 3591; Sensory Analysis—Apparatus—Wine-Tasting Glass. ISO: Geneva, Switzerland, 1977. Available online: https://www.iso.org/standard/9002.html (accessed on 1 June 2021).
  43. Jaeger, S.R.; Chheang, S.L.; Jin, D.; Roigard, C.M.; Ares, G. Check-all-that-apply (CATA) questions: Sensory term citation frequency reflects rated term intensity and applicability. Food Qual. Preference 2020, 86, 103986. [Google Scholar] [CrossRef]
  44. Corazza, M.; Rodrigues, D.; Nozaki, J. Preparação e caracterização do vinho de laranja. Química Nova 2001, 24, 449–452. [Google Scholar]
  45. Martinazzo, A.; Corrêa, P.; Melo, E.; Carneiro, A. Avaliação colorimétrica de folhas secas de Cymbopogon citratus (D.C.) Stapf durante o armazenamento em diferentes embalagens. Rev. Bras. De Prod. Agroind. 2008, 10, 131–140. [Google Scholar]
  46. Carrilha, F.; Guiné, R. Avaliação da cor de peras secadas por diferentes métodos. In Livro de Resumos e CD-Rom das Actas do 1° Encontro Português de Secagem de Alimentos; Instituto Politécnico de Viseu: Viseu, Portugal, 2010; p. 9. Available online: http://hdl.handle.net/10400.19/1356 (accessed on 15 May 2021).
  47. OIV. Compendium of International Methods of Wine and Must Analysis; OIV: Paris, France, 2021. [Google Scholar]
  48. Cabrita, M.; Silva, R.; Laureano, O. Os compostos fenólicos das uvas e dos vinhos. In Proceedings of the I Seminário Internacional de Vitivinicultura, INIFAP, Bento Gonçalves, Brazil, 3–5 December 2003; Universidade Federal do Amapá: Santana, Brazil, 2003. [Google Scholar]
  49. Ikawa, M.; Schaper, T.D.; Dollard, C.A.; Sasner, J.J. Utilization of Folin–Ciocalteu Phenol Reagent for the Detection of Certain Nitrogen Compounds. J. Agric. Food Chem. 2003, 51, 1811–1815. [Google Scholar] [CrossRef]
  50. Everette, J.D.; Bryant, Q.M.; Green, A.M.; Abbey, Y.A.; Wangila, G.W.; Walker, R.B. Thorough study of reactivity of various compound classes toward the Folin–Ciocalteu reagent. J. Agric. Food Chem. 2010, 58, 8139–8144. [Google Scholar]
  51. Prior, R.L.; Wu, X.; Schaich, K. Standardized Methods for the Determination of Antioxidant Capacity and Phenolics in Foods and Dietary Supplements. J. Agric. Food Chem. 2005, 53, 4290–4302. [Google Scholar] [CrossRef]
  52. Dall’Antonia, L.H.; Archela, E. Determinação de Compostos Fenólicos em Vinho: Uma revisão. Semin. Ciências Exatas Tecnol. 2013, 34, 193. [Google Scholar] [CrossRef]
  53. Chen, L.-Y.; Cheng, C.-W.; Liang, J.-Y. Effect of esterification condensation on the Folin–Ciocalteu method for the quantitative measurement of total phenols. Food Chem. 2015, 170, 10–15. [Google Scholar] [CrossRef]
  54. Watson, R.; Preedly, V.; Zibadi, S. Polyphenols in Human Health and Disease; Watson, R., Preedy, V., Zibadi, S., Eds.; Elsevier: Amsterdam, The Netherlands, 2013; ISBN 978-0-12-398471-5. [Google Scholar]
  55. Roshanak, S.; Rahimmalek, M.; Goli, S.A.H. Evaluation of seven different drying treatments in respect to total flavonoid, phenolic, vitamin C content, chlorophyll, antioxidant activity and color of green tea (Camellia sinensis or C. assamica) leaves. J. Food Sci. Technol. 2016, 53, 721–729. [Google Scholar] [CrossRef] [Green Version]
  56. Prathapan, A.; Lukhman, M.; Arumughan, C.; Sundaresan, A.; Raghu, K.G. Effect of heat treatment on curcuminoid, colour value and total polyphenols of fresh turmeric rhizome. Int. J. Food Sci. Technol. 2009, 44, 1438–1444. [Google Scholar] [CrossRef]
  57. Paixão, N.; Perestrelo, R.; Marques, J.C.; Câmara, J. Relationship between antioxidant capacity and total phenolic content of red, rosé and white wines. Food Chem. 2007, 105, 204–214. [Google Scholar] [CrossRef] [Green Version]
  58. Vilela, A.; Matos, S.; Abraão, A.S.; Lemos, A.M.; Nunes, F.M. Sucrose Replacement by Sweeteners in Strawberry, Raspberry, and Cherry Jams: Effect on the Textural Characteristics and Sensorial Profile—A Chemometric Approach. J. Food Process. 2015, 2015, 749740. [Google Scholar] [CrossRef]
  59. Vilela, A.; Sobreira, C.; Abraão, A.S.; Lemos, A.M.; Nunes, F.M. Texture quality of candied fruits as influenced by osmotic dehydration agents. J. Texture Stud. 2016, 47, 239–252. [Google Scholar] [CrossRef]
  60. Pinto, T.; Vilela, A.; Pinto, A.; Nunes, F.M.; Cosme, F.; Anjos, R. Influence of cultivar and of conventional and organic agricultural practices on phenolic and sensory profile of blackberries (Rubus fruticosus). J. Sci. Food Agric. 2018, 98, 4616–4624. [Google Scholar] [CrossRef]
  61. Oliveira, I.; Meyer, A.S.; Afonso, S.; Sequeira, A.; Vilela, A.; Goufo, P.; Trindade, H.; Gonçalves, B. Effects of Different Processing Treatments on Almond (Prunus dulcis) Bioactive Compounds, Antioxidant Activities, Fatty Acids, and Sensorial Characteristics. Plants 2020, 9, 1627. [Google Scholar] [CrossRef]
  62. Cabo, S.; Aires, A.; Carvalho, R.; Vilela, A.; Pascual-Seva, N.; Silva, A.P.; Gonçalves, B. Kaolin, Ascophyllum nodosum and salicylic acid mitigate effects of summer stress improving hazelnut quality. J. Sci. Food Agric. 2021, 101, 459–475. [Google Scholar] [CrossRef]
  63. Oliveira, J.; Carvalho, A.; Martins, L.; Moreira, D. Elaboração e caracterização físico-química e sensorial de estruturados de polpa concentrada de abacaxi. Alimentos e Nutrição 2012, 23, 23–31. [Google Scholar]
  64. Han, C.; Lederer, C.; McDaniel, M.; Zhao, Y. Sensory Evaluation of Fresh Strawberries (Fragaria ananassa) Coated with Chitosan-based Edible Coatings. J. Food Sci. 2006, 70, S172–S178. [Google Scholar] [CrossRef]
Figure 1. (a) Petri dishes with the samples (small balls) of the dried and minced grapes of the Moscatel Galego and Touriga Nacional varieties, ready for encapsulation; (b) Petri dishes with the samples already coated.
Coatings 12 00443 g001
Figure 2. (a) Color and clarity of some of the evaluated infusions. (b) Test sheet and material available per taster.
Coatings 12 00443 g002
Figure 3. Concentration in total phenols (mean value ± SD) of the infusions prepared with coated dried–minced grapes. Different letters indicate significant differences at p ≤ 0.05 (Tukey’s HSD test).
Coatings 12 00443 g003
Figure 4. Concentration of total phenols (mean value ± SD) in the infusions and organic matrices (coating agents) under study. Different letters indicate significant differences at p ≤ 0.05 (Tukey’s HSD test).
Coatings 12 00443 g004
Figure 5. Antioxidant capacity (mean value ± SD) of the prepared infusions and the organic matrices (coating agents) under study. Different letters indicate significant differences at p ≤ 0.05 (Tukey’s HSD test).
Coatings 12 00443 g005
Figure 6. (a) Concentration of total phenols (mean value ± SD) and (b) antioxidant capacity (mean value ± SD) of the infusions prepared with the different samples of dehydrated grape pomace under study. Different letters indicate significant differences at p ≤ 0.05 (Tukey’s HSD test).
Coatings 12 00443 g006
Figure 7. Percentages (%) of citation of the descriptors after the CATA sensory tests of the (a) Touriga Nacional infusions and (b) Moscatel Galego infusions, prepared with each of the dried–minced coated grape samples.
Coatings 12 00443 g007
Figure 8. (a) Sensory profiles obtained from the average of the scores for each attribute of the infusions prepared with the various samples of dehydrated bagasse under study. (b) Sensory profiles obtained from the average of the scores for each attribute of the infusions prepared with dried pomace at 70 °C, with added cinnamon, ginger, honey, and mint.
Coatings 12 00443 g008
Figure 9. (a) Projection of samples (infusions) and sensory parameters after PCA (correlation analysis). (b) Projection of samples (infusions) and physicochemical data (correlation analysis).
Coatings 12 00443 g009aCoatings 12 00443 g009b
Table 1. Coating agents and their concentrations.
Encapsulating AgentConcentration (w/v)
Alginate (Sigma-Aldrich)1.5%
2%
Alginate/chitosan (Sigma-Aldrich)2%/0.4%
Gelatin (cooking gelatin in leaves)4 leaves/100 mL
Agar (Sigma-Aldrich)2%
4%
6%
Chitosan (low molecular weight, Sigma-Aldrich)0.6%
1.5%
2.5%
Arabic gum * + gelatin (cooking gelatin in leaves)4 leaves of gelatin/100 mL of Arabic gum
* Three Arabic gums were used: Sweet Gum; Saistab Fast L, and Supragum Filtra, commercialized by SAI and made from Seyal Arabic gum and the Arabic gum of the exudate from the Acacia verek tree.
Table 2. Composition of the coating matrix (per ball), weighed mass for infusion preparation (1 ball/100 mL of boiling water), and the final code given to each sample.
Sample NumberComposition of the Coating MatrixMass of a Coated Ball (g)Sample Code
1Agar 6% Moscatel Galego1.73061MG Ag 6%
2Agar 6% Touriga Nacional1.91657TN Ag 6%
3Agar 4% Moscatel Galego2.02412MG Ag 4%
4Agar 4% Touriga Nacional2.04031TN Ag 4%
5Agar 2% Moscatel Galego1.86336MG Ag 2%
6Agar 2% Touriga Nacional1.75125TN Ag 2%
7Alginate 1.5% Moscatel Galego1.72077MG Al 5%
8Alginate 1.5% Touriga Nacional1.77616TN Al 5%
9Alginate 2% Moscatel Galego1.55352MG Al 2%
10Alginate 2% Touriga Nacional1.69500TN Al 2%
11Alginate 2% + chitosan 0.4% Moscatel Galego1.64180MG AL + Ch 0.4%
12Alginate 2% + chitosan 0.4% Touriga Nacional1.56874TN AL + Ch 0.4%
13Gelatin (4 leaves/100 mL) Moscatel Galego1.57904MG Ge
14Gelatin (4 leaves/100 mL Touriga Nacional1.55987TN Ge
15Gelatin (4 leaves/100 mL) + Arabic gum Sweet Gum Touriga Nacional1.60356TN Ge + Ga Sweet Gum
16Gelatin (4 leaves/100 mL) + Arabic gum Saistab Fast L Touriga Nacional1.70025TN Ge + Ga Saistab Fast L
17Gelatin (4 leaves/100 mL) + Arabic gum Supragum Touriga Nacional1.63114TN Ge + Ga Supragum Filtra
18Chitosan 0.6% (+ 6 drops of HCl at 37%) Touriga Nacional2.01055TN Ch 6%
19Chitosan 1.5% (+14 drops of HCl at 37%) Touriga Nacional1.90835TN Ch 1.5%
20Chitosan 2.5% (+20 drops of HCl at 37%) Touriga Nacional1.99261TN Ch 2.5%
21Control Moscatel Galego1.67969MG control
22Control Touriga Nacional1.73862TN control
23Encapsulating agent agar 2%-Ag 2%
24Encapsulating agent agar 4%-Ag 4%
25Encapsulating agent agar 6%-Ag 6%
26Encapsulating agent gelatin 4 leaves/
100 mL
-Ge
27Encapsulating agent chitosan 0.6%-Ch 0.6%
28Encapsulating agent chitosan 1.5%-Ch 1.5%
29Encapsulating agent chitosan 2.5%-Ch 2.5%
30Encapsulating agent alginate 1.5%-Al 1.5%
31Encapsulating agent alginate 2.0% -Al 2.0%
32Encapsulating agent alginate 2.0% +
chitosan 0.4%
-Al + Ch
Table 3. Grape pomace and coated grape infusions’ pH and Brix. Values are presented as the mean ± standard deviation. For the same parameter, for grape pomace and coated grapes, different letters indicate significant differences at p ≤ 0.05 (Tukey’s HSD test).
SamplespH (M ± SD)Brix (M ± SD)
MG Ag 6%3.89 ± 0.03 a0.87 ± 0.05 a
TN Ag 6%4.59 ± 0.03 I0.93 ± 0.05 a
MG Ag 4%3.87 ± 0.03 a1.40 ± 0.00 h
TN Ag 4%4.62 ± 0.00 i1.00 ± 0.00 abc
MG Ag 2%4.23 ± 0.03 cde1.23 ± 0.05 defg
TN Ag 2%3.94 ± 0.04 ab1.27 ± 0.05 efgh
MG Al 1.5%3.93 ± 0.03 ab1.20 ± 0.00 def
TN Al 1.5%4.17 ± 0.05 c1.37 ± 0.05 gh
MG Al 2%4.02 ± 0.02 b1.27 ± 0.05 efgh
TN Al 2%4.28 ± 0.01 def1.33 ± 0.05 fgh
MG Al + Ch 0.4%4.04 ± 0.02 b1.37 ± 0.05 gh
TN Al + Ch 0.4%4.39 ± 0.06 fg1.27 ± 0.05 efgh
MG Ge3.95 ± 0.02 ab1.33 ± 0.05 fgh
TN Ge4.47 ± 0.03 gh0.97 ± 0.05 ab
TN Ge + Ga Sweet Gum4.17 ± 0.01 cd1.17 ± 0.05 de
TN Ge + Ga Saistab Fast L4.75 ± 0.02 j0.93 ± 0.05 a
TN Ge + Ga Supragum Filtra4.32 ± 0.03 ef1.00 ± 0.00 abc
TN Ch 0.6% 4.35 ± 0.05 f1.10 ± 0.08 bcd
TN Ch 1.5%4.55 ± 0.00 hi1.00 ± 0.00 abc
TN Ch 2.5%4.61 ± 0.01 i1.00 ± 0.00 abc
MG control3.91 ± 0.01 a1.13 ± 0.05 cde
TN control4.30 ± 0.02 ef1.13 ± 0.05 cde
Grape pomace 50 °C3.55 ± 0.04 a0.07 ± 0.06 a
Grape pomace 60 °C3.65 ± 0.04 a0.10 ± 0.00 a
Grape pomace 70 °C3.69 ± 0.04 a0.13 ± 0.06 a
Table 4. Average value (mean ± SD) of the CIELAB coordinates of the infusions prepared with each of the dried–minced coated grape samples and with the grape pomaces (50, 60, and 70 °C). For grape pomaces and coated grapes, different letters indicate significant differences at p ≤ 0.05 (Tukey’s HSD test).
SamplesL*/10a*b*CH
MG Ag 6%3.28 ± 0.006 n0.11 ± 0.010 a3.93 ± 0.006 g3.93 ± 0.006 g1.54 ± 0.003 i
TN Ag 6%3.34 ± 0.006 q0.16 ± 0.015 b6.55 ± 0.000 p6.55 ± 0.000 o1.55 ± 0.002 i
MG Ag 4%3.15 ± 0.026 m0.08 ± 0.012 a3.13 ± 0.012 d3.13 ± 0.011 d1.55 ± 0.004 i
TN Ag 4%3.40 ± 0.020 r0.25 ± 0.006 c8.10 ± 0.006 r8.11 ± 0.006 q1.54 ± 0.001 i
MG Ag 2%3.09 ± 0.012 k0.84 ± 0.012 i6.83 ± 0.021 q6.89 ± 0.020 p1.45 ± 0.002 h
TN Ag 2%3.31 ± 0.000 p0.27 ± 0.006 c5.20 ± 0.015 m5.20 ± 0.015 i1.52 ± 0.001 k
MG Al 1.5%3.15 ± 0.040 i0.37 ± 0.030 d4.07 ± 0.047 h4.08 ± 0.045 h1.48 ± 0.008 j
TN Al 1.5%2.90 ± 0.006 e1.01 ± 0.026 k5.06 ± 0.006 i5.16 ± 0.006 i1.37 ± 0.005 d
MG Al 2%3.05 ± 0.017 i0.25 ± 0.023 c3.07 ± 0.023 c3.08 ± 0.022 c1.49 ± 0.008 j
TN Al 2%2.85 ± 0.006 c1.13 ± 0.023 m4.76 ± 0.015 k4.89 ± 0.010 k1.34 ± 0.005 ab
MG Al + Ch 0.4%2.99 ± 0.006 h0.18 ± 0.012 b3.18 ± 0.006 e3.19 ± 0.005 e1.52 ± 0.004 k
TN Al + Ch 0.4%3.05 ± 0.010 i0.95 ± 0.000 j6.13 ± 0.012 o6.21 ± 0.011 n1.42 ± 0.000 ef
MG Ge2.88 ± 0.000 d0.46 ± 0.006 e2.45 ± 0.006 a2.50 ± 0.005 a1.38 ± 0.003 d
TN Ge2.76 ± 0.006 a0.67 ± 0.006 h2.76 ± 0.017 b2.84 ± 0.016 b1.33 ± 0.003 a
TN Ge + Ga Sweet Gum2.96 ± 0.006 g0.58 ± 0.000 g4.22 ± 0.010 i4.26 ± 0.010 i1.43 ± 0.000 g
TN Ge + Ga Saistab Fast L2.78 ± 0.006 b0.55 ± 0.006 fg3.66 ± 0.010 f3.70 ± 0.011 f1.42 ± 0.001 f
TN Ge + Ga Supragum Filtra3.05 ± 0.000 j1.09 ± 0.000 i4.78 ± 0.000 k4.90 ± 0.000 k1.35 ± 0.000 b
TN Ch 0.6% 3.29 ± 0.000 o1.45 ± 0.006 p8.90 ± 0.006 s9.01 ± 0.005 r1.41 ± 0.001 e
TN Ch 1.5%3.32 ± 0.000 p1.33 ± 0.006 o8.95 ± 0.012 t9.05 ± 0.012 r1.42 ± 0.000 f
TN Ch 2.5%3.49 ± 0.010 s1.04 ± 0.006 k10.19 ± 0.006 u10.24 ± 0.006 s1.47 ± 0.001 i
MG control3.15 ± 0.017 m0.52 ± 0.010 f4.33 ± 0.010 j4.36 ± 0.009 j1.45 ± 0.003 h
TN control2.94 ± 0.006 f1.25 ± 0.010 n5.81 ± 0.017 n5.94 ± 0.015 m1.36 ± 0.002 c
Grape pomace 50 °C4.00 ± 0.001 c−0.19 ± 0.000 b4.65 ± 0.010 c4.65 ± 0.010 c178.47 ± 0.000 a
Grape pomace 60 °C3.52 ± 0.001 a −0.15 ± 0.010 a3.01 ± 0.006 a3.01 ± 0.006 a178.48 ± 0.000 b
Grape pomace 70 °C3.78 ± 0.005 b −0.24 ± 0.015 c3.89 ± 0.012 b3.89 ± 0.011 b178.49 ± 0.000 c
Table 5. Mean ± SD of the scores of each descriptor (sensory attribute) of the infusions prepared with the various samples of dried grape pomace (DGP) at 70 °C, and with added cinnamon, ginger, honey, and mint. Different letters indicate significant differences at p ≤ 0.05 (Duncan’s test).
DescriptorsDGP and CinnamonDGP and GingerDGP and HoneyDGP and MintDGP at 70 °C
Light intensity2.4 ± 1.41.7 ± 0.82.9 ± 1.82.3 ± 1.51.7 ± 0.5
Turbidity1.0 ± 0.0 a1.1 ± 0.4 a2.9 ± 1.1 b1.0 ± 0.0 a1.2 ± 0.4 a
Herbaceous aroma2.9 ± 1.7 ab2.9 ± 1.5 ab1.4 ± 0.5 a3.0 ± 1.7 b2.0 ± 0.9 ab
Smoky/burnt aroma1.7 ± 1.11.6 ± 0.81.9 ± 1.61.1 ± 0.41.5 ± 0.5
Natural aroma of dry pomace2.9 ± 1.1 c1.9 ± 0.9 ab1.4 ± 0.8 a1.4 ± 0. 8 a2.8 ± 1.5 c
Grape aroma1.9 ± 1.21.3 ± 0.81.9 ± 1.21.1 ± 0.41.7 ± 1.2
Sweet taste1.6 ± 0.8 a1.6 ± 0.8 a4.3 ± 0.8 b1.7 ± 1.3 a1.5 ± 0.5 a
Acid taste1.4 ± 0.81.4 ± 0.81.0 ± 0.01.4 ± 0.81.5 ± 0.8
Bitter taste1.7 ± 0.8 ab1.4 ± 0.5 a1.0 ± 0.0 a1.4 ± 0.5 a2.7 ± 1.6 b
Herbaceous flavor1.7 ± 0.8 ab2.1 ± 1.1 ab1.0 ± 0.0 a2.0 ± 1.2 ab3.0 ± 1.7 b
Astringency1.1 ± 0.41.1 ± 0.41.1 ± 0.41.1 ± 0.41.7 ± 1.6
Grape flavor1.3 ± 0.51.4 ± 0.81.6 ± 0.81.3 ± 0.51.7 ± 0.8
Full bodied2.0 ± 1.2 a1.9 ± 1.1 a3.6 ± 1.6 b2.4 ± 1.5 ab1.8 ± 1.3 a
Publisher’s Note: MDPI stays neutral with regard to jurisdictional claims in published maps and institutional affiliations.