Flood Risk Assessment and Its Mapping in Purba Medinipur District, West Bengal, India
Abstract
:1. Introduction
2. Materials and Methods
2.1. Data Consideration for the Flood Risk Assessment
2.2. Assessment of Extreme Geo-Hydrological Condition in the Study Area
2.2.1. Location
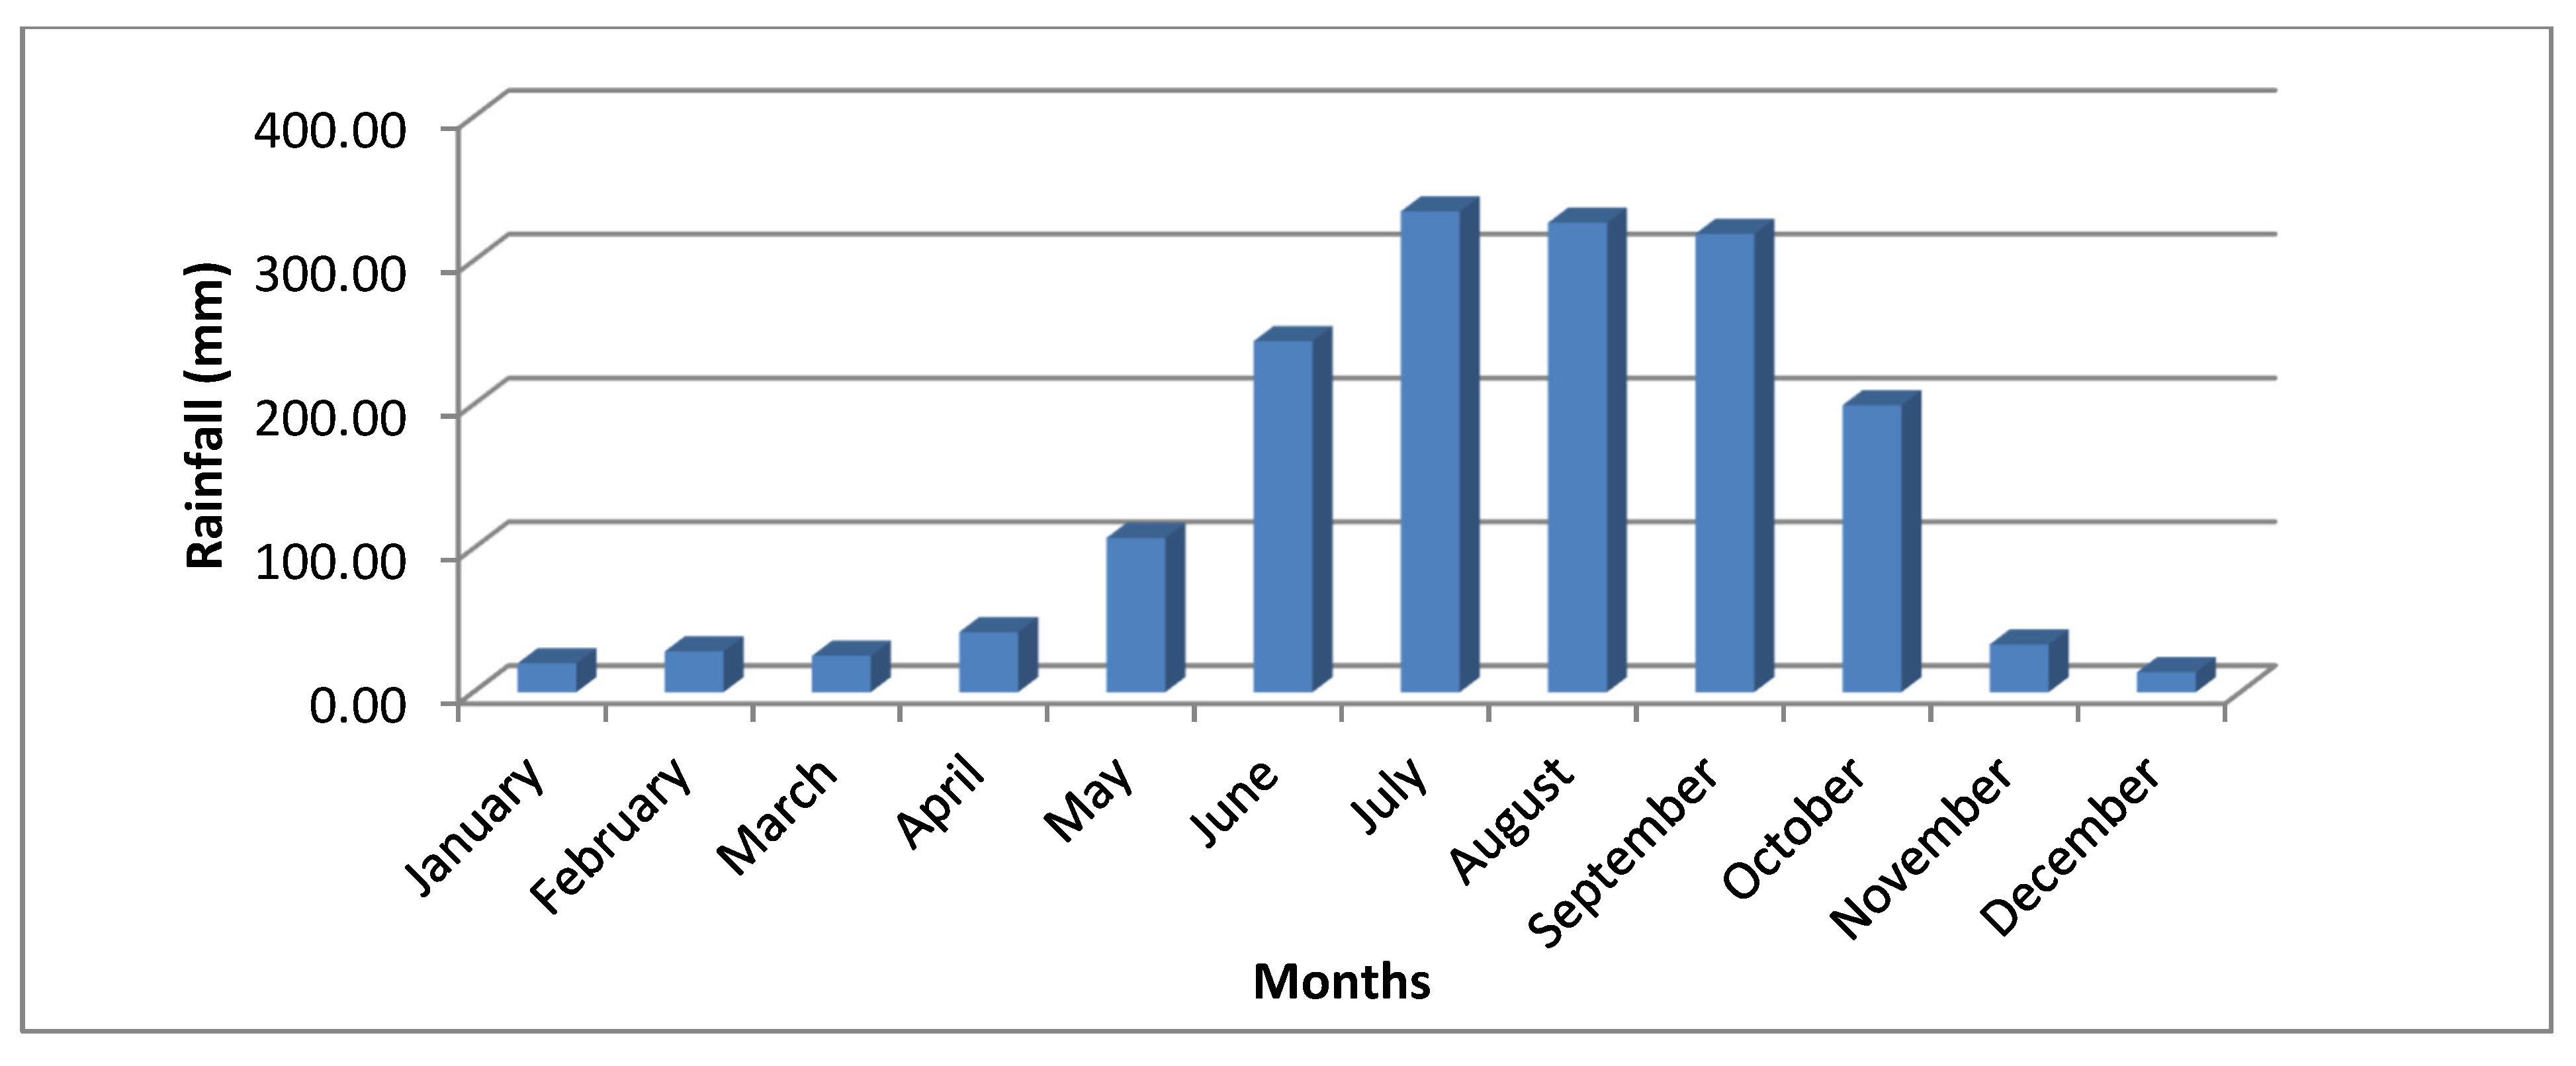
2.2.2. Rainfall
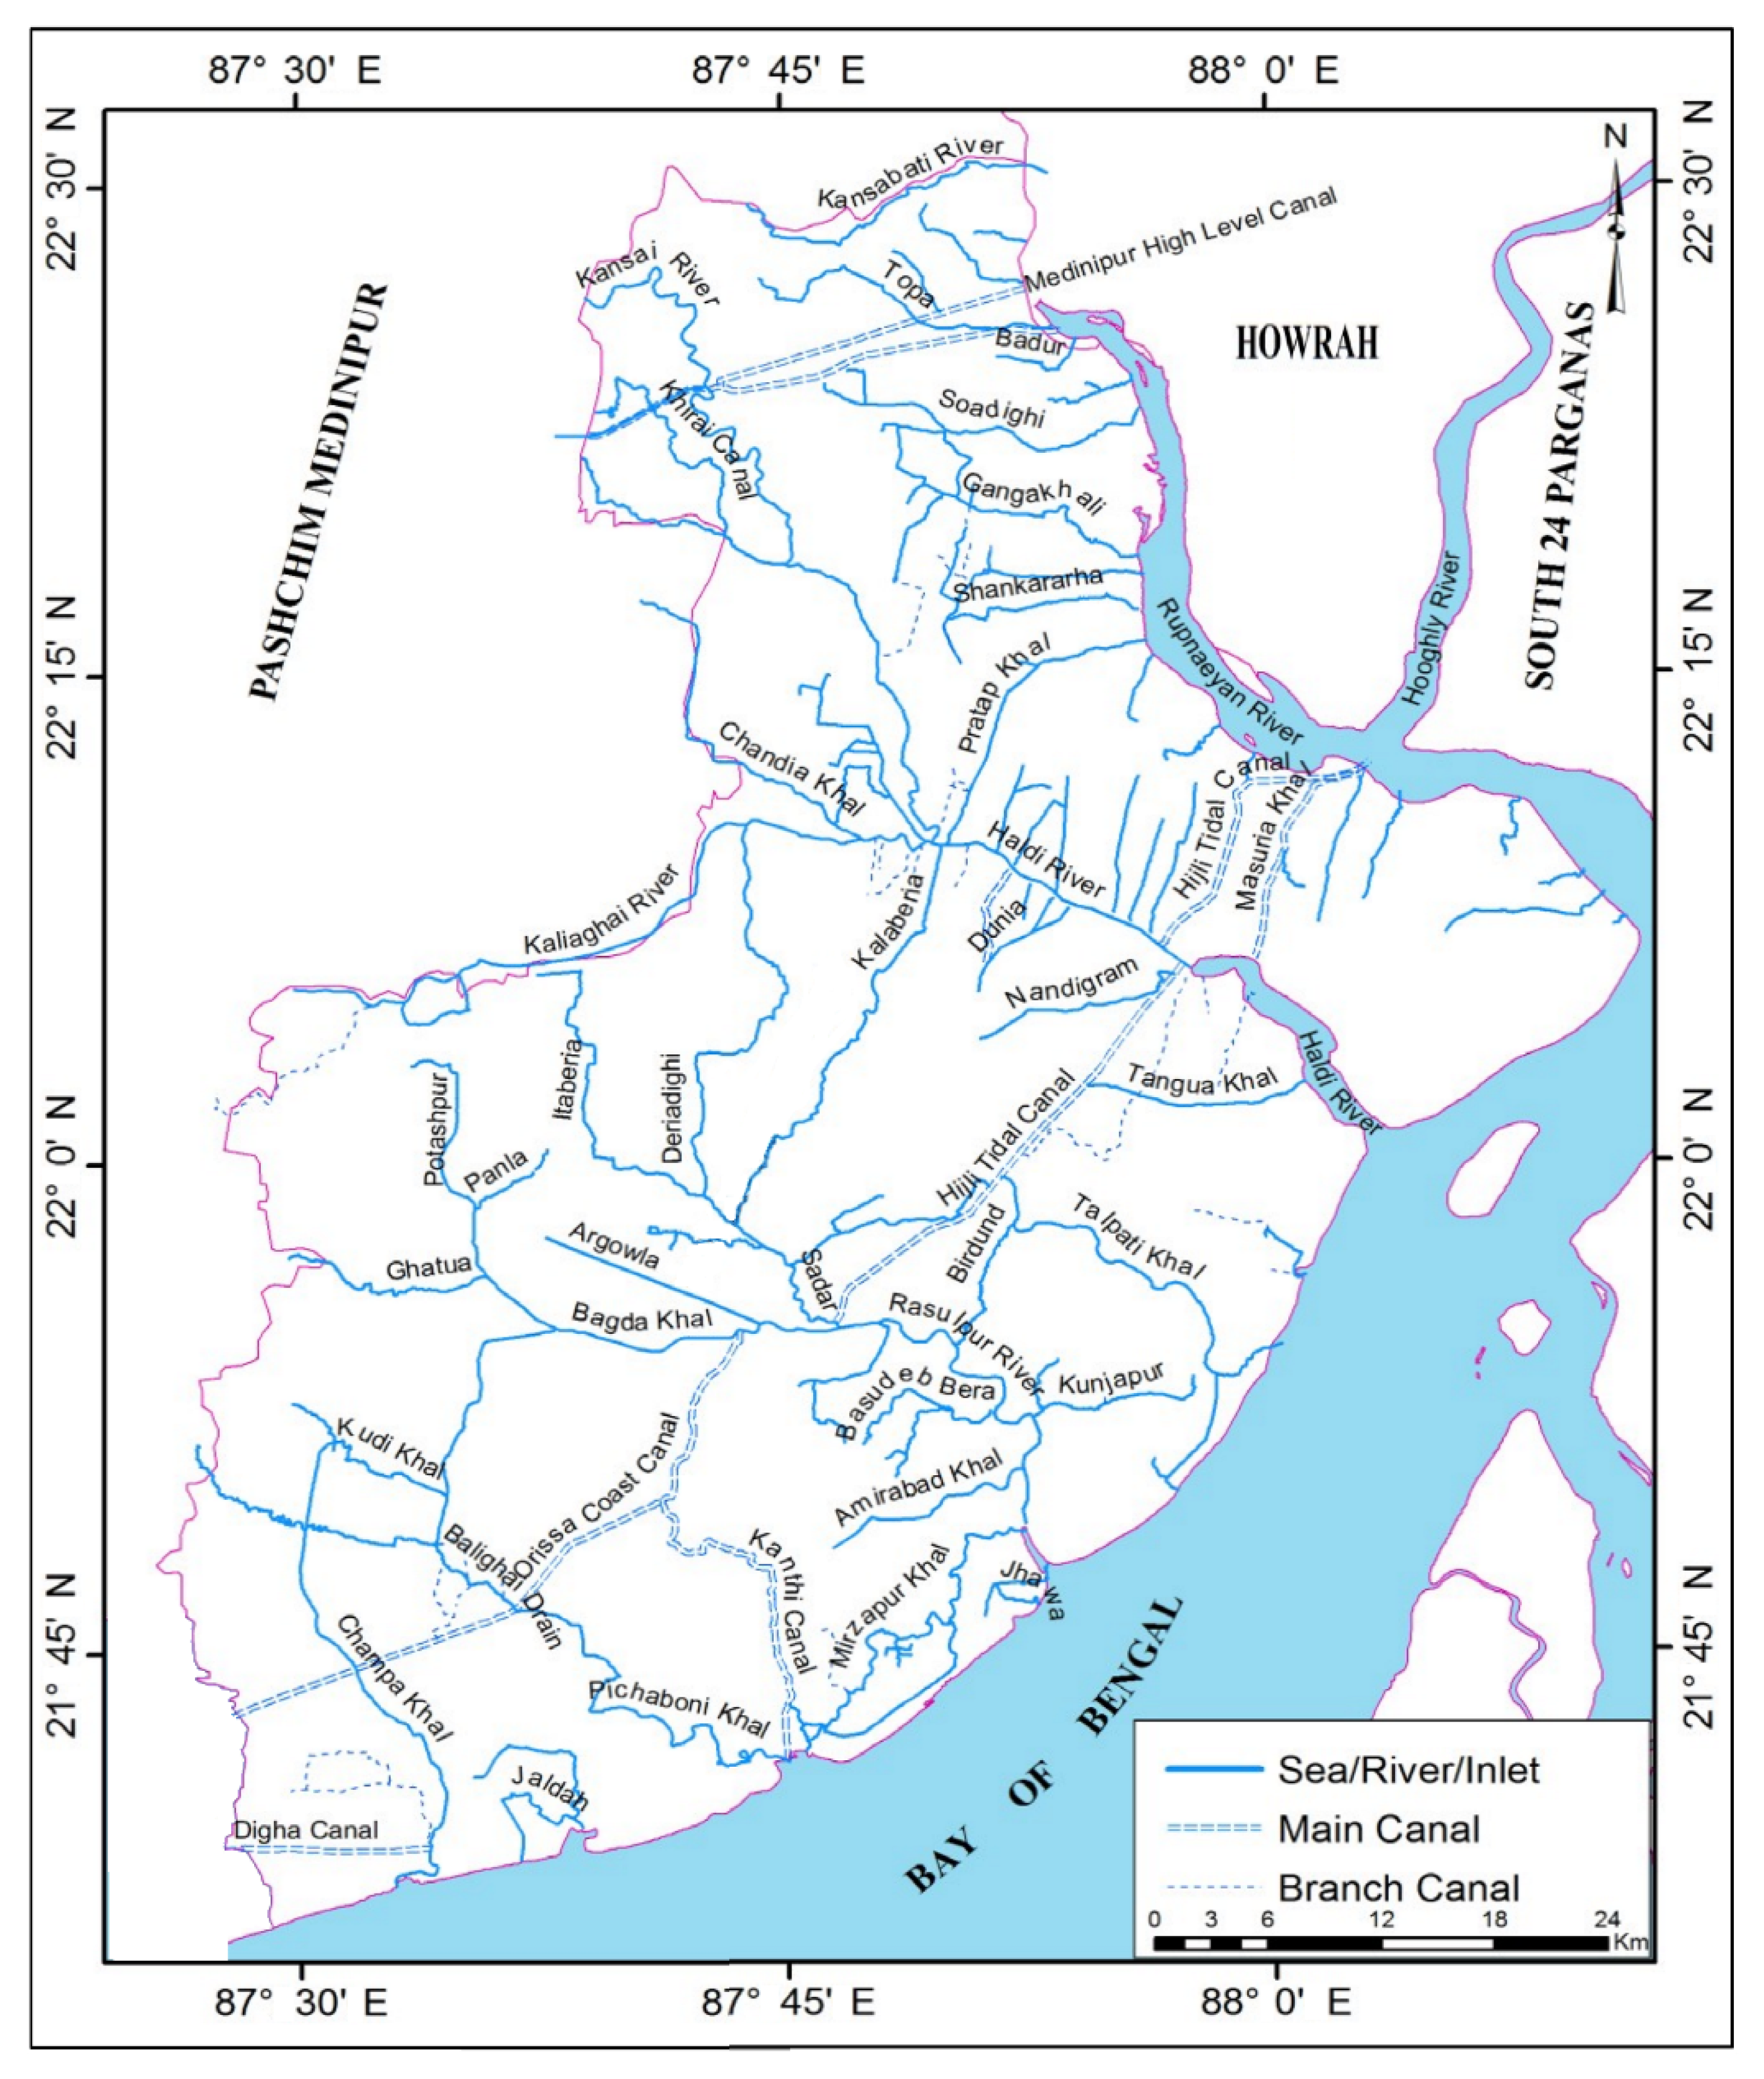
2.2.3. Drainage System
2.3. Assessment of Flood Risk in the Study Area
2.3.1. Flood Hazard Assessment
2.3.2. Vulnerability Assessment
2.3.3. Flood Risk Assessment
3. Results and Discussion
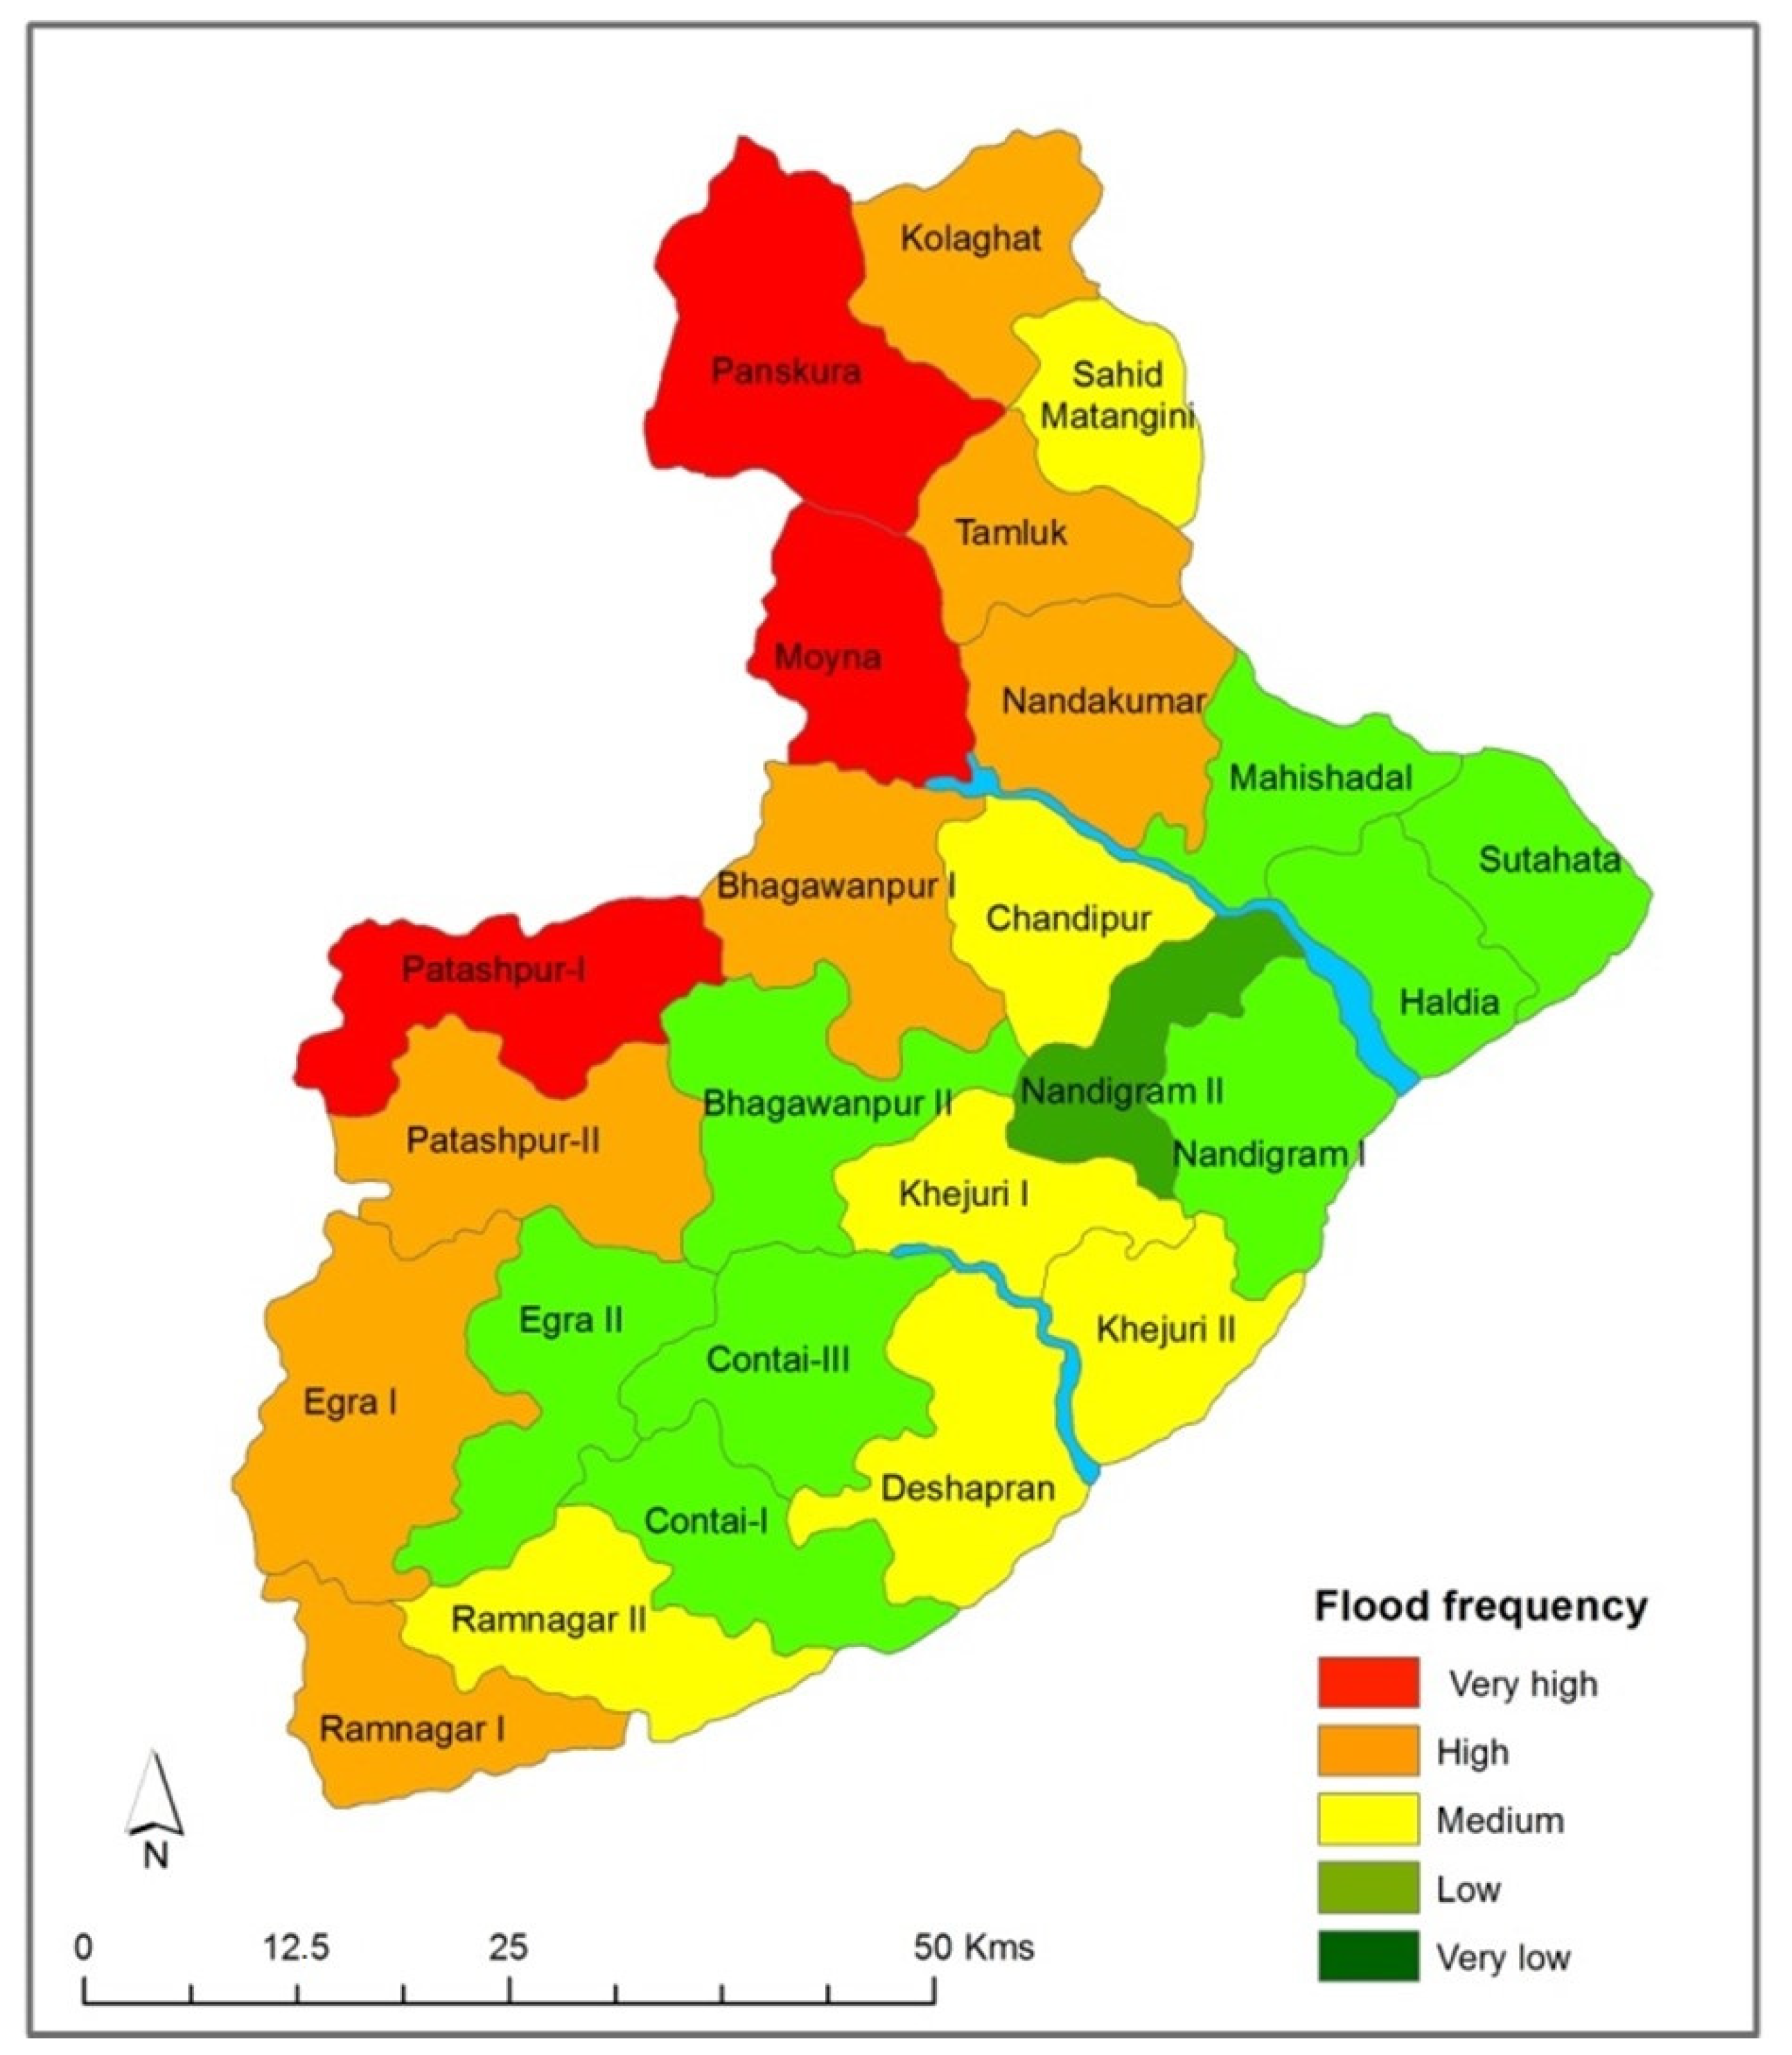
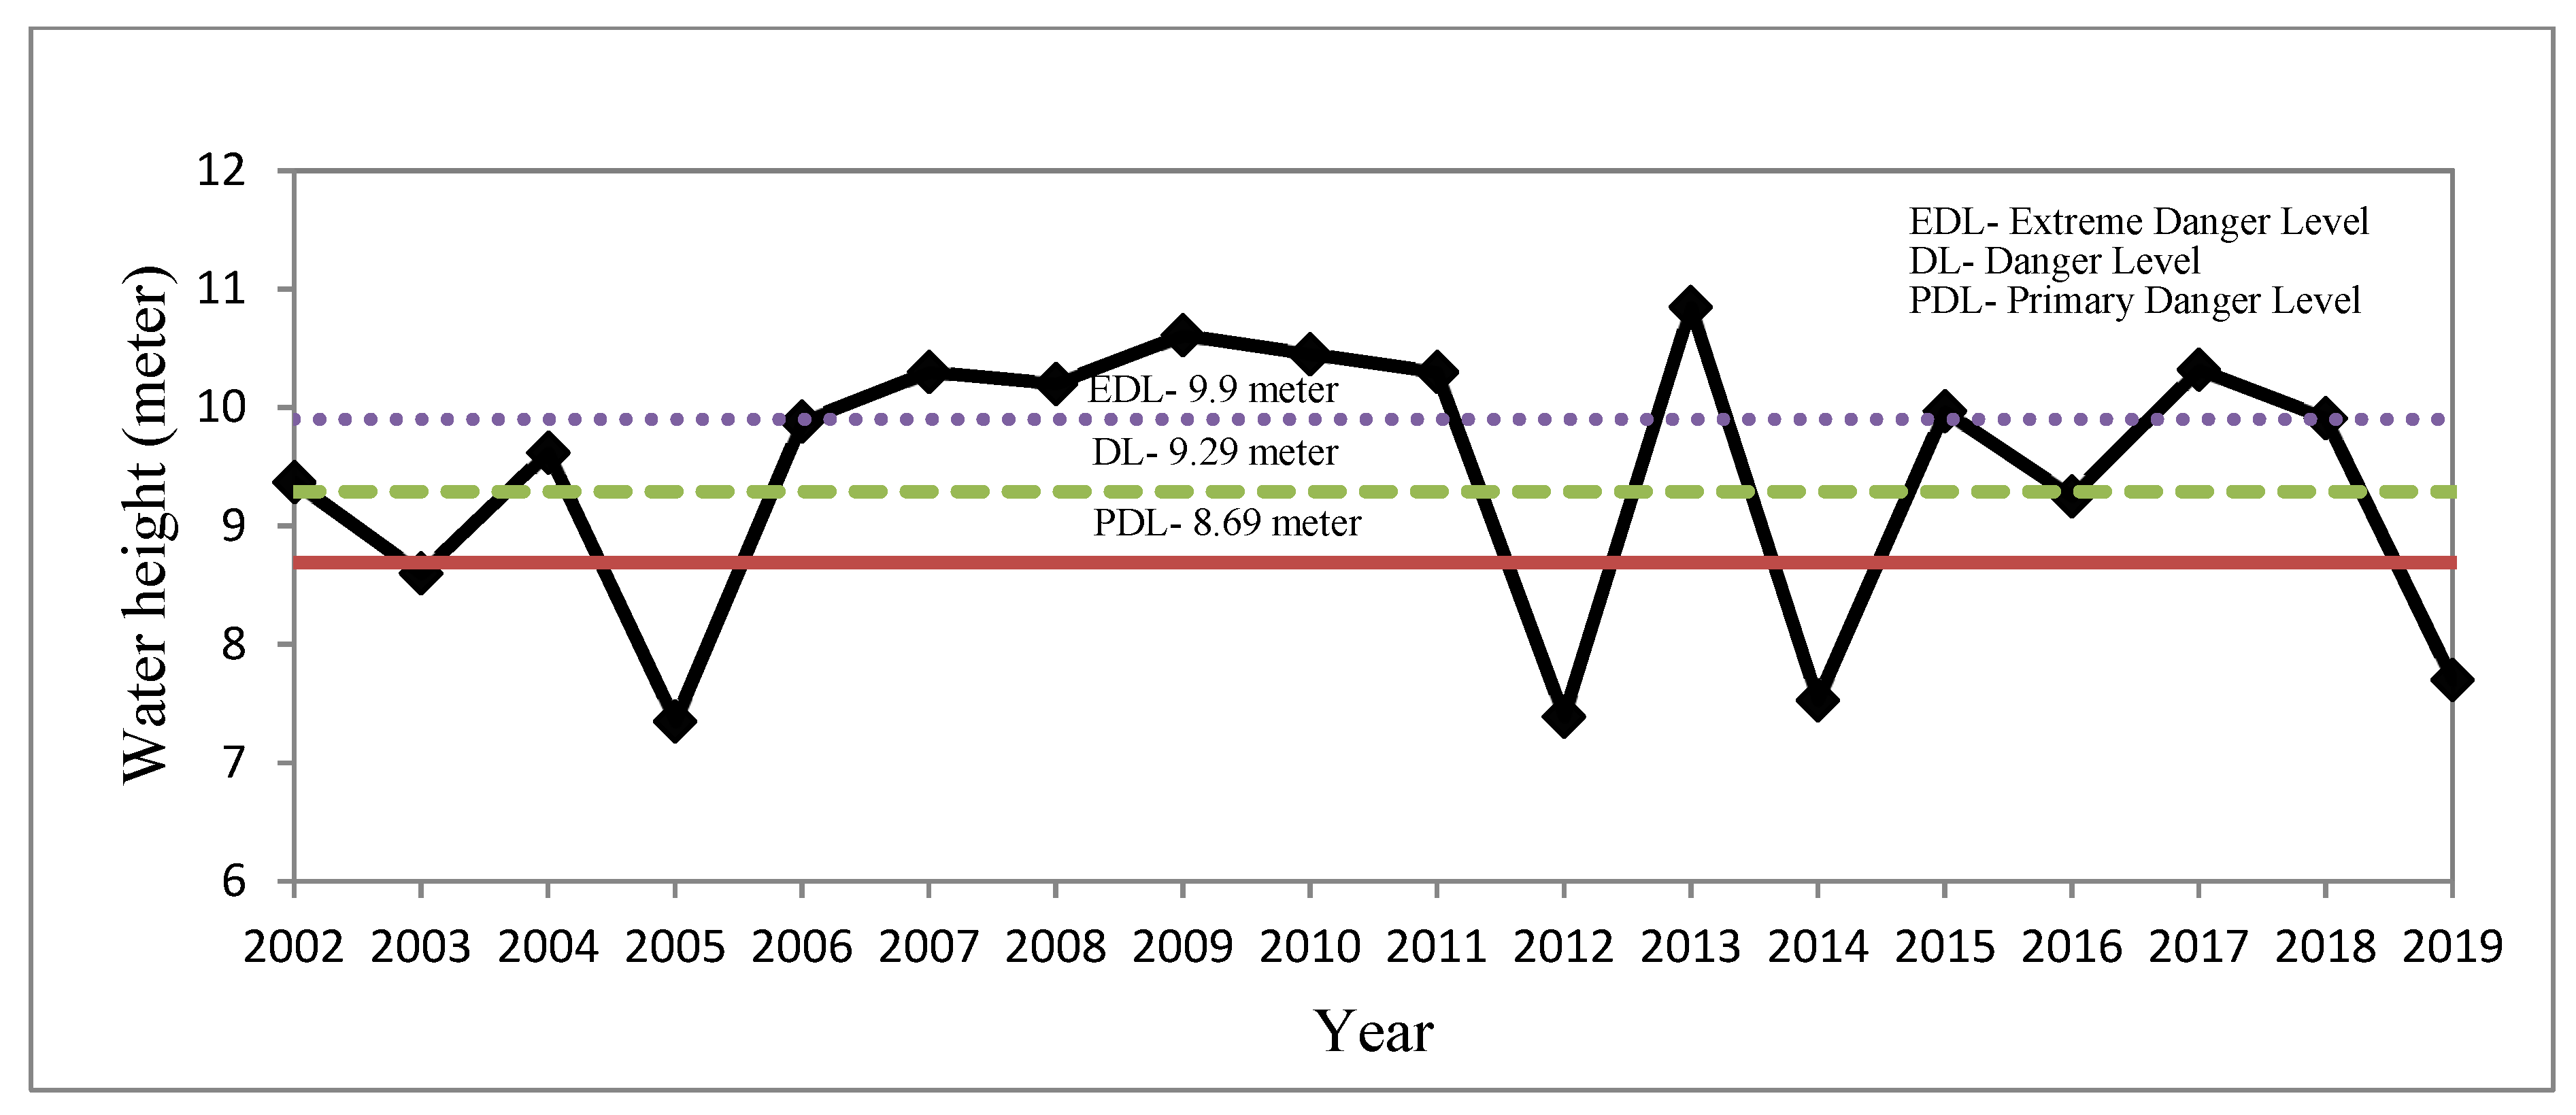
3.1. Flood Hazard Scenario and Its Spatial Variation
3.2. Understanding the Vulnerability Scenario and Its Spatial Variation
3.3. Flood Risk Analysis of the Study Area
4. Conclusions
Author Contributions
Funding
Data Availability Statement
Acknowledgments
Conflicts of Interest
References
- Kron, W. Flood Risk = Hazard Values Vulnerability. Water Int. 2005, 30, 58–68. [Google Scholar] [CrossRef]
- Svetlana, D.; Radovan, D.; Ján, D. The Economic impact of floods and their importance in different Regions of the World with Emphasis on Europe. Procedia Econ. Financ. 2015, 34, 649–655. [Google Scholar] [CrossRef] [Green Version]
- Wisner, B.; Blaikie, P.; Cannon, T.; Davis, I. At Risk. Natural Hazards, People’s Vulnerability, and Disasters, 2nd ed.; Routledge: London, UK, 2004. [Google Scholar]
- Haque, S.M. Management of flood induced sand deposit land through agricultural adaption: A study from Dulung river basin. In Combating Environmental Hazard and Disaster: Issue and Approaches, UGC-HRDC Sponsored Anthology of Paper; Sen, S., Chaudhuri, P., Goswami, B., Satpati, L.N., Eds.; University of Calcutta: Kolkata, India, 2017; pp. 46–55. [Google Scholar]
- Manjusree, P.; Rao, G.S. Flood hazards: Evolution and satellite data. Geogr. You 2017, 17, 35–37. [Google Scholar]
- UNISDR. Flood Hazard and Risk Assessment. In Words into Action Guidelines, National Disaster Risk Assessment; Hazard Specific Risk Assessment: Geneva, Switzerland, 2017; pp. 1–16. Available online: https://www.unisdr.org/files/52828_04floodhazardandriskassessment.pdf (accessed on 21 February 2022).
- Rasch, R.J. Assessing urban vulnerability to flood hazard in Brazilian municipalities. Environ. Urban. 2016, 28, 145–168. [Google Scholar] [CrossRef] [Green Version]
- Luu, C.; Tran, H.X.; Pham, B.T.; Al-Ansari, N.; Tran, T.Q.; Duong, N.Q.; Dao, N.H.; Nguyen, L.P.; Nguyen, H.D.; Ta, H.T.; et al. Framework of Spatial Flood Risk Assessment for a Case Study in Quang Binh Province, Vietnam. Sustainability 2020, 12, 3058. [Google Scholar] [CrossRef] [Green Version]
- Jha, R.K.; Gundimeda, H. An integrated assessment of vulnerability to floods using composite index—A district level analysis for Bihar, India. Int. J. Disaster Risk Reduct. 2019, 35, 101074. [Google Scholar] [CrossRef]
- Tang, J.; Li, Y.; Cui, S.; Xu, L.; Hu, Y.; Ding, S.; Nitivattananon, V. Analyzing the spatiotemporal dynamics of flood risk and its driving factors in a coastal watershed of southeastern China. Ecol. Indic. 2021, 121, 107134. [Google Scholar] [CrossRef]
- Dano, U.L.; Balogun, A.L.; Matori, A.N.; Wan Yusouf, K.; Abubakar, I.R.; Said Mohamed, M.A.; Aina, Y.A.; Pradhan, B. Flood Susceptibility Mapping Using GIS-Based Analytic Network Process: A Case Study of Perlis, Malaysia. Water 2019, 11, 615. [Google Scholar] [CrossRef] [Green Version]
- Ullah, K.; Zhang, J. GIS-based flood hazard mapping using relative frequency ratio method: A case study of Panjkora River Basin, eastern Hindu Kush, Pakistan. PLoS ONE 2020, 15, e0229153. [Google Scholar] [CrossRef] [Green Version]
- Tehrany, M.S.; Shabani, F.; Jebur, M.N.; Hong, H.; Chen, W.; Xie, X. GIS-based spatial prediction of flood prone areas using standalone frequency ratio, logistic regression, weight of evidence and their ensemble techniques. Geomat. Nat. Hazards Risk 2017, 8, 1538–1561. [Google Scholar] [CrossRef]
- Allafta, H.; Opp, C. GIS-based multi-criteria analysis for flood prone areas mapping in the trans-boundary Shatt Al-Arab basin, Iraq-Iran. Geomat. Nat. Hazards Risk 2021, 12, 2087–2116. [Google Scholar] [CrossRef]
- Wu, C.F.; Chen, S.H.; Cheng, C.W.; Trac, L.V.T. Climate Justice Planning in Global South: Applying a Coupled Nature–Human Flood Risk Assessment Framework in a Case for Ho Chi Minh City, Vietnam. Water 2021, 13, 2021. [Google Scholar] [CrossRef]
- Cai, S.; Fan, J.; Yang, W. Flooding Risk Assessment and Analysis Based on GIS and the TFN-AHP Method: A Case Study of Chongqing, China. Atmosphere 2021, 12, 623. [Google Scholar] [CrossRef]
- Ciaravino, G.; Ciaravino, C. A simplified method for flood risk assessment. River Basin Manag. VIII 2015, 197, 103–114. [Google Scholar] [CrossRef] [Green Version]
- De Wrachien, D.; Mambretti, S.; Sole, A. Risk analysis and vulnerability assessment in flood protection and river basin management. Flood Recovery Innov. Response I 2008, 118, 3–15. [Google Scholar] [CrossRef] [Green Version]
- Kaya, C.M.; Tayfur, G.; Gungor, O. Predicting Flood Plain Inundation for Natural Channels having no Upstream Gauged Stations. J. Water Clim. Chang. 2019, 10, 360–372. [Google Scholar] [CrossRef]
- Mavhura, E.; Manyena, B.; Collins, A.E. An approach for measuring social vulnerability in context: The case of flood hazards in Muzarabani district, Zimbabwe. Geoforum 2017, 86, 103–117. [Google Scholar] [CrossRef]
- Török, I. Qualitative assessment of social vulnerability to flood hazards in Romania. Sustainability 2018, 10, 3780. [Google Scholar] [CrossRef] [Green Version]
- Chakraborty, L.; Rus, H.; Henstra, D.; Thistlethwaite, J.; Scott, D. A place-based socioeconomic status index: Measuring social vulnerability to flood hazards in the context of environmental justice. Int. J. Disaster Risk Reduct. 2020, 43, 101394. [Google Scholar] [CrossRef]
- Tascón-González, L.; Ferrer-Julià, M.; Ruiz, M.; García-Meléndez, E. Social vulnerability assessment for flood risk analysis. Water 2020, 12, 558. [Google Scholar] [CrossRef] [Green Version]
- Munyai, R.B.; Musyoki, A.; Nethengwe, N.S. An assessment of flood vulnerability and adaptation: A case study of Hamutsha-Muungamunwe village, Makhado municipality. Jàmbá J. Disaster Risk Stud. 2019, 11, a692. [Google Scholar] [CrossRef] [PubMed] [Green Version]
- Bahinipati, C.S. Assessment of vulnerability to cyclones and floods in Odisha, India: A district-level analysis. Curr. Sci. 2014, 107, 1997–2007. Available online: https://www.jstor.org/stable/24216033 (accessed on 11 October 2021).
- Usama, M. Management of Floods in Flood Prone Regions of Eastern Uttar Pradesh. Int. Adv. Res. J. Sci. Eng. Technol. 2015, 2, 148–152. [Google Scholar] [CrossRef]
- Sharma, V.K.; Priya, T. Development strategies for flood prone areas, case study: Patna, India. Disaster Prev. Manag. 2001, 10, 101–109. [Google Scholar] [CrossRef]
- Chapman, G.P.; Rudra, K. Water as foe, water as friend: Lessons from Bengal’s Millennium Flood. J. South Asian Dev. 2007, 2, 19–49. [Google Scholar] [CrossRef]
- Barman, N.K.; Chatterjee, S.; Paul, A.K.; Pradhan, M.K. Assessment of prolonged unsafe conditions through tidal flood and rain water flood at Lower Bengal Basin, India. Arts Soc. Sci. J. 2015, 6, 4. [Google Scholar] [CrossRef]
- Das, S.C.; Sahu, A.S. Flood zanation mapping using RS and GIS techniques: A case study in Panskura of Purba Medinipur district, West Bengal. Indian J. Landsc. Syst. Ecol. Stud. 2017, 40, 126–135. [Google Scholar] [CrossRef]
- Kaur, H.; Gupta, S.; Parkash, S.; Thapa, R.; Mandal, R. Geospatial modelling of flood susceptibility pattern in a subtropical area of West Bengal, India. Environ. Earth Sci. 2017, 76, 339. [Google Scholar] [CrossRef]
- Gayen, S.; Villalta, I.V.; Haque, S.M. Comparative social vulnerability assessment in Purba Medinipur District, West Bengal, India. Eur. J. Geogr. 2020, 11, 93–107. [Google Scholar] [CrossRef]
- Tchórzewska-Cieślak, B.; Pietrucha-Urbanik, K.; Zygmunt, A. Implementation of Matrix Methods in Flood Risk Analysis and Assessment. Ekonomia i Środowisko 2018, 3, 8–24. Available online: https://ekonomiaisrodowisko.pl/journal/article/view/134 (accessed on 21 March 2022).
- Jelínek, R.; Eckert, S.; Zeug, G.; Krausmann, E. Tsunami Vulnerability and Risk Analysis Applied to the City of Alexandria, Egypt. Tsunami Risk and Strategies for the European Region (TRANSFER). 2009. Available online: https://publications.jrc.ec.europa.eu/repository/handle/JRC53316 (accessed on 3 February 2022).
- Aguirre-Ayerbe, I.; Sánchez, J.M.; Aniel-Quiroga, Í.; González-Riancho, P.; Merino, M.; Al-Yahyai, S.; González, M.; Medina, R. From tsunami risk assessment to disaster risk reduction—The case of Oman. Nat. Hazards Earth Syst. Sci. Discuss 2018, 18, 2241–2260. [Google Scholar] [CrossRef] [Green Version]
- District Statistical Handbook; Bureau of Applied Economics & Statistics, Department of Statistics & Programme Implementation, Government of West Bengal: Kolkata, India. Available online: http://wbpspm.gov.in/publications/District%20Statistical%20Handbook (accessed on 27 February 2022).
- Annual Flood Report; Irrigation and Waterways Directorate, Government of West Bengal: Kolkata, India. Available online: https://www.wbiwd.gov.in/index.php/applications/anual_flood_report (accessed on 27 February 2022).
- Census of India. District Census Handbook, Purba Medinipur; Village and Town Wise Primary Census Abstract; Directorate of Census Operations: West Bengal, India, 2011; Series-20; Part XII-B.
- ISDR. Living with Risk. In A Global Review of Disaster Reduction Initiatives; United Nations: Geneva, Switzerland, 2004; Volume 1. [Google Scholar]
- UNDP. A Global Report. Reducing Disaster Risk A Challenge for Development, Bureau for Crisis Prevention and Recovery; UNDP: New York, NY, USA, 2004. [Google Scholar]
- Barroca, B.; Bernardara, P.; Mouchel, J.M.; Hubert, G. Indicators for identification of urban flooding vulnerability. Nat. Hazards Earth Syst. Sci. 2006, 6, 553–561. [Google Scholar] [CrossRef]
- Pistrika, A.; Tsakiris, G. Flood Risk Assessment: A methodological Framework. In Water Resources Management: New Approaches and Technologies; European Water Resources Association: Chania, Greece, 2007; Available online: https://www.researchgate.net/publication/228663953_Flood_Risk_Assessment_A_Methodological_Framework (accessed on 5 February 2022).
- Cançado, V.; Brasil, L.; Nascimento, N.; Guerra, A. Flood risk assessment in an urban area: Measuring hazard and vulnerability. In Proceedings of the 11th International Conference on Urban Drainage, Edinburgh, UK, 31 August–5 September 2008. [Google Scholar]
- Asare-Kyei, D.; Forkuor, G.; Venus, V. Modeling Flood Hazard Zones at the Sub-District Level with the Rational Model Integrated with GIS and Remote Sensing Approaches. Water 2015, 7, 3531–3564. [Google Scholar] [CrossRef] [Green Version]
- Kabenge, M.; Elaru, J.; Wang, H.; Li, F. Characterizing flood hazard risk in data-scarce areas, using a remote sensing and GIS-based flood hazard index. Nat. Hazards 2017, 89, 1369–1387. [Google Scholar] [CrossRef]
- Rehman, S.; Sahana, M.; Hong, H.; Sajjad, H.; Ahmed, B.B. A systematic review on approaches and methods used for flood vulnerability assessment: Framework for future research. Nat. Hazards 2019, 96, 975–998. [Google Scholar] [CrossRef]
- di Girasole, E.G.; Cannatella, D. Social Vulnerability to Natural Hazards in Urban Systems. An Application in Santo Domingo (Dominican Republic). Sustainability 2017, 9, 2043. [Google Scholar] [CrossRef] [Green Version]
- Tate, E.; Rahman, M.A.; Emrich, C.T.; Sampson, C.C. Flood exposure and social vulnerability in the United States. Nat. Hazards 2021, 106, 435–457. [Google Scholar] [CrossRef]
- Müller, A.; Reiter, J.; Weiland, U. Assessment of urban vulnerability towards floods using an indicator-based approach—A case study for Santiago de Chile. Nat. Hazards Earth Syst. Sci. 2011, 11, 2107–2123. [Google Scholar] [CrossRef] [Green Version]
- Ahmad, H.F.; Bhat, M.S.; Alam, A.; Ahmad, S. Flood Hazard Zonation and Vulnerability Assessment of Greater Srinagar, J&K, India. Int. J. Adv. Res. 2016, 4, 1679–1690. [Google Scholar] [CrossRef] [Green Version]
- Kuhlicke, C.; Scolobig, A.; Tapsell, S.; Steinfuhrer, A.; Marchi, B.D. Contextualizing social vulnerability: Findings from case studies across Europe. Nat. Hazards 2011, 58, 789–810. [Google Scholar] [CrossRef]
- Hazarika, N.; Barman, D.; Das, A.K.; Sarma, A.K.; Borah, S.B. Assessing and mapping flood hazard, vulnerability and risk in the Upper Brahmaputra River valley using stakeholders’ knowledge and multicriteria evaluation (MCE). J. Flood Risk Manag. 2018, 11, S700–S716. [Google Scholar] [CrossRef]
- Maiti, S.; Jha, S.K.; Garai, S.; Nag, A.; Bera, A.K.; Paul, V.; Upadhaya, R.C.; Deb, S.M. An assessment of social vulnerability to climate change among the districts of Arunachal Pradesh, India. Ecol. Indic. 2017, 77, 105–113. [Google Scholar] [CrossRef]
- Cutter, S.L.; Burton, C.G.; Emrich, C.T. Disaster resilience indicators for benchmarking baseline conditions. J. Homel. Secur. Emerg. Manag. 2010, 7, 51. [Google Scholar] [CrossRef]
- Lixin, Y.; Xi, Z.; Ge, L.; Dong, Z. Analysis of social vulnerability to hazards in China. Environ. Earth Sci. 2014, 71, 3109–3117. [Google Scholar] [CrossRef]
- Sajjad, H.; Jain, P. Assessment of socio-economic vulnerabilities among urban migrants in South-East Delhi, India. J. Stud. Soc. Sci. 2014, 7, 65–81. Available online: https://www.infinitypress.info/index.php/jsss/article/viewFile/652/301 (accessed on 25 November 2021).
- Liu, D.; Li, Y. Social vulnerability of rural households to flood hazards in western mountainous regions of Henan province, China. Nat. Hazards Earth Syst. Sci. 2016, 16, 1123–1134. [Google Scholar] [CrossRef] [Green Version]
- Tali, M.G.; Naeimi, A.; Esfandiary, M. Physical Development of Arak City Applying Natural Indicators. Eur. J. Geogr. 2016, 7, 99–110. Available online: http://www.eurogeographyjournal.eu/articles/7.PHYSICAL%20DEVELOPMENT%20OF%20ARAK%20CITY%20APPLYING%20NATURAL%20INDICATORS.pdf (accessed on 12 October 2021).
- Žurovec, O.; Cˇadro, S.; Sitaula, B.K. Quantitative assessment of vulnerability to climate change in rural municipalities of Bosnia and Herzegovina. Sustainability 2017, 9, 1208. [Google Scholar] [CrossRef] [Green Version]
- Ge, Y.; Yang, G.; Chen, Y.; Dou, W. Examining social vulnerability and inequality: A joint analysis through a connectivity lens in the urban agglomerations of China. Sustainability 2019, 11, 1042. [Google Scholar] [CrossRef] [Green Version]
- Gayen, S.; Villalta, I.V.; Haque, S.M. Assessment of social vulnerability in Malaga Province, Spain: A comparison of indicator standardization techniques. Rev. Estud. Andal. 2021, 41, 87–108. [Google Scholar] [CrossRef]
- Vyas, S.; Kumaranayake, L. Constructing Socio-Economic Status Indices: How to use Principal Components Analysis. Health Policy Plan. 2006, 21, 459–468. [Google Scholar] [CrossRef] [PubMed] [Green Version]
- Horn, J.L. An empirical comparison of methods for estimating factor scores. Educ. Psychol. Meas. 1965, 25, 313–322. [Google Scholar] [CrossRef]
- Crawford, C.B. Determining the number of interpretable factors. Psychol. Bull. 1975, 82, 226–237. [Google Scholar] [CrossRef]
- Velicer, W.F. The Relation Between Factor Score Estimates, Image Scores, And Principal Component Scores. Educ. Psychol. Meas. 1976, 36, 149–159. [Google Scholar] [CrossRef]
- Aksha, S.K.; Juran, L.; Resler, L.M.; Zhang, Y. An analysis of social vulnerability to natural hazards in Nepal using a modified social vulnerability index. Int. J. Disaster Risk Sci. 2019, 10, 103–116. [Google Scholar] [CrossRef] [Green Version]
- Gautam, D. Assessment of social vulnerability to natural hazards in Nepal. Nat. Hazards Earth Syst. Sci. 2017, 17, 2313–2320. [Google Scholar] [CrossRef] [Green Version]
- de Mello Rezende, G.B. Social Vulnerability Index: A Methodological Proposal for Application in the Cities of Barra do Garcas—MT, Pontal Do Araguaia—MT and Aragarcas—GO, Brazil. Open J. Soc. Sci. 2016, 4, 32–45. [Google Scholar] [CrossRef] [Green Version]
- Phongsapan, K.; Chishtie, F.; Poortinga, A.; Bhandari, B.; Meechaiya, C.; Kunlamai, T.; Aung, K.S.; Saah, D.; Anderson, E.; Markert, K.; et al. Operational Flood Risk Index Mapping for Disaster Risk Reduction Using Earth Observations and Cloud Computing Technologies: A Case Study on Myanmar. Front. Environ. Sci. 2019, 7, 191. [Google Scholar] [CrossRef] [Green Version]
- Buta, C.; Mihai, G.; Stănescu, M. Flood Risk Assessment Based on Flood Hazard and Vulnerability Indexes. Ovidius Univ. Ann. Ser. Civ. Eng. 2020, 22, 127–137. [Google Scholar] [CrossRef]
- Sahu, A. Status of Soil in Purba Medinipur District, West Bengal—A Review. Indian J. Geogr. Environ. 2014, 13, 121–126. Available online: http://inet.vidyasagar.ac.in:8080/jspui/bitstream/123456789/1190/2/Ananya%20Sahu.pdf (accessed on 12 February 2022).
- Sahu, A.S. A study on Moyna Basin water-logged areas (India) using remote sensing and GIS methods and their contemporary economic significance. Geogr. J. 2014, 2014, 401324. [Google Scholar] [CrossRef]
- Laha, A.K.; Chatterjee, S.; Bera, K. Flood hazard impact assessment on societal perspective, case study of lower catchment’s of Kalighai—Baghai and Kapaleswary river. Int. Multidiscip. J. 2014, III, 107–115. Available online: https://www.researchgate.net/publication/273458882_Flood_hazard_impact_assessment_on_societal_perspective_case_study_of_lower_catchment_of_Kalighai_-Baghai_and_Kapaleswary_River (accessed on 8 February 2022).
- Laha, A.K.; Chatterjee, S.; Bera, K. Flood hazard cause assessment and their mitigation option using geo-informatics technology. Int. J. Sci. Res. Publ. 2014, 4, 1–7. Available online: http://www.ijsrp.org/research-paper-0814.php?rp=P323002 (accessed on 8 February 2022).
- Armenakis, C.; Du, E.X.; Natesan, S.; Persad, R.A.; Zhang, Y. Flood Risk Assessment in Urban Areas Based on Spatial Analytics and Social Factors. Geosciences 2017, 7, 123. [Google Scholar] [CrossRef] [Green Version]
- Kaiser, H.F. The application of electronic computers to factor analysis. Educ. Psychol. Meas. 1960, 20, 141–151. [Google Scholar] [CrossRef]
- Cutter, S.L.; Boruff, B.J.; Shirley, W.L. Social vulnerability to environmental hazards. Soc. Sci. Q. 2003, 84, 242–261. [Google Scholar] [CrossRef]
- Mosavi, A.; Ozturk, P.; Chau, K. Flood Prediction Using Machine Learning Models: Literature Review. Water 2018, 10, 1536. [Google Scholar] [CrossRef] [Green Version]
- Fu, M.; Fan, T.; Ding, Z.; Salih, S.Q.; Ansari, N.; Yaseen, Z.M. Deep Learning Data-Intelligence Model Based on Adjusted Forecasting Window Scale: Application in Daily Streamflow Simulation. IEEE Access 2020, 8, 32632–32651. [Google Scholar] [CrossRef]
- Kablan, M.K.A.; Dongo, K.; Coulibaly, M. Assessment of social vulnerability to flood in Urban Côte d’Ivoire using the MOVE framework. Water 2017, 9, 292. [Google Scholar] [CrossRef] [Green Version]


| Frequency of Flood (in Eighteen Years) | Hazard Classes | Hazard Index |
|---|---|---|
| <6 | Very low | 1 |
| 6–7 | Low | 2 |
| 8–9 | Medium | 3 |
| 10–11 | High | 4 |
| >11 | Very high | 5 |
| Sl. No. | Indicators | Description | Relationship with Vulnerability | Reference |
|---|---|---|---|---|
| 1 | Population density | Vulnerability is high in densely populated areas as many people live there. | Positive | [7] |
| 2 | Population growth rate | High population growth rate leads to high vulnerability of the society. | Positive | [25] |
| 3 | Female population | Women are more vulnerable due to their family responsibilities and low salary. | Positive | [48] |
| 4 | Child population (0–6 Years) | Children are always dependent on another person. | Positive | [49] |
| 5 | Rural population | Rural people suffer poor communication and medical facilities due to the remoteness from the urban area. | Positive | [25] |
| 6 | Literacy | Education and employment are inextricably linked. Higher education leads to better job opportunities. | Negative | [50] |
| 7 | Female literacy | Female literacy increases the chance of having a job for women. | Negative | [25] |
| 8 | Primary school density | Higher primary school density enhances chance of education for every child. | Negative | [9] |
| 9 | Employment rate | Employed people have good economic condition which means good standard of living. | Negative | [51] |
| 10 | Households with bad house condition | Bad condition of house increases the probability of damage from flood. | Positive | [9] |
| 11 | Households without electricity | To use modern technologies, electricity is absolutely needed. | Positive | [32] |
| 12 | Households without sanitation | Sanitation facility can reduce health related problems. | Positive | [32] |
| 13 | Households without sewage | Sewage system helps to get water out. Having no sewage system in house increases the impact of flood. | Positive | [32] |
| 14 | Households having source of safe drinking water | Safe drinking water is essential for health, as it prevents exposure to unappealing pollutants, bacteria, viruses, and parasites. | Negative | [52] |
| 15 | Households having kitchen | Households with a kitchen are hygienic. | Negative | [9] |
| 16 | Households having banking service | Banking facility supports economic condition. | Negative | [53] |
| 17 | Cultivator | Effect of flood has a huge impact on agriculture. Damage of crops is directly related to cultivator. | Positive | [25] |
| 18 | Agricultural labor | Agricultural laborers have no work during the flood period. | Positive | [25] |
| 19 | Area covered by irrigation (ha) | More area covered by irrigation means higher adaptive capacity. | Negative | [25] |
| 20 | Seed storage/10 sq. km | If agricultural productions are damaged by flood, seed stores are very important for re-planting. | Negative | Proposed in this research work |
| 21 | Average number of co-operative societies/0.1 million population | The co-operative society helps in product marketing, storage facilities, processing, transport, and availing intensive cultivation by modern techniques. | Negative | [25] |
| 22 | % of people having membership in co-operative societies | Co-operative societies grant agricultural loan to the members. | Negative | [25] |
| 23 | Number of bank/0.1 million population | Number of bank/0.1 million population facilitates economic infrastructure of the region. | Negative | [25] |
| 24 | Road density | Roads are important for rescue purpose during any type of hazard. | Negative | [9] |
| 25 | Permanent flood shelter/10 sq. km | Flood shelter is extremely important before and after disaster. It is a temporary home for the flood-affected people. These shelters are used to manage relief and rehabilitation activities in an organized way. | Negative | [52] |
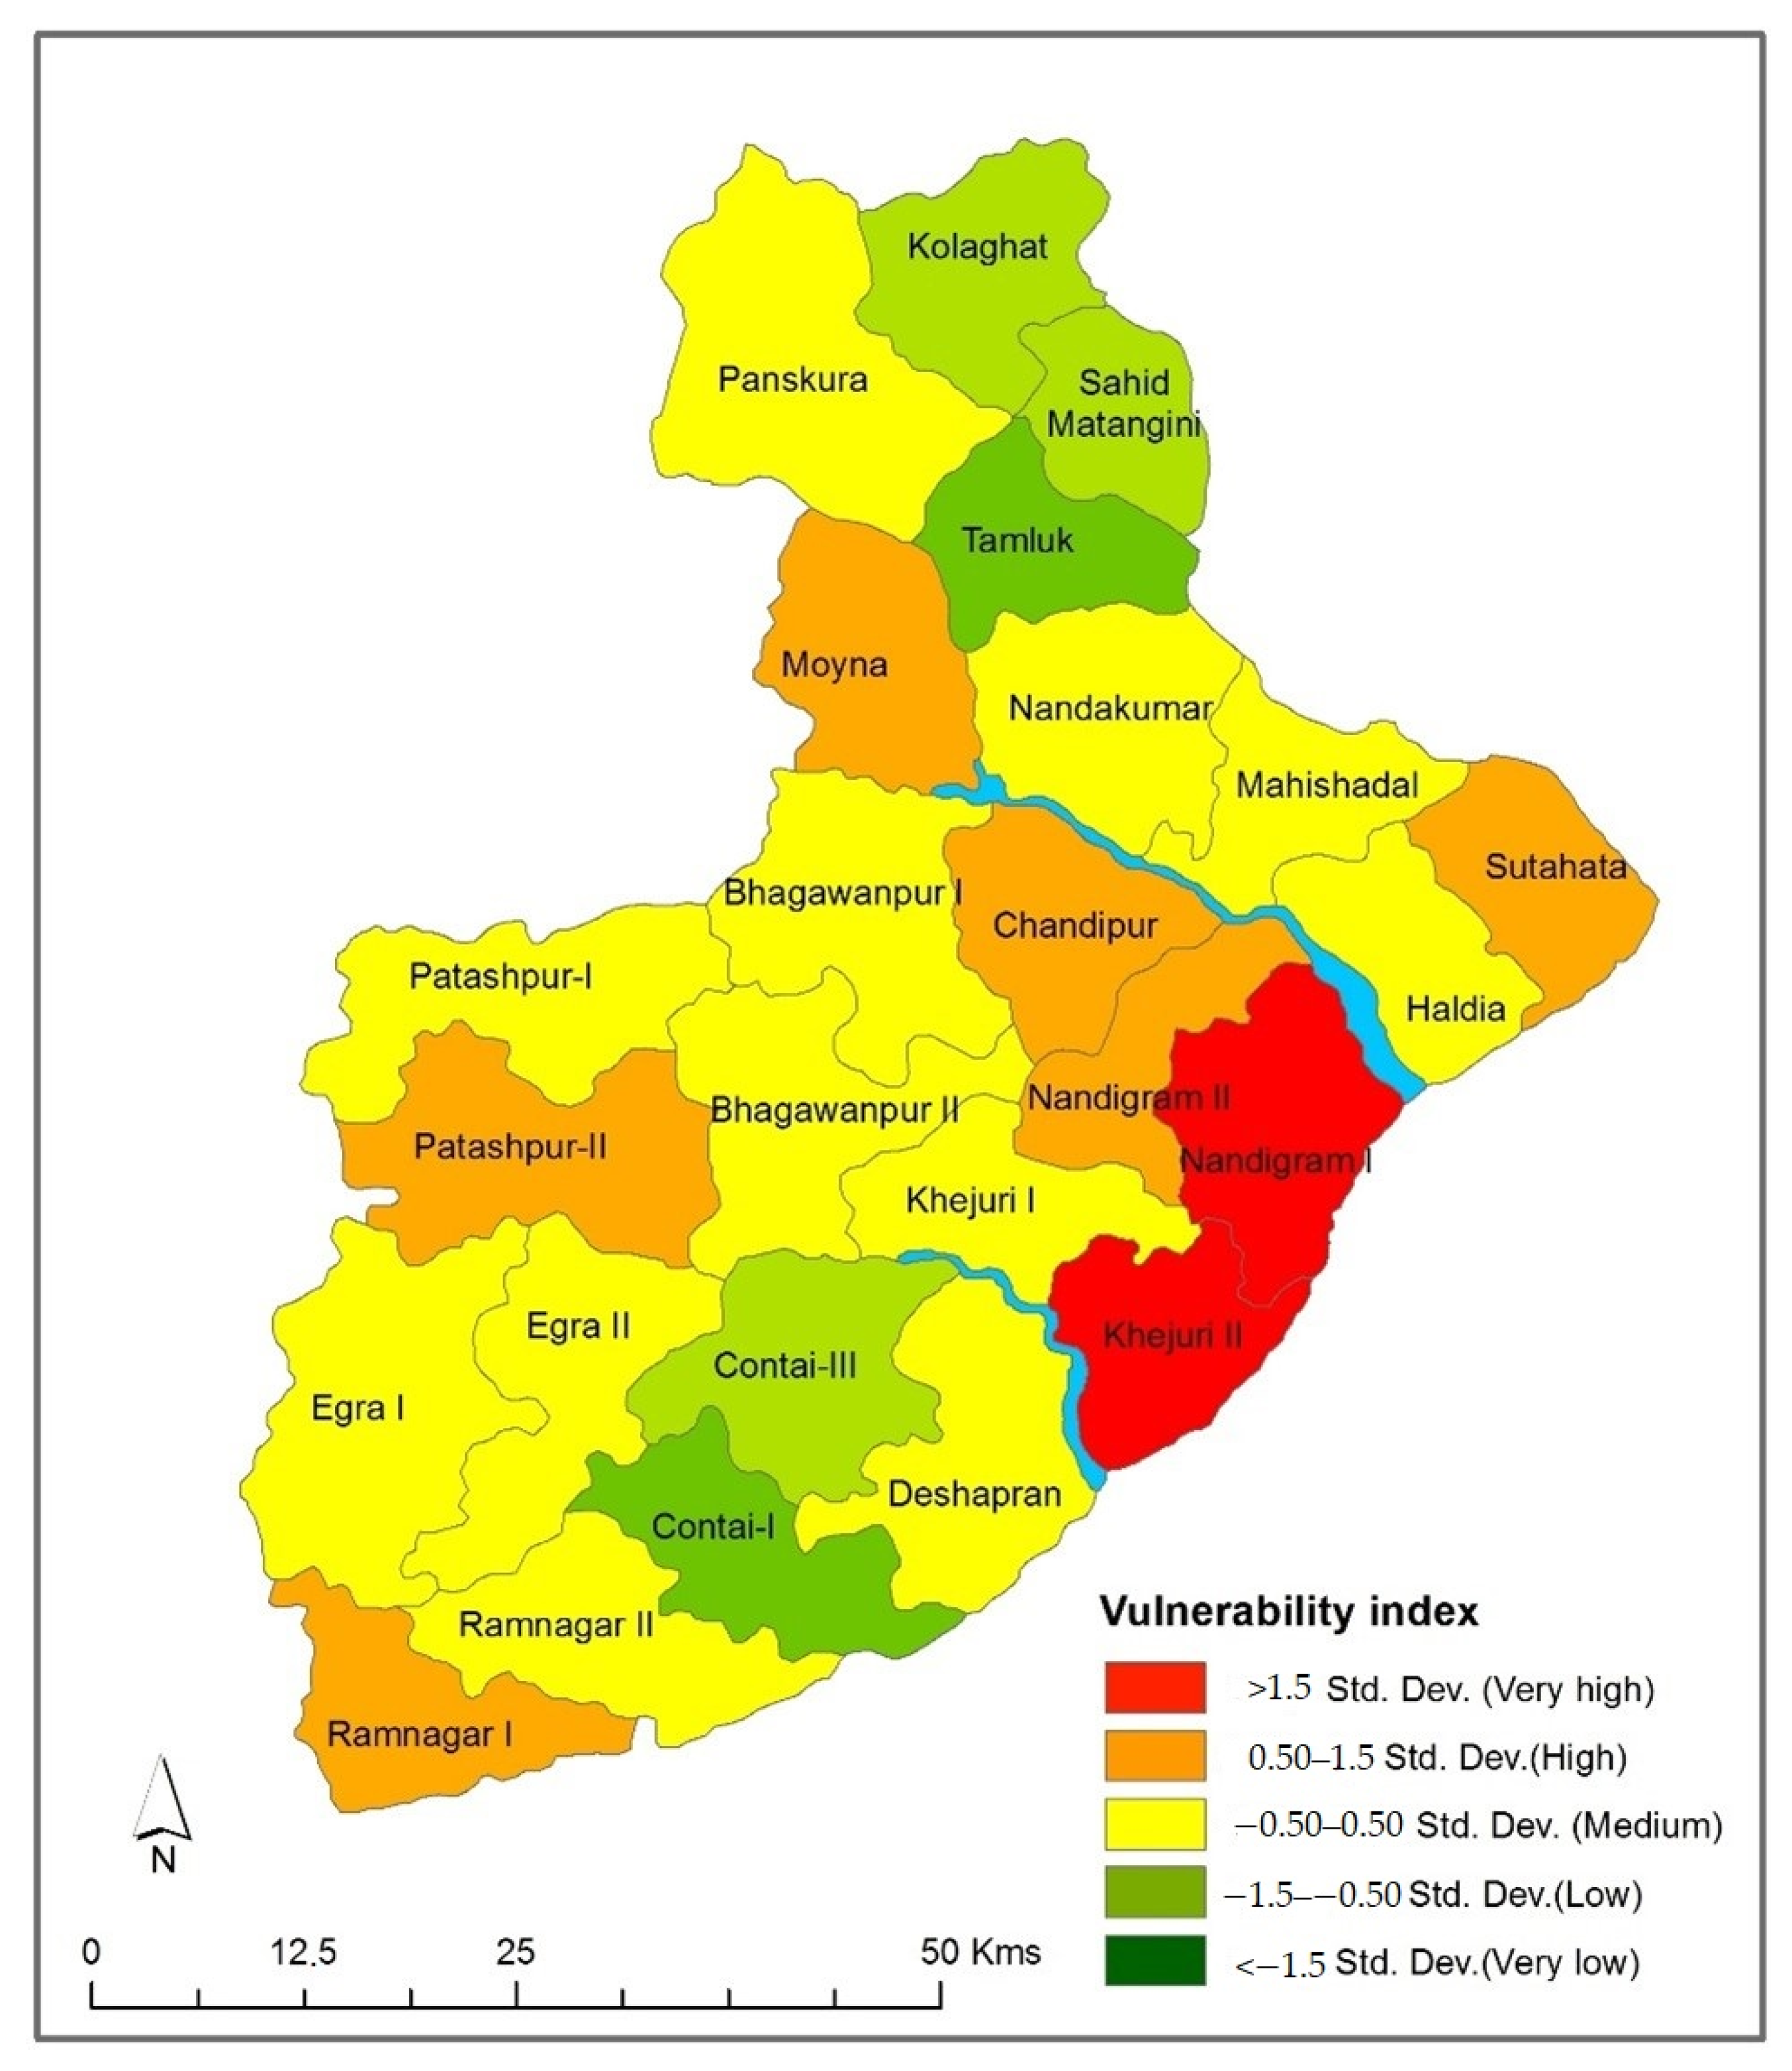
| Standard Deviation | Vulnerability Classes | Vulnerability Index |
|---|---|---|
| <−1.5 | Very low | 1 |
| −1.5–−0.50 | Low | 2 |
| −0.50–0.50 | Medium | 3 |
| 0.50–1.5 | High | 4 |
| >1.5 | Very high | 5 |
| Vulnerability Index | Hazard Index | ||||
|---|---|---|---|---|---|
| Very Low (1) | Low (2) | Medium (3) | High (4) | Very High (5) | |
| Very Low (1) | VL 1 × 1 = 1 | VL 1 × 2 = 2 | L 1 × 3 = 3 | L 1 × 4 = 4 | M 1 × 5 = 5 |
| Low (2) | VL 2 × 1 = 2 | L 2 × 2 = 4 | M 2 × 3 = 6 | M 2 × 4 = 8 | H 2 × 5 = 10 |
| Medium (3) | L 3 × 1 = 3 | M 3 × 2 = 6 | M 3 × 3 = 9 | H 3 × 4 = 12 | H 3 × 5 = 15 |
| High (4) | L 4 × 1 = 4 | M 4 × 2 = 8 | H 4 × 3 = 12 | H 4 × 4 = 16 | VH 4 × 5 = 20 |
| Very High (5) | M 5 × 1 = 5 | H 5 × 2 = 10 | H 5 × 3 = 15 | VH 5 × 4 = 20 | VH 5 × 5 = 25 |
| Component | Initial Eigenvalues | Extraction Sums of Squared Loadings | Rotation Sums of Squared Loadings | ||||||
|---|---|---|---|---|---|---|---|---|---|
| Total | % of Variance | Cumulative % | Total | % of Variance | Cumulative % | Total | % of Variance | Cumulative % | |
| 1 | 7.115 | 28.460 | 28.460 | 7.115 | 28.460 | 28.460 | 4.780 | 19.120 | 19.120 |
| 2 | 3.744 | 14.975 | 43.435 | 3.744 | 14.975 | 43.435 | 3.705 | 14.818 | 33.938 |
| 3 | 3.535 | 14.140 | 57.574 | 3.535 | 14.140 | 57.574 | 3.346 | 13.384 | 47.322 |
| 4 | 2.057 | 8.229 | 65.804 | 2.057 | 8.229 | 65.804 | 2.730 | 10.919 | 58.241 |
| 5 | 1.794 | 7.178 | 72.982 | 1.794 | 7.178 | 72.982 | 2.318 | 9.271 | 67.512 |
| 6 | 1.477 | 5.906 | 78.888 | 1.477 | 5.906 | 78.888 | 2.248 | 8.993 | 76.504 |
| 7 | 1.238 | 4.952 | 83.840 | 1.238 | 4.952 | 83.840 | 1.834 | 7.335 | 83.840 |
| 8 | 0.991 | 3.964 | 87.803 | ||||||
| 9 | 0.634 | 2.536 | 90.339 | ||||||
| 10 | 0.500 | 1.998 | 92.337 | ||||||
| 11 | 0.424 | 1.696 | 94.034 | ||||||
| 12 | 0.382 | 1.526 | 95.560 | ||||||
| 13 | 0.307 | 1.229 | 96.788 | ||||||
| 14 | 0.245 | 0.980 | 97.769 | ||||||
| 15 | 0.143 | 0.571 | 98.339 | ||||||
| 16 | 0.131 | 0.523 | 98.863 | ||||||
| 17 | 0.110 | 0.439 | 99.302 | ||||||
| 18 | 0.064 | 0.255 | 99.557 | ||||||
| 19 | 0.043 | 0.171 | 99.727 | ||||||
| 20 | 0.035 | 0.142 | 99.869 | ||||||
| 21 | 0.024 | 0.097 | 99.966 | ||||||
| 22 | 0.007 | 0.027 | 99.994 | ||||||
| 23 | 0.001 | 0.004 | 99.998 | ||||||
| 24 | 0.001 | 0.002 | 100.000 | ||||||
| 25 | −3.523 × 10⁻¹⁷ | −1.409 × 10⁻¹⁶ | 100.000 | ||||||
| Blocks | Fac1 | Fac2 | Fac3 | Fac4 | Fac5 | Fac6 | Fac7 | Total Vulnerability Score |
|---|---|---|---|---|---|---|---|---|
| Khejuri-II | 1.035 | 1.191 | 1.973 | 1.224 | 0.164 | 0.948 | 0.011 | 6.546 |
| Nandigram-I | 0.667 | 1.821 | 1.124 | 0.147 | 1.440 | −0.512 | −0.006 | 4.681 |
| Moyna | −1.213 | −1.489 | −0.212 | 0.364 | 1.424 | 1.257 | 1.934 | 2.065 |
| Chandipur | −0.527 | 0.598 | −0.172 | 0.218 | 1.173 | 0.701 | 0.058 | 2.048 |
| Ramnagar-I | 0.428 | 0.744 | 0.064 | 1.994 | −2.853 | 0.459 | 0.687 | 1.523 |
| Sutahata | −0.748 | 1.325 | 0.199 | −0.293 | 0.089 | −0.725 | 1.567 | 1.415 |
| Nandigram-II | −0.052 | 1.461 | −0.275 | 0.728 | 0.273 | 0.487 | −1.216 | 1.407 |
| Potashpur-II | 1.488 | −0.780 | 0.354 | −0.276 | 0.516 | 0.096 | −0.007 | 1.391 |
| Khejuri-I | 0.324 | 0.541 | −0.887 | 1.003 | 1.304 | −0.777 | −0.212 | 1.296 |
| Deshapran | 1.068 | 0.167 | −0.487 | 0.118 | 0.311 | −0.542 | 0.653 | 1.288 |
| Panskura | −0.565 | −0.978 | 1.670 | −0.204 | −0.618 | 0.987 | 0.507 | 0.798 |
| Bhagawanpur-II | 0.087 | −0.438 | −2.093 | 1.099 | 0.464 | 0.250 | 0.810 | 0.178 |
| Haldia | −0.217 | 1.551 | 0.044 | −3.093 | −0.674 | 1.684 | 0.518 | −0.189 |
| Nandakumar | −0.865 | −0.268 | 0.805 | −0.020 | 0.567 | 0.107 | −0.565 | −0.238 |
| Egra-I | 2.015 | −1.549 | 1.631 | −0.961 | −0.098 | −1.276 | −0.266 | −0.504 |
| Potashpur-I | 0.199 | −1.729 | −0.309 | 0.048 | −0.833 | 1.880 | 0.104 | −0.639 |
| Ramnagar-II | 1.054 | −0.183 | −1.021 | 0.125 | −1.078 | −0.128 | 0.373 | −0.858 |
| Egra-II | 1.072 | −1.087 | −0.318 | −0.368 | 0.901 | −1.155 | 0.046 | −0.909 |
| Bhagawanpur-I | −0.593 | −0.421 | −0.429 | −0.431 | 1.217 | 1.261 | −1.708 | −1.103 |
| Mahishadal | −0.530 | 0.282 | −0.126 | 0.058 | −0.451 | −0.384 | −0.064 | −1.215 |
| Sahid Matangini | −1.752 | −0.261 | −0.060 | 0.607 | −0.157 | −1.627 | 0.500 | −2.750 |
| Kolaghat | −1.212 | −0.543 | 0.919 | −0.023 | −0.962 | −1.260 | 0.185 | −2.896 |
| Contai-III | 0.433 | −0.138 | −1.161 | 0.288 | −0.800 | 0.430 | −2.603 | −3.552 |
| Contai-I | 0.301 | 0.557 | −1.763 | −1.986 | −0.743 | −1.058 | 0.534 | −4.158 |
| Tamluk | −1.898 | −0.374 | 0.529 | −0.364 | −0.577 | −1.102 | −1.842 | −5.628 |
Publisher’s Note: MDPI stays neutral with regard to jurisdictional claims in published maps and institutional affiliations. |
© 2022 by the authors. Licensee MDPI, Basel, Switzerland. This article is an open access article distributed under the terms and conditions of the Creative Commons Attribution (CC BY) license (https://creativecommons.org/licenses/by/4.0/).
Share and Cite
Gayen, S.; Villalta, I.V.; Haque, S.M. Flood Risk Assessment and Its Mapping in Purba Medinipur District, West Bengal, India. Water 2022, 14, 1049. https://doi.org/10.3390/w14071049
Gayen S, Villalta IV, Haque SM. Flood Risk Assessment and Its Mapping in Purba Medinipur District, West Bengal, India. Water. 2022; 14(7):1049. https://doi.org/10.3390/w14071049
Chicago/Turabian StyleGayen, Sumita, Ismael Vallejo Villalta, and Sk Mafizul Haque. 2022. "Flood Risk Assessment and Its Mapping in Purba Medinipur District, West Bengal, India" Water 14, no. 7: 1049. https://doi.org/10.3390/w14071049
APA StyleGayen, S., Villalta, I. V., & Haque, S. M. (2022). Flood Risk Assessment and Its Mapping in Purba Medinipur District, West Bengal, India. Water, 14(7), 1049. https://doi.org/10.3390/w14071049


