Article

Assessment of Fertilizer Quality in Horse Waste-Based Bokashi Fertilizer Formulations

by
Auwalu Garba Gashua
1,2,
Zulkefly Sulaiman
1,3,*,
Martini Mohammad Yusoff
1,
Mohd Yusoff Abd Samad
3,4,
Mohd Fauzi Ramlan
1 and
Monsuru Adekunle Salisu
5
1
Department of Crop Science, Faculty of Agriculture, Universiti Putra Malaysia, Serdang 43400, Malaysia
2
Department of Agronomy, Faculty of Agriculture, Federal University Gashua, Gashua 631101, Nigeria
3
Institute Plantation Studies, University Putra Malaysia, Serdang 43400, Malaysia
4
Department of Land Management, Faculty of Agriculture, Universiti Putra Malaysia, Serdang 43400, Malaysia
5
Department of Agricultural Science, Faculty of Technical and Vocational, Sultan Idris Education University, Tanjong Malim 35900, Malaysia
*
Author to whom correspondence should be addressed.
Agronomy 2022, 12(4), 937; https://doi.org/10.3390/agronomy12040937
Submission received: 8 February 2022 / Revised: 25 March 2022 / Accepted: 27 March 2022 / Published: 14 April 2022
(This article belongs to the Section Soil and Plant Nutrition)

Abstract

:
Agricultural waste is a type of solid waste that needs to be managed properly. Organic waste can be recycled to produce bokashi fertilizer, which can be used to improve soil health, increase crop production, and sanitize the environment. However, it may contain heavy metals that could be toxic to plants and can pollute the environment if not properly decomposed. This study was designed to evaluate the fertilizer quality of six different bokashi fertilizer ratios (bfrs) over seven- and thirty-day maturation periods. The raw materials used include horse bedding waste (HBW), cow dung (CD), and paddy husk charcoal (PHC) in different ratios, treated with an effective microorganisms (EM4) solution. All the nutrients studied (N, P, K, Mg, and Ca) were significantly affected by the bokashi fertilizer ratios (bfrs). The best bokashi fertilizer ratio was bokashi fertilizer ratio-6 (bfr6), but it was statistically similar to bokashi fertilizer ratio-5 (bfr5). Its N, P, K, Mg, and Ca contents were higher than the control (bfr1) by 133.9%, 225.5%, 196.4%, 105.0%, and 84.7%, respectively. Similarly, all these nutrients were significantly affected by time. N, P, K, and Mg increased by 21.2, 33.0%, 16.4%, and 28.8%, respectively, after 30 days of maturation, with a decrease in Ca only 2.4%, which was not significant A germination index (GI) of 90.1% was obtained using cabbage seeds. The heavy metals result and germination bioassay confirmed the safety and maturity of the bokashi fertilizer. In conclusion, the results revealed that good-quality bokashi fertilizer can be produced within 30 days. Bfrr5 and bfr6 are equally good candidates for producing good-quality bokashi fertilizer for effective crop growth.

1. Introduction

Continued reliance on chemical fertilizers is discouraged in present day agriculture, especially in organic farming. This may be related to the environmental hazards associated with the continued and prolonged use of inorganic fertilizers. Intensification of agricultural production activities, characterized by the continued use of synthetic chemicals, has resulted in a decline in soil quality and the generation of wastes that are capable of causing environmental pollution, with the soil biota negatively affected [1,2]. Developing countries such as Malaysia face problems of waste management in both urban and rural areas [3]. A report in 2017 by a Malaysian government agency -Solid Waste Corporation (SWcorp) in charge of the management of solid waste indicated that the country produced 38,000 tons of waste daily [4], with University Putra Malaysia generating more than 2000 tons of waste daily from horse bedding waste (HBW). This waste, if not properly managed, may have a long-term negative consequence on soil and the environment in general. The waste can be recycled and utilized as an organic fertilizer, with a view to reducing the use of costly chemical fertilizers that are, in most cases, beyond the reach of the average farmer [5,6]. A sound organic waste management strategy that seeks to employ organic waste residues to produce organic, ecofriendly fertilizers such as bokashi fertilizers is, therefore, desirable. Organic fertilizers help to purify the ecosystem and increase crop productivity [7]. In an attempt to boost soil fertility, traditional organic farmers apply organic sources to cultivate crops. The time it takes for the added materials to decompose and then release nutrients for plant use is normally long, necessitating the use of an effective microorganism (EM) solution to accelerate the release of nutrients. According to Olle and Williams [8], the success of adding EM to organic matter is determined by the EM’s ability to decompose organic material and release nutrients for plant use within the shortest time possible. The use of effective microorganism-4 (EM-4), for instance, can facilitate the decomposition of organic waste materials very fast, within one or two weeks [6]. The quantity required to cause the desired effect is so small that it can easily be employed in a conventional organic farming system. The use of microbial inoculants has been shown to increase the mineralization of organic materials [9,10]. Bokashi fertilizer is the product of fermented organic material that is stocked with effective microorganisms [11]. Bokashi fertilizers contain beneficial microbes that can make nutrients available to plants [12].
Based on the method of processing, bokashi fertilizer is of two types: aerobic, produced under high-temperature fermentation in the presence of air, or anaerobic, fermented under a considerably low temperature within closed containers. Normally, aerobic bokashi is used, although the use of anaerobic bokashi is also gaining popularity in organic farming [13]. The recipes for bokashi may include agro-industrial residues such as flours and/or bran, together with animal manures, which are treated with an effective microbial solution that is rich in aerobic and anaerobic microorganisms, which facilitates the aerobic decomposition and enzymatic fermentation of organic matter [14]. The raw materials used and the type or source of inoculants vary between farmers, and from one region to another. For instance, the USA has a way of preparing bokashi fertilizer that is different from the rest of the world. In the USA, bokashi fertilizer is prepared using food waste in a two-part process. An EM-1 inoculant is first added to molasses and water, then mixed with rice or wheat bran. This is the source of inoculum and is similar to the ones prepared and sold by U.S. companies. This inoculated bran is then added to food waste in a covered container and allowed to ferment for 14 days or more. After this period, the bokashi is applied to the soil, where decomposition in the second phase occurs, also usually within another 14 days, after which crops can be sown [15].
In different parts of the world, the process is different in terms of methods and materials. Bokashi is mostly prepared using agricultural waste. In Japan, rice bran, rapeseed mill cake, rice husk, and by-products from fish processing are used as raw materials and EM-1 as an inoculum source [16]. In Indonesia, the raw materials used include goat manure, Azolla, ordinary bran, molasses, and fermented tubers, with EM4 and yeast as inoculum sources [17]. In Spain, the raw materials used include horse manure, chicken manure, wood ash, biochar, wheat straw, and molasses, with topsoil and commercial yeast as inoculum sources [2]. In Mexico, sheep manure and sugarcane molasses are used as raw materials, with yeast as an inoculum sources [18]. In Brazil, organic compost made from bovine manure and plant residues, rice bran, wood shavings, and molasses, with EM as an inoculum source, is used [19]. In Egypt, rice bran, animal manure, food waste, and molasses, with EM as an inoculum source, are used [20]. Therefore, the raw materials used for making bokashi fertilizer may differ in terms of both composition and processing time [21].
Bokashi fertilizer is becoming popular because of its desirable physical and chemical properties. Several studies have reported that bokashi fertilizers have improved the physicochemical and microbiological properties of soils [5,6,7]. Soils with poor physical properties, such as high clay content, may have slow drainage and insufficient oxygen for the needs of soil microflora and plant roots. This has a significant impact on plant nutrient utilization efficiency [22]. Crops in the tropics, such as those in Malaysia, face challenges because they are grown in ultisols and oxisols, which have a low cation exchange capacity and low nutrient concentrations [23]. Bokashi fertilizers have been known to improve the growth, yield, and quality of many crops [8,9,10]. Therefore, bokashi fertilizer is becoming popular in sustainable crop production.
There has been no adequate research to compare the effects of different bokashi fertilizer ratios on the chemical properties (nutritional composition), nor have there been any studies describing the effects of processing/maturation time on the nutritional composition of bokashi fertilizers [24]). In addition, horse manure, alone or in combination with cow dung, has not been proven to be a popular source of good fertilizer. It has been estimated that over 70 tons of horse bedding waste are produced every month at University Putra Malaysia (UPM), posing a threat to the immediate environment. The disposal of agricultural waste is becoming an issue of great concern due to environmental pollution [25]. Agricultural wastes such as manure and crop residues are, in most cases, reusable [26]; they can be recycled to produce other useful products such as organic fertilizers that can enrich soils, improve plant productivity, and safeguard the environment. One good approach to managing agricultural waste is to convert it into organic fertilizer (such as bokashi fertilizer) [27].
Bokashi fertilizer, as an organic soil amendment, could provide crops with the nutrients needed for their growth, as well as maintain the soil health status. However, such soil amendments might contain toxic substances such as heavy metals that are capable of inhibiting crop growth and yield [28]. Heavy metals (pollutants) constitute chemical parameters that need to be investigated and analyzed to test the level of compost maturity [29]. Heavy metal-enriched plants are also harmful to humans if consumed [30,31]. It is, therefore, important to evaluate the phytotoxicity of this bokashi fertilizer amendment before its application to agricultural soils. Therefore, the objective of this study was to assess the fertilizer quality in six different horse waste-based bokashi fertilizer ratios (bfrs) during two processing/maturation periods. To achieve this, the chemical properties (in terms of nutrients and heavy metal contents) of the bokashi fertilizer ratios were assessed for seven- and 30-day maturation periods. Two physical properties that are related to fertility were also assessed after 30 days. One of the best bokashi fertilizers was also used to carry out seed germination bioassay tests. This was to ensure the bokashi fertilizer was mature, safe, and enriched with adequate nutrients to improve soil health, crop growth, and yield.

2. Materials and Methods

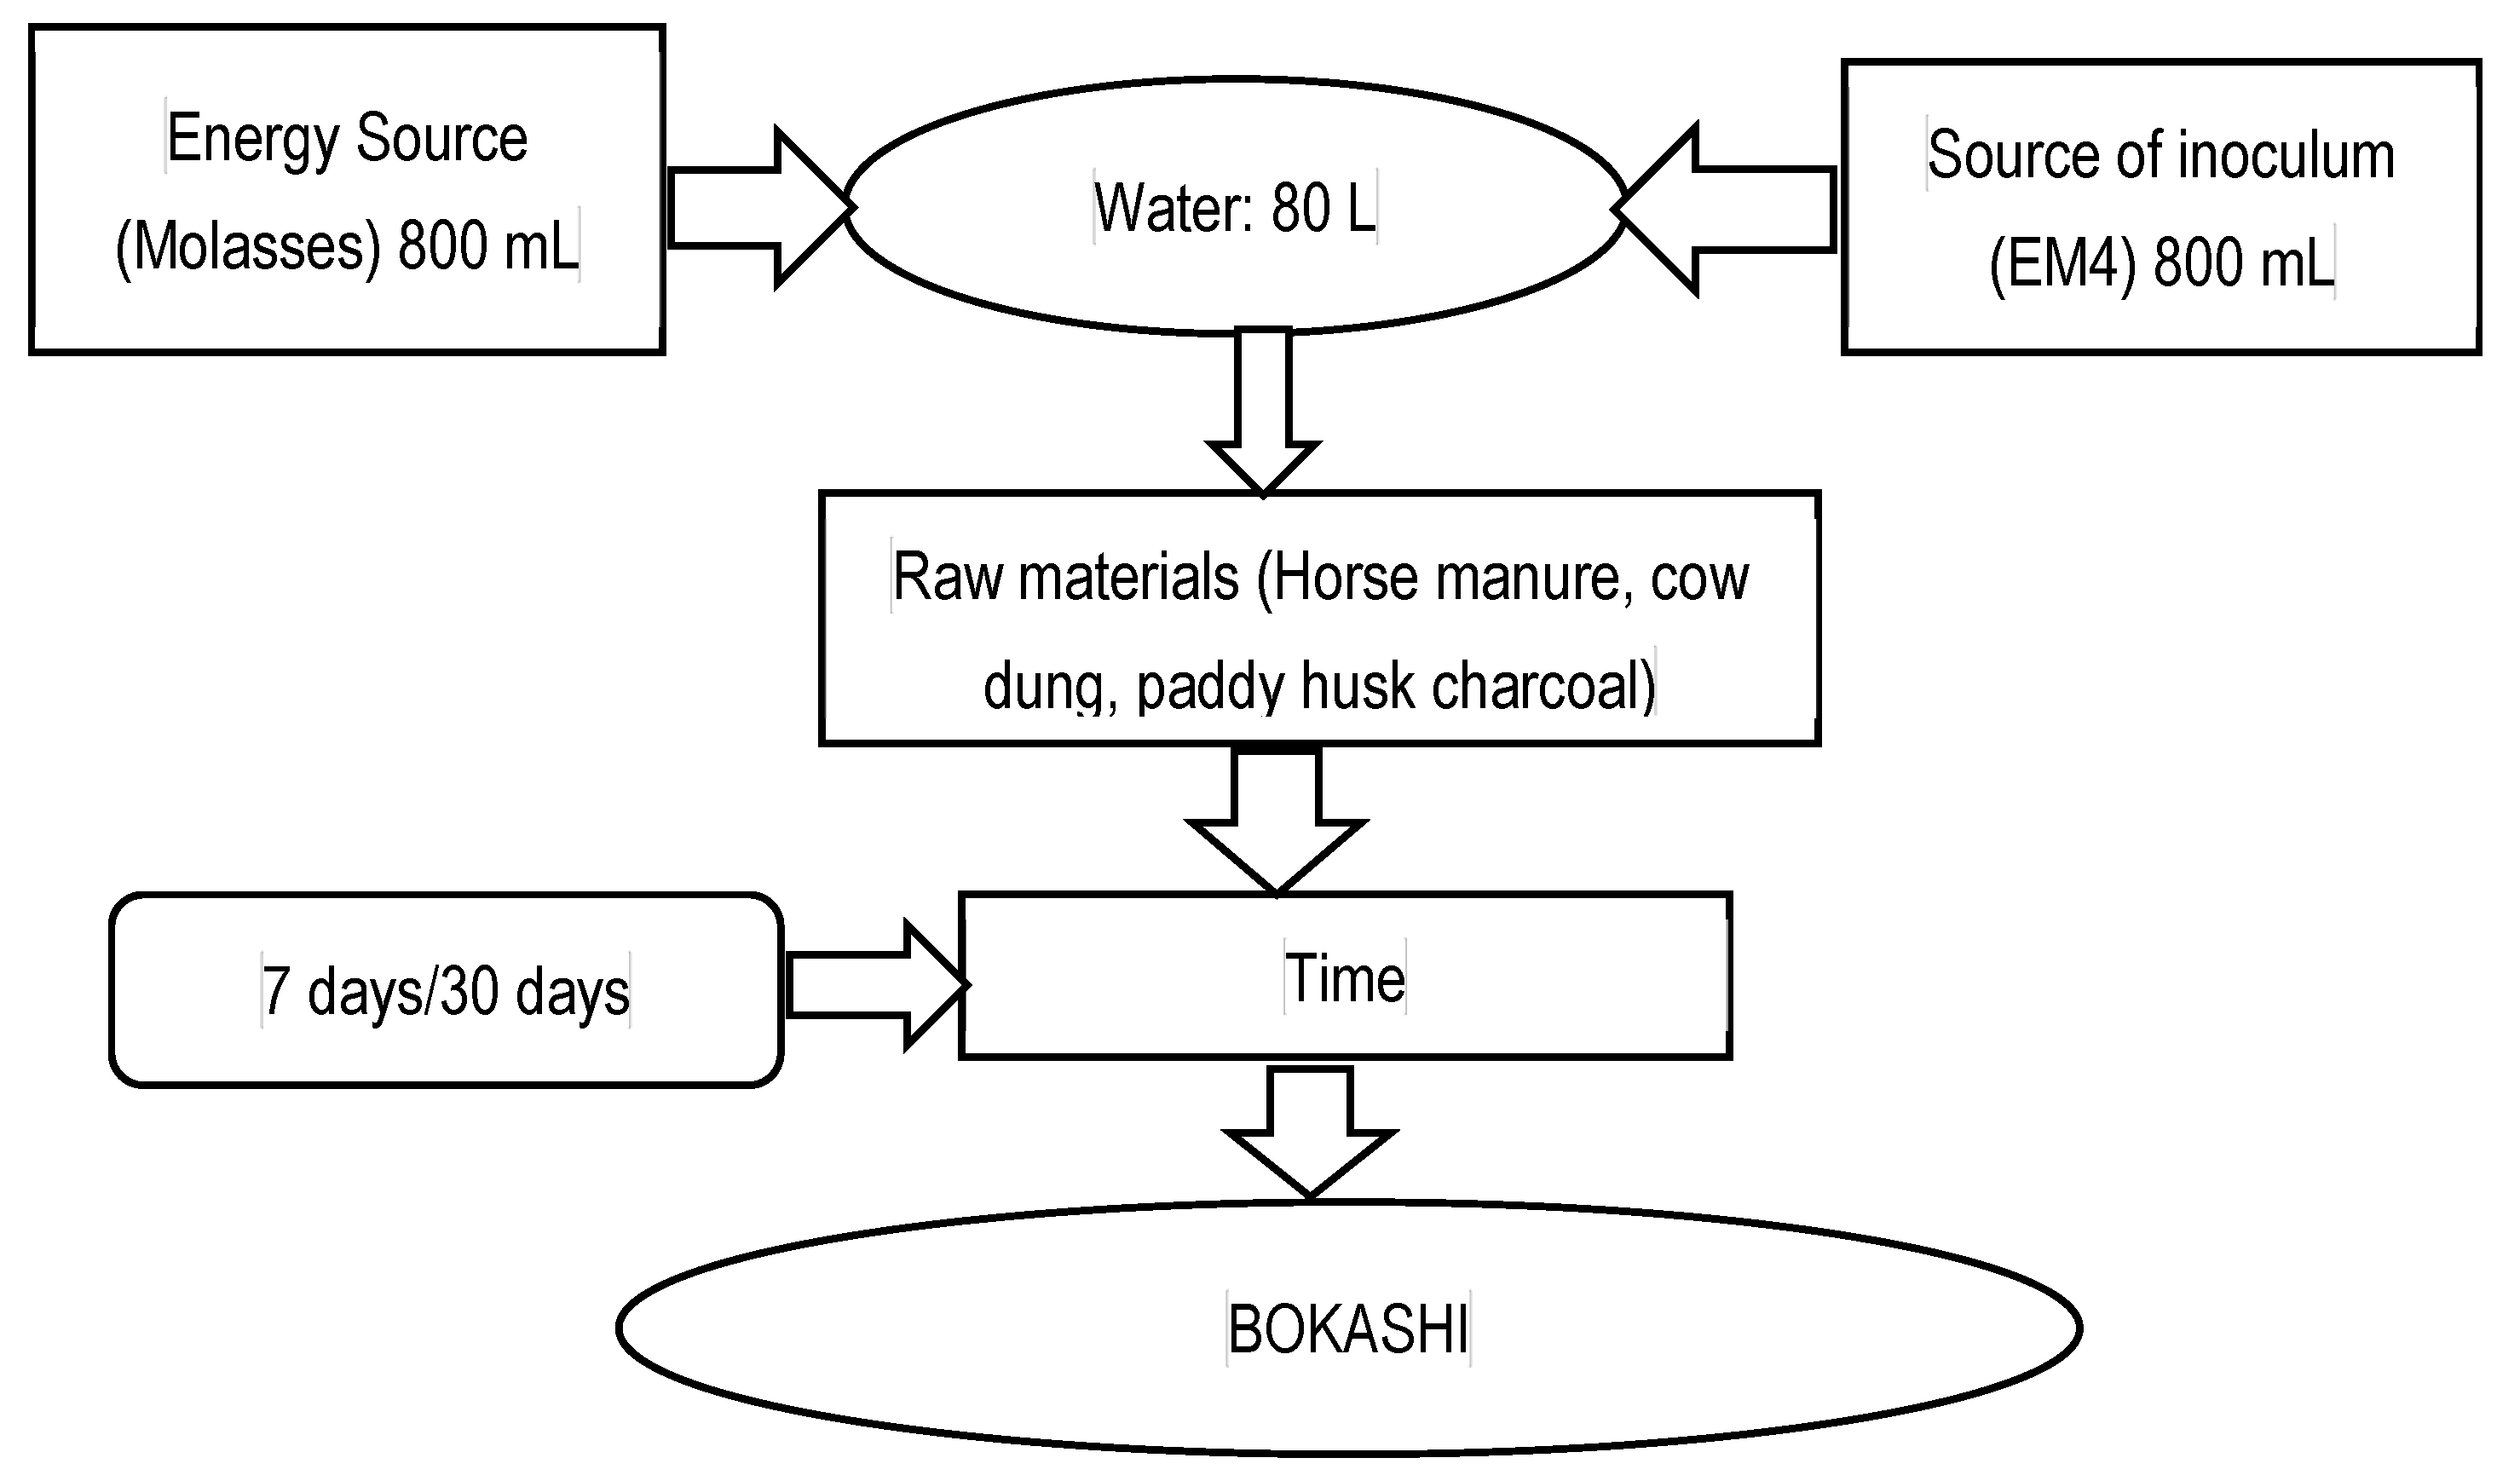
2.1. Materials Used, Their Sources, and the Bokashi Fertilizer Preparation

The organic materials used were HBW collected from the UPM Equine unit, cow dung (together with molasses) obtained from the animal section, Field 14, UPM, and PHC from a rice field in Kuala Selangor. The effective microorganism (EM4) solution was sourced from Indonesia. Other items used were airtight plastic drums, a 3 L plastic bowl, watering cans, 7.62 cm perforated plastic PVC pipes of 1 m length each, water, 50 kg sacks, and a mixing shovel.

2.2. Bokashi Preparation

The EM4 solution was prepared as reported by Lasmini et al. [11] but with slight modifications. First, 800 mL of EM4 solution and another 800 mL of molasses were measured and placed in a drum containing 80 L of non-chlorinated water. This was allowed to incubate for seven days. The raw (organic) materials were measured using a 3 L plastic bowl during the formulation procedure, with each treatment making up to 100% by volume. Each treatment was thoroughly mixed and sprayed with 4 L of fermented EM4 solution, followed by the addition of water until the materials formed a ball-like structure when compressed by hand, and no water came out using the method described as the “ball test” [24]. This was attained when the water content reached ~35%. The prepared mixture was then transferred to a double-bagged sack with a perforated PVC pipe inserted vertically in the center to provide the aeration required during the first few days of bokashi processing. This was kept tightly sealed and in the shade [32] for four days before opening. After four days, it was opened and we allowed the process to continue under aerobic conditions for seven days (time 1) and 30 days (time 2). Samples were collected for chemical analysis after seven and 30 days of maturation. In summary, each bokashi fertilizer ratio consisted of ‘x’ number of a filled 3-L plastic bowl, +4 L stock solution of incubated EM4 solution + water (the quantity varied). For example, for bfr1, the ratio was (8:0:2)x of (HBW:CD:PHC), respectively) + 4 L EM4 solution + water, with ‘x’ always =10%. Bfr5 = (6:2:2)x of (HBW:CD:PHC, respectively) + 4 L EM4 solution + water. Note: The EM4 contained as follows in Table 1.
Some of the materials used in making the bokashi fertilizer are shown in Figure 1.
An illustration showing the summary of the raw materials used and the duration of bokashi maturation is given in Figure 2.

2.3. Location and Layout of the Experiment

This experiment was carried out at field 14, University Putra Malaysia (2°98′1.0″ N 101°72′94.1″ E), on 24 December 2019. The experiment was a two-factorial arrangement of treatments under completely randomized design (CRD) with three replications. Factor A was the bokashi fertilizer ratio (six levels), and factor B was the maturation time (seven or 30 days).

2.4. Physical Analysis of the Bokashi Fertilizer

Data were collected on bulk density (BD) using the core ring method [33] after 30 days of bokashi fertilizer maturation. Similarly, at the end of 30 days of bokashi fertilizer maturation, a visual and sensory assessment of the color and texture of the bokashi fertilizer was carried out [34].
Bulk density was obtained using the following equation:
BD = mass volume ( g   cm 3 )

2.5. Chemical Analysis of the Bokashi Fertilizer

To determine the pH in a laboratory, the bokashi was measured in a 1:2.5 (v/v) bokashi–water suspension and determined using a pH meter (Model HANNA HI 2211 pH/ORP meter, Woonsocket, RI, USA). The EC was determined in a 1:5 (v/v) bokashi–water suspension using an EC meter (Model HANNA EC/TDS/NaCl meter, Woonsocket, RI, USA). Total C, N, and CN ratios were determined from the dried sample through the combustion (DUMAS) method and analyzed using a TRUMAC CN Analyzer, USA. Total P was obtained through the dry ashing method and its concentration in solution was analyzed using an auto-analyzer (QuikChem 8000 Series FIA System, Lachat Instruments, Milwaukee, WI, USA). Exchangeable bases (Ca, Mg, K, and Na) and cation exchange capacity (CEC) were determined by the leaching method [35] in 1 N ammonium acetate (pH 7), with CEC analyzed using an auto-analyzer and Ca, Mg, K, and Na using an atomic absorption spectrophotometer (AAS). The Walkley–Black method was used to determine the organic matter content [36]. The heavy metals were determined by the dry ashing method, as described by Jones [37].

2.6. The Seed Germination Bioassay

The bokashi fertilizer ratio (bfr5) after 30 days of maturation period was selected for the germination bioassay test. For the process of extraction, 50 g of well-dried bokashi was dissolved in 500 mL distilled water (1:10 w/v) [28]. The bokashi–water mixture was shaken for 6 h on a mechanical shaker. The resultant bokashi tea was sieved through a double-layer muslin cloth, then centrifuged at 6000 rpm at 20 °C for 15 min. The supernatant solution was then diluted with deionized water to make 100%, 75%, 50%, 25%, and 0% extracts of the supernatant [38]. Cabbage seeds (Giant, Green World, Kuala Lumpur, Malaysia) were used. Five Petri dishes (9 cm) each were lined with quality filter paper. To each dish, 4 mL of the appropriate treatment extract was added, while the control received 4 mL distilled water [28]. Ten seeds were sown on each petri dish and replicated five times per treatment. The seeds were incubated in the dark at 25 °C for 72 h. The number of germinated seeds (G) was counted, and the length of the radicle (L) was measured. The germination index was given by (Gi) = (G/Go × L/Lo) × 100, where G and L are the total number of germinated seeds and the average radicle length from the bokashi extract, respectively, and Go and Lo are the respective total number of seeds germinated and average radicle length acquired from the control (distilled water) [29,38]. Therefore, the global germination index (GI) is the mean of the Gi of 50% and Gi of 75% extract dilutions [38].
G i 50 % = ( ( w a ) × ( y b ) ) × 100  
G i 75 % = ( ( x a ) × ( z b ) ) × 100
G I = ( G i 50 % + G i 75 % ) 2  
where
  • w/a = relative seed germination (RSG) in 50% bokashi extract,
  • x/a = relative seed germination (RSG) in 75% bokashi extract,
  • y/b = relative radicle growth (RRG) in 50% bokashi extract,
  • z/b = relative radicle growth (RRG) in 75% bokashi extract.

2.7. Statistical Analysis

The data were analyzed using analysis of variance (ANOVA) of SAS software, 9.4 version (SAS Institute, Cary, NC, USA). Significant differences between the treatment means were compared using Tukey’s HSD at 5%.

3. Results

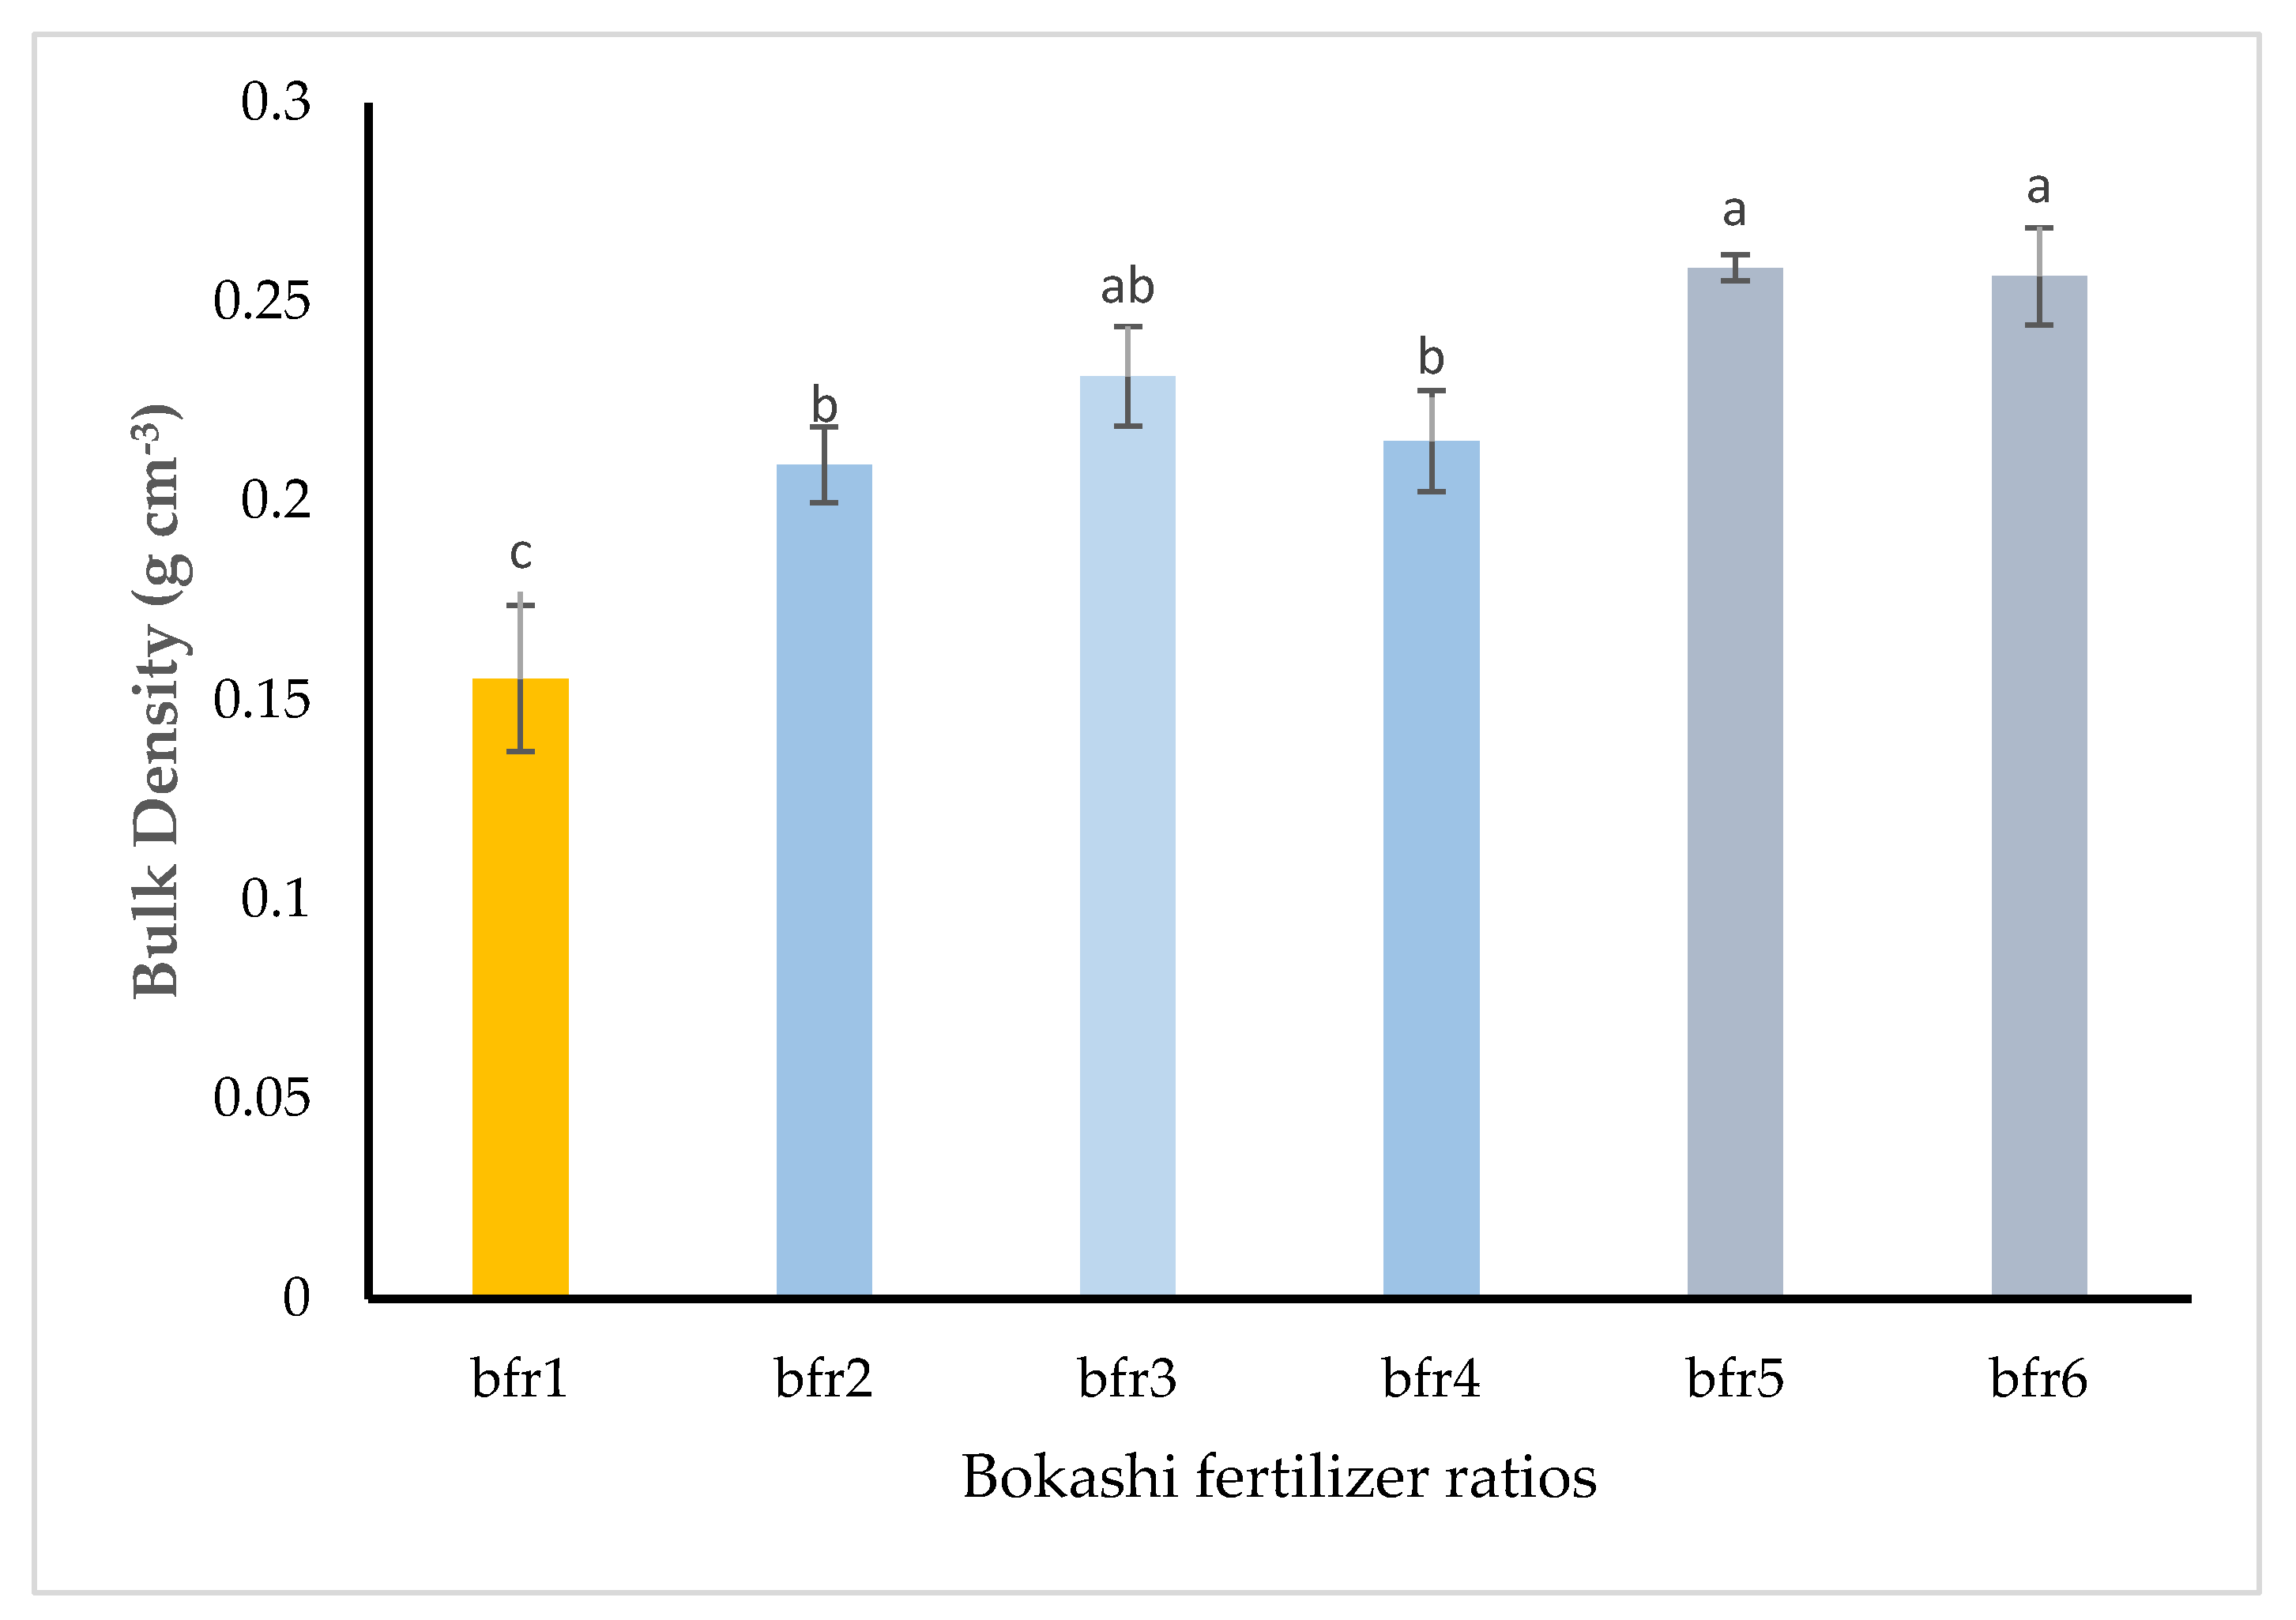
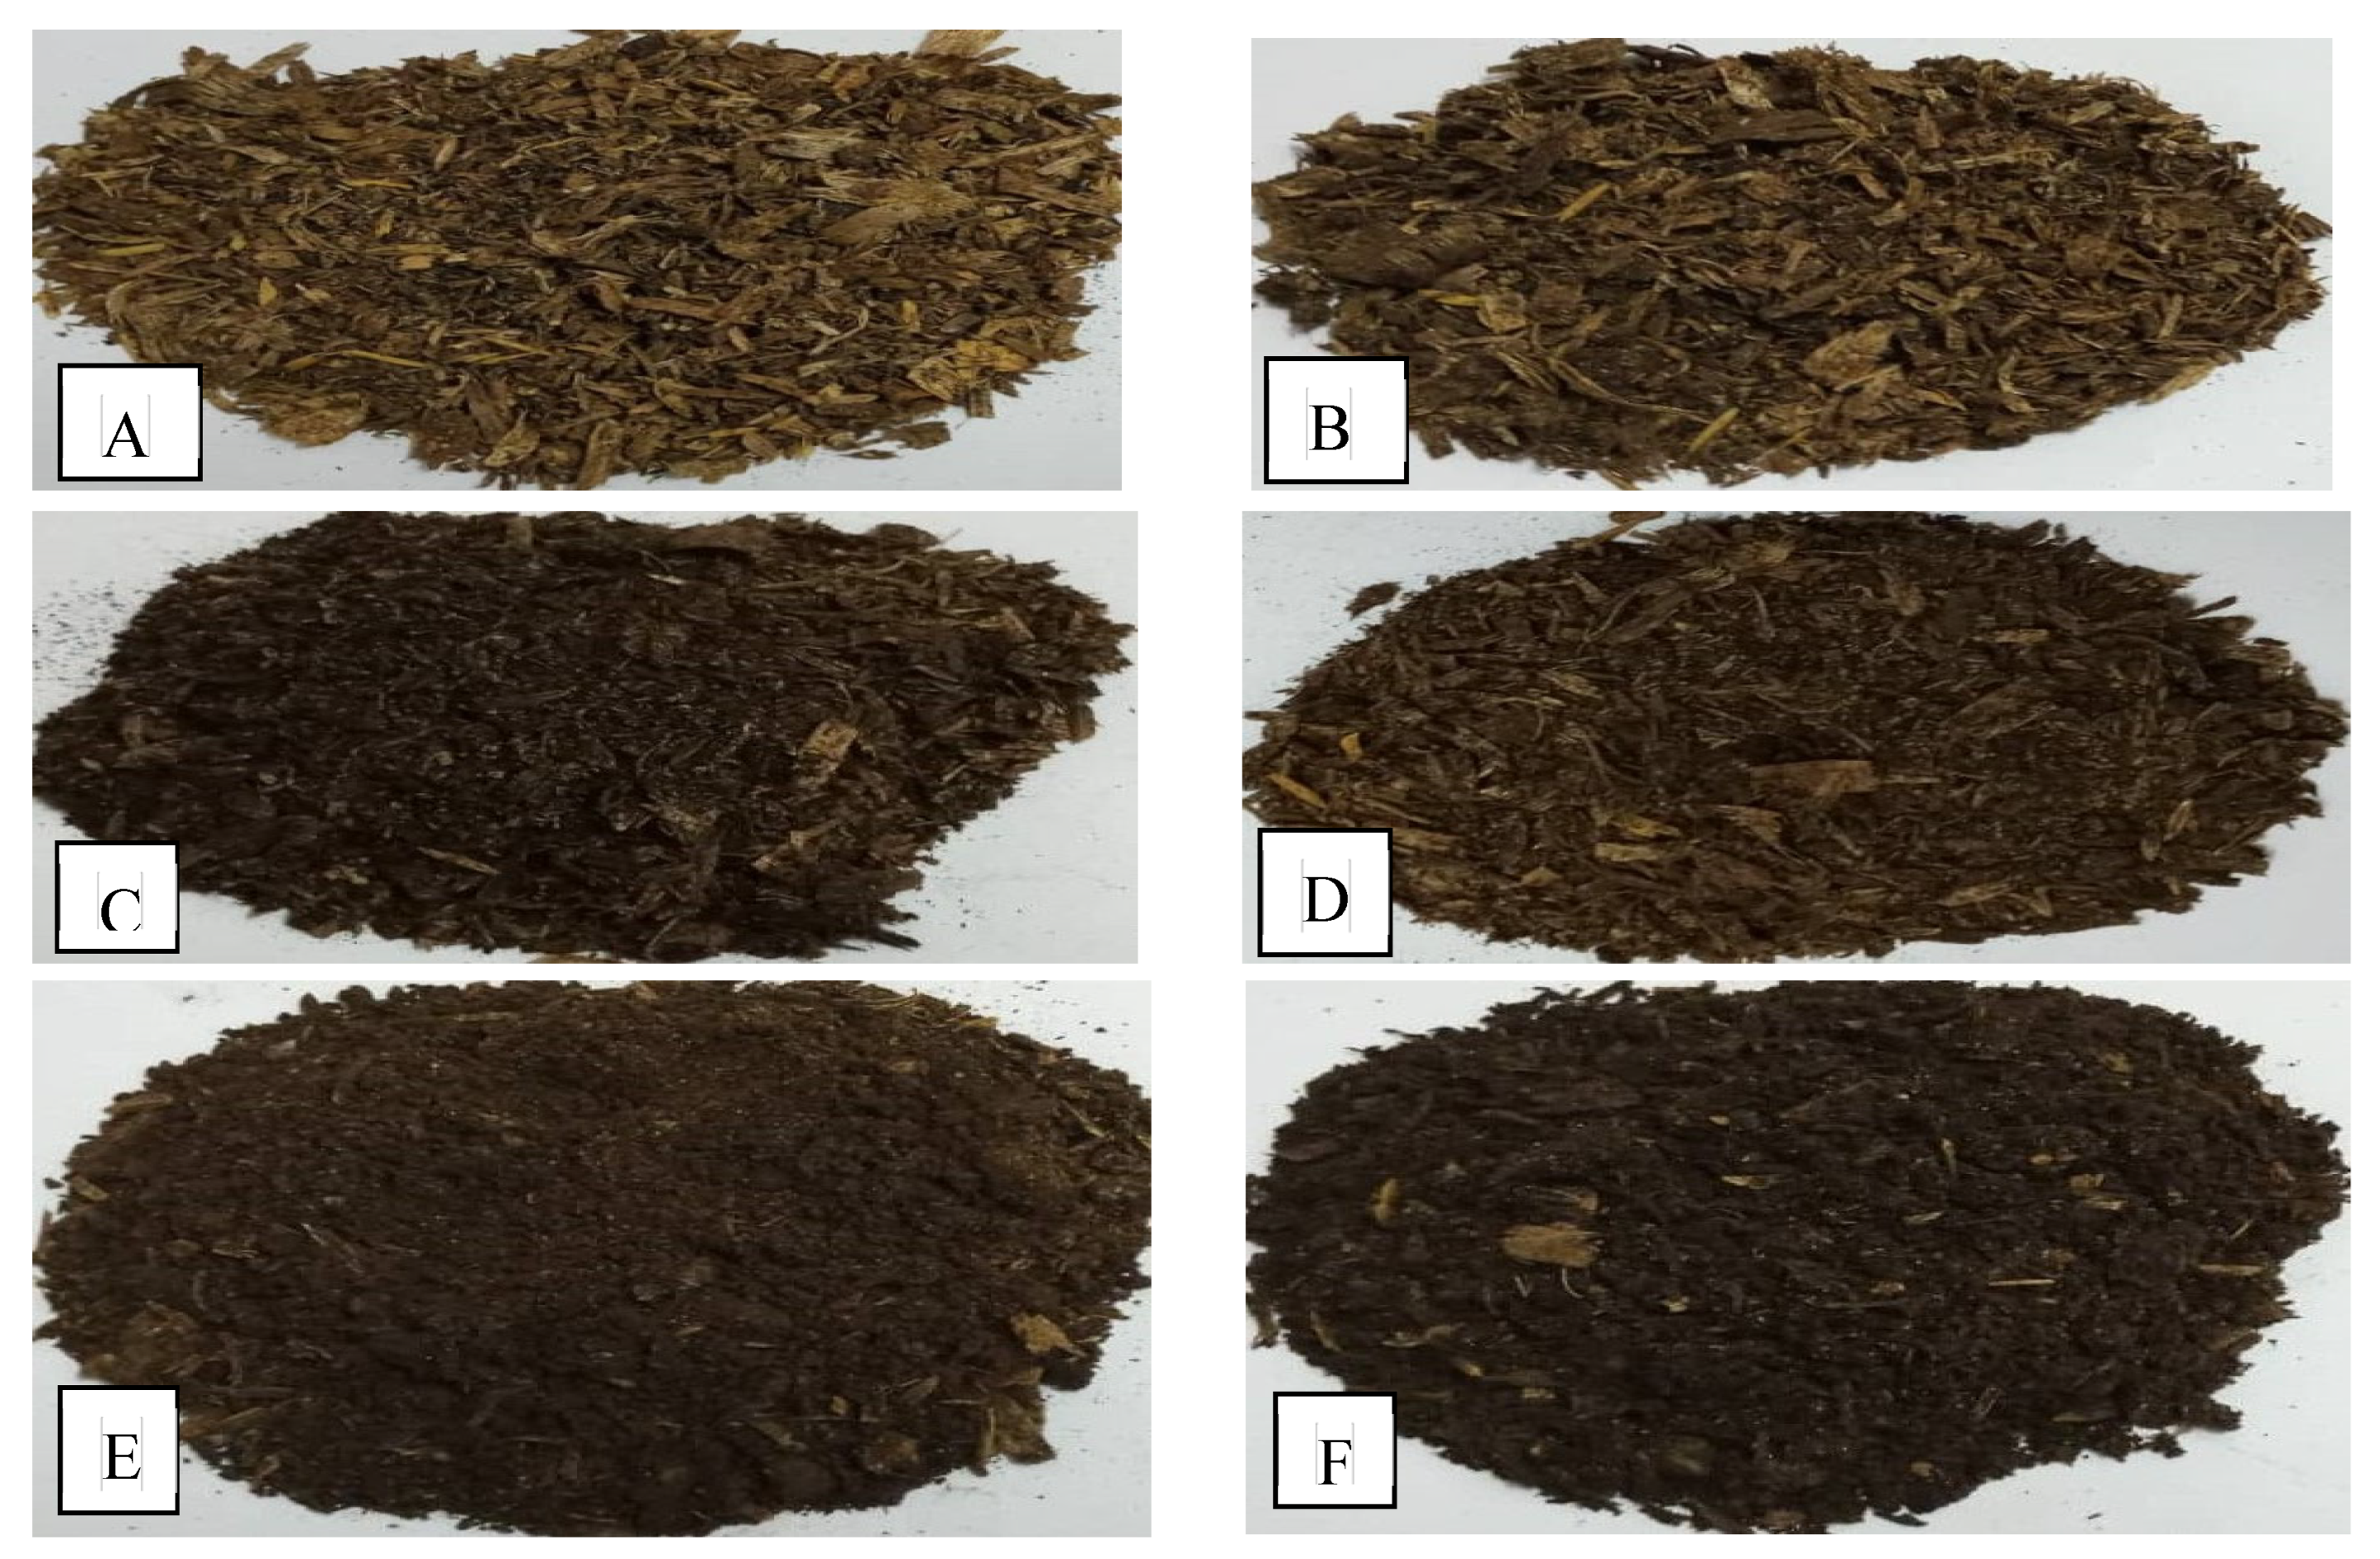
3.1. Physical Properties of Bokashi Fertilizer Ratios

The bulk density (BD) of different bokashi fertilizer ratios was significantly different (Figure 3). The highest BD values were obtained from bfr5 and bfr6 (0.26 g cm−3 each), whereas the control (bfr1) had the lowest BD value of 0.16 g cm−3. Different bokashi fertilizer ratios showed different textures and colors, ranging from coarse yellowish-brown (bfr1) to a fine and degraded dark brown material (bfr5 and bfr6) (Figure 4).

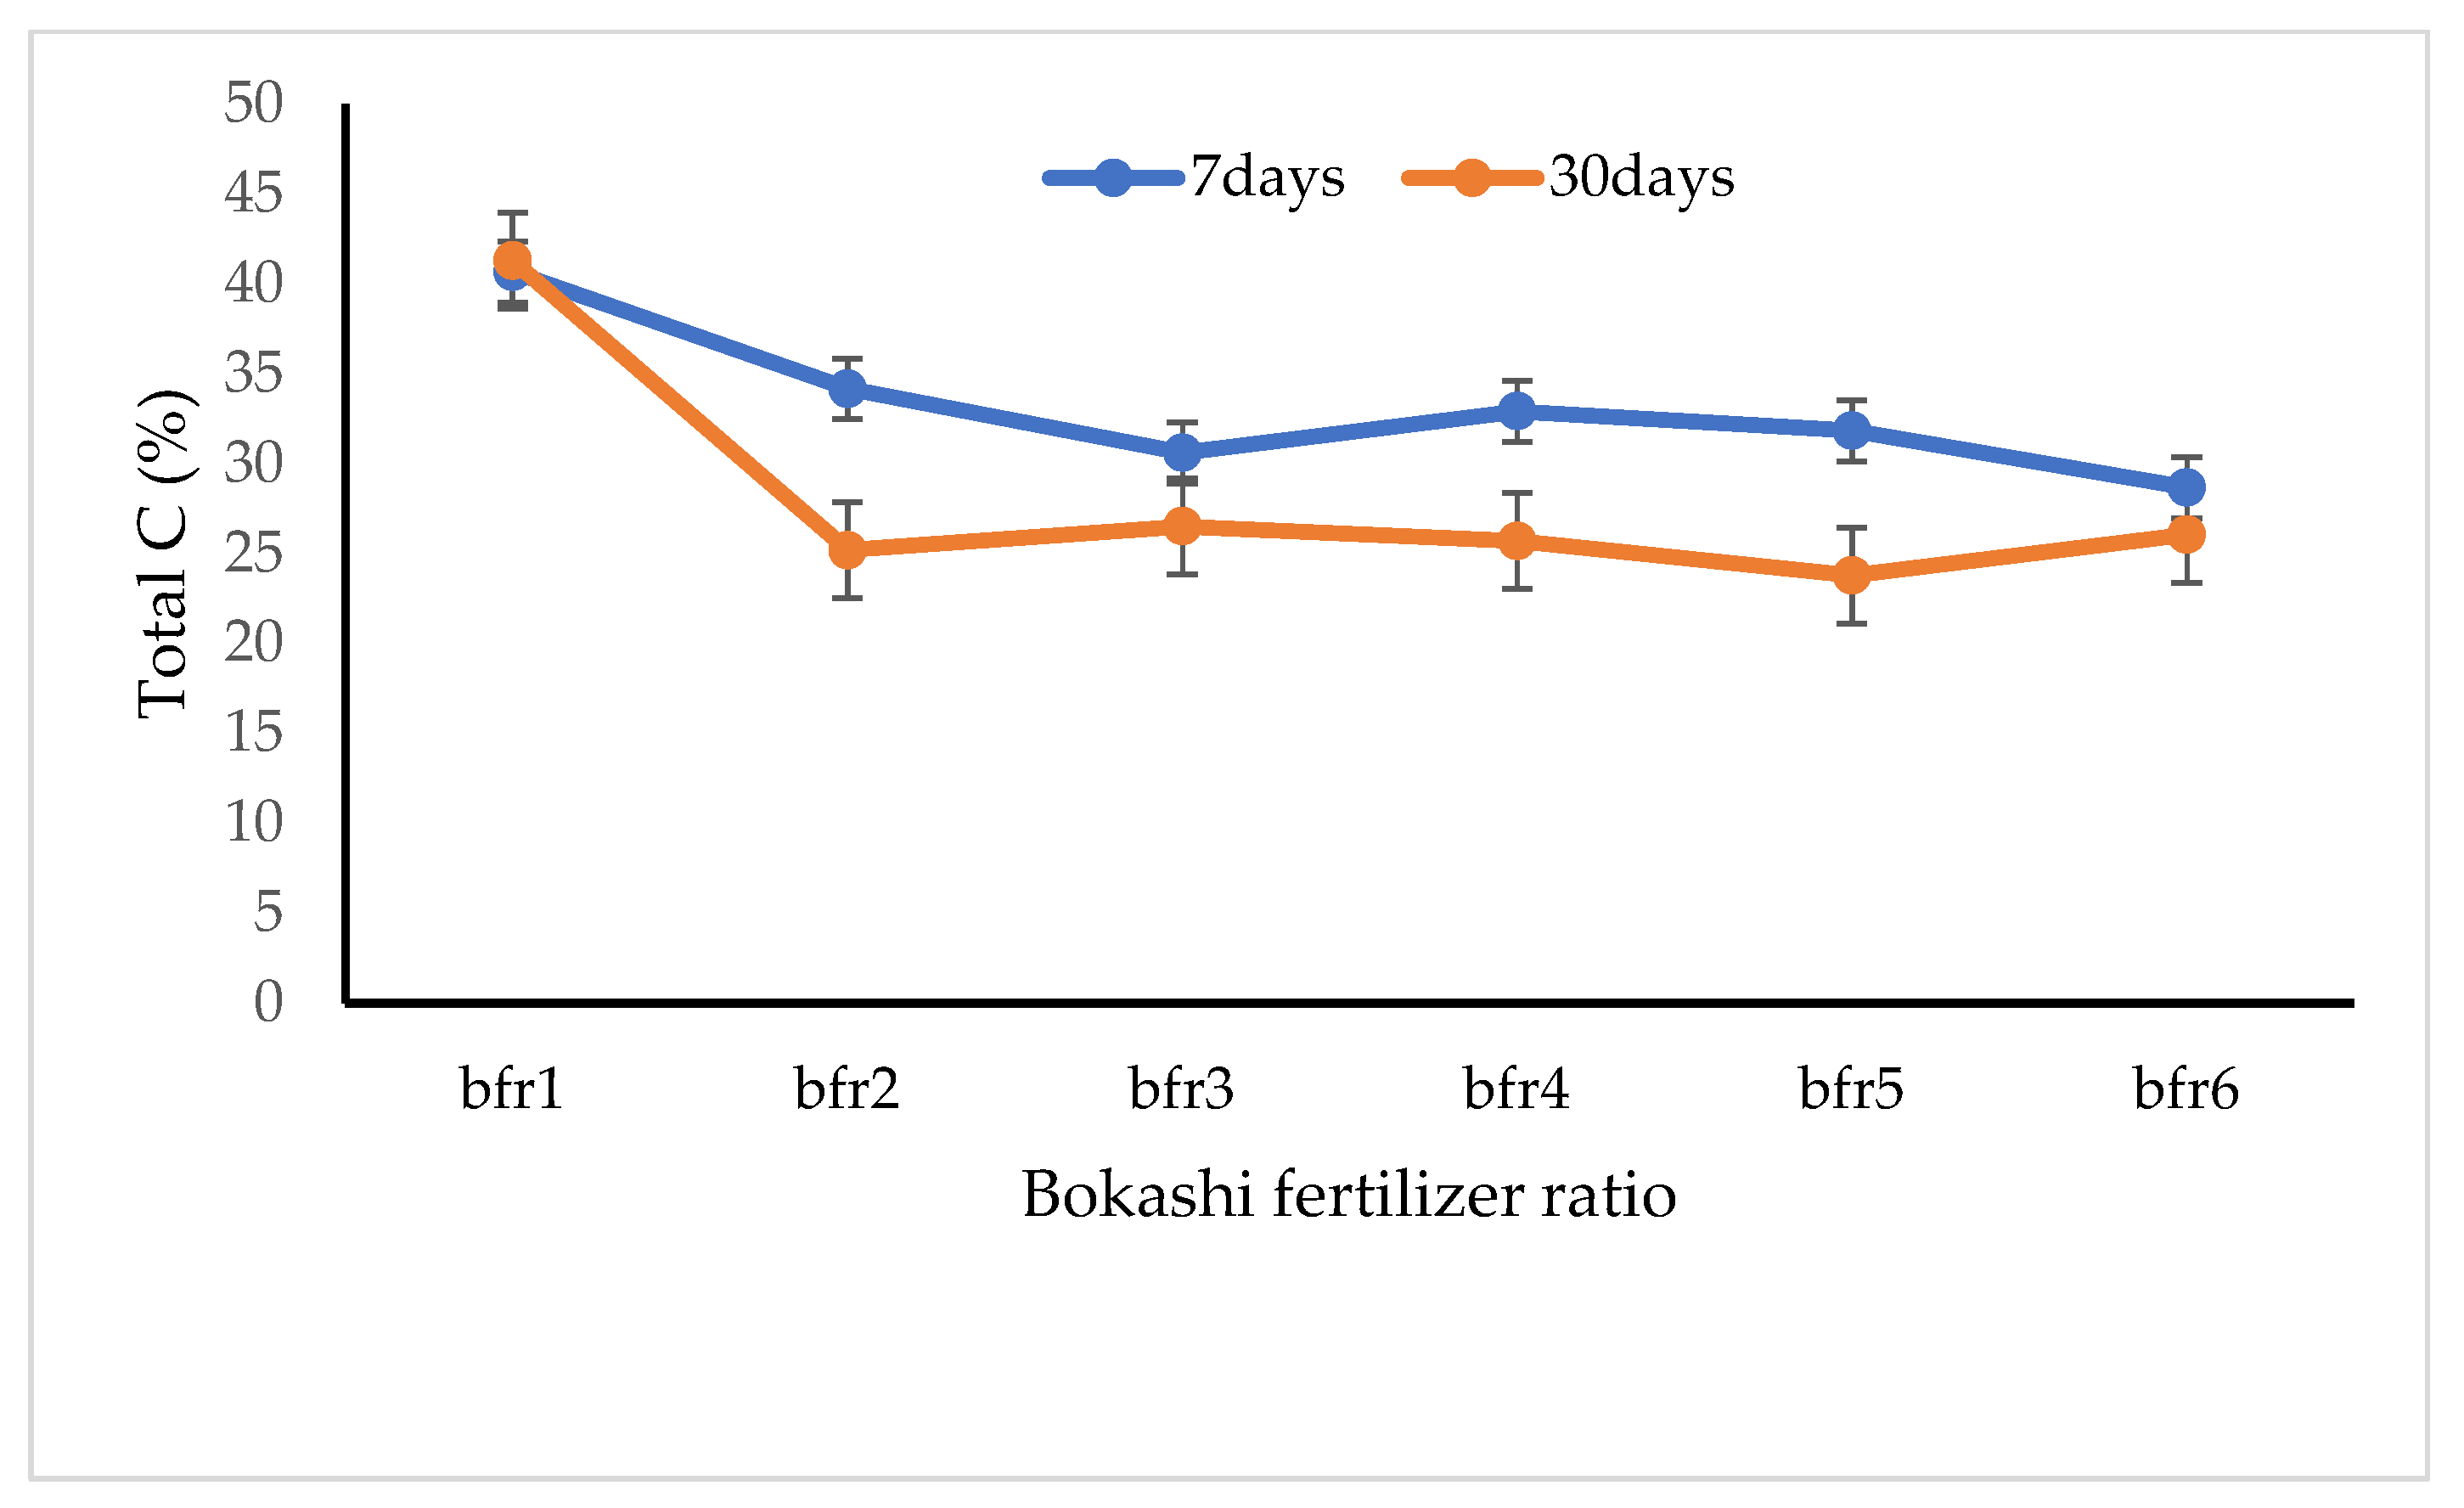
3.2. Chemical Properties of Bokashi Fertilizer

The chemical properties of bokashi fertilizer ratios are presented in Table 2, Table 3, Table 4 and Table 5 and Figure 5, Figure 6 and Figure 7. The pH was not significantly (p > 0.05) affected by the bokashi fertilizer ratios and the interaction effects between BFR × TMBF (Table 2). However, there was a significant difference (p ≤ 0.05) in pH values as affected by the time of bokashi fertilizer maturation. The pH values were highest (7.55) after seven days of bokashi fertilizer maturation. The electrical conductivity (EC) was significantly affected (p ≤ 0.05) by bokashi fertilizer ratios and the time of maturation of the bokashi fertilizer. The highest EC (1.51 mS cm−1) was obtained in bfr6, and the lowest EC (0.27 mS cm−1) in the control (bfr1) (Table 2). However, there was no significant interaction between BFR × TMBF on EC values. The CEC was significantly (p ≤ 0.05) affected by bokashi fertilizer ratios and the time of maturation of bokashi fertilizer. The highest CEC (20.59 cmol/kg) was obtained from bfr5, although this was not statistically different from the values obtained from bfr6 and bfr3. The lowest CEC (15.34 cmol/kg) was obtained from bfr1 (control). However, there was no significant interaction effect of BFR × TMBF on CEC values (Table 2).
The Ca content was significantly (p ≤ 0.05) affected by the main effects of bokashi fertilizer ratios, but not by the main effect of time for bokashi fertilizer maturation (Table 3). The highest Ca value (16.93 cmol/kg) was obtained from bfr3 and the lowest Ca value (8.28 cmol/kg) was obtained from the control (bfr1). There was no significant interaction (p > 0.05) between BFR × TMBF in terms of the Ca contents. Magnesium (Mg) was significantly affected (p ≤ 0.05) by the main effects of both bokashi fertilizer ratios and the time of maturation for bokashi fertilizer (Table 3). The highest Mg value (8.86 cmol/kg) was obtained from bfr3, although values from bfr5 and bfr6 were statistically comparable. The lowest Mg value (4.23 cmol/kg) was obtained from the control (bfr1). The highest Mg value (8.42 cmol/kg) was obtained after 30 days of bokashi fertilizer maturation. There was no significant interaction (p > 0.05) between BFR × TMBF in terms of Mg values (Table 3). Potassium (K) was also significantly affected (p ≤ 0.05) by the main effects of both bokashi fertilizer ratios and the time of maturation (Table 3). The highest K value (22.69 cmol/kg) was obtained from bfr6 and the lowest (6.98 cmol/kg) from bfr1 (the control). Potassium was also highest (16.56 cmol/kg) after 30 days of bokashi fertilizer maturation. There was no significant interaction (p > 0.05) between BFR × TMBF in terms of K values (Table 3). Sodium (Na) was significantly affected (p ≤ 0.05) by the main effects of both bokashi fertilizer ratios and the time of maturation (Table 3). Sodium was highest (5.48 cmol/kg) in bfr6 and lowest (1.32 cmol/kg) in bfr1 (control). The sodium value was highest (4.22 cmol/kg) after 30 days of bokashi fertilizer maturation. There was no significant interaction (p > 0.05) between BFR × TMBF in terms of Na values (Table 3).
The main effects of bokashi fertilizer ratios and the time of maturation for bokashi fertilizer significantly (p ≤ 0.05) influenced the total N (%). The highest TN (1.38%) was obtained from bfr6, although this can compare statistically with values from bfr5 and bfr3. The lowest TN value (0.59%) was obtained from bfr1 (control). Similarly, total N (%) was highest (1.20%) after 30 days of the bokashi fertilizer maturation compared with the value (0.99%) obtained after seven days (Table 4). There was no significant interaction (p > 0.05) between BFR × TMBF in terms of TN (%) values (Table 4). The main effects of bokashi fertilizer ratios and the time of maturation of bokashi fertilizer significantly (p ≤ 0.05) affected the total p values, with the highest value (0.179%) obtained from bfr6, although this was not significantly different from the values obtained from bfr5 and bfr6. The lowest total p value (0.055%) was obtained from bfr1. Total P was also highest (0.149%) after 30 days of bokashi fertilizer maturation. The interaction between BFR × TMBF in terms of the total p values was not significant (Table 4). The main effects of bokashi fertilizer ratios and the time of maturation of bokashi fertilizer significantly (p ≤ 0.05) affected both the OC (%) and OM (%) contents. The highest values, however, were obtained from bfr1 and the lowest values from bfr6 (Table 4). Both OC (%) and OM (%) were highest after seven days of bokashi fertilizer maturation. There was no significant interaction (p > 0.05) between BFR × TMBF in terms of OC (%) and OM (%) values (Table 4).
The C/N ratio was significantly affected by the interaction effects of BFR × TMBF (Figure 5). After seven days of bokashi maturation, there was no significant difference in terms of the C/N ratio between the six bfrs, with values above 23% in all cases. However, there was a significant difference in C/N ratios after 30 days of bokashi fertilizer maturation, with the highest value (65.7%) obtained from bfr1 and the lowest value (17.2%) from bfr6. The C/N ratio values from other bokashi fertilizer ratios were also low and compared statistically with the values from bfr6.
Similarly, the interaction effect between BFR × TMBF on total C (%) was significant (Figure 6). Bokashi fertilizer ratios did not differ significantly in their total C content after seven days of maturation. However, the bokashi fertilizer ratios differed significantly in their total C content after 30 days of maturation, with the highest value (41.3%) obtained from bfr1 and the lowest value (23.8%) from bfr5. The total C values from other bokashi fertilizer ratios were also low and compared statistically with the values from bfr6.
The main effects of bokashi fertilizer ratios, the time of maturation for bokashi fertilizer, and the interaction between bokashi fertilizer ratios and time of maturation of bokashi fertilizer (BFR × TMBF) significantly (p ≤ 0.05) affected the cadmium (Cd) content of the bokashi fertilizer. The highest Cd value (0.70 mg/kg) was obtained from bfr6, although the values from bfr3, bfr4, and bfr5 were statistically comparable. The lowest Cd value (0.08 mg/kg) was obtained from bfr1 (the control). Similarly, there was a significant difference (p ≤ 0.05) in the Cd values of bokashi fertilizer between seven and 30 days TMBF, with the highest Cd value (0.56 mg/kg) obtained after 30 days of bokashi fertilizer maturation and the lowest Cd value (0.46 mg/kg) obtained after seven days of bokashi fertilizer maturation (Table 5). The significant interaction effect of BFR × TMBF on Cd content is shown in Figure 7. The main effects of bokashi fertilizer ratios and the time of maturation for bokashi fertilizer significantly (p ≤ 0.05) affected the chromium (Cr) contents of bokashi fertilizer. The highest chromium value (20.78 mg/kg) was obtained from bfr4, but this value is statistically comparable to that of other formulations containing cow dung. Chromium was lowest (7.63 mg/kg) in bfr1 (the control). The interaction effect of BFR × TMBF on chromium content was not significant. The main effects of bokashi fertilizer ratios and the time of maturation for bokashi fertilizer significantly (p ≤ 0.05) affected the copper (Cu) contents of bokashi fertilizer. The highest Cu value (19.01 mg/kg) was obtained from bfr6, although this value was statistically comparable to all other formulations containing cow dung. Copper (Cu) was lowest (9.53 mg/kg) in bfr1 (the control). The interaction effect of BFR × TMBF on Cu content was not significant. Similarly, the main effects of bokashi fertilizer ratios and the time of maturation for bokashi fertilizer significantly (p ≤ 0.05) influenced the nickel (Ni) content of bokashi fertilizer, with the most Ni (4.22 mg/kg) obtained from bfr6 and the least (1.05 mg/kg) obtained from bfr1 (the control). The nickel values in bfr2–5 can compare statistically with bfr6. The interaction effect of BFR × TMBF on Ni content was not significant (Table 5). However, the main effects of bokashi fertilizer ratios, the time of maturation for bokashi fertilizer, and the interaction between bokashi fertilizer ratios and time of maturation of bokashi fertilizer (BFR × TMBF) did significantly (p > 0.05) affect the lead (Pb) content of the bokashi fertilizer.
The cadmium content was significantly affected by the interaction effect of BFR × TMBF (Figure 7). The figure shows that there was a significant difference in the cadmium content of bokashi fertilizer, with the highest Cd value (0.90 mg/kg) obtained from bfr6 after 30 days of bokashi maturation and the lowest Cd (0.07 mg/kg) after seven days. However, the Cd content of bokashi fertilizer ratios did not differ significantly after seven days of maturation.

3.3. Germination Bioassay for the Bokashi Fertilizers Using Cabbage Seeds

Table 6 describes the germination bioassay for the bokashi fertilizers using cabbage seeds. The germination index (GI) was obtained from the relative seed germination and the relative root growth using cabbage seeds. The relative seed germination-RSG (%) = number of seeds germinated in (bokashi) extract divided by the number of seed germinated in the distill water (control) multiplied by 100. The relative root growth-RRG (%) = average root length in (bokashi) extract divided by the average root length in the control (distill water) multiplied by 100. Therefore, GI is given by (RSG × RRG)/100.
Therefore, the germination index (GI) used was the mean of the Gi of 50% and Gi of 75% extract dilutions as described in Equations (2)–(4) above. The GI result obtained was 90.1 (%) (Table 6).
Supplementary Materials on the germination bioassay for the bokashi fertilizer in form of Figure S1 (Bokashi fertilizer extracting solution) and Table S1 (Seed germination bioassay using cabbage seeds) have been included for ease of reference.

4. Discussion

4.1. The Physical Characteristics of Horse Waste-Based Bokashi Fertilizers

This study assessed the quality of different bokashi fertilizer ratios based on their chemical properties over two maturation periods. The physical properties studied were the bulk density and the color and texture of the bokashi fertilizer. The range of bulk density (BD) values (Figure 3) obtained in this study was far below what was reported by Khater [39] in different compost types. This may be due to the high contents of bedding materials (sawdust) in all the bokashi fertilizer formulations that were high in lignin content. The results also implied that BD increases with an increase in CD in all formulations. Additionally, bfr5 and bfr6 appeared to be a type of bokashi fertilizer matured enough for soil application after 30 days. Moreover, the high bulk density, as obtained from bfr5 and bfr6 relative to the bulk densities in other bokashi fertilizer ratios, is an indication of the possibility of high nutrients and a high water-retention capacity [39]. The fertilizer ratios that were richer in organic manure provided more stable, dark brown, and soil-like looking material [36] (Figure 4E,F); when the original color and texture changed to fine and putrefied dark brown, the process was presumed to be completed [34].

4.2. The Chemical Characteristics of Horse Waste-Based Bokashi Fertilizer

This study focused mostly on the assessment of chemical properties that relate to the fertilizer quality in six different ratios of bokashi fertilizers. These include pH, EC, CEC, exchangeable bases, total C (%), total N (%), CN ratio, total P, OC (%), and OM (%). All the bokashi fertilizer ratios produced in the present study attained the recommended pH level [40] for plant growth, with almost all the values slightly above neutrality after both periods of bokashi fertilizer maturation. A similar result was reported by Karanja et al. [34]. Formulations with a pH value above neutral are particularly important, especially in acidic soils such as are found in tropical rainforests; this was obtained from all six bfrs over the two bokashi fertilizer maturation periods (seven and 30 days). However, the pH decreased by 4.1% after 30 days after maturation as compared to at seven days. A similar decrease in pH over the maturation was reported by Troy et al. [40]. All the EC values in this study fell below the recommended limit provided by [41], and even below what was reported by [39], and are therefore considered safe for agricultural applications. The high EC values obtained from bfr6 and bfr5 are a reflection of nutrient enrichment [41]. The EC value in bfr6 was 459% higher than what was obtained in the control (bfr1). The EC value increased by 29.1% after 30 days of bokashi fertilizer maturation. However, a very high EC value is not desirable for the good functioning of a soil system as the activity of microorganisms declines at high EC values [42,43]. Excessively high EC values were absent from all bokashi fertilizer ratios over the two periods of maturation. The EC values in all the bfrs (bfr1–6) also suggest that each can be used as a substrate or an amendment in growing media for some containerized plants [44]. The cation exchange capacity (CEC) of compost is defined by the number of negative charge sites in a compost/bokashi that can hold positively charged ions (cations) [45]. High CEC indicates high quality for a bokashi fertilizer, so brf5 and bfr6 were of the quality most desired for use as potential fertilizers. The CEC obtained from bfr5 was higher than the CEC values in bfr1 (control), by 34%. The CEC also increased significantly (p ≤ 0.05), by 22.6%, after 30 days of bokashi fertilizer maturation compared to after seven days. These findings were supported by the authors of [46], who also revealed that there was an increase in CEC between the two durations of bokashi fertilizer maturation. The higher the CEC, the more stable and more matured was the compost/bokashi fertilizer, and the greater capacity it had to hold nutrients [45]. Bokashi fertilizer ratios with high CEC values, such as bfr5 and bfr6, may increase the level of soil CEC if added [34]. Moreover, CEC is a major controlling agent of nutrient availability for plant growth, soil pH, and the soil reaction to fertilizers and other ameliorants [46].
For the exchangeable basis—calcium (Ca), for instance—the results were not very different from what was reported by Kala et al. [47] in compost using oil palm wastes and sewage sludge. The results also implied that the Ca value was highest in all the bfrs containing ≥ 20% of CD, and lowest in bfr1 (the control), with no trace of CD at all. Bfr3 provided 104% higher Ca contents compared with the control (bfr1). However, the Ca values were generally low compared to what was reported by Karanja et al. [34], probably due to the difference in the composition of the raw materials used. The Ca values were also generally below the recommended range. After 30 days of bokashi fertilizer maturation, the Ca content decreased by 2.4% compared to after seven days of maturation. The magnesium (Mg) content in bfr3 was higher than the values in bfr1 (the control) by 109.5%. The Mg values obtained in this study across all the bfrs maintained a similar trend to Ca, increasing with the increase in CD content. However, the low Mg values obtained were higher than the values reported for Mg in compost in [48]. This indicates the importance of treating the raw materials with EM4, which facilitates the decomposition of organic materials with the subsequent release of nutrients. However, the values were generally below the recommended limit provided by [49]. For potassium (K), the results obtained in bfrs2–6 were higher than the average range of K values reported by Karanja et al. [34] in compost formulations using rice straw, donkey manure, and chicken manure. Thus, the highest K values, obtained from bfr6, bfr3, and bfr5 (each containing at least 20% CD) fell within the recommended limits provided by [49,50]. Bfr6 had higher K content than bfr1 (the control) by 196.4%. Similarly, the K content increased by 28.8% from seven to 30 days. The Na content in bfr6 was significantly higher than in the control (bfr1), by 315.2%. The Na content also increased significantly from seven to 30 days, by 18.2%. For sodium (Na), the values from all bfrs were also within the acceptable limit provided by the authors of [49], justifying the low and safe EC values suitable for growing most crops.
The C/N ratio refers to the ratio of TC (total carbon) to TN (total nitrogen) in a sample. It indicates the availability of nitrogen and the stability of a bokashi fertilizer. Different scholars have reported different values for a C/N ratio as to what is ideal for soil microbes and plant application. A C/N ratio of <20 demonstrates that a bokashi fertilizer/compost has attained a stability point that is ideal for plant application [51]. An ideal C/N ratio is a must for microbes to grow and act. The interaction effect of BFR × TMBF on the C/N ratio revealed that there was a significant difference in C/N ratios after 30 days of bokashi fertilizer maturation, with the highest value (65.7%) obtained in bfr1 and the lowest (17.2%) from bfr6. The highest C/N ratio in the control (bfr1) was probably due to the high carbon content in the formulation, which had HBW (80%) with no trace of CD, indicating that the process of breaking down the raw materials was incomplete even after 30 days, as compared to bfr6, where the C/N ratio value was low and the breaking down process was relatively complete [34]. A high C/N ratio in bfr1 indicated a high carbon content relative to nitrogen, implying that microbes needed a longer time to make use of excess carbon due to insufficient nitrogen [52]. However, a C/N ratio below 20 may be seen as ideal for the growth of soil microbes [53]; therefore, bfr5, bfr6, and bfr3 demonstrated their suitability as bio-organic fertilizers after 30 days of bokashi fertilizer maturation period (Figure 5). However, from a soil fertility standpoint, a bokashi fertilizer or any other organic amendment should have a C/N ratio of less than 25 to 30 with adequate nitrogen for the growth of crops and microbes [21].
The interaction effect of BFR × TMBF on the total carbon content revealed a highly significant difference (Figure 6). Bokashi fertilizer ratios did not differ significantly in terms of their total C content after seven days of maturation. However, the bokashi fertilizer ratios differed significantly in their total C content after 30 days of maturation, with the highest value (41.3%) obtained in bfr1 and the lowest value (23.8%) from bfr5. A high value of total C, even after 30 days of maturation, is an indication of strong resistance to the decomposition of the formulation bfr1 (the control), which mainly contained sawdust despite treatment with an EM4 solution (Figure 6). Microbes require more time to break down such complex materials.
The total N (%) content for bfr6 was significantly higher than the total N content in the control (bfr1), by 133.9%. Total nitrogen (%) also significantly increased from seven days to 30 days of bokashi fertilizer maturation, by 21.2%. The amount of nitrogen present in bokashi fertilizer determines its fertilizer value. Abu-Zahra et al. [54] reported 0.65% of total N from traditional composting using sheep manure with plant residues after 50 days of composting. Total N values of 0.95% and 1.54% were reported in bokashi fertilizer by [55] and [18], respectively. The high value of total N reported by the latter was obtained from bfr5 and bfr6. According to Sullivan et al. [49], the ideal range of total nitrogen in a matured compost is 1–2%. This was supported by the findings of [56], with a similar total N value from organic compost. Compost with a value of total N above 1% can be utilized as a fertilizer [49]; therefore, brf5 and brf6 are potential bio-organic fertilizers suitable for use in crop production. In addition, as organic substrates, brf5 and brf6 can be mixed with sand and utilized as growing media [57], or can be applied directly to field crops as organic amendments [21].
Phosphorus is another major essential nutrient that determines the value of any fertilizer material. Phosphorus values in all the bfrs were below the recommended range provided by Sullivan et al. [49]. The values remained low even after 30 days of bokashi fertilizer maturation. Despite being low in total P content, bfr6 significantly exceeded the total P content in bfr1 (control) by 225.5%. The total P content was 33.0% higher after 30 days of bokashi fertilizer maturation compared to after seven days. The total P values increased as the % CD increased in almost all the bfrs. Although the total P values from the treatments were generally low, the total P values (in the range of 0.055–0.179%) were higher than 0.03% and 0.04%, as reported for bokashi fertilizers by the authors of [18,24], respectively.
The lowest OC (%) was obtained from bfr6, whereas the highest value was obtained from bfr1 (Table 4). The OC (%) content in the control (bfr1) was higher than the OC (%) values in bfr6 by 26.5%. The OC (%) content after 30 days of bokashi fertilizer maturation was, however, lower than the value after seven days, by 13.97%. That is to say, the carbon loss by the end of 30 days of bokashi fertilizer maturation was nearly 14% (Table 4). This loss in carbon at the later stage of bokashi fertilizer maturation could be due to the breakdown of complex compounds such as lignin and cellulose, as reported by Bernal et al. [58]. The most valuable component of bokashi fertilizer that aids in the improvement of soil health is its organic matter (OM%) content. A compost with OM levels above 65% is not well composted [49]. A compost (especially for potting mixes) should have OM levels >30% [59]. Finished compost should have OM levels in the range of 30–70%. However, for most compost, OM should be in the range of 50–60% [60]. Therefore, bfr2, bfr3, bfr4, and bfr5 provided the needed OM contents for agricultural use. Organic matter (OM) was highest in bfr1 due to the highest % of HBW (too much sawdust) [40] with no traces of CD, whereas bfr6 had the lowest OM due to its relatively low contents of carbon-rich bulking materials with an appreciable quantity of CD (Table 4). Therefore, the use of manure such as CD in appreciable quantity is a must if any bokashi fertilizer of good quality is to be produced [61]. Although the OM (%) after seven days of maturation was higher than the value obtained after 30 days by nearly 14%, values from both periods fell within the acceptable range for agricultural applications [60].
The values for heavy metals in terms of the treatments and duration of bokashi maturation were all within the acceptable limits for agricultural applications [59,62], except for cadmium in bfr6 after 30 days of bokashi fertilizer maturation, with the value of 0.90 mg/kg falling slightly above the acceptable limit of 0.7 mg/kg. The cadmium value increased with an increase in the number of days of bokashi fertilizer maturation.

4.3. Germination Bioassay for the Bokashi Fertilizers

The germination index provides the best way of testing a compost’s phytotoxicity on plant growth because of its reliability and straightforward results [63]. The germination bioassay result indicated a germination index (GI) of 90.1% using cabbage as the test crop (Table 6). A similar result was reported by Gariglio et al. [38], where the germination index of lettuce from willow sawdust composted for 40 days increased by 93.3%. Compost is regarded as mature if the value of the germination index is above 60% compared with the control [29,63]. Again, a germination index above 80% not only indicates compost maturity but, also the absence of phytotoxins [64]. Additionally, low values of heavy metals (Table 5) justify the safety and maturity of the bokashi fertilizer. Cadmium (Cd) is a toxic element [31]. The interaction effect of bfr × TMBF on cadmium content indicated that the cadmium content of br5 was just 0.07 mg/kg above the critical limit [59], and the germination index of 90.1% indicated that the bokashi fertilizer was safe. Cabbage seed was used because it is one of the most sensitive seeds to phytotoxicity [65]. Therefore, the results of this study (using cabbage as the test crop) indicated that the chosen bokashi fertilizer is safe to be used to grow crops.

5. Conclusions

This research aimed at a waste management strategy converting agricultural waste into useful organic (bokashi) fertilizers that are less costly, ecofriendly, and safe for agricultural application. This was achieved by the use of EM technology to formulate various ratios of bokashi fertilizer over seven and 30 days of maturation. Good-quality bokashi fertilizers (especially bfr5 and bfr6) that were rich in plant nutrients were produced at the end of 30 days of maturation. The chosen bokashi fertilizer (bfr5) was devoid of phytotoxic substances, as indicated by the seed germination bioassay test. However, the research found that horse bedding waste alone cannot make a good-quality bokashi fertilizer, even if EM technology is employed. We recommend the use of other nutrient-rich sources such as poultry manure along with horse bedding waste in different ratios in future studies. Seeds of other sensitive crops can also be used to carry out germination bioassay tests to check the phytotoxicity of this type of bokashi fertilizer on other crops for possible wider consideration of its applicability.

Supplementary Materials

The following supporting information can be downloaded at: https://www.mdpi.com/article/10.3390/agronomy12040937/s1, Figure S1 (a) Bokashi fertilizer extracting solutions. Then, Cabbage seeds germinating in (b) control (dH2O), (c) 25% extracting solution, (d) 50% extracting solution, (e) 75% extracting solution, (f) 100% extracting solution; Table S1: Seed germination bioassay using cabbage seeds.

Author Contributions

Conceptualization, M.M.Y.; Data curation, M.Y.A.S. and M.F.R.; Formal analysis, A.G.G.; Methodology, Z.S. and M.Y.A.S.; Supervision, Z.S. and M.F.R.; Writing—original draft, A.G.G.; Writing—review and editing, A.G.G., Z.S., M.M.Y. and M.A.S. All authors have read and agreed to the published version of the manuscript.

Funding

This research was funded by Ministry of higher education and UPM grant number 5540304. And The APC was funded by the Research Management Center, University Putra Malaysia (RMC, UPM).

Data Availability Statement

Not applicable.

Acknowledgments

The authors wish to thank the Ministry of Higher Education in Malaysia and the University Putra Malaysia for sponsoring this research.

Conflicts of Interest

The authors declare no conflict of interest.

References

  1. Dinesh, R.; Srinivasan, V.; Hamza, S.; Manjusha, A. Bioresource Technology Short-term incorporation of organic manures and biofertilizers influences biochemical and microbial characteristics of soils under an annual crop [Turmeric (Curcuma longa L.)]. Bioresour. Technol. 2010, 101, 4697–4702. [Google Scholar] [CrossRef] [PubMed]
  2. Urra, J.; Alkorta, I.; Lanzén, A.; Mijangos, I.; Garbisu, C. The application of fresh and composted horse and chicken manure affects soil quality, microbial composition and antibiotic resistance. Appl. Soil Ecol. 2019, 135, 73–84. [Google Scholar] [CrossRef]
  3. Zamri, N.S.; Khairul, M.; Kamarudin, A.; Armi, M.; Samah, A.; Shakir, A.; Saudi, M.; Wahab, N.A.; Hafiz, M. The environmental pollution and solid waste m anagement in Malaysia. Int. J. Acad. Res. Bus. Soc. Sci. 2019, 9, 12–23. [Google Scholar] [CrossRef]
  4. Ahmad, A.; Sulaiman, N.F. Save The Food for A Better Future: A Discussion on Food Wastage in Malaysia. Int. J. Law, Gov. Commun. 2018, 3, 12–21. [Google Scholar]
  5. Al Abboud, M.A.; Ghany, T.A.; Alawlaqi, M.M. Role of biofertilizers in agriculture: A brief review. Mycopath 2013, 11, 95–101. [Google Scholar]
  6. Wijayanto, T.; Zulfikar, M.; Tufaila, M.; Alam, S.M.; Zamrun, M.F. Agricultural Wastes based-Organic Fertilizers (Bokashi) Improve the Growth and Yield of Soybean (Glycine max (L.) Merrill). Int. J. Agric. Sci. 2016, 1, 27–32. [Google Scholar]
  7. Alam, S.; Seth, R.K. Comparative Study on Effect of Chemical and Bio- Fertilizer on Growth, Development and Yield Production of Paddy crop (Oryza sativa). Int. J. Sci. Res. ISSN 2012, 3, 2319–7064. [Google Scholar]
  8. Olle, M.; Williams, I.H. Effective microorganisms and their influence on vegetable production—A review. J. Hortic. Sci. Biotechnol. 2013, 88, 380–386. [Google Scholar] [CrossRef]
  9. Pan, I.; Dam, B.; Sen, S.K. Composting of common organic wastes using microbial inoculants. 3 Biotech 2012, 2, 127–134. [Google Scholar] [CrossRef] [Green Version]
  10. Sharma, A.; Sharma, R.; Arora, A.; Shah, R.; Singh, A.; Pranaw, K.; Nain, L. Insights into rapid composting of paddy straw augmented with efficient microorganism consortium. Int. J. Recycl. Org. Waste Agric. 2014, 3, 1–9. [Google Scholar] [CrossRef] [Green Version]
  11. Lasmini, S.A.; Nasir, B.; Hayati, N.; Edy, N. Improvement of soil quality using bokashi composting and NPK fertilizer to increase shallot yield on dry land. Aust. J. Crop Sci. 2018, 12, 1743–1749. [Google Scholar] [CrossRef]
  12. Zahrah, S. System of Rice Intensification. Encycl. Food Agric. Ethics 2019, 12, 2318. [Google Scholar] [CrossRef]
  13. Wakui, Y. Organic Farming Technology; The Japan Agricultural Exchange Council (JAEC): Tokyo, Japan, 2009. [Google Scholar]
  14. Lima, C.E.P.; Fontenelle, M.R.; Silva, L.R.B.; Soares, D.C.; Moita, A.W.; Zandonadi, D.B.; Souza, R.B.; Lopes, C.A. Short-term changes in fertility attributes and soil organic matter caused by the addition of em Bokashis in two tropical soils. Int. J. Agron. 2015, 2015, 1–9. [Google Scholar] [CrossRef]
  15. Christel, D.M. The Use of Bokashi as a Soil Fertility Amendment in Organic Spinach Cultivation; University of Vermont: Burlington, VT, USA, 2017. [Google Scholar]
  16. Yamada, K.; Xu, H. Properties and Applications of an Organic Fertilizer Inoculated with Effective Microorganisms. J. Crop Prod. 2001, 3, 255–268. [Google Scholar] [CrossRef]
  17. Barus, W.A.; Utami, S.; Azmi, E.P. Effect of Azolla Bocachi and Liquid Organic Fertilizer of Goat Manure on the Growth and Production of Chinese Kale (Brassica oleracea L.). Indones. J. Agric. Res. 2018, 1, 78–86. [Google Scholar] [CrossRef]
  18. Gómez-Velasco, D.A.; Álvarez-Solís, J.D.; Ruiz-Valdiviezo, V.M.; Abud-Archila, M.; Montes-Molina, J.A.; Dendooven, L.; Gutiérrez-Miceli, F.A. Enzymatic Activities in Soil Cultivated with Coffee (Coffea arabica L. cv. ‘Bourbon’) and Amended with Organic Material. Commun. Soil Sci. Plant Anal. 2014, 45, 2529–2538. [Google Scholar] [CrossRef]
  19. Bocoli, F.A.; Marcon, J.A.; Izidoro, M.; Bortolon, P.D.T.; de Oliveira, S.E.R.; Spalevic, V.; de Souza, P.S. Bokashi use in the passionfruit (Passiflora edulis l.) germination and initial growth. Agric. For. 2020, 66, 101–111. [Google Scholar] [CrossRef]
  20. Ghanem, K.; El-Zabalawy, K.; Mustafa, A.; Elbanna, B. Impact of Using Compost Bokashi Resulting from Recycling Kitchen Waste on Head Lettuce (Lactuca sativa var. capitata L.) Grown Organically at Home. J. Soil Sci. Agric. Eng. 2017, 8, 21–27. [Google Scholar] [CrossRef]
  21. Quiroz, M.; Céspedes, C. Bokashi as an Amendment and Source of Nitrogen in Sustainable Agricultural Systems: A Review. J. Soil Sci. Plant Nutr. 2019, 19, 237–248. [Google Scholar] [CrossRef]
  22. Salisu, M.A.; Sulaiman, Z.; Rus, R.C.; Samad, M.Y.A. Water use efficiency, plant growth and vegetative traits of rubber (Hevea brasiliensis) seedlings grown using different growing media and water levels. Aust. J. Crop Sci. 2020, 14, 1497–1505. [Google Scholar] [CrossRef]
  23. Salisu, M.A.; Sulaiman, Z.; Samad, M.Y.A. Growth and biomass yield of rubber seedlings grown on soilless and soil-based media. Bangladesh J. Bot. 2020, 49, 229–236. [Google Scholar] [CrossRef]
  24. Abo-Sido, N. Analysis of the Nutrient Composition, Efficacy, and Sustainability of Bokashi Fertilizers; Wellesley College: Wellesley, MA, USA, 2018. [Google Scholar]
  25. Stevanus, C.T.; Bintarti, A.F.; Setiawan, N. The effect of oil palm frond-based compost as growing media amendment for rubber (Hevea Brasiliensis, Müll. Arg.) planting material. Malaysian J. Soil Sci. 2016, 20, 195–209. [Google Scholar]
  26. Amasuomo, E.; Baird, J. The Concept of Waste and Waste Management. J. Manag. Sustain. 2016, 6, 88. [Google Scholar] [CrossRef]
  27. Talukdar, P.; Baruah, M.; Saikia, P. Waste management for sustainable agricultural production—A brief review. Asian J. Home Sci. 2018, 13, 657–659. [Google Scholar] [CrossRef]
  28. Kebrom, T.H.; Woldesenbet, S.; Bayabil, H.K.; Garcia, M.; Gao, M.; Ampim, P.; Awal, R.; Fares, A. Evaluation of phytotoxicity of three organic amendments to collard greens using the seed germination bioassay. Environ. Sci. Pollut. Res. 2019, 26, 5454–5462. [Google Scholar] [CrossRef] [Green Version]
  29. Oktiawan, W.; Zaman, B. Use of a germination bioassay to test compost maturity in Tekelan Village. E3S Web Conf. 2018, 31, 05012. [Google Scholar] [CrossRef] [Green Version]
  30. Arora, M.; Kiran, B.; Rani, S.; Rani, A.; Kaur, B.; Mittal, N. Heavy metal accumulation in vegetables irrigated with water from different sources. Food Chem. 2008, 111, 811–815. [Google Scholar] [CrossRef]
  31. Mohammed, N.K.; Khamis, F.O. Assessment of heavy metal contamination in vegetables consumed in Zanzibars. Nat. Sci. 2012, 4, 588–594. [Google Scholar] [CrossRef] [Green Version]
  32. Hata, F.; Ventura, M.; Fregonezi, G.; Lima, R. Bokashi, boiled manure and penergetic applications increased agronomic production variables and may enhance powdery mildew severity of organic tomato plants. Horticulturae 2021, 7, 27. [Google Scholar] [CrossRef]
  33. Teh, C.B.S.; Talib, J. Soil and Plant Analyses Vol. I Soil Physics Analyses; UPM Press: Serdang, Malaysia, 2006; Volume 1, p. 42. [Google Scholar]
  34. Karanja, A.W.; Njeru, E.M.; Maingi, J.M. Assessment of physicochemical changes during composting rice straw with chicken and donkey manure. Int. J. Recycl. Org. Waste Agric. 2019, 8, 65–72. [Google Scholar] [CrossRef] [Green Version]
  35. Chapman, H.D. Cation-exchange capacity. In Methods of Soil Analysis. Agronomy Monograph; Black, C.A., Ed.; American Society of Agronomy: Madison, WI, USA, 1965; pp. 891–901. [Google Scholar] [CrossRef]
  36. Walkley, A.; Black, I.A. An examination of the Degtjareff method for determining soil organic matter and a proposed modification of the chromic acid titration method. Soil Sci. 1934, 37, 29–38. [Google Scholar] [CrossRef]
  37. Jones, J.J.B. Plants. In Official Methods of Analysis of the Association of Official Analytical Chemists; Williams, S., Ed.; Association of Official Analytical Chemists: Arlington, VA, USA, 1984; pp. 38–64. [Google Scholar]
  38. Gariglio, N.F.; Buyatti, M.A.; Pilatti, R.A.; Gonzalez, D.E.; Acosta, M.R.; Fe, S. New Zealand Journal of Crop and Horticultural Science Use of a germination bioassay to test compost maturity of willow (Salix sp.) sawdust. N. Z. J. Crop. Hortic. Sci. 2002, 30, 37–41. [Google Scholar] [CrossRef] [Green Version]
  39. Khater, E.S.G. Some Physical and Chemical Properties of Compost. Int. J. Waste Resour. 2015, 5, 172. [Google Scholar] [CrossRef]
  40. Troy, S.M.; Nolan, T.; Kwapinski, W.; Leahy, J.J.; Healy, M.G.; Lawlor, P.G. Effect of sawdust addition on composting of separated raw and anaerobically digested pig manure. J. Environ. Manag. 2012, 111, 70–77. [Google Scholar] [CrossRef] [Green Version]
  41. Zaha, C.; Dumitrescu, L.; Manciulea, I. Correlations Between Composting Conditions and Characteristics of Compost As Biofertilizer. Bull. Transilv. Univ. Brasov. Eng. Sciences. Ser. I 2013, 6, 51. [Google Scholar]
  42. Yan, N.; Marschner, P.; Cao, W.; Zuo, C.; Qin, W. Influence of salinity and water content on soil microorganisms. Int. Soil Water Conserv. Res. 2015, 3, 316–323. [Google Scholar] [CrossRef] [Green Version]
  43. Kim, J.M.; Roh, A.S.; Choi, S.C.; Kim, E.J.; Choi, M.T.; Ahn, B.K.; Weon, H.Y. Soil pH and electrical conductivity are key edaphic factors shaping bacterial communities of greenhouse soils in Korea. J. Microbiol. 2016, 54, 838–845. [Google Scholar] [CrossRef]
  44. Noguera, P.; Abad, M.; Puchades, R.; Maquieira, A.; Noguera, V. Influence of particle size on physical and chemical properties of coconut coir dust as container medium. Commun. Soil Sci. Plant Anal. 2003, 34, 593–605. [Google Scholar] [CrossRef]
  45. Saharinen, M.H. Evaluation of changes in CEC during composting. Compost Sci. Util. 1998, 6, 29–37. [Google Scholar] [CrossRef]
  46. Hazelton, P.; Murphy, B. Interpreting Soil Test Results; CSIRO: Collingwood, Australia, 2016. [Google Scholar]
  47. Kala, D.R.; Rosenani, A.B.; Fauziah, C.I.; Thohirah, L.A. Composting oil palm wastes and sewage sludge for use in potting media of ornamental plants. Malaysian J. Soil Sci. 2009, 13, 77–91. [Google Scholar]
  48. Chinwuba, A.J.; Alisa, C.O.; Okoye, U.G. Comparative analysis of macro and micro nutrients of bio waste, Compost and Verm icompost (using indigenous Lumbricus terrestris) of Solanum melongena (fruit) waste. J. Sci. Eng. Res. 2017, 4, 102–104. [Google Scholar]
  49. Sullivan, D.M.; Bary, A.I.; Miller, R.O.; Brewer, L.J. Interpreting Compost Analyses; Oregon State University Extension: Corvallis, OR, USA, 2018. [Google Scholar]
  50. Manohara, B.; Belagali, S.L. Characterization of Essential Nutrients and Heavy Metals during Municipal Solid Waste. Int. J. Innov. Res. Sci. 2014, 3, 9664–9672. [Google Scholar]
  51. Raviv, M.; Tarre, S.; Geler, Z.; Shelef, G. Changes in some physical and chemical properties of fibrous solids from cow manure and digested cow manure during composting. Biol. Wastes 1987, 19, 309–318. [Google Scholar] [CrossRef]
  52. Lew, P.S.; Nik Ibrahim, N.N.L.; Kamarudin, S.; Thamrin, N.M.; Misnan, M.F. Optimization of bokashi-composting process using effective microorganisms-1 in smart composting bin. Sensors 2021, 21, 2847. [Google Scholar] [CrossRef]
  53. Sarkar, P.; Chourasia, R. Bioconversion of organic solid wastes into biofortified compost using a microbial consortium. Int. J. Recycl. Org. Waste Agric. 2017, 6, 321–334. [Google Scholar] [CrossRef] [Green Version]
  54. Compost Compost Report Interpretation Guide. Available online: https://umaine.edu/soiltestinglab/wp-content/uploads/sites/227/2016/07/Compost-Report-Interpretation-Guide.pdf (accessed on 22 July 2021).
  55. Abu-zahra, T.R.; Ta’any, R.A.; Arabiyyat, A.R. Changes in compost physical and chemical properties during aerobic decomposition. Int. J. Curr. Microbiol. Appl. Sci. 2014, 3, 479–486. [Google Scholar]
  56. Álvarez-Solís, J.D.; Mendoza-Núñez, J.A.; León-Martínez, N.S.; Castellanos-Albores, J.; Gutiérrez-Miceli, F.A. Effect of bokashi and vermicompost leachate on yield and quality of pepper (Capsicum annuum) and onion (Allium cepa) under monoculture and intercropping cultures. Cienc. E Investig. Agrar. 2016, 43, 243–252. [Google Scholar] [CrossRef] [Green Version]
  57. Tratsch, M.V.M.; Ceretta, C.A.; da Silva, L.S.; Ferreira, P.A.A.; Brunetto, G. Composition and mineralization of organic compost derived from composting of fruit and vegetable waste. Rev. Ceres 2019, 66, 307–315. [Google Scholar] [CrossRef]
  58. Gohardoust, M.R.; Bar-Tal, A.; Effati, M.; Tuller, M. Characterization of physicochemical and hydraulic properties of organic and mineral soilless culture substrates and mixtures. Agronomy 2020, 10, 1403. [Google Scholar] [CrossRef]
  59. Bernal, M.P.; Alburquerque, J.A.; Moral, R. Composting of animal manures and chemical criteria for compost maturity assessment. A review. Bioresour. Technol. 2009, 100, 5444–5453. [Google Scholar] [CrossRef]
  60. Tiquia, S.M.; Tam, N.F.Y.; Hodgkiss, I.J. Effects of composting on phytotoxicity of spent pig-manure sawdust litter. Environ. Pollut. 1996, 93, 249–256. [Google Scholar] [CrossRef]
  61. Brinton, W.F. Compost Quality Standards & Guidelines; Woods End Research Laboratory, Inc.: New York, NY, USA, 2000. [Google Scholar]
  62. França, F.C.T.; Pedrosa, M.W.; Carlos, L.D.A.; Maciel, G.M.; Da Silva, E.C. Tomato yield and quality under various combinations of organic compost. Biosci. J. 2016, 32, 1147–1154. [Google Scholar] [CrossRef] [Green Version]
  63. Amlinger, D.F.; Pollak, D.M.; Favoino, E. Heavy Metals and Organic Compounds from Wastes Used as Organic Fertilisers; Compost-Legislation and Standard: Vienna, Austria, 2004. [Google Scholar]
  64. Selim, S.M.; Zayed, M.S.; Houssam, M.A. Evaluation of phytotoxicity of compost during composting process. Nat. Sci. 2012, 10, 69–77. [Google Scholar]
  65. Luo, Y.; Liang, J.; Zeng, G.; Chen, M.; Mo, D.; Li, G.; Zhang, D. Seed germination test for toxicity evaluation of compost: Its roles, problems and prospects. Waste Manag. 2018, 71, 109–114. [Google Scholar] [CrossRef] [PubMed]
Figure 1. Some of the materials used and bokashi fertilizer undergoing decomposition process. (A) Horse bedding waste and paddy husk charcoal. (B) Cow dung as the major source of nutrients. (C) Molasses and EM4. The molasses provides the needed energy to the microbial inoculum (EM4). (D) The 3 L container used to measure the raw materials. One full container = 10% of any of the solid raw materials used. That is, 100% of each bfr treatment was comprised of 10 full measures of the 3 L measuring container (shown in (D)). Therefore, for bfr1, we used an 8 + 0 + 2 measuring container with HBW + CD + PHC, respectively. For bfr2, it was an 8 + 1 + 1 measuring container with HBW + CD + PHC, respectively. For bfr3, it was a 7 + 2 + 1 measuring container with HBW + CD + PHC, respectively. For bfr4, it was a 7 + 1 + 2 measuring container with HBW + CD + PHC, respectively. For bfr5, it was a 6 + 2 + 2 measuring container with HBW + CD + PHC, respectively. For bfr6, it was a 6 + 2.5 + 1.5 measuring container with HBW + CD + PHC, respectively (E). Bokashi fertilizer on day four of the experiment, undergoing semi-anaerobic decomposition with 3” PVC pipes, 1 m long each, vertically inserted into the double-bag sacks containing the mixture and providing the aeration needed at this stage of decomposition. (F) Bokashi fertilizer at the end of time 1 (seven days’ maturation).
Agronomy 12 00937 g001aAgronomy 12 00937 g001b
Figure 2. Summary of the bokashi fertilizer production process.
Agronomy 12 00937 g002
Figure 3. Effects of different bokashi fertilizer ratios on the bulk density. Bfr1 is the bokashi fertilizer ratio comprising of 80% HBW:0% CD:20% PHC. Bfr2 is the bokashi fertilizer ratio comprising of 80% HBW:10% CD:10% PHC. Bfr3 is the bokashi fertilizer ratio comprising 70% HBW:20%CD:10% PHC. Bfr4 is the bokashi fertilizer ratio comprising 70% HBW:10% CD:20% PHC. Bfr5 was the bokashi fertilizer ratio comprising 60% HBW:20% CD:20% PHC. Bfr6 was the bokashi fertilizer ratio comprising 60% HBW:25% CD:15% PHC.
Agronomy 12 00937 g003
Figure 4. Color and texture of different bokashi fertilizer ratios treated with EM4 after 30 days of maturation. (A) bfr1 (80% HBW:0% CD:20% PHC); (B) bfr2 (80% HBW:10% CD:10% PHC); (C) bfr3 (70% HBW: 20% CD: 10% PHC); (D) bfr4 (70% HBW:10% CD:20% PHC); (E) bfr5 (60% HBW:20% CD:20% PHC); (F) bfr6 (60% HBW:25% CD:15% PHC).
Agronomy 12 00937 g004
Figure 5. Interaction effects between bokashi fertilizer ratios and time of bokashi fertilizer maturation (days) on the C/N ratio. Bfr1 = (80% HBW:0% CD:20% PHC), bfr2 = (80% HBW:10% CD:10% PHC), bfr3 = (70% HBW:20% CD:10% PHC), bfr4 = (70% HBW:10% CD:20% PHC), bfr5 = (60% HBW:20% CD:20% PHC), bfr6 = (60% HBW:25% CD:15% PHC). HBW = horse bedding waste, CD = cow dung, PHC = paddy husk charcoal.
Agronomy 12 00937 g005
Figure 6. Interaction effects between bokashi fertilizer ratios and time of bokashi maturation (days) on the total C (%). Bfr1 = (80% HBW:0% CD:20% PHC), bfr2 = (80% HBW:10% CD:10% PHC), bfr3 = (70% HBW:20% CD:10% PHC), bfr4 = (70% HBW:10% CD:20% PHC), bfr5 = (60% HBW:20% CD:20% PHC), bfr6 = (60% HBW:25% CD:15% PHC). HBW = horse bedding waste, CD = cow dung, PHC = paddy husk charcoal.
Agronomy 12 00937 g006
Figure 7. Interaction effects of bokashi fertilizer ratios and time of bokashi maturation (days) on the cadmium content. Bfr1 = (80% HBW:0% CD:20% PHC), bfr2 = (80% HBW:10% CD:10% PHC), bfr3 = (70% HBW:20% CD:10% PHC), bfr4 = (70% HBW:10% CD:20% PHC), bfr5 = (60% HBW:20% CD:20% PHC), bfr6 = (60% HBW:25% CD:15% PHC). HBW = horse bedding waste, CD = cow dung, PHC = paddy husk charcoal.
Agronomy 12 00937 g007
Table 1. Microbial count of the effective microorganism-4 (EM4) solution.
Total Plate CountCells/mL
Phosphate solubilizing bacteria3.4 × 106
Lactobacillus bacteria3.0 × 105
Yeast1.95 × 103
Actinomycetes+
Photosynthetic bacteria+
Escherichia coli0
Salmonella0
Source: Manufacturer’s bottle (Figure 1C).
Table 2. Main and interaction effects of bokashi fertilizer ratios and time of bokashi fertilizer maturation on pH, EC, and CEC.
FactorspHEC (mS cm−1)CEC (Cmol kg−1)
BFR
bfr17.30 ± 0.050.27 ± 0.02 d15.34 ± 0.86 c
bfr27.28 ± 0.180.69 ± 0.07 c15.46 ± 1.69 bc
bfr37.35 ± 0.101.09 ± 0.10 b18.42 ± 1.03 ab
bfr47.55 ± 0.090.69 ± 0.07 c18.01 ± 0.93 abc
bfr57.39 ± 0.191.18 ± 0.11 b20.59 ± 0.60 a
bfr67.50 ± 0.161.51 ± 0.09 a19.66 ± 1.16 a
p-value0.5848<0.0001<0.0001
TMBF (days)
77.55 ± 0.05 a0.79 ± 0.10 b16.09 ± 0.70 b
307.24 ± 0.08 b1.02 ± 0.11 a19.73 ± 0.53 a
p-value0.00610.0003<0.0001
BFR × TMBF0.36290.68720.0562
Means followed by the same letter(s) in the same column are not significantly different (p > 0.05) using Tukey’s HSD at 5% ± standard error. EC = electrical conductivity, CEC = cation exchange capacity, BFR = bokashi fertilizer ratio. TMBF = time of maturation of bokashi fertilizer. bfr1 = (80% HBW:0% CD:20% PHC), bfr2 = (80% HBW:10% CD:10% PHC), bfr3 = (70% HBW:20% CD:10% PHC), bfr4 = (70% HBW:10% CD:20% PHC), bfr5 = (60% HBW:20% CD:20% PHC), bfr6 = (60% HBW:25% CD:15% PHC). HBW = horse bedding waste, CD = cow dung, PHC = paddy husk charcoal.
Table 3. Main and interaction effects of bokashi fertilizer ratios and time of bokashi fertilizer maturation on Ca, Mg, K, and Na contents.
FactorsCa (Cmol kg−1)Mg (Cmol kg−1)K (Cmol kg−1)Na (Cmol kg−1)
BFR
bfr18.28 ± 0.35 c4.23 ± 0.30 c6.98 ± 0.36 c1.32 ± 0.15 d
bfr214.01 ± 0.58 b7.15 ± 0.59 b9.73 ± 0.54 bc3.35 ± 0.23 c
bfr316.93 ± 1.01 a8.86 ± 0.32 a22.21 ± 0.79 a5.25 ± 0.11 ab
bfr414.15 ± 0.74 b7.39 ± 0.69 b10.51 ± 0.71 b3.18 ± 0.24 c
bfr515.52 ±0.26 ab8.58 ± 0.50 a20.26 ± 2.38 a4.79 ± 0.23 b
bfr615.29 ± 0.80 ab8.67 ± 0.55 a22.69 ± 1.11 a5.48 ± 0.33 a
p-value<0.0001<0.0001<0.0001<0.0001
TMBF (days)
714.20 ± 0.896.54 ± 0.41 b14.23 ± 1.65 b3.57 ± 0.37 b
3013.86 ± 0.618.42 ± 0.43 a16.56 ± 1.69 a4.22 ± 0.36 a
BFR × TMBF0.12640.39390.82850.8996
Means followed by the same letter(s) in the same column are not significantly different (p > 0.05) using Tukey’s HSD at 5% ± standard error. Ca = calcium, Mg = magnesium, K = potassium, Na = sodium, BFR = bokashi fertilizer ratio. TMBF = time of maturation of bokashi fertilizer bfr1 = (80% HBW:0% CD:20% PHC), bfr2 = (80% HBW:10% CD:10% PHC), bfr3 = (70% HBW:20% CD:10% PHC), bfr4 = (70% HBW:10% CD:20% PHC), bfr5 = (60% HBW:20% CD:20% PHC), bfr6 = (60% HBW:25% CD:15% PHC). HBW = horse bedding waste, CD = cow dung, PHC = paddy husk charcoal.
Table 4. Main and interaction effects of bokashi fertilizer ratios and time of bokashi fertilizer maturation on total N, total P, OC (%), and OM (%).
FactorsTotal N (%)Total P (%)OC (%)OM (%)
BFR
bfr10.59 ± 0.02 d0.055 ± 0.01d38.32 ± 1.54 a66.28 ± 2.66 a
bfr20.96 ± 0.07 c0.109 ± 0.01 c33.95 ± 0.98 ab58. 74 ± 1.70 ab
bfr31.25 ± 0.09 ab0.151 ± 0.01 ab32.95 ± 0.65 bc55. 98 ± 1.13 bc
bfr41.10 ± 0.07 c0.127 ± 0.01 bc30.87 ± 1.48 bc53.39 ± 2.57 bc
bfr51.33 ± 0.02 a0.161 ± 0.01 a30.45 ± 2.26 bc52.68 ± 3.92 bc
bfr61.38 ± 0.07 a0.179 ± 0.02 a28.15 ± 2.48 c48.69 ± 4.30 c
p-value<0.0001<0.00010.00010.0001
SE0.0380.00761.1932.064
TMBF (days)
70.99 ± 0.06 b0.112 ± 0.01 b34.78 ± 0.74 a60.16 ± 1.28 a
301.20 ± 0.07 a0.149 ± 0.01 a29.92 ± 1.29 b51.76 ± 2.23 b
p-value<0.0001<0.0001<0.0001<0.0001
BFR × TMBF0.07910.42860.30390.3041
Means followed by the same letter(s) in the same column are not significantly different (p > 0.05) using Tukey’s HSD at 5% ± standard error. N = nitrogen, p = phosphorus, OC = organic carbon, OM = organic matter. BFR = bokashi fertilizer ratio. TMBF = time of maturation of bokashi fertilizer, bfr1 = (80% HBW:0% CD:20% PHC), bfr2 = (80% HBW:10% CD:10% PHC), bfr3 = (70% HBW:20% CD:10% PHC), bfr4 = (70% HBW:10% CD:20% PHC), bfr5 = (60% HBW:20% CD:20% PHC), bfr6 = (60% HBW:25% CD:15% PHC). HBW = horse bedding waste, CD = cow dung, PHC = paddy husk charcoal.
Table 5. Main and interaction effects of bokashi fertilizer ratios and time of bokashi fertilizer maturation on some selected heavy metals.
FactorCd (mg/kg)Cr (mg/kg)Cu (mg/kg)Ni (mg/kg)Pb (mg/kg)
BFR
bfr10.08 ± 0.03 c7.63 ± 2.91 b9.53 ± 0.97 b1.05 ± 0.26 b7.83 ± 1.43
bfr20.42 ± 0.04 b17.40 ± 1.37 ab14.95 ± 0.62 a2.95 ± 0.17 ab10.70 ± 1.98
bfr30.57 ± 0.06 ab18.27 ± 2.64 ab16.30 ± 1.13 a3.82 ± 0.78 a8.90 ± 1.06
bfr40.68 ± 0.08 a20.78 ± 4.26 a17.18 ± 1.39 a3.67 ± 0.44 a9.47 ± 0.94
bfr50.60 ± 0.08 ab15.93 ± 1.94 ab16.78 ± 0.94 a4.20 ± 0.45 a10.20 ± 1.01
bfr60.70 ± 0.09 a16.10 ± 1.16 ab19.08 ± 1.07 a4.22 ± 0.13 a8.73 ± 1.13
p-value<0.00010.0462<0.00010.00030.5703
TMBF (days)
70.46 ± 0.05 b15.78 ± 1.4914.68 ± 0.73 b3.45 ± 0.36 8.62 ± 0.53
300.56 ± 0.07 a16.26 ± 1.9316.59 ± 1.03 a3.18 ± 0.359.99 ± 0.88
p-value0.02390.83290.02680.46950.1650
BFR × TMBF0.01020.42420.37810.57560.0581
Means followed by the same letter(s) in the same column are not significantly different (p > 0.05) using Tukey’s HSD at 5% ± standard error. Cd = cadmium, Cr = chromium, Cu = copper, Ni = nickel, Pb = lead. BFR = bokashi fertilizer ratio. TMBF = time of maturation of bokashi fertilizer, bfr1 = (80% HBW:0% CD:20% PHC), bfr2 = (80% HBW:10% CD:10% PHC), bfr3 = (70% HBW:20% CD:10% PHC), bfr4 = (70% HBW:10% CD:20% PHC), bfr5 = (60% HBW:20% CD:20% PHC), bfr6 = (60% HBW:25% CD:15% PHC). HBW = horse bedding waste, CD = cow dung, PHC = paddy husk charcoal.
Table 6. Germination bioassay for the bokashi fertilizers using cabbage seeds.
Number of Seed
Germinated in Bokashi Extract
Average Radicle Length (mm) in Bokashi ExtractGI (%)
Dish NoNo. seedSGoRLo25%50%75%100%25%50%75%100%90.1
110821069610.65.22.82
210612.397881.87.42.92.1
3106386842.47.82.62
41063.775582.15.41.71.7
5106577662.48.42.22.1
Total5032 (a)26 (b)4331 (w)36 (x)3219.334.2 (y)12.2 (z)9.9
SGo = Number of seeds germinated in distill water (control), RLo = Average radicle length from 10 seeds in each dish in the control, (a) = total number of seeds germinated in the control, (b) = total (of the average) radicle length of the germinated seeds in the control, (w) = number of germinated seeds in 50% bokashi extract, (x) = number of germinated seeds in 75% bokashi extract, (y) = total (of the average) radicle length of germinated seeds in 50% bokashi extract, (z) = total (of the average) radicle length of germinated seeds in 75% bokashi extract.
Publisher’s Note: MDPI stays neutral with regard to jurisdictional claims in published maps and institutional affiliations.

