Next Article in Journal
Importance of alcohol-related expectations and emotional expressivity for prediction of motivation to refuse alcohol in alcohol-dependent patients
Previous Article in Journal
Genetic factors associated with the development of age-related macular degeneration
 
 
Medicina is published by MDPI from Volume 54 Issue 1 (2018). Previous articles were published by another publisher in Open Access under a CC-BY (or CC-BY-NC-ND) licence, and they are hosted by MDPI on mdpi.com as a courtesy and upon agreement with Lithuanian Medical Association, Lithuanian University of Health Sciences, and Vilnius University.
Article

Contribution of mitochondria to injury of hepatocytes and liver tissue by hyperthermia

by
Rasa Žūkienė
1,
Zita Naučienė
1,
Giedrė Šilkūnienė
1,
Tomas Vanagas
2,
Antanas Gulbinas
3,
Aurelijus Zimkus
4 and
Vida Mildažienė
1,*
1
Faculty of Natural Sciences, Vytautas Magnus University, Kaunas, Lithuania
2
Department of Surgery, Medical Academy, Lithuanian University of Health Sciences, Kaunas, Lithuania
3
Institute for Digestive Research, Medical Academy, Lithuanian University of Health Sciences, Kaunas, Lithuania
4
Institute of Biosciences, Vilnius University Life Sciences Center, Vilnius, Lithuania
*
Author to whom correspondence should be addressed.
Medicina 2017, 53(1), 40-49; https://doi.org/10.1016/j.medici.2017.01.001
Submission received: 7 October 2016 / Revised: 15 December 2016 / Accepted: 2 January 2017 / Published: 9 January 2017

Abstract

:
Objective: The aim of this study was to investigate functional changes of liver mitochondria within the experimentally modeled transition zone of radiofrequency ablation and to estimate possible contribution of these changes to the energy status of liver cells and the whole tissue. Materials and methods: Experiments were carried out on mitochondria isolated from the perfused liver and isolated hepatocytes of male Wistar rats. Hyperthermia was induced by changing the temperature of perfusion medium in the range characteristic for the transition zone (38–52 °C). After 15-min perfusion, mitochondria were isolated to investigate changes in the respiration rates and the membrane potential. Adenine nucleotides extracted from isolated hepatocytes and perfused liver subjected to hyperthermic treatment were analyzed by HPLC. Results: Hyperthermic liver perfusion at 42–52 °C progressively impaired oxidative phosphorylation in isolated mitochondria. Significant inhibition of the respiratory chain components was observed after perfusion at 42 °C, irreversible uncoupling became evident after liver perfusion at higher temperatures (46 °C and above). After perfusion at 50–52 °C energy supplying function of mitochondria was entirely compromised, and mitochondria turned to energy consumers. Hyperthermia-induced changes in mitochondrial function correlated well with changes in the energy status and viability of isolated hepatocytes, but not with the changes in the energy status of the whole liver tissue. Conclusions: In this study the pattern of the adverse changes in mitochondrial functions that are progressing with increase in liver perfusion temperature was established. Results of experiments on isolated mitochondria and isolated hepatocytes indicate that hyperthermic treatment significantly and irreversibly inhibits energy-supplying function of mitochondria under conditions similar to those existing in the radiofrequency ablation transition zone and these changes can lead to death of hepatocytes. However, it was not possible to estimate contribution of mitochondrial injury to liver tissue energy status by estimating only hyperthermia-induced changes in adenine nucleotide amounts on the whole tissue level.

1. Introduction

Liver surgery remains the most effective method for treatment of hepatic malignancies. However, only a small proportion of these patients are candidates for liver resection. Systemic and regional chemotherapy provides only a slight survival improvement. Thermal ablation of liver tumors represents another option of treatment, based on local extreme hyperthermia [1,2]. Unfortunately, high rate of local recurrences is the major drawback for this otherwise safe procedure [3,4]. It is known that effects of hyperthermia on liver and tumor tissue are not homogeneous. Tissues are irreversibly damaged by high temperatures in the coagulation zone close to the thermal electrode where necrotic processes are initiated. The extent of injury decreases with distance from the heat source. The socalled transition zone is situated afar off the thermal electrode and is characterized by the less pronounced histological lesions of affected tissues. The local tumor recurrence is associated with this particular area. However, activation of apoptosis in this area was demonstrated [5], that might eventually lead to mortification of tissue in the transition zone. Apoptosis is ultimately dependent on energy and mitochondria play a major role supplying ATP required for the development of cell death [6]. Even mild hyperthermia (42–45 °C) strongly decreases efficiency of oxidative phosphorylation in cardiomyocytes [7], and in mitochondria isolated from heart [8] and liver [9,10,11]. Under stress conditions mitochondria can release proapoptotic proteins therefore their energy status is also important in triggering and regulating of apoptosis [6,12]. The aim of this study was to investigate how hyperthermia affects mitochondrial functions in hepatocytes within the experimentally modeled transition zone. In the earlier studies on the response of liver mitochondria to hyperthermia only the direct heating effects (i.e., changes induced by increased temperature of the medium for the measurement of respiratory functions in isolated mitochondria) were evaluated [9,10,11]. In contrast to previous reports, we estimated functions of mitochondria isolated from the liver tissue immediately after it was subjected to 15 min of hyperthermic perfusion. This allows to detect irreversible changes in mitochondrial performance induced by the hyperthermic tissue treatment, therefore such approach is more relevant for understanding the processes occurring in the liver tissue affected by thermoablation or other modes of hyperthermic treatment. Moreover, we combined experiments on subcellular, cellular and tissue levels aiming to gain more complete understanding about possible contribution of mitochondrial injury to changes in hepatocyte viability, cellular and tissue energy status. Therefore an additional purpose was to estimate how hyperthermia-induced changes in oxidative phosphorylation correlate with energy status of the liver cell and liver tissue as assessed by changes in the content of ATP and other adenine nucleotides in isolated hepatocytes and perfused liver. For modeling situation in the transition zone we used perfusion of rat liver with medium pre-heated in the range of temperatures characteristic to tissue in the transition zone (up to 52 °C) [5].

2. Materials and methods

2.1. Animals

The experiments were carried out on mitochondria isolated from the perfused liver of male Wistar rats. The permission No. 0155 was obtained from the Ethics Committee of the laboratory animals’ usage at the Lithuanian State Food and Veterinary Service. The animals were acclimated to 22 °C and a 12-h light–dark cycle (lights on at 08:00) and had free access to water and a standard chow diet.

2.2. Materials

All reagents used in this study were analytical grade obtained from Sigma–Aldrich (Taufkirchen, Germany) except for tetrabutylammonium bromide obtained from Acros Organics (New Jersey, USA); pentobarbital, from Vetoquinol (Buckingham, UK); ketamine, from Gedeon Richte (Budapest, Hungary); and HPLC-grade acetonitrile and chloroform, from Scharlau Chemie (Sentmenat, Spain).

2.3. Liver perfusion

After pre-narcosis with, CO2 rats were anesthetized with a combination of intraperitoneal injection of sodium pentobarbital (40 mg/kg body weight) and intramuscular injection of ketamine (100 mg/kg body weight). The peritoneal cavity was opened with the cross-abdominal incision, and 1.5 IU/kg heparin was injected to the inferior vena cava. After cannulation of the portal vein of the mobilized liver, inferior vena cava and aorta were transected. The liver was perfused manually through portal vein with 20 mL of Krebs-Ringer solution with EGTA (120 mM NaCl, 24 mM NaHCO3, 20 mM glucose, 5 mM HEPES, 4.8 mM KCl, 1.2 mM MgSO4, 1.2 mM KH2PO4 and 0.1 mM EGTA, pH 7.4) for removal the blood and clots. Liver was removed and transferred into a thermostatic vessel and perfused with oxygenated (95% O2, 5% CO2) Krebs-Ringer solution with EGTA at the flow rate of 7 mL/min for 7 min. Then perfusion solution was changed to Krebs-Ringer buffer solution with Ca2+ (120 mM NaCl, 24 mM NaHCO3, 20 mM glucose, 5 mM HEPES, 4.8 mM KCl, 1.2 mM MgSO4, 1.2 mM KH2PO4, 1.4 mM CaCl2, pH 7.4) and perfusion continued for 8 min. The temperature of both perfusion buffers was adjusted to the same temperature value (38, 40, 42, 46, 48, 50, 52 °C) for each experiment (4–8 perfusion experiments were performed for every temperature point), thus the total duration of perfusion at certain temperature was 15 min. The temperature for the control experiments of liver perfusion in this study was 38 °C, taking into account the determined physiological temperature of rat liver [13]. Immediately after perfusion approximately 1 g of liver tissue was excised, frozen in liquid nitrogen, weighted and subjected for the extraction of adenine nucleotides. Remaining liver tissue was placed into ice-cold 0.9% KCl and used for the isolation of mitochondria.

2.4. Isolation of mitochondria

Mitochondria were isolated as described previously [14]. The tissue was cut into small pieces and homogenized in a glassTeflon homogenizer. Homogenization medium contained 250 mM sucrose, 10 mM Tris, 3 mM EGTA and 2 mg/mL bovine serum albumin (BSA) (pH 7.7, 2 °C). The homogenate was centrifuged at 750 × g for 5 min, and then the supernatant was centrifuged at 6800 × g for 10 min. The mitochondrial pellet was re-suspended in a suspension buffer containing 180 mM KCl, 20 mM Tris, 3 mM EGTA (pH 7.3, 2 °C) and centrifuged again. The mitochondrial pellet was again re-suspended in a suspension buffer and stored on ice. The protein concentration was determined by the biuret method using BSA as a standard [15].

2.5. The measurement of mitochondrial respiratory rate and membrane potential

Mitochondrial respiratory rate and membrane potential (Δψ) were measured in a closed, stirred and thermostated 1.5 mL glass vessel equipped with Clark-type oxygen electrode (Rank Brothers Ltd., England) and TPP+ (tetraphenylphosphonium)sensitive electrode allowing simultaneous monitoring of Δψ and mitochondrial respiration.
The assay medium contained 20 mM Tris, 5 mM KH2PO4, 110 mM KCl, 2.3 mM MgCl2, 50 mM creatine, 0.1 mg/mL (0.2 IU/ mL) creatine phosphokinase, pH 7.2. Excess of creatine kinase (0.1 mg/mL) was added to maintain steady state respiration [16]. The experiments were performed using 1 mM pyruvate plus 1 mM malate or 0.5 mM succinate as the respiratory substrate. Mitochondria (0.3 mg protein/mL) were incubated in the assay medium with the respiratory substrate (state 2) for 3 min at 38 ± 0.1 °C. State 3 respiration was initiated by adding 1 mM ATP. Creatine phosphokinase catalyzes the phosphorylation of creatine by using ATP, and constantly maintains high concentration of ADP in the assay medium. Therefore, such an experimental system in the stationary conditions determines the maximum rate of the mitochondrial respiration [16]. The rate of mitochondrial respiration in state 2 (V2), state 3 (V3) and the respiratory control index (RCI = V3/V2) are defined according to the conventional terminology [17]. The maximum activity of the mitochondrial respiratory chain was assessed by registering the oxygen consumption in the presence of 0.34 μM uncoupler carbonyl cyanide m-chloro-phenyl hydrazone (CCCP). The concentration of molecular oxygen dissolved in the assay medium at 37 °C was determined polarographically using glucose oxidase reaction as described previously [8] and was 394.6 μmol O/L. The mitochondrial respiratory rate is expressed in nmol O/min per 1 mg of mitochondrial protein.
Before each measurement of the membrane potential the TPP+-sensitive electrode was calibrated by small additions of TTPCl solution to a final concentration of 267 nM. Δψ was calculated from the distribution of TPP+ using Nernst equation and TPP+ binding correction factor of 0.162 μL/mg protein [18]. The effects of hyperthermia on mitochondrial respiratory chain and inner membrane proton permeability were distinguished by partial modular kinetic analysis (described in detail in [8,18]), namely, by measuring the kinetic dependence of proton leak on Δψ and titrating the flux through the respiratory module with rotenone (0–0.08 nmol/mg mitochondrial protein) when the phosphorylation was fully blocked by addition of oligomycin excess (2 μg/mg mitochondrial protein).

2.6. Isolation of hepatocytes

Hepatocytes were isolated using two-step collagenase perfusion [19]. The animals were killed and the liver was quickly removed and placed in the thermostatic vessel. The liver was perfused through vena cava with oxygenated (95% O2, 5% CO2) Krebs-Ringer solution with EGTA (120 mM NaCl, 24 mM NaHCO3, 20 mM glucose, 5 mM HEPES, 4.8 mM KCl, 1.2 mM MgSO4, 1.2 mM KH2PO4 and 0.1 mM EGTA, pH 7.4) in order to remove the blood and clots. Afterwards liver was perfused with Krebs-Ringer buffer solution with Ca2+ and collagenase IV (120 mM NaCl, 24 mM NaHCO3, 20 mM glucose, 5 mM HEPES, 4.8 mM KCl, 1.2 mM MgSO4, 1.2 mM KH2PO4, 1.4 mM CaCl2, 156 IU/mL collagenase IV, pH 7.4) for 15 min. After perfusion the liver was placed in a beaker with 20 mL of Krebs-Ringer buffer (4 °C), the capsule was cut and cells were dispersed by aspirating with a large-bore pipet. Suspension was filtered through a 70 μm cell strainer into a centrifuge tube with 25-mL Krebs-Ringer buffer with 2% BSA (4 °C) and centrifuged at 50 × g for 5 min (4 °C). Cell pellet was resuspended in 30 mL Krebs-Ringer buffer with 2% BSA by inverting tube and centrifuged again. This procedure was repeated 3 times. After final centrifugation cells were resuspended in 10-mL Krebs-Ringer buffer with 2% BSA. Initial cell suspension viability determined by trypan blue was more than 80%.

2.7. Incubation of hepatocytes

After isolation and cell counting hepatocyte suspension in Krebs-Ringer buffer was aliquoted into separate preheated tubes and incubated for 15 min at different temperatures (38, 40, 42, 45, 46, 50, 52 °C) in water bath. Immediately after incubation cells were subjected for cell counting and isolation procedure of adenine nucleotides.

2.8. Extraction of adenine nucleotides from hepatocytes

Immediately after incubation of hepatocyte suspension at different temperatures (38, 40, 42, 45, 46, 50, 52 °C) for 15 min, the suspension was aliquoted to 106 cells per tube and centrifuged at 1000 × g for 3 min (4 °C). The supernatant was discarded and the extraction procedure was performed as described previously [20] with minor changes. Briefly, cells were lysed with 1 mL of ice cold 0.5 M KOH. Samples were incubated on ice for 3 min, then 840 μL of sample was mixed with 170 μL of 8.5% H3PO4 and incubated on ice for 3 min. After incubation the extract was cleared by 3-min centrifugation at 1000 × g (4 °C). Supernatant was filtered through the syringe filter with 0.2 μm pore diameter PVDF membrane. Prepared samples were kept at −80 °C and analyzed within 48 h.

2.9. The extraction of adenine nucleotides from the perfused liver tissue

Immediately after perfusion approximately 1 g of the liver tissue was excised, frozen in liquid nitrogen and weighted. The extraction procedure was performed as described previously [21]. A first 120-s homogenization was performed with 7 mL of ice-cold precipitating solution composed of CH3CN + 10 mM KH2PO4, pH 7.4 (3:1; v:v), using a Ultra-Turrax set at 24 000 rpm/ min (Janke & Kunkel, Staufen, Germany). The precipitating solution was prepared weekly and its pH (7.4) was checked immediately before use. After centrifugation at 20 690 × g, for 10 min at 4 °C, the clear supernatant was saved; pellets were supplemented with 3 mL of the precipitating solution and homogenized again as described above. A second centrifugation was performed (20 690 × g, for 10 min at 4 °C), pellets were saved, and supernatant combined with that previously obtained, extracted by vigorous agitation with a double volume of CHCl3, and centrifuged as above. The upper aqueous phases (containing water-soluble low-molecular-weight compounds) were collected, subjected to CHCl3 washings for two more times (this procedure allowed the removal of all the organic solvent and any lipid soluble compound from the buffered tissue extracts) and stored at −80 °C.

2.10. HPLC analysis of adenine nucleotides

Tissue extracts were filtered through a 0.2-μm PVDF filter and then assayed by ion pairing HPLC for the simultaneous separation of AMP, ADP and ATP. HPLC analysis was performed using Agilent 1200 Series system, consisting of diode array detector, manual injector with 50-μL loop, vacuum degasser, quaternary pump, symmetry 3.5 μm, 4.6 × 100 mm column with precolumn (Waters Corporation, USA) and ChemStation software for data processing (Agilent Technologies, USA). The conditions of chromatographic analysis were column temperature of 25 °C and injection volume of 50 μL. There were the following eluents: A, 10 mM KPi (pH 5), 2 mM TBA (tetrabutylammonium bromide), 3% acetonitrile; and B, 10 mM KPi (pH 7.5), 2 mM TBA, 30% acetonitrile. The following gradient elution was used: B 0 min, 1%; 30 min, 95%; and 32 min, 1%. Detection wavelength was 259 nm. AMP, ADP, and ATP in the samples were identified by comparison with retention times of the standards. The concentrations of analytes were determined from peak area using the external standard (0–20 μM) method.

2.11. Statistical analysis

Data are presented as means of 3–8 independent experiments ± standard error. The means of each individual experiment with the same mitochondrial preparation were obtained repeating each measurement for 3 times. Statistical significance of the temperature effects was evaluated using the Student t test (unpaired). The differences were assumed to be statistically significant at P < 0.05.

3. Results

3.1. Effect of hyperthermic liver perfusion on respiration in isolated mitochondria

We assessed the effect of liver perfusion for 15 min at different temperatures on the functional activity of isolated mitochondria. The rate of mitochondrial respiration was estimated at 37 °C in metabolic states 2 (V2), 3 (V3) using two oxidation substrates – succinate (Fig. 1A) or pyruvate + malate (Fig. 1B). The rate of mitochondrial respiration in the ‘‘uncoupled’’ state (VCCCP) was also recorded with both substrates (Fig. 1). Liver perfusion at 40 °C (physiological hyperthermia or fever range) did not induce statistically significant changes in mitochondrial respiration with pyruvate + malate and succinate. However, suppression of V3 and VCCCP (but not V2) was obvious when perfusion temperature was increased from 38 to 42 °C, and this effect on V3 was similar for both substrates: V3 decreased by 41% oxidizing succinate, and by 38% oxidizing pyruvate + malate (P < 0.05). Induced changes in V3 are reflected in significantly reduced RCI value: from 3.3 to 2.1 for succinate and from 4.7 to 3.1 for pyruvate + malate (38 °C compared to 42 °C, respectively), indicating lowered efficiency of oxidative phosphorylation. After 15 min perfusion at 46 °C, V3 decreased much stronger – by 61% and 65%, while V2 was significantly reduced also by 40% and 36% (P < 0.05), and RCI was 2.0 and 2.3, oxidizing succinate and pyruvate + malate, respectively. Perfusion at 50 °C caused threefold decrease in V3 oxidizing succinate, and more than four-fold – oxidizing pyruvate + malate, however V2 did not differ from the control (perfusion at 38 °C) for both substrates.
The ‘‘uncoupled’’ respiratory rate VCCCP with succinate at 38 °C perfusion was by 48% higher than V3 (Fig. 1A), however, there was no such difference between VCCCP and V3 for the rates of pyruvate + malate oxidation (Fig. 1B). That indicates much higher contribution of phosphorylation subsystem to the control of respiration in mitochondria oxidizing succinate when compared to that of pyruvate + malate.
The obtained results (Fig. 1) revealed that both VCCCP and V3 are extremely sensitive to short hyperthermic perfusion, and decrease of the uncoupled respiratory rate is similar or stronger for oxidation of succinate compared to pyruvate + malate (46% after perfusion at 42 °C for both substrates, and 68% and 58% after perfusion at 46 °C, respectively). These results indicate that hyperthermic perfusion starting from 42 °C significantly inhibits activity of mitochondrial respiratory chain. In the higher range of tested liver perfusion temperatures (50–52 °C) the rates V2, V3 and VCCCP were equal (RCI values were 1.1 and 1.2 for succinate and pyruvate + malate oxidation), indicating entirely compromised function of isolated mitochondria.

3.2. Effect of hyperthermia on mitochondrial membrane potential (Δψ)

The dependence of Δψ on temperature of liver perfusion medium in isolated mitochondria respiring with pyruvate + malate is presented in Fig. 2. Despite significant decrease in V3 induced by liver perfusion at 42 °C, membrane potential in metabolic state 3 decreased only by 2 ± 0.3 mV. This may indicate that hyperthermic perfusion inhibits not only the activity of mitochondrial respiratory chain complexes, but also the activity of Δψ-consuming phosphorylation subsystem. After perfusion at 46 °C Δψ decreased significantly – by 22 ± 1.5 mV in state 2, and by 17 ± 2 mV in state 3. Further increase in the perfusion temperature to 52 °C led to lower Δψ values in state 2 as compared to state 3 (Fig. 2), implying that mitochondria do not phosphorylate under these experimental conditions considered as metabolic state 3. Even more, a less significant effect of hyperthermic perfusion on Δψ in state 3 indicates to ability of ATP-synthase to generate Δψ by hydrolyzing ATP in de-energized mitochondria.

3.3. Effect of hyperthermia on mitochondrial membrane permeability

The influence of different effectors on permeability of mitochondrial inner membrane to ions is usually assessed by evaluating induced changes to V2, however, this method is feasible for effectors targeting membrane permeability only, but not for such multisite effector as hyperthermia [8]. Hyperthermic perfusion at 42–48 °C significantly diminished V2. Membrane potential in state 2 was also decreased at these temperatures (Fig. 2), however possible increase in membrane leak could be masked by inhibition of the respiratory chain, clearly evidenced by the decrease in VCCCP (Fig. 1). The resulting drop in Δψ (Fig. 2) may be caused by the sum of two effects: impairment of the respiratory chain and uncoupling (increase in the membrane permeability to protons). Aiming to distinguish these two effects, we compared the kinetic dependencies of the membrane leak on Δψ in mitochondria isolated from liver perfused at different temperatures (Fig. 3). The displacement of kinetic curves (when comparing a respiratory flow at the same membrane potential) can indicate the impact of effector (e.g., perfusion temperature) on a subsystem of membrane leak [8,15].
The results showed that perfusion at 40 and 42 °C did not affect kinetic dependence of membrane leak on Δψ (Fig. 3). Obvious shift of the kinetic dependence indicating decreased respiratory flow at the same Δψ was observed after perfusion at 46 °C: e.g., the rate of oxygen consumption at Δψ = 127.5 mV was 70% higher at 46 °C in comparison to 38 °C. Liver perfusion at 48 °C led to much stronger increase in the membrane permeability (oxygen consumption rate at Δψ = 127.5 mV increased by 136% in comparison to the control). Further increase in liver perfusion temperature to 52 °C did not cause additional shift in the kinetic curve, as compared to 48 °C.

3.4. Effect of hyperthermia on viability of isolated hepatocytes

We estimated the effects of direct hyperthermic incubation on viability of isolated hepatocytes. The obtained results (Fig. 4) showed that viability of hepatocytes after 15 min incubation in the range 38–45 °C is the same. Hyperthermic incubation at 46 °C caused only slight decrease in hepatocyte viability, whereas after incubation at 50 °C viability was reduced by 50%. Increase of incubation temperature to 52 °C caused further drastic loss of viability (to 22%). Finally, there were no viable hepatocytes detected after incubation at 55 °C.

3.5. Effect of hyperthermia on the amount of adenine nucleotides in isolated hepatocytes

Aiming to determine impact of hyperthermia-induced changes in mitochondrial activity on energy balance in the liver cell, we measured amounts of AMP, ADP and ATP in the extracts prepared from the isolated hepatocytes after their incubation for 15 min in the medium at temperatures in the range 38–50 °C.
The obtained results (Table 1) show rather high amount of AMP and low ATP/ADP ratio in hepatocytes incubated at 38 °C. Hyperthermic incubation at 40 and 42 °C caused significant and similar reduction in the amounts of both ATP (almost by 40%) and ADP (by 30%), but not AMP, and total amount of adenine nucleotides (ATP + ADP + AMP) was reduced by 19% only after incubation at 42 °C. Only slight drop in ATP/ADP ratio was induced by hyperthermic incubation at 40 and 42 °C (from 0.29 in the control to 0.26 at 40 °C and 0.24 at 42 °C). However, rise in the incubation temperature to 45 °C led to more significant reduction in the total adenine nucleotide pool (by 38%), and amount of ATP was decreased more than ADP (by 76 and 65% respectively), so that ATP/ADP ratio dropped below 0.2. ATP was almost entirely lost (only 2% remained) and ADP reduced by 80% after incubation at 50 °C (ATP/ADP ratio 0.026) indicating severe loss of hepatocyte energy resources.

3.6. Effect of hyperthermic perfusion on the amounts of adenine nucleotides in the liver tissue

Concentrations of AMP, ADP and ATP were determined in the extracts of perfused liver. The concentrations were recalculated to nmol per g of liver tissue and presented in Table 2. The obtained results show complicated pattern of changes in the content of adenine nucleotides after hyperthermic perfusion of the liver tissue. After perfusion at 46 °C total amount of adenine nucleotides increased by 68% when compared to the controls (perfusion at 38 °C): concentrations of all adenine nucleotides increased substantially, and the most prominent change was 2-fold increase in AMP concentration (the amount of ADP increased by 47%, ATP – by 26%).
Perfusion at 46 °C resulted in even larger (by 108%) accumulation of total adenine nucleotide pool, but rise in ATP and ADP amount (by 273% and 115%, respectively) dominated at this temperature. ATP/ADP ratio in the tissue was much higher after perfusion at 48 and 50 °C (0.98 and 0.72, respectively) in comparison to that in other experimental groups.
However, further rise in the perfusion temperature to 50 °C brought out less drastic changes – total amount of adenine nucleotides increased by 45% with the main contribution of ATP changes (ATP/ADP was 0.72). Finally, after perfusion at 50 °C amounts of all adenine nucleotides came back to values similar for the control tissue (perfused at 38 °C).

4. Discussion

The choice of the range of liver perfusion temperatures used in this study was based on temperature fluctuations determined in the transition zone of the liver tissue during radiofrequency ablation [5,
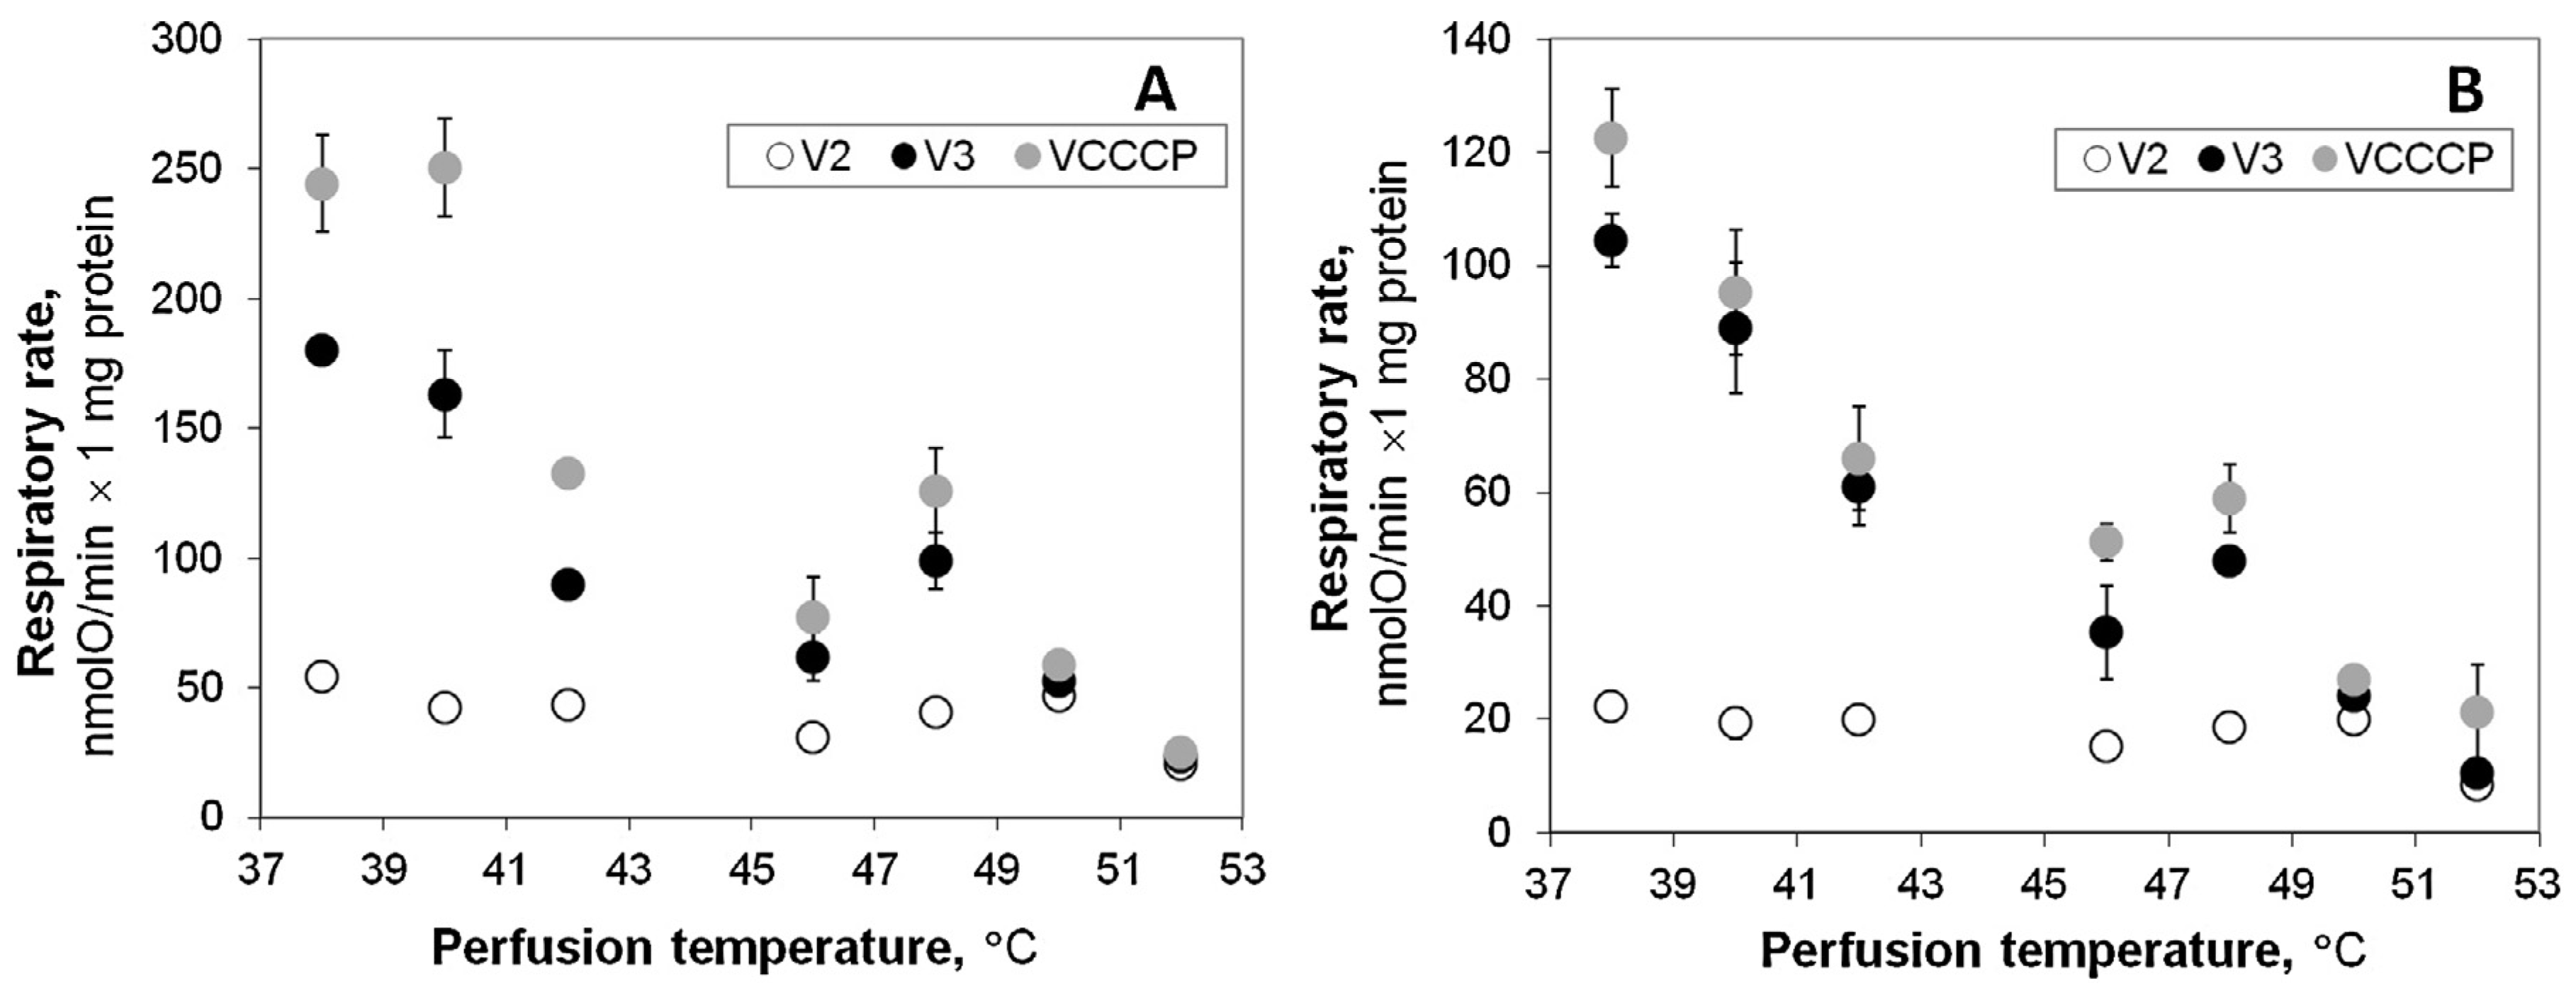
22] – temperatures were shown to increase up to 44–50 °C in the transition zone, which is considered as potentially responsible for the local tumor recurrence. In this study we used experimental model of hyperthermic liver perfusion to estimate how such changes in temperature may affect function of mitochondria and energy status of the healthy tissue. We compared respiration rates registered in mitochondria isolated both from liver subjected to relatively short (15 min) normothermic (38 °C) and hyperthermic (40– 52 °C) perfusion. The obtained results show the absence of differences in respiration of mitochondria isolated from liver after perfusion at 40 and at 38 °C (control). However, increase of the perfusion temperature to 42 °C caused obvious irreversible injury of oxidative phosphorylation: the activity of the respiration in isolated mitochondria respiring with pyruvate + malate or with succinate was significantly inhibited (Fig. 1). The observed decrease in VCCCP clearly shows the impaired function of the respiratory chain, while the stable value in membrane potential in state 3 (Fig. 2) can also indicate possible inhibition of the phosphorylation subsystem components. Liver perfusion at 42 °C did not affect permeability of the inner mitochondrial membrane (Fig. 3). Such effect became evident only after liver perfusion at 46 °C together with the progressive inhibition of the respiratory subsystem – both these effects led to the substantial drop (about 20 mV) in Δψ (Fig. 2) both in state 2 and state 3. Further increase in perfusion temperature to 48 °C had strong uncoupling effect (Fig. 3), and severely compromised mitochondrial respiration (Fig. 1). At 50–52 °C liver mitochondria completely lost their energetic functions (RCI values close to 1), and may even hydrolyze ATP leading to the depletion of cellular energetic resources.
The results indicating uncoupling of oxidative phosphorylation by direct hyperthermia (when heating was applied in mitochondrial respiration chamber) were reported earlier by us and other authors [9,10,11]. There was only some discrepancy concerning the lowest range of uncoupling temperature – there was no change in ADP/O ratio detected in liver mitochondria respiring on b-hydroxybutyrate and succinate at 40 °C by the most early study [23], whereas small but statistically significant V2 increase was reported at this temperature in liver mitochondria oxidizing pyruvate + malate [11]. The obtained results indicate that even if direct hyperthermia might lead to some uncoupling at 40 °C [11], such effect is reversible as it is not observed in our experimental model (Fig. 1). Obvious uncoupling effect (increase in V2) in the higher range of direct hyperthermia (42 and 43 °C) was reported [10,11], however we did not register V2 increase in liver mitochondria isolated after hyperthermic liver perfusion at 42 °C (Fig. 1). Instead, this model provided evidence for twice stronger and irreversible suppression of the respiratory chain activity as compared to the direct mitochondrial heating model [11], and this difference at least partially may be explained by a longer duration of hyperthermic treatment (15 min in this study versus 7 min [11]). Thus, the experimental model used in this study allowed to demonstrate that inhibition of the respiratory chain by hyperthermia is irreversible and that contribution of this effect to the loss of the efficiency of oxidative phosphorylation in liver upon mild hyperthermic condition (42 °C) can be far more important than impact of the mostly possibly reversible increase in the membrane permeability.
We have shown previously, that isolated heart mitochondria responded with increased V2 to heating of their respiration medium in the range from 42 to 48 °C, indicating an increased membrane permeability [8]. In line with these observations, strong uncoupling of oxidative phosphorylation with ATP synthase reversal was reported in mitochondria isolated from the heart subjected to hyperthermic perfusion at 43 °C [24]. Uncoupling was also significant but much less pronounced in isolated rat liver mitochondria, but statistically significant V2 increase was observed at lower temperature – 40 °C [11].
The response of mitochondria isolated from the liver subjected to hyperthermic perfusion was different in comparison to direct response of isolated mitochondria [11], namely, the perfusion did not cause increase in V2 (Fig. 1). This difference may be explained by three possible reasons: (1) mitochondrial membrane permeability increases only when mitochondria are exposed to hyperthermic treatment in vitro (‘‘direct’’ hyperthermia), but not in the perfused liver; (2) hyperthermia-induced changes in V2 are reversible, therefore they are observable only upon direct hyperthermic treatment in the polarographic chamber but not in mitochondria isolated from the liver subjected to hyperthermic perfusion; (3) hyperthermia causes strong inhibition of the respiratory chain, evidenced by the substantial drop both in V3 and Δψ, and the latter effect is masking increase in the membrane permeability – at lower Δψ values of V2 are much lower despite increased membrane leak. The data presented in Fig. 3 provide evidence that mitochondrial membrane permeability was irreversibly increased starting from perfusion at 46 °C, implying that inhibition of the respiratory chain is prevailing effect of hyperthermia at 42 °C, but in the higher range of temperatures this effect is supplemented by the substantial increase in the membrane permeability.
The published data indicates that the components of the oxidative phosphorylation system are quite resistant to heat denaturation [25,26,27,28,29,30]. In the environment of lipids the thermodenaturation of complex III was observed at 64 °C [25]; complex IV, at 63 °C [26,27]; cytochrome C, at 80 °C [28]; and ATP synthase, at 70 °C [29] or 60 °C [30]. Mitochondrial respiration with succinate and pyruvate + malate in the uncoupled state was inhibited to similar extent by hyperthermic perfusion, indicating that thermal sensitivity of the respiratory chain Complex I is not very important for the observed effects. Therefore, it is unlikely that all mentioned proteins may start melting at 45 °C, subsequently leading to a loss of the respiratory chain activity. However, the activity of the enzymes imbedded in the mitochondrial membrane is highly dependent on the adjacent environment of the membrane lipids. The membrane structures formed from the lipids are most sensitive to hyperthermia compared to other cellular structures, i.e. even mild hyperthermia initiates changes in physical properties of cellular membranes [31]. Complex phase transition in isolated rat liver mitochondria starting from physiological and going up to higher temperatures was reported [14]. The changes of lipid–protein interactions may explain non-specific effects of the relatively short hyperthermia on biological functions of various proteins. In addition, hyperthermia at 45 °C results in significant increase in the permeability to ions of plasma and intracellular membranes in mammalian cells, leading to a substantial ion imbalance and Ca2+ overload [32,33]. It might have additional adverse effects on the activity of various enzymes. The results of Δψ measurements (Fig. 3) indicate that reversal of ATP synthase in mitochondria isolated from the perfused liver requires higher perfusion temperatures (50–52 °C) in comparison to the similar situation in the perfused heart (43 °C) [24].
Experiments for the estimation of effects of hyperthermic incubation on viability of isolated hepatocytes (Fig. 4) were performed aiming to evaluate potential importance of mitochondrial injury for hepatocyte survival. The results revealed that viability of hepatocytes is not affected by hyperthermic incubation up to 45 °C, despite quite substantial impairment of mitochondrial respiratory function at 42 °C (Fig. 1). Low ATP/ ADP ratio detected in isolated hepatocytes (Table 1) strongly favors stimulation of glycolytic energy production [34], therefore partial decrease in mitochondrial energy production may be not crucial for energy supply in these cells. Only more severe hyperthermia (46 °C and above) causing both uncoupling (Fig. 3) and progressive inhibition of the respiratory chain (Fig. 1) correlated with substantially compromised energy status (Table 1) and reduced viability of hepatocytes (Fig. 4). Furthermore, both energy status (Table 1) and viability of hepatocytes was strongly compromised at 50–52 °C, under conditions when the reversal of mitochondrial ATP synthase activity may cause depletion of all cellular energy resources, including ATP obtained from glycolysis.
Thus, the obtained results on mitochondrial response to hyperthermia are consistent with changes in viability and energy resources of hepatocytes. However, it was more complicated to connect the observed changes in mitochondrial functions with changes in the amounts of adenine nucleotides detected in the perfused liver tissue (Table 2). Only several tendencies characteristic for isolated hepatocytes were kept in the liver tissue as well, e.g., high AMP amount and low ATP/ADP ratio after perfusion at 38 °C, and this may reflect situation in the tissue relying mostly on glycolytic energy supply [34,35]. Our results (Table 2) demonstrate that increase in perfusion temperature to 46–50 °C leads to the substantially increased total amount of adenine nucleotides in the liver tissue as compared to the controls (perfusion at 38 °C), and this effect was opposite to the tendency observed in experiments on isolated hepatocytes (Table 1). It is important to note, that adenine nucleotide amounts presented in Table 2 are averaged values for all tissue parts and hardly reflect energy status inside hepatocytes. The increased amount of ATP to some extent might be associated with the inhibition of ATP consumption processes in liver cells. On the other hand, these unexpected observations may be explained by very complex interaction of various cell types, enzymes and events occurring at the same time inside cells, within the intercellular matrix, in vascular interface and in the interior of blood vessels. The discovery of the regulated release of different nucleotides from various cell types has been met very skeptically; however, these phenomena were proved as universal and now are finally accepted [36,37,38]. Cellular nucleotides are released to the extracellular milieu in a regulated manner to accomplish extracellular signaling and under stress conditions such release is massively stimulated. The transporters mediating reabsorption of nucleotides back to the cells were also described [37]. The question how hyperthermia affects enzymes and transporters involved in the release (or reabsorption) of nucleotides from various cell types (or extracellular milieu) and how nucleotides are distributed among cells and tissue compartments deserves future investigations. Our results indicate that stress caused by hyperthermia interferes with multiple processes in liver tissue and leads to substantial changes in the amounts of adenine nucleotides in the liver tissue. However, we do not have sufficient information on the nature of these changes; therefore, it is not possible to directly associate the observed impairment of mitochondrial functions to changes in the tissue adenine nucleotide levels and energy status. The remarkable increase in ATP amount in tissue and inside liver cells may be in favor for self-destruction process (apoptosis) requiring energy resources. Decreased ATP consumption and inhibition of ATP synthesis at higher temperatures can be mark of the beginning of cell death. The above events are substantiated by our recent report, demonstrating that apoptosis is activated in the majority of cells in the transition zone, where temperature ranged from 42.8 to 48.9 °C [5]. The comparative investigations of the response of normal hepatocytes and transformed cancerogenic cells in this range of hyperthermia could be helpful for evaluating the recurrence potential in the transition zone.

5. Conclusions

In this study the pattern of the adverse changes in mitochondrial functions that are progressing with increase in liver perfusion temperature was established. Hyperthermic liver perfusion at 42–52 °C progressively impaired oxidative phosphorylation in isolated mitochondria: (1) increase of the perfusion temperature to 42 °C and above caused significant inhibition of the respiratory chain components; (2) effect of irreversible uncoupling was evident after liver perfusion at higher temperatures (46 °C and above); (3) after perfusion at 50–52 °C energy supplying function of mitochondria was entirely compromised, even more, mitochondria behave as energy consumers. Hyperthermia-induced changes in mitochondrial function correlated well with changes in the energy status and viability of isolated hepatocytes, but not with the changes in the energy status of the whole liver tissue. Significant and irreversible inhibition of energy supplying function of mitochondria in hepatocytes situated within the experimentally modeled transition zone can lead to the death of hepatocytes. The experimental model of the whole tissue is far more complex, therefore estimation of hyperthermia-induced changes in the energy status in the damaged tissue do not allow to assess directly possible contribution of mitochondrial impairment to the events in the thermoablation transition zone.

Conflicts of Interest

The authors state no conflict of interest.

Acknowledgments

This research was funded by the grant no. P-02/2007 from the Research Council of Lithuania.

References

  1. Trojan, J; Zangos, S; Schnitzbauer, AA. Diagnostics and treatment of hepatocellular carcinoma in 2016: standards and developments. Visc Med 2016, 32, 116–20. [Google Scholar] [CrossRef] [PubMed]
  2. Gervais, D; Arellano, R. Percutaneous tumor ablation for hepatocellular carcinoma. Am J Roentgenol 2011, 197, 789–94. [Google Scholar] [CrossRef] [PubMed]
  3. Garrean, S; Hering, J; Saied, A; Helton, WS; Espat, NJ. Radiofrequency ablation of primary and metastatic liver tumors: a critical review of the literature. Am J Surg 2008, 195, 508–20. [Google Scholar] [CrossRef] [PubMed]
  4. Pearson, AS; Izzo, F; Fleming, RY; Ellis, LM; Delrio, P; Roh, MS; et al. Intraoperative radiofrequency ablation or cryoablation for hepatic malignancies. Am J Surg 1999, 178(6), 592–9. [Google Scholar] [CrossRef]
  5. Vanagas, T; Gulbinas, A; Sadauskiene, I; Dambrauskas, Z; Pundzius, J; Barauskas, G. Apoptosis is activated in an early period after radiofrequency ablation of liver tissue. Hepatogastroenterology 2009, 56, 1095–9. [Google Scholar] [PubMed]
  6. Orrenius, S; Gogvadze, V; Zhivotovsky, B. Calcium and mitochondria in the regulation of cell death. Biochem Biophys Res Commun 2015, 460, 72–81. [Google Scholar] [CrossRef] [PubMed]
  7. Qian, L; Song, X; Ren, H; Gong, J; Cheng, S. Mitochondrial mechanism of heat stress-induced injury in rat cardiomyocyte. Cell Stress Chaperones 2004, 9, 281–93. [Google Scholar] [CrossRef] [PubMed]
  8. Zukiene, R; Nauciene, Z; Ciapaite, J; Mildaziene, V. Acute temperature resistance threshold in heart mitochondria: febrile temperature activates function but exceeding it collapses the membrane barrier. Int J Hyperthermia 2010, 26, 56–66. [Google Scholar] [CrossRef] [PubMed]
  9. Brooks, GA; Hittleman, KJ; Faulkner, JA; Beyer, RE. Temperature, liver mitochondrial respiratory functions, and oxygen debt. Med Sci Sports 1971, 3, 72–4. [Google Scholar] [CrossRef] [PubMed]
  10. Willis, WT; Jackman, MR; Bizeau, ME; Pagliassotti, MJ; Hazel, JR. Hyperthermia impairs liver mitochondrial function in vitro. Am J Physiol Regul Integr Comp Physiol 2000, 278, 1240–6. [Google Scholar] [CrossRef] [PubMed]
  11. Zukiene, R; Nauciene, Z; Degutytė-Fomins, L; Mildaziene, V. Gender-dependence of hyperthermia induced changes in respiration of rat liver mitochondria. Biologija (Vilnius) 2010, 56, 88–92. [Google Scholar] [CrossRef]
  12. Nijhuis, EHA; Le Gac, S; Poot, AA; Feiijnen, J; Vermes, I. Bax mediated mitochondrial membrane permeabilisation after heat treatment is caspase 2 dependent. Int J Hyperthermia 2008, 24, 357–65. [Google Scholar] [CrossRef] [PubMed]
  13. Birnie, JH; Grayson, J. Observations on temperature distribution and liver blood flow in the rat. J Physiol 1952, 116, I89–201. [Google Scholar] [CrossRef]
  14. Degutyte-Fomins, L; Zukiene, R; Maijorovaite, Z; Nauciene, Z; Mildaziene, V. Differential scanning calorimetry (DSC) analysis of isolated liver and heart mitochondria. Biologija 2008, 54(3), 167–70. [Google Scholar] [CrossRef]
  15. Gornal, AG; Bardawill, CJ; David, MM. Determination of serum proteins by means of the biuret reaction. J Biol Chem 1949, 177, 751–66. [Google Scholar]
  16. Kholodenko, B; Zilinskiene, V; Borutaite, V; Ivanoviene, L; Toleikis, A; Praskevicius, A. The role of adenine nucleotide translocators in regulation of oxidative phosphorylation in heart mitochondria. FEBS Lett 1987, 223, 247–50. [Google Scholar] [CrossRef]
  17. Chance, B; Williams, GR. Respiratory enzymes in oxidative phosphorylation. I. Kinetics of oxygen utilization. J Biol Chem 1955, 217, 383–93. [Google Scholar] [PubMed]
  18. Hafner, RP; Brown, GC; Brand, MD. Analysis of the control of respiration rate, phosphorylation rate, proton leak rate and protonmotive force in isolated mitochondria using the ‘top-down’ approach of metabolic control theory. Eur J Biochem 1990, 188, 313–9. [Google Scholar] [CrossRef] [PubMed]
  19. Seglen, PO. Preparation of isolated rat liver cells.1st ed. In Methods in cell biology, vol. 13, 1st ed.; Amsterdam; Eslevier, 1976; pp. 29–83. [Google Scholar]
  20. Degutytė-Fomins, L; Zukiene, R; Buzaite, O; Dzikas, P; Nauciene, Z; Mildaziene, V. Differentiation-related changes in myogenic stem cells. Biologija 2010, 56, 55–62. [Google Scholar] [CrossRef]
  21. Lazzarino, G; Amorini, AM; Fazzina, G; Vagnozzi, R; Signoretti, S; Donzelli, S; et al. Single-sample preparation for simultaneous cellular redox and energy state determination. Anal Biochem 2003, 322, 51–9. [Google Scholar] [CrossRef] [PubMed]
  22. Barauskas, R; Gulbinas, A; Barauskas, G. Investigation of radiofrequency ablation process in liver tissue by finite element modeling and experiment. Medicina (Kaunas) 2007, 43, 310–25. [Google Scholar] [PubMed]
  23. Hinkle, PC; Yu, ML. The phosphorous/oxygen ratio of mitochondrial oxidative phosphorylation. J Biol Chem 1979, 254, 2450–5. [Google Scholar] [PubMed]
  24. Power, A; Pearson, N; Pham, T; Cheung, C; Phillips, A; Hickey, A. Uncoupling of oxidative phosphorylation and ATP synthase reversal within the hyperthermic heart. Physiol Rep 2014, 2, e12138. [Google Scholar] [CrossRef] [PubMed]
  25. Gwak, SH; Yu, L; Yu, CA. Studies of protein–phospholipid interaction in isolated mitochondrial ubiquinone-cytochrome c reductase. Biochim Biophys Acta 1985, 809, 187–98. [Google Scholar] [CrossRef]
  26. Arrondo, JL; Castresana, J; Valpuesta, JM; Goni, FM. Structure and thermal denaturation of crystalline and noncrystalline cytochrome oxidase as studied by infrared spectroscopy. Biochemistry 1994, 33, 11650–5. [Google Scholar] [CrossRef] [PubMed]
  27. Rigell, CW; Freire, E. Differential detergent solubility investigation of thermally induced transitions in cytochrome c oxidase. Biochemistry 1987, 26, 4366–71. [Google Scholar] [CrossRef] [PubMed]
  28. Shi, X; Takamizawa, A; Nishimura, Y; Hiraoka, K; Akashi, S. Thermal unfolding of proteins probed by laser spray mass spectrometry. Rapid Commun Mass Spectrom 2008, 22, 1430–6. [Google Scholar] [CrossRef] [PubMed]
  29. Villaverde, J; Cladera, J; Hartog, A; Berden, J; Padros, E; Dunach, M. Nucleotide and Mg2+ dependency of the thermal denaturation of mitochondrial F1-ATPase. Biophys J 1998, 75, 1980–8. [Google Scholar] [CrossRef]
  30. Wang, ZY; Freire, E; McCarty, RE. Influence of nucleotide binding site occupancy on the thermal stability of the F1 portion of the chloroplast ATP synthase. J Biol Chem 1993, 268, 20785–90. [Google Scholar] [PubMed]
  31. Despa, F; Orgill, DP; Neuwalder, J; Lee, RC. The relative thermal stability of tissue macromolecules and cellular structure in burn injury. Burns 2005, 31, 568–77. [Google Scholar] [CrossRef] [PubMed]
  32. Furukawa, M; Enomoto, K; Kato, H; Ishida, T; Maeno, T. Effects of hyperthermia on intracellular calcium concentration and responses of cancerous mammary cells in culture. Cell Biochem Funct 1992, 10(4), 225–32. [Google Scholar] [CrossRef] [PubMed]
  33. Han, AY; Zhang, MH; Zuo, XL; Zheng, SS; Zhao, CF; Feng, JH; et al. Effect of acute heat stress on calcium concentration, proliferation, cell cycle, and interleukin-2 production in splenic lymphocytes from broiler chickens. Poult Sci 2010, 89(10), 2063–70. [Google Scholar] [CrossRef] [PubMed]
  34. Maldonado, EN; Lemasters, JJ. ATP/ADP ratio, the missed connection between mitochondria and the Warburg effect. Mitochondrion 2014, 19(Pt A), 78–84. [Google Scholar] [CrossRef]
  35. Metallo, CM; Vander Heiden, MG. Understanding metabolic regulation and its influence on cell physiology. Mol Cell 2013, 49, 388–98. [Google Scholar] [CrossRef] [PubMed]
  36. Burnstock, G; Vaughn, B; Robson, SC. Purinergic signalling in the liver in health and disease. Purinergic Signal 2014, 10(1), 51–70. [Google Scholar] [CrossRef] [PubMed]
  37. Fausther, M; Sevigny, J. Extracellular nucleosides and nucleotides regulate liver functions via a complex system of membrane proteins. C R Biol 2011, 334, 100–17. [Google Scholar] [CrossRef] [PubMed]
  38. Lazarowski, ER; Sesma, JI; Seminario-Vidal, L; Kreda, SM. Molecular mechanisms of purine and pyrimidine nucleotide release. Adv Pharmacol 2011, 61, 221–61. [Google Scholar] [PubMed]
Fig. 1. The dependence of respiration rates in isolated mitochondria on liver perfusion temperature. A, substrate succinate; B, substrate pyruvate + malate; V2, V3, VCCCP, respiration rates in liver mitochondria in state 2, state 3 and uncoupled state, respectively. The averages of 4–8 independent experiments ± standard error are presented.
Medicina 53 00040 g001
Fig. 2. The dependence Δψ in state 2 and state 3 of isolated liver mitochondria on liver perfusion temperature. Substrate, pyruvate + malate. The averages of 4–8 independent experiments ± standard error are presented.
Medicina 53 00040 g002
Fig. 3. The effect of liver perfusion temperature on the dependence of inner mitochondrial membrane permeability on Δψ. Substrate, pyruvate + malate. The averages of 3–4 independent experiments ± standard error are presented.
Medicina 53 00040 g003
Fig. 4. Dependence of hepatocyte viability on incubation temperature. The averages of 3 independent experiments ± standard error are presented. *Statistically significant temperature effect compared with 38 °C (P < 0.05).
Medicina 53 00040 g004
Table 1. Nucleotide concentrations in hepatocytes (nmol/106 cells) after hyperthermic treatment.
NucleotideIncubation temperature, °C
3840424550
AMP35.5 ± 5.735.1 ± 6.532.0 ± 8.429.3 ± 6.829.5 ± 4.5
ADP18.9 ± 3.013.1 ± 0.7*13.4 ± 1.1*6.6 ± 1.0*3.8 ± 0.1*
ATP5.4 ± 0.33.4 ± 0.2*3.2 ± 0.7*1.3 ± 0.1*0.1 ± 0.0*
AMP + ADP + ATP59. ± 9.551.6 ± 8.348.6 ± 12.5*37.2 ± 5.5*33.4 ± 6.3*
Mean values and standard error are presented (n = 4).* Statistically significant difference (P ≤ 0.05), as compared to the control (38 °C).
Table 2. Nucleotide concentrations in liver tissue (nmol/g tissue) after hyperthermic perfusion.
NucleotidePerfusion temperature, °C
3846485052
AMP163.6 ± 20.3327.26 ± 32.3*224.3 ± 12.0*204.5 ± 18.3*161.7 ± 15.8
ADP116.8 ± 12.4171.6 ± 16.4*251.1 ± 22.5*173.7 ± 15.2*115.1 ± 10.0
ATP65.5 ± 8.282.4 ± 13.8*245.0 ± 23.2*124.5 ± 8.7*75.3 ± 6.8
AMP + ADP + ATP345.8 ± 40.9581.3 ± 62.5*720.4 ± 57.7*502.6 ± 42.2*352.1 ± 32.6
Mean values and standard error are presented (n = 4).* Statistically significant difference (P ≤ 0.05) as compared to the control (38 °C).

