Abstract
Background and objectives: Executive function (EF) is an umbrella term that encompasses the set of higher-order processes. Core EFs are inhibition, interference control, working memory, and cognitive flexibility. The aim of the study was to compare the EF between normal weight (NW) and inactive overweight (OW), NW and sport trained (ST), ST and OW 16–19-year-old youths. In addition, the relationship between EF and peak oxygen uptake (VO2peak) was evaluated. Materials and Methods: 10 NW, 14 ST, and 10 OW youths participated in this study. EF was evaluated using the ANAM4 battery. VO2peak was measured during an increasing walking exercise (modified Balke test). Results: The NW youths demonstrated better visual tracking and attention (94.28% ± 3.11%/90.23% ± 2.01%), response inhibition (95.65% ± 1.83%/92.48% ± 1.05%), speed of processing, and alternating attention with a motor speed component (95.5% ± 3.51%/89.01% ± 4.09%) than the OW youths (p < 0.05). The ST youths demonstrated better visual tracking and attention (96.76% ± 1.85%/90.23% ± 2.01%), response inhibition (97.58% ± 0.94%/92.48% ± 1.05%), speed of processing, and alternating attention with a motor speed component (98.35% ± 1.35%/89.01% ± 4.09%) than the OW youths (p < 0.05). The ST youths demonstrated better EF results than NW youths (p < 0.05). Conclusions: The ST 16–19-year-old youths demonstrated better EF than their OW and NW peers. The NW youths demonstrated better EF than their OW peers. There was a significant correlation between VO2peak and EF indicators in all groups of participants.
1. Introduction
Cognition is a general term reflecting different processes such as working memory, memory, attention, pattern recognition, executive function (EF), intelligence, concept formation and reasoning, and academic achievement [1]. The executive system can shape multiple executive and behavioral outcomes like specific academic skills and intelligence quotient (scores and overall school achievement) [2].
It is generally agreed that there are three core aspects of EFs: inhibition, working memory, and cognitive flexibility [3]. From these, higher-order EFs are built, such as reasoning, problem-solving, and planning [4,5]. EF plays a significant role in academic achievement.
Working memory is one of the most central EF skills, which continues to develop throughout later childhood [5].
Overweight (OW) youths demonstrate worse working memory skill than normal weight (NW) youths [5]. Youth obesity continues to be a major focus of public health efforts. Obesity has been linked to structural and functional brain abnormalities, particularly in the frontal lobe [6].
Research [7] shows that OW or obese youths have lower self-esteem and self-control than NW youths and that may have an effect on executive achievement. EFs such as attention/concentration, reaction time, processing speed, working memory, visuospatial skills, motor speed, memory, reasoning, and problem-solving are also very important for learning.
OW youths have significantly lower math and reading test scores than non-OW youths in third grade [7,8]. Increased body weight has an effect on general mental ability [9]. Obese youths have twice the rate of executive dysfunction as the normal population [10]. Obese adolescents show slower executive processing speed while maintaining equivalent performance on executive functioning compared with their healthy weight peers [6].
Brain function and structure change significantly during the toddler and preschool years. However, most studies focus on older or younger youths, so the specific nature of these changes is still unclear. There is increasing evidence of important roles for key executive processes, including attention, memory, and learning, in short-term decision-making about eating. There is parallel evidence that people who are OW or obese tend to perform worse on a variety of executive tasks [11].
According to the World Health Organization [12], physical activity can improve cardiorespiratory, muscular fitness, cardiovascular and metabolic health biomarkers, and bone health. It also has psychological benefits, helping to control symptoms of depression and anxiety. Science has proven the importance of the role of physical activity in all age stages [13].
Evidence about the influence of physical activity on EF is mixed. Some researchers have concluded that physical activity has a neutral to positive effect on EF [14]. Resaland with colleagues [15] also assessed the relation between physical activity and academic achievement. Aadland et al. [16] did not find a relation between academic achievement and physical activity. There is the hypothesis that physical activity may influence physiological changes in the brain, and direct physical activity may develop executive skills [17]. Sibley and Etnier [18] found a positive, but weak, correlation between physical activity and different measures of executive performance. Samuel et al. [19] found a significant rise in memory and attention test scores from immediately after exercise to after recovery. Despite much research in this field, it is still not clear what influence physical activity has on EF and how long the effect stays.
However, there are a number of articles that confirm there is no relation between body mass index and academic achievement [9,20]. Obesity and body mass index are negatively related to executive achievement for boys but not girls [21].
Because of controversial results in this field, we organized the investigation of EF and oxygen uptake parameters in three different groups: healthy physically inactive, sport trained, and inactive overweight youths.
The aim of the study was to compare EF among 16–19-years-old healthy physically inactive (NW), sport trained (ST), and overweight (OW) youths.
2. Materials and Methods
2.1. Participants
In all, 10 healthy physically inactive, NW, 10 OW, and 14 ST 16–19-year-old males participated in this study. Participants of NW and OW groups did not have any specific physical education, except for physical education lessons in school (2 times/week, 45 min/time), which are obligatory for all healthy pupils in Lithuania. OW status was established using age, height, weight, and ≥20% of adipose tissue. Participants of ST groups were soccer players and basketball players with a training experience of 5.0 ± 1.5 years. All ST group youth were invited from Kaunas soccer and basketball clubs. Participants had soccer or basketball training 3 times/week, for 2 hours. Participants participated in soccer/basketball events, regional championships, and matches. All subjects gave their informed consent for inclusion before they participated in the study. The study was conducted in accordance with the Declaration of Helsinki, and the protocol was approved by the Kaunas Regional Ethics Committee, Nr. BE-2-27, 24 May 2017. Written informed consent was obtained from participants (18–19 years old) and from the parents of the participants if the participants were 16–17 years old. The criteria that eliminated participants from the research were: heart disease, diabetes, epilepsy, and musculoskeletal problems. Subjects’ characteristics are recorded in Table 1.

Table 1.
Characteristics of participants.
2.2. Measurements
2.2.1. Anthropometry
The height of each participant was measured using a stadiometer to the nearest 0.01 m. Body mass and adipose tissue were measured using body composition analyzer “TBF–300” (Japanese) to the nearest 0.1 kg beam. BMI was calculated from body mass (kg) divided by height squared (m2).
2.2.2. Pulmonary Gas Exchange
The pulmonary gas exchange parameters were continuously measured breath-by-breath with a portable telemetric system (Oxycon Mobile, Jaeger, Germany). The flow-volume sensor and the gas analyzer (gas mixtures containing 5% CO2 and 16% O2 were used) were calibrated using automatic calibration procedures, as provided by Jaeger, before each test session.
2.2.3. Heart Rate (HR)
Heart rate was measured with the “Polar” system. Participants wore a wireless chest strap telemetry system to monitor the HR. The chest strap detects the heart’s electrical signals with a sensor that is attached to the strap and turns the signals into heart rate data.
2.2.4. Increasing Walking Exercise (IWE)
IWE was measured by the modified Balke test [22]. Following a 1-min period of standing gas exchange, subjects began a step transition into a 3-min stage at 3 km/h speed and 0% grade. The progressive protocol continued with a 4-min stage at 6 km/h, and the grade of treadmill was increased to 2%, 4%, 6%, 8%, 10%, and as far as the subject could continue. Subjects were verbally encouraged to give maximal effort during the test until volitional exhaustion was achieved. Oxygen uptake data were collected from subjects during test and in resting.
2.2.5. Executive Function Evaluation
The automated neuropsychological assessment metrics version 4 (ANAM4) was used to evaluate executive function. The four performance tests were, in the order of administration: 2-choice reaction time test (2CRT), code substitution-learning (CSL), go/no-go test, and the simple reaction time (PRO) (Table 2). The specific tests assess areas or domains of executive functioning, including attention/concentration, reaction time, processing speed, working memory, visuospatial skills, motor speed, memory, reasoning, and problem solving. It took ~15–20 min to complete tests for participants [23].
Table 2.
Descriptions of the executive tests [23].
2.3. Study Design
Participants started the experimental procedure with least intense exercise for 24 h before testing. Participants had to come to the laboratory twice.
The increasing walking exercise (IWE)–Balke was performed the first time in the laboratory. Participants walked on the treadmill at 6 km/h, every minute the treadmill angle was raised 2 degrees during the high-intensity test. The subject continued walking till exhaustion. The peak oxygen uptake (VO2peak) was determined as the highest VO2 within a 20-s period during the IWE [22]. Participants were grouped together in three groups (NW, ST, and OW) by VO2 peak results, adipose tissue, and physical activity.
EF was tested on the second time in the laboratory. First, the participants learned to do executive tests (performed two trials) and then the true test was recorded for evaluation. It took approximately 20–30 min to complete the executive tests battery.
2.4. Data Analysis
VO2 kinetics during IWE were determined using a biexponential model [24].
The peak oxygen uptake (VO2peak) was determined as the highest VO2 within a 20-s period during the IWE.
Maximal heart rate (HR max) was measured during IWE. It is the maximal number of heart beats in 60 s.
Maximal pulmonary ventilation (VE max) was measured during IWE. VE is the total flow exhaled per minute. VE = VT × BF, where VT is the ventilation volume and BF is the breathing rate.
Maximal breathing frequency (BF max) is the highest number of breaths a person takes per minute during IWE.
Respiratory exchange ratio (RER) is the ratio between the amount of carbon dioxide (CO2) produced in metabolism and oxygen (O2) used.
Executive function tests were determined using percent of correct responses [23]:
where #NumCorr is the number of trials with correct response; Numinc is the number of trials with incorrect response; and NumLapse is the number of trials where no response was made in the allotted time.
#((NumCorr/(NumCorr + Numinc + NumLapse)))
2.5. Statistical Analysis
Statistical analysis was performed using SPSS version 22.0 (IBM Corp., Armonk, NY, USA). The data were tested for normal distribution using the Kolmogorov–Smirnov test; all data were found to be normally distributed. If significant effects were found, Sidak’s post-hoc adjustment was used. Oxygen uptake parameters and EF results were analyzed using two-way ANOVA for the groups’ comparison. Statistical significance was accepted when p < 0.05. Calculations of statistical power (SP, as a percentage) were performed for all indicators based on an alpha level of 0.05, sample size (n = 34), standard deviations, and changes in the average level of the data. The SP for a significant effect was >80%. The partial eta squared (ηp2) was estimated.
Pearson correlation analysis was performed to determine the correlation of EF with oxygen uptake parameters and weight status. The closer the Pearson correlation coefficient, r, was to either +1 or −1 depended on whether the relationship was positive or negative, respectively. Strength of association was considered as strong from range 0.5 to 1. A p-value of <0.05 was considered statistically significant. All values were expressed as mean ± standard deviation.
3. Results
3.1. Participants’ Characteristics
Table 1 describes the reference characteristics of the participants. All three experimental groups had the same age and height, and there were no significant differences between the groups (p > 0.05) (Table 1). However, body weight for the NW group and ST group were lower compared to the OW group (p < 0.001, ηp2 = 0.54, SP > 100%, p < 0.001, ηp2 = 0.61, SP > 100%, respectively), and BMI for the NW group and ST group were lower compared to the OW group (p < 0.001, ηp2 = 0.83, SP > 100%, p < 0.001, ηp2 = 0.78, SP > 100%, respectively) (Table 1).
3.2. Oxygen Uptake Parameters
Oxygen uptake parameters are recorded in Table 3. The NW group had a lower VO2max and VEmax (p < 0.05, ηp2 = 0.33, SP > 88.6%, p < 0.05, ηp2 = 0.25, SP > 72.4%, respectively) compared to the ST group, but an equally more frequent BFmax (p < 0.05, ηp2 = 0.41, SP > 96.1%). Other oxygen uptake parameters did not differ significantly between the NW and ST groups.
Table 3.
Oxygen uptake parameters.
Table 3 shows that the NW group had a higher VO2 peak and RER (p < 0.05, ηp2 = 0.33, SP > 85.3%, p < 0.05, ηp2 = 0.24, SP > 66.4%, respectively) compared to the OW group. Other oxygen uptake parameters did not differ significantly between the NW and OW groups (p > 0.05) (Table 3).
In the ST group, the oxygen uptake parameters: VO2max, VO2peak, VEmax, and RER were significantly better than the OW group (p < 0.001, ηp2 = 0.62, SP > 100%, p < 0.001, ηp2 = 0.71, SP > 100%, p < 0.05, ηp2 = 0.34, SP > 85.8%, p < 0.05, ηp2 = 0.25, SP > 68.7%, respectively) (Table 3). Other oxygen uptake parameters did not differ significantly between the ST and OW groups (p > 0.05) (Table 3).
3.3. Executive Function Performance
The two choice reaction test (Figure 1A), code submission learning test (Figure 1B), and go/no-go test (Figure 1C) results were significantly different between the NW and OW (95.5 ± 3.51/94.28 ± 3.11/95.65 ± 1.83 and 89.01 ± 4.09/90.23 ± 2.01/92.48 ± 1.05, p < 0.05, ηp2 = 0.29, SP > 77%; p < 0.05, ηp2 = 0.19, SP > 55%; p < 0.05, ηp2 = 0.500, SP > 98%, respectively), OW and ST (89.01 ± 4.09/90.23 ± 2.01/92.48 ± 1.05 and 98.35 ± 1.35/96.76 ± 1.85/97.58 ± 0.94, p < 0.05, ηp2 = 0.64, SP > 100%; p < 0.05, ηp2 = 0.65, SP > 100%; p < 0.05, ηp2 = 0.80, SP > 100%, respectively), and NW and ST (p < 0.05, ηp2 = 0.02, SP > 63%; p < 0.05, ηp2 =0.03, SP > 61%; p < 0.05, ηp2 = 0.01, SP > 72%) youth groups. Simple reaction time test (Figure 1D) results were statistically significant between the NW and OW groups (94.75 ± 2.49 and 89.33 ± 2.56, p < 0.05, ηp2 = 0.47, SP > 98%, respectively) and ST and OW groups (95.01 ± 2.12 and 89.33 ± 2.56, p < 0.05, ηp2 = 0.63, SP > 100%, respectively) but not significantly different between NW and ST (p > 0.05, ηp2 = 0.51, SP > 9.8%) groups.
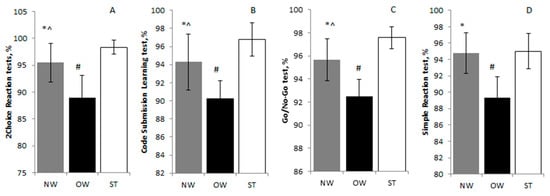
Figure 1.
(A) 2-choice reaction test, (B) code submission learning test, (C) go/no-go test, (D) simple reaction test results among normal weight (NW), overweight (OW), and sport trained (ST) groups. Values are expressed as means ± standard deviation. * p < 0.05 significant difference between NW and OW; # p < 0.05 significant difference between OW and ST; ^ p < 0.05 significant difference between NW and ST.
Correlation between the 2-choice reaction test and VO2peak (Figure 2A) was significantly positive and weak (r = 0.409, p < 0.05), go/no-go test and VO2peak (Figure 2B) was significantly positive and strong (r = 0.614; p < 0.05), correlation between code submission learning test and VO2 peak (Figure 2C) was significantly positive and strong (r = 0.742; p < 0.05), correlation between simple reaction time test and VO2 peak (Figure 2D) was significantly positive and strong (r = 0.558; p < 0.05).
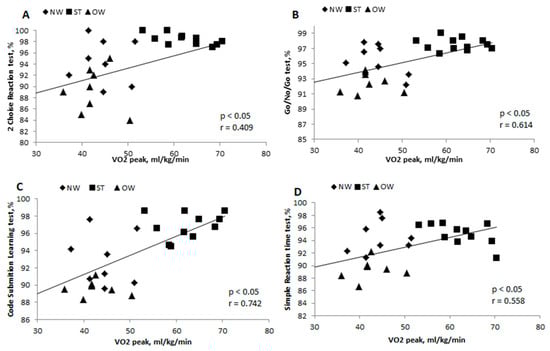
Figure 2.
Correlation between 2-choice reaction test and VO2peak (A), go/no-go test and VO2peak (B), code submission learning test and VO2peak (C), simple reaction time and VO2peak (D) in normal weight (NW), overweight (OW), and sport trained (ST) groups. r—Pearson correlation coefficient; p < 0.05—statistically significant difference.
4. Discussion
The ST 16–19-year-old youths demonstrated better EF than their OW and NW peers. The NW youths demonstrated better EF than their OW peers. Taking all groups together, there was a significant correlation between VO2peak and EF indicators.
Our findings demonstrate that OW youths demonstrate poorer EF than NW physically inactive youths and ST youths. OW youths made more mistakes and spent more time solving executive tests. OW youths’ processing speed and alternating attention with a motor speed component were the worst compared to NW and ST youths. Response inhibition, complex scanning, visual tracking, attention, and visuo-motor response timing were also the lowest of the three groups. Because EF stand out inhibition, shifting, and working memory, these domains are very important for academic achievement. These findings supplement Datar and colleagues [8] findings, that OW youths demonstrate worse academic achievement. Physical activity during class had a positive effect, improving on-task behavior—improving EF [25]. Colcombe and Kramer [26] reported meaningful improvements in EF, processing speed, memory, and motor function. A higher level of physical activity is associated with better neurocognitive performance according to Etnier et al. [27]. On the other hand, Marsh and Kleitman [28] reported negative associations between physical activity and EF. The authors claimed that team sport participants demonstrate poorer cognitive performance than individual sport participants.
Studies investigating EF in OW/obese individuals have claimed that OW/obese demonstrated worse EF [9,29], as well as memory, attention, and motor skills [30] than NW individuals. Li et al. [9] claimed that adiposity may directly negatively influence EF, memory, and learning. Taras et al. [31] concluded obesity had a negative effect on academic performance. Some authors found a negative obesity effect for EF just among girls [32], some just among boys [33]. However, other studies did not find a significant difference in EF among OW/obese and NW individuals [34,35].
The newest research presumes that body mass and EF deficits can be indirectly associated via obesity-induced activation of innate immunity, which directly caused low-grade inflammation in obesity [36,37,38].
NW physically inactive youths showed poorer results in EF tests than ST youths. According to Santana et al. [39], individuals with higher physical fitness execute better EFs such as inhibition, shifting, and working memory. A statistically significant correlation between EF and VO2peak was demonstrated only if all the groups were analyzed together. We found a strong relationship between physical fitness and EF domain in complex scanning, visual tracking and attention, attention and visuo-motor response timing, and response inhibition. The relations between EF domain and choice reaction time and physical fitness were not very strong.
VO2peak reflects endurance capacity and it is the main measurement for assessing aerobic power. OW youths demonstrated lower oxygen uptake peak during the treadmill test than NW and ST youths. Jabbour et al. [40] indicated that the aerobic fitness of inactive obese children was significantly different from those of active obese and non-obese children.
It is known that EF might be improved by computer training [41], repeated practice [42], and physical activity [43]. On the other hand, some researchers did not find a relation between physical activity and EF [44,45,46].
There are mechanisms that might explain the relationship between physical activity and executive functioning. De Bruijn et al. [47] grouped these mechanisms into two groups: physiological mechanisms and learning/developmental mechanisms. Physiological mechanisms claim that different levels of physical activity lead to supplementation of the brain’s plasticity and leads to an increase of neurotransmitters resulting in changes in the brain [1,17,48]. Learning/developmental mechanisms explain the relation between physical activity and EF indicating a learning process while being physically active [18,47]. ST children are characterized as having larger brain volumes in the basal ganglia and hippocampus. This relates to a higher performance on tasks of memory and cognitive control and also to a higher brain function during tasks of cognitive control and better scores on tests of academic achievement [49,50], increasing oxygen saturation and glucose delivery, improving cerebral blood flow, and increasing neurotransmitters levels [3]. Using MRI and measuring the electrical activity of the brain, positive differences in structural brain volumes and brain function were established [49,51]. Wu and coworkers [5] found an early obesity or OW effect and future learning results.
Our findings support the hypothesis that physical activity has a positive influence on EF. We evaluated three different groups with the same cognitive test battery and same protocol for oxygen uptake kinetics. Because cognitive function evaluation, physical activity level, and groups in previous studies were different, we believe our findings give new contribution to this field, and allow us to better understand the importance of physical activity and harm of becoming overweight for youth. We know little about how useful physical activity can be; therefore, longitudinal research is necessary to investigate it more.
5. Conclusions
The ST 16–19-year-old youths demonstrated better EF (choice reaction time, complex scanning, visual tracking, attention, response inhibition) than their OW and NW peers. The NW youths demonstrated better EF than their OW peers. Taking all groups together there was a significant correlation between VO2peak and EF indicators.
Author Contributions
V.B.—wrote the paper, performed the experiments, analyzed the data; A.S.—conceived and designed the experiments, analyzed the data; B.Z.—performed the experiments, analyzed the data; L.K.—contributed reagents/materials/analysis tools; R.B.—contributed reagents/materials/analysis tools.
Funding
This research received no external funding.
Acknowledgments
The authors would like to thank all participants of the study.
Conflicts of Interest
The authors declare no conflict of interest.
References
- Tomporowski, P.D. Effects of acute bouts of exercise on cognition. Acta Psychol. 2003, 112, 297–324. [Google Scholar] [CrossRef]
- Miller, A.L.; Jong, H.; Lumeng, J.C. Obesity—Associated biomarkers and executive function in children. Pediatr. Res. 2015, 277, 143–147. [Google Scholar] [CrossRef]
- Diamond, A. Executive functions. Ann. Rev. Psychol. 2013, 64, 135–168. [Google Scholar] [CrossRef]
- Collins, A.; Koechlin, E. Reasoning, learning, and creativity: Frontal lobe function and human decision-making. PLoS Biol. 2012, 10, e1001293. [Google Scholar] [CrossRef] [PubMed]
- Wu, N.; Chen, Y.; Yang, J.; Li, F. Childhood obesity and academic performance: The role of working memory. Front. Psychol. 2017, 8, 611–617. [Google Scholar] [CrossRef]
- Sweat, V.; Yates, K.F.; Migliaccio, R.; Concit, A. Obese adolescents show reduced cognitive processing speed compared with healthy weight peers. Child Obes. 2017, 13, 190–196. [Google Scholar] [CrossRef]
- Judge, S.; Jahns, L. Association of overweight with academic performance and social and behavioral problems: An update from the early childhood longitudinal study. J. Sch. Health 2007, 77, 672–678. [Google Scholar] [CrossRef]
- Datar, A.; Sturm, R.; Magnabosco, J.L. Childhood overweight and academic performance: National study of kindergartners and first-graders. Obes. Res. 2004, 12, 58–68. [Google Scholar] [CrossRef]
- Li, Y.; Dai, Q.; Jackson, J.C.; Zhang, J. Overweight is associated with decreased cognitive functioning among school-age children and adolescents. Obesity 2008, 16, 1809–1815. [Google Scholar] [CrossRef] [PubMed]
- Liang, J.; Matheson, B.E.; Kaye, W.H.; Boutelle, K.N. Neurocognitive correlates of obesity and obesity-related behaviors in children and adolescents. Int. J. Obes. 2014, 38, 494. [Google Scholar] [CrossRef] [PubMed]
- Yeomans, M.R. Adverse effects of consuming high fat–sugar diets on cognition: Implications for understanding obesity. Proc. Nutr. Soc. 2017, 76, 455–465. [Google Scholar] [CrossRef] [PubMed]
- World Health Organization. Global Recommendations on Physical Activity for Health; WHO: Geneva, Switzerland, 2010; ISBN 9789241599979. [Google Scholar]
- Johnstone, A.; Hughes, A.R.; Janssen, X.; Reilly, J.J. Pragmatic evaluation of the Go2Play active play intervention on physical activity and fundamental movement skills in children. Prevent. Med. Rep. 2017, 7, 58–63. [Google Scholar] [CrossRef] [PubMed]
- Donnelly, J.E.; Hillman, C.H.; Castelli, D.; Etnier, J.L.; Lee, S.; Tomporowski, P.; Szabo-Reed, A.N. Physical activity, fitness, cognitive function, and academic achievement in children: A systematic review. Med. Sci. Sports Exerc. 2016, 48, 1197. [Google Scholar] [CrossRef] [PubMed]
- Resaland, G.K.; Aadland, E.; Nilsen, A.K.O.; Bartholomew, J.B.; Andersen, L.B.; Anderssen, S.A. The effect of a two-year school-based daily physical activity intervention on a clustered CVD risk factor score—The Sogndal school-intervention study. Scand. J. Med. Sci. Sports 2018, 28, 1027–1035. [Google Scholar] [CrossRef] [PubMed]
- Aadland, E.; Andersen, L.B.; Skrede, T.; Ekelund, U.; Anderssen, S.A.; Resaland, G.K. Reproducibility of objectively measured physical activity and sedentary time over two seasons in children; Comparing a day-by-day and a week-by-week approach. PLoS ONE 2017, 12, e0189304. [Google Scholar] [CrossRef] [PubMed]
- Best, J.R. Effects of physical activity on children’s executive function: Contributions of experimental research on aerobic exercise. Dev. Rev. 2010, 30, 331–351. [Google Scholar] [CrossRef] [PubMed]
- Sibley, B.A.; Etnier, J.L. The relationship between physical activity and cognition in children: A meta-analysis. Pediatr. Exerc. Sci. 2003, 15, 243–256. [Google Scholar] [CrossRef]
- Samuel, R.D.; Zavdy, O.; Levav, M.; Reuveny, R.; Katz, U.; Dubnov-Raz, G. The effects of maximal intensity exercise on cognitive performance in children. J. Hum. Kinet. 2017, 57, 85–96. [Google Scholar] [CrossRef] [PubMed]
- Afzal, A.S.; Gortmaker, S. The relationship between obesity and cognitive performance in children: A longitudinal study. Child. Obes. 2015, 11, 466–474. [Google Scholar] [CrossRef]
- Black, N.; Johnston, D.W.; Peeters, A. Childhood obesity and cognitive achievement. Health Econ. 2015, 24, 1082–1100. [Google Scholar] [CrossRef]
- Marinov, B.; Mandadzhieva, S.; Kostianev, S. Oxygen-uptake efficiency slope in healthy 7-to 18-year-old children. Pediatr. Exercise Sci. 2007, 19, 159–170. [Google Scholar] [CrossRef]
- Automated Neuropsychological Assessment Metrics. Manual User, Center of the Study of Human Operator Performance; University of Oklahoma: Norman, OK, USA, 2008. [Google Scholar]
- Baranauskienė, N.; Kilikevičienė, S.; Stasiulė, L.; Civinskienė, G.; Stasiulis, A. Gender differences in residual effect of prior drop jumps on oxygen uptake during heavy cycling exercise. Medicina 2017, 53, 331–338. [Google Scholar] [CrossRef] [PubMed]
- Mahar, M.T.; Murphy, S.K.; Rowe, D.A.; Golden, J.; Shields, A.T.; Raedeke, T.D. Effects of a classroom-based program on physical activity and on-task behavior. Med. Sci. Sports Exerc. 2006, 38, 2086. [Google Scholar] [CrossRef] [PubMed]
- Colcombe, S.; Kramer, A.F. Fitness effects on the cognitive function of older adults: A meta-analytic study. Psychol. Sci. 2003, 14, 125–130. [Google Scholar] [CrossRef]
- Etnier, J.L.; Nowell, P.M.; Landers, D.M.; Sibley, B.A. A meta-regression to examine the relationship between aerobic fitness and cognitive performance. Brain Res. Rev. 2006, 52, 119–130. [Google Scholar] [CrossRef] [PubMed]
- Marsh, H.W.; Kleitman, S. School athletic participation: Mostly gain with little pain. J. Sport Exerc. Psychol. 2003, 25, 205–228. [Google Scholar] [CrossRef]
- Yu, Z.B.; Han, S.P.; Cao, X.G.; Guo, X.R. Intelligence in relation to obesity: A systematic review and meta-analysis. Obes. Rev. 2010, 11, 656–670. [Google Scholar] [CrossRef] [PubMed]
- Gunstad, J.; Spitznagel, M.B.; Paul, R.H.; Cohen, R.A.; Kohn, M.; Luyster, F.S.; Gordon, E. Body mass index and neuropsychological function in healthy children and adolescents. Appetite 2008, 50, 246–251. [Google Scholar] [CrossRef] [PubMed]
- Taras, H.; Potts-Datema, W. Obesity and student performance at school. J. Sch. Health 2005, 75, 291–295. [Google Scholar] [CrossRef]
- Morita, N.; Nakajima, T.; Okita, K.; Ishihara, T.; Sagawa, M.; Yamatsu, K. Relationships among fitness, obesity, screen time and academic achievement in Japanese adolescents. Physiol. Behav. 2016, 163, 161–166. [Google Scholar] [CrossRef]
- Kang, Y.W.; Park, J.H. Does skipping breakfast and being overweight influence academic achievement among Korean adolescents? Osong Public Health Res. Perspect. 2016, 7, 220–227. [Google Scholar] [CrossRef] [PubMed]
- Ariza González, M.; Garolera i Freixa, M.; Jurado, M.; Garcia-Garcia, I.; Hernan, I.; Sanchez-Garre, C.; Segura i Fàbregas, B. Dopamine genes (DRD2/ANKK1-TaqA1 and DRD4-7R) and executive function: Their interaction with obesity. PLoS ONE 2012, 7, e41482. [Google Scholar]
- Delgado-Rico, E.; Soriano-Mas, C.; Verdejo-Román, J.; S Río-Valle, J.; Verdejo-García, A. Decreased insular and increased midbrain activations during decision-making under risk in adolescents with excess weight. Obesity 2013, 21, 1662–1668. [Google Scholar] [CrossRef] [PubMed]
- Bourassa, K.; Sbarra, D.A. Body mass and cognitive decline are indirectly associated via inflammation among aging adults. Brain Behav. Immun. 2017, 60, 63–70. [Google Scholar] [CrossRef] [PubMed]
- D O’Brien, P.; Hinder, L.M.; Callaghan, B.C.; Feldman, E.L. Neurological consequences of obesity. Lancet Neurol. 2017, 16, 465–477. [Google Scholar] [CrossRef]
- Lasselin, J.; Magne, E.; Beau, C.; Aubert, A.; Dexpert, S.; Carrez, J.; Capuron, L. Low-grade inflammation is a major contributor of impaired attentional set shifting in obese subjects. Brain Behav. Immun. 2016, 58, 63–68. [Google Scholar] [CrossRef] [PubMed]
- Santana, C.C.A.; Azevedo, L.B.; Cattuzzo, M.T.; Hill, J.O.; Andrade, L.P.; Prado, W.L. Physical fitness and academic performance in youth: A systematic review. Scand. J. Med. Sci. Sports 2017, 27, 579–603. [Google Scholar] [CrossRef] [PubMed]
- Jabbour, G.; Henderson, M.; Tremblay, A.; Mathieu, M.E. Aerobic fitness indices of children differed not by body weight status but by level of engagement in physical activity. J. Phys. Act. Health 2015, 12, 854–860. [Google Scholar] [CrossRef]
- Karbach, J.; Kray, J. How useful is executive control training? Age differences in near and far transfer of task-switching training. Dev. Sci. 2009, 12, 978–990. [Google Scholar] [CrossRef]
- Klingberg, T.; Fernell, E.; Olesen, P.J.; Johnson, M.; Gustafsson, P.; Dahlström, K.; Westerberg, H. Computerized training of working memory in children with ADHD-a randomized, controlled trial. J. Am. Acad. Child Adolesc. Psychiatr. 2005, 44, 177–186. [Google Scholar] [CrossRef]
- Voss, M.W.; Chaddock, L.; Kim, J.S.; VanPatter, M.; Pontifex, M.B.; Raine, L.B.; Kramer, A.F. Aerobic fitness is associated with greater efficiency of the network underlying cognitive control in preadolescent children. Neuroscience 2011, 199, 166–176. [Google Scholar] [CrossRef] [PubMed]
- Daley, A.J.; Ryan, J. Academic performance and participation in physical activity by secondary school adolescents. Perceptual Motor Skills 2000, 91, 531–534. [Google Scholar] [CrossRef] [PubMed]
- Lindner, K.J. The physical activity participation–academic performance relationship revisited: Perceived and actual performance and the effect of banding (academic tracking). Pediatr. Exerc. Sci. 2002, 14, 155–169. [Google Scholar] [CrossRef]
- Nelson, M.C.; Gordon-Larsen, P. Physical activity and sedentary behavior patterns are associated with selected adolescent health risk behaviors. Pediatrics 2006, 117, 1281–1290. [Google Scholar] [CrossRef] [PubMed]
- De Bruijn, A.G.M.; Hartman, E.; Kostons, D.D.N.M.; Visscher, C.; Bosker, R.J. Exploring the relations among physical fitness, executive functioning, and low academic achievement. J. Exp. Child Psychol. 2018, 167, 204–221. [Google Scholar] [CrossRef] [PubMed]
- Lakes, K.D.; Hoyt, W.T. Promoting self-regulation through school-based martial arts training. J. Appl. Dev. Psychol. 2004, 25, 283–302. [Google Scholar] [CrossRef]
- Chaddock-Heyman, L.; Hillman, C.H.; Cohen, N.J.; Kramer, A.F. The importance of physical activity and aerobic fitness for cognitive control and memory in children. Monographs Soc. Res. Child Dev. 2014, 79, 25–50. [Google Scholar] [CrossRef] [PubMed]
- Álvarez-Bueno, C.; Pesce, C.; Cavero-Redondo, I.; Sánchez-López, M.; Pardo-Guijarro, M.J.; Martínez-Vizcaíno, V. Association of physical activity with cognition, metacognition and academic performance in children and adolescents: A protocol for systematic review and meta-analysis. BMJ Open 2016, 6, e011065. [Google Scholar] [CrossRef]
- Hillman, C.H.; Pontifex, M.B.; Castelli, D.M.; Khan, N.A.; Raine, L.B.; Scudder, M.R.; Kamijo, K. Effects of the FITKids randomized controlled trial on executive control and brain function. Pediatrics 2014, 134, e1063. [Google Scholar] [CrossRef]


© 2019 by the authors. Licensee MDPI, Basel, Switzerland. This article is an open access article distributed under the terms and conditions of the Creative Commons Attribution (CC BY) license (http://creativecommons.org/licenses/by/4.0/).