Testing the Accuracy of the ARIMA Models in Forecasting the Spreading of COVID-19 and the Associated Mortality Rate


Abstract
:1. Introduction
2. Material and Methods
2.1. Data
2.2. The ARIMA Model
2.3. Mortality Rate
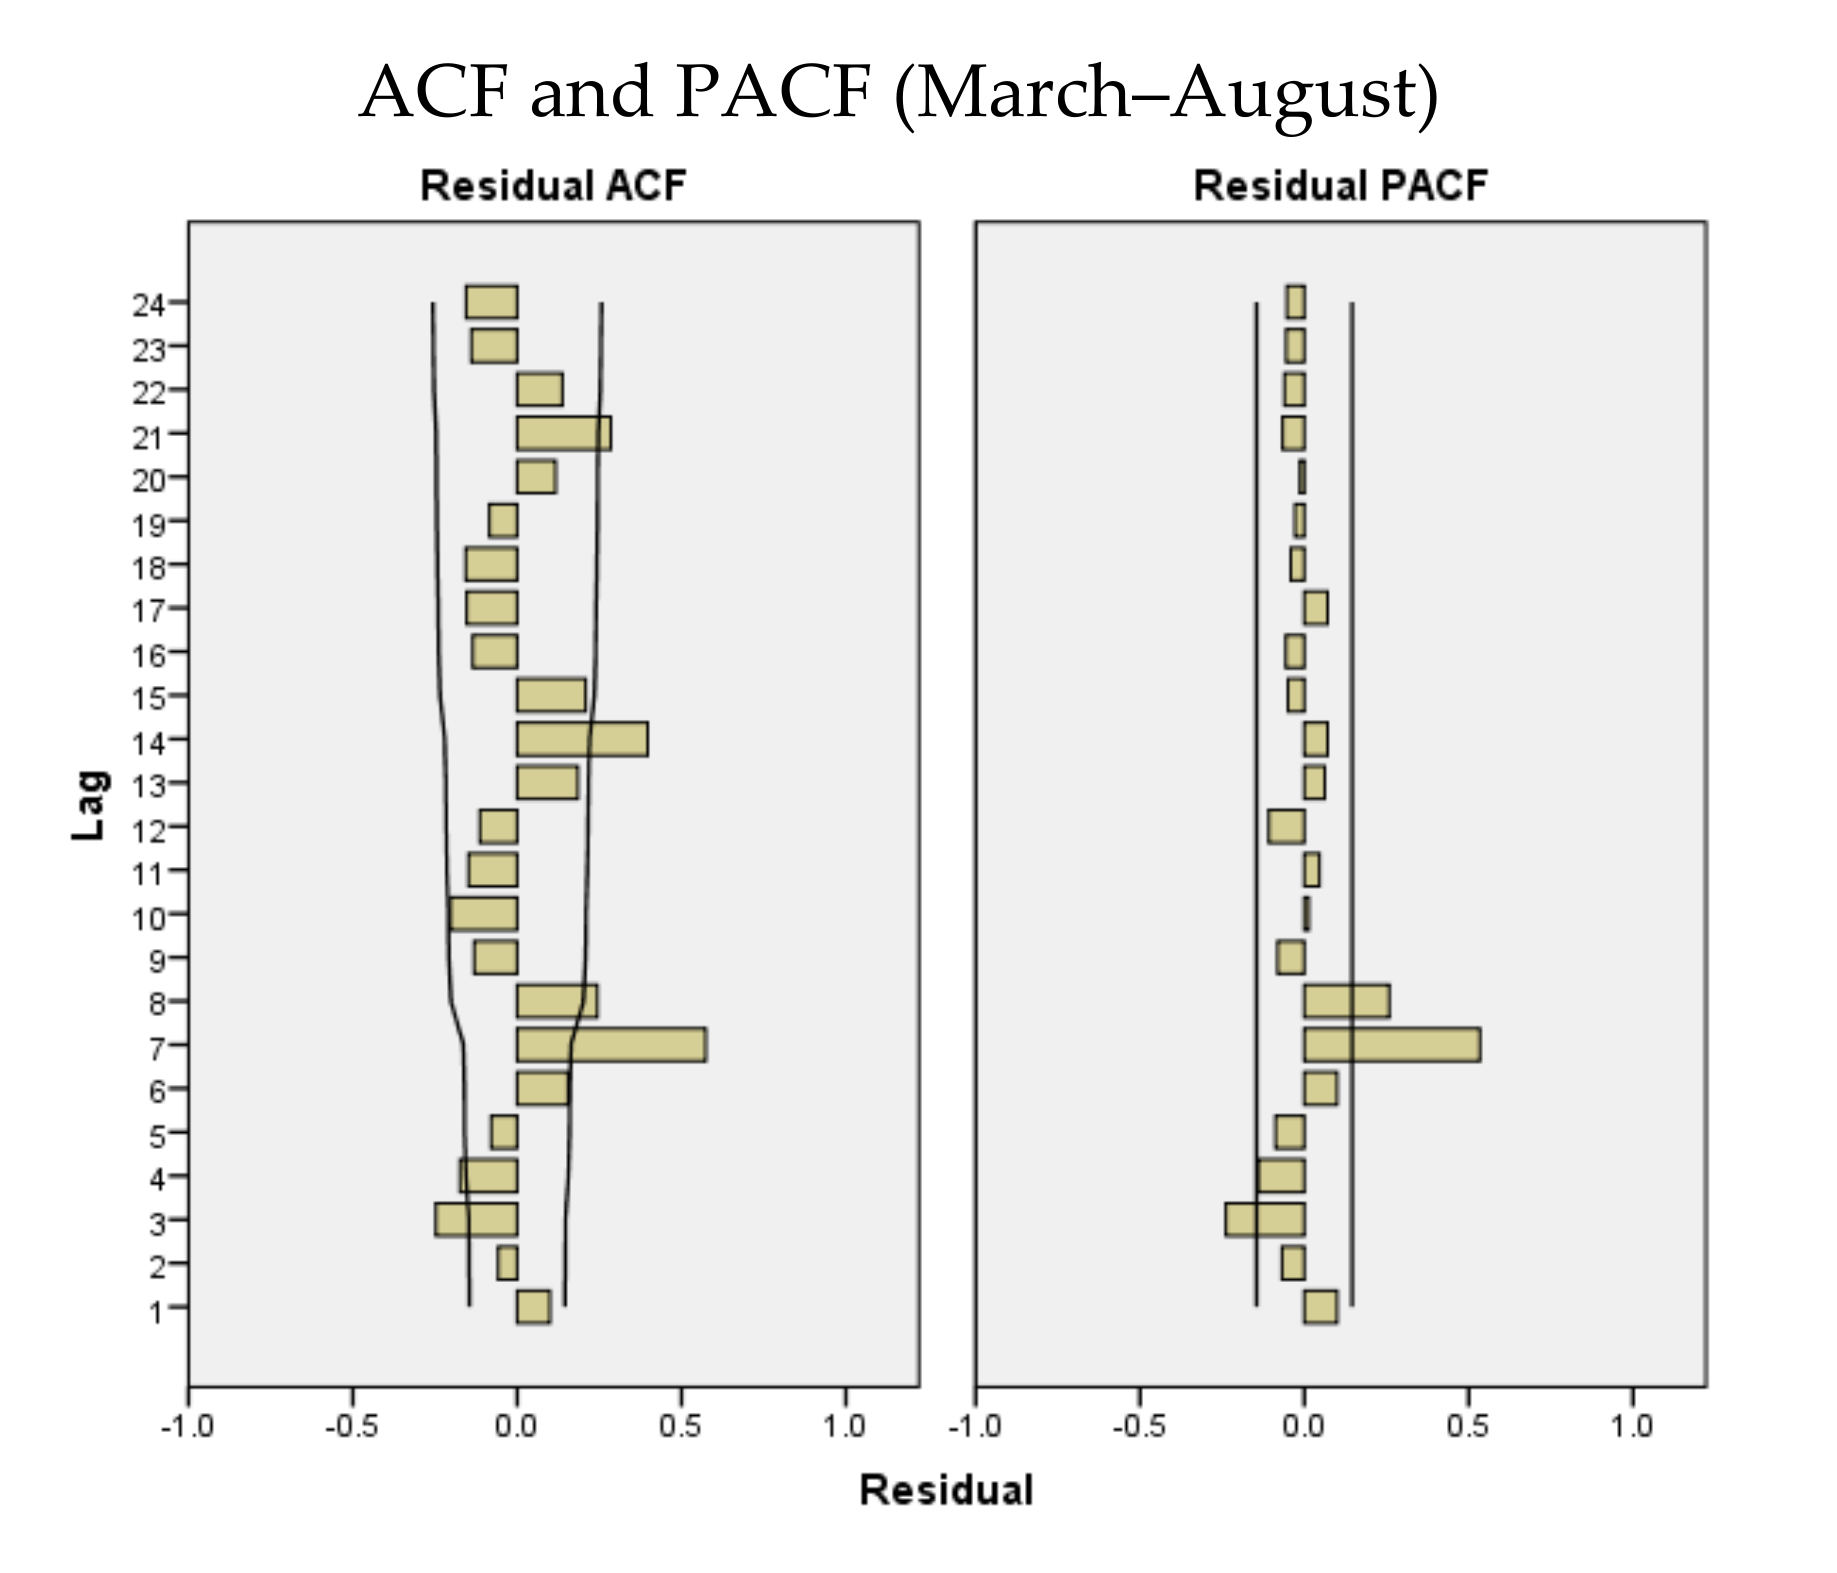
3. Results
4. Discussion
5. Conclusions
Author Contributions
Funding
Conflicts of Interest
References
- Harapan, H.; Itoh, N.; Yufika, A.; Winardi, W.; Keam, S.; Te, H.; Megawati, D.; Hayati, Z.; Wagner, A.L.; Mudatsir, M. Coronavirus disease 2019 (COVID-19): A literature review. J. Infect. Public Health 2020, 13, 667–673. [Google Scholar] [CrossRef]
- Yuki, K.; Fujiogi, M.; Koutsogiannaki, S. COVID-19 pathophysiology: A review. Clin. Immunol. 2020, 215, 108427. [Google Scholar] [CrossRef] [PubMed]
- Singhal, T. A review of coronavirus disease-2019 (COVID-19). Indian J. Pediatr. 2020, 87, 281–286. [Google Scholar] [CrossRef] [PubMed] [Green Version]
- Zhou, J.; Li, C.; Liu, X.; Chiu, M.C.; Zhao, X.; Wang, D.; Wei, Y.; Lee, A.; Zhang, A.J.; Chu, H.; et al. Infection of bat and human intestinal organoids by SARS-CoV-2. Nat. Med. 2020, 26, 1077–1083. [Google Scholar] [CrossRef] [PubMed]
- Taubenberger, J.K.; Morens, D.M. 1918 Influenza: The mother of all pandemics. Emerg. Infect. Dis. 2006, 12, 15–22. [Google Scholar] [CrossRef] [PubMed]
- Wang, L.; Li, J.; Guo, S.; Xie, N.; Yao, L.; Cao, Y.; Day, S.W.; Howard, S.C.; Graff, J.C.; Gu, T.; et al. Real-time estimation and prediction of mortality caused by COVID-19 with patient information based algorithm. Sci. Total Environ. 2020, 727, 138394. [Google Scholar] [CrossRef]
- Ceylan, Z. Estimation of COVID-19 prevalence in Italy, Spain, and France. Sci. Total Environ. 2020, 729, 138817. [Google Scholar] [CrossRef] [PubMed]
- Earnest, A.; Chen, M.I.; Ng, D.; Sin, L.Y. Using autoregressive integrated moving average (ARIMA) models to predict and monitor the number of beds occupied during a SARS outbreak in a tertiary hospital in Singapore. BMC Health Serv. Res. 2005, 5, 36. [Google Scholar] [CrossRef] [PubMed] [Green Version]
- Gaudart, J.; Touré, O.; Dessay, N.; Dicko, A.L.; Ranque, S.; Forest, L.; Demongeot, J.; Doumbo, O.K. Modelling malaria incidence with environmental dependency in a locality of Sudanese savannah area, Mali. Malar. J. 2009, 8, 61. [Google Scholar] [CrossRef] [PubMed]
- Liu, Q.; Liu, X.; Jiang, B.; Yang, W. Forecasting incidence of hemorrhagic fever with renal syndrome in China using ARIMA model. BMC Infect. Dis. 2011, 11, 218. [Google Scholar] [CrossRef] [Green Version]
- Nsoesie, E.; Beckman, R.; Shashaani, S.; Nagaraj, K.; Marathe, M. A simulation optimization approach to epidemic forecasting. PLoS ONE 2013, 8, e67164. [Google Scholar] [CrossRef] [Green Version]
- Zheng, Y.-L.; Zhang, L.; Zhang, X.-L.; Wang, K.; Zheng, Y.-J. Forecast model analysis for the morbidity of tuberculosis in Xinjiang, China. PLoS ONE 2015, 10, e0116832. [Google Scholar] [CrossRef] [PubMed]
- He, Z.; Tao, H. Epidemiology and ARIMA model of positive-rate of influenza viruses among children in Wuhan, China: A nine-year retrospective study. Int. J. Infect. Dis. 2018, 74, 61–70. [Google Scholar] [CrossRef] [PubMed] [Green Version]
- Cao, L.; Liu, H.; Li, J.; Yin, X.; Duan, Y.; Wang, J. Relationship of meteorological factors and human brucellosis in Hebei province, China. Sci. Total Environ. 2020, 703, 135491. [Google Scholar] [CrossRef] [PubMed]
- Wilson, G.T. Time Series Analysis: Forecasting and Control, 5th ed.; Box, G.E.P., Jenkins, G.M., Reinsel, G.C., Ljung, G.M., Eds.; John Wiley and Sons Inc.: Hoboken, NJ, USA, 2015; p. 712. ISBN 978-1-118-67502-1. [Google Scholar]
- Fanoodi, B.; Malmir, B.; Jahantigh, F.F. Reducing demand uncertainty in the platelet supply chain through artificial neural networks and ARIMA models. Comput. Biol. Med. 2019, 113, 103415. [Google Scholar] [CrossRef] [PubMed]
- Benvenuto, D.; Giovanetti, M.; Vassallo, L.; Angeletti, S.; Ciccozzi, M. Application of the ARIMA model on the COVID-2019 epidemic dataset. Data Br. 2020, 29, 105340. [Google Scholar] [CrossRef]
- Brockwell, P.J.; Davis, R.A. ARMA Models BT-Introduction to Time Series and Forecasting; Brockwell, P.J., Davis, R.A., Eds.; Springer International Publishing: Cham, Switzerland, 2016; pp. 73–96. ISBN 978-3-319-29854-2. [Google Scholar]
- Al-Douri, Y.; Hamodi, H.; Lundberg, J. Time series forecasting using a two-level multi-objective genetic algorithm: A case study of maintenance cost data for tunnel fans. Algorithms 2018, 11, 123. [Google Scholar] [CrossRef] [Green Version]
- Elevli, S.; Uzgören, N.; Bingöl, D.; Elevli, B. Drinking water quality control: Control charts for turbidity and pH. J. Water Sanit. Hyg. Dev. 2016, 6, 511–518. [Google Scholar] [CrossRef]
- Chen, P.; Niu, A.; Liu, D.; Jiang, W.; Ma, B. Time series forecasting of temperatures using SARIMA: An example from Nanjing. IOP Conf. Ser. Mater. Sci. Eng. 2018, 394, 52024. [Google Scholar] [CrossRef]
- Contoyiannis, Y.; Stavrinides, S.; Hanias, M.; Kampitakis, M.; Papadopoulos, P.; Picos, R.; Potirakis, S. A universal physics-based model describing COVID-19 dynamics in Europe. Int. J. Environ. Res. Public Health 2020, 17, 6525. [Google Scholar] [CrossRef]
- Demertzis, K.; Tsiotas, D.; Magafas, L. Modeling and forecasting the COVID-19 temporal spread in Greece: An exploratory approach based on complex network defined splines. Int. J. Environ. Res. Public Health 2020, 17, 4693. [Google Scholar] [CrossRef] [PubMed]
- Tsiotas, D.; Magafas, L. The effect of anti-COVID-19 policies on the evolution of the disease: A complex network analysis of the successful case of Greece. Physics 2020, 2, 325–339. [Google Scholar] [CrossRef]
- Chintalapudi, N.; Battineni, G.; Amenta, F. COVID-19 virus outbreak forecasting of registered and recovered cases after sixty day lockdown in Italy: A data driven model approach. J. Microbiol. Immunol. Infect. 2020, 53, 396–403. [Google Scholar] [CrossRef] [PubMed]
- Chatterjee, K.; Chauhan, V.S. Epidemics, quarantine and mental health. Med. J. Armed Forces India 2020, 76, 125–127. [Google Scholar] [CrossRef] [PubMed]
- Sharon, G.; Sampson, T.R.; Geschwind, D.H.; Mazmanian, S.K. The central nervous system and the gut microbiome. Cell 2016, 167, 915–932. [Google Scholar] [CrossRef] [PubMed] [Green Version]
- López, L.; Rodó, X. The end of social confinement and COVID-19 re-emergence risk. Nat. Hum. Behav. 2020. [Google Scholar] [CrossRef] [PubMed]
- Chakraborty, T.; Ghosh, I. Real-time forecasts and risk assessment of novel coronavirus (COVID-19) cases: A data-driven analysis. Chaos Solitons Fractals 2020, 135, 109850. [Google Scholar] [CrossRef]
- Williamson, E.J.; Walker, A.J.; Bhaskaran, K.; Bacon, S.; Bates, C.; Morton, C.E.; Curtis, H.J.; Mehrkar, A.; Evans, D.; Inglesby, P.; et al. Factors associated with COVID-19-related death using OpenSAFELY. Nature 2020, 584, 430–436. [Google Scholar] [CrossRef]
- Miller, I.F.; Becker, A.D.; Grenfell, B.T.; Metcalf, C.J.E. Disease and healthcare burden of COVID-19 in the United States. Nat. Med. 2020. [Google Scholar] [CrossRef]
- Worby, C.J.; Chang, H.-H. Face mask use in the general population and optimal resource allocation during the COVID-19 pandemic. Nat. Commun. 2020, 11, 4049. [Google Scholar] [CrossRef]
- Chu, D.K.; Akl, E.A.; Duda, S.; Solo, K.; Yaacoub, S.; Schünemann, H.J.; Chu, D.K.; Akl, E.A.; El-harakeh, A.; Bognanni, A.; et al. Physical distancing, face masks, and eye protection to prevent person-to-person transmission of SARS-CoV-2 and COVID-19: A systematic review and meta-analysis. Lancet 2020, 395, 1973–1987. [Google Scholar] [CrossRef]
- Liang, L.-L.; Tseng, C.-H.; Ho, H.J.; Wu, C.-Y. Covid-19 mortality is negatively associated with test number and government effectiveness. Sci. Rep. 2020, 10, 12567. [Google Scholar] [CrossRef] [PubMed]
- Xu, S.; Li, Y. Beware of the second wave of COVID-19. Lancet 2020, 395, 1321–1322. [Google Scholar] [CrossRef]
- Toyoshima, Y.; Nemoto, K.; Matsumoto, S.; Nakamura, Y.; Kiyotani, K. SARS-CoV-2 genomic variations associated with mortality rate of COVID-19. J. Hum. Genet. 2020. [Google Scholar] [CrossRef] [PubMed]
- Devaux, C.A.; Rolain, J.-M.; Raoult, D. ACE2 receptor polymorphism: Susceptibility to SARS-CoV-2, hypertension, multi-organ failure, and COVID-19 disease outcome. J. Microbiol. Immunol. Infect. 2020, 53, 425–435. [Google Scholar] [CrossRef]
- Liang, W.; Feng, Z.; Rao, S.; Xiao, C.; Xue, X.; Lin, Z.; Zhang, Q.; Qi, W. Diarrhoea may be underestimated: A missing link in 2019 novel coronavirus. Gut 2020, 69, 1141–1143. [Google Scholar] [CrossRef] [Green Version]
- Wu, Y.; Guo, C.; Tang, L.; Hong, Z.; Zhou, J.; Dong, X.; Yin, H.; Xiao, Q.; Tang, Y.; Qu, X.; et al. Prolonged presence of SARS-CoV-2 viral RNA in faecal samples. Lancet Gastroenterol. Hepatol. 2020, 5, 434–435. [Google Scholar] [CrossRef]
- Xu, X.-W.; Wu, X.-X.; Jiang, X.-G.; Xu, K.-J.; Ying, L.-J.; Ma, C.-L.; Li, S.-B.; Wang, H.-Y.; Zhang, S.; Gao, H.-N.; et al. Clinical findings in a group of patients infected with the 2019 novel coronavirus (SARS-Cov-2) outside of Wuhan, China: Retrospective case series. BMJ 2020, 368, m606. [Google Scholar] [CrossRef] [Green Version]
- Holshue, M.L.; DeBolt, C.; Lindquist, S.; Lofy, K.H.; Wiesman, J.; Bruce, H.; Spitters, C.; Ericson, K.; Wilkerson, S.; Tural, A.; et al. First case of 2019 novel coronavirus in the United States. N. Engl. J. Med. 2020, 382, 929–936. [Google Scholar] [CrossRef]
- Zheng, S.; Fan, J.; Yu, F.; Feng, B.; Lou, B.; Zou, Q.; Xie, G.; Lin, S.; Wang, R.; Yang, X.; et al. Viral load dynamics and disease severity in patients infected with SARS-CoV-2 in Zhejiang province, China, January–March 2020: Retrospective cohort study. BMJ 2020, 369, m1443. [Google Scholar] [CrossRef] [Green Version]
- Guan, W.; Ni, Z.; Hu, Y.; Liang, W.; Ou, C.; He, J.; Liu, L.; Shan, H.; Lei, C.; Hui, D.S.C.; et al. Clinical characteristics of coronavirus disease 2019 in China. N. Engl. J. Med. 2020, 382, 1708–1720. [Google Scholar] [CrossRef]
- Huang, C.; Wang, Y.; Li, X.; Ren, L.; Zhao, J.; Hu, Y.; Zhang, L.; Fan, G.; Xu, J.; Gu, X.; et al. Clinical features of patients infected with 2019 novel coronavirus in Wuhan, China. Lancet 2020, 395, 497–506. [Google Scholar] [CrossRef] [Green Version]
- Chen, N.; Zhou, M.; Dong, X.; Qu, J.; Gong, F.; Han, Y.; Qiu, Y.; Wang, J.; Liu, Y.; Wei, Y.; et al. Epidemiological and clinical characteristics of 99 cases of 2019 novel coronavirus pneumonia in Wuhan, China: A descriptive study. Lancet 2020, 395, 507–513. [Google Scholar] [CrossRef] [Green Version]
- Jin, X.; Lian, J.-S.; Hu, J.-H.; Gao, J.; Zheng, L.; Zhang, Y.-M.; Hao, S.-R.; Jia, H.-Y.; Cai, H.; Zhang, X.-L.; et al. Epidemiological, clinical and virological characteristics of 74 cases of coronavirus-infected disease 2019 (COVID-19) with gastrointestinal symptoms. Gut 2020, 69, 1002–1009. [Google Scholar] [CrossRef] [Green Version]
- Zhou, F.; Yu, T.; Du, R.; Fan, G.; Liu, Y.; Liu, Z.; Xiang, J.; Wang, Y.; Song, B.; Gu, X.; et al. Clinical course and risk factors for mortality of adult inpatients with COVID-19 in Wuhan, China: A retrospective cohort study. Lancet 2020, 395, 1054–1062. [Google Scholar] [CrossRef]
- Wang, D.; Hu, B.; Hu, C.; Zhu, F.; Liu, X.; Zhang, J.; Wang, B.; Xiang, H.; Cheng, Z.; Xiong, Y.; et al. Clinical characteristics of 138 hospitalized patients with 2019 novel coronavirus–infected pneumonia in Wuhan, China. JAMA 2020, 323, 1061–1069. [Google Scholar] [CrossRef] [PubMed]
- Lin, L.; Jiang, X.; Zhang, Z.; Huang, S.; Zhang, Z.; Fang, Z.; Gu, Z.; Gao, L.; Shi, H.; Mai, L.; et al. Gastrointestinal symptoms of 95 cases with SARS-CoV-2 infection. Gut 2020, 69, 997–1001. [Google Scholar] [CrossRef] [PubMed]
- Demongeot, J.; Flet-Berliac, Y.; Seligmann, H. Temperature decreases spread parameters of the new covid-19 case dynamics. Biology 2020, 9, 94. [Google Scholar] [CrossRef]
- Gherghel, I.; Bulai, M. Is Romania ready to face the novel coronavirus (COVID-19) outbreak? The role of incoming travelers and that of Romanian diaspora. Travel Med. Infect. Dis. 2020, 34, 101628. [Google Scholar] [CrossRef]


| Year of Publication | Disease | Method | Reference |
|---|---|---|---|
| 2005 | Severe Acute Respiratory Syndrome | ARIMA | [8] |
| 2009 | Malaria | ARIMA | [9] |
| 2011 | Hemorrhagic Fever with Renal Syndrome | ARIMA | [10] |
| 2013 | Hantavirus Pulmonary Syndrome | ARIMA | [11] |
| 2015 | Tuberculosis | ARIMA | [12] |
| 2018 | Influenza | ARIMA | [13] |
| 2020 | Brucellosis | ARIMA | [14] |
| (a) Prevalence | |||||||
| Interval | Mean | SE Mean | St. Dev | Minimum | Maximum | Skewness | Kurtosis |
| 1 March–31 March | 482.866 | 118.415 | 648.588 | 3 | 2245 | 1.49 | 1.21 |
| 1 April–30 April | 7603.551 | 540.324 | 2909.737 | 2738 | 12,240 | −0.03 | −1.23 |
| 1 May–31 May | 16,502.933 | 346.883 | 1899.957 | 12,732 | 19,257 | −0.37 | −0.90 |
| 1 June–30 June | 22,776.689 | 427.610 | 2302.754 | 19,517 | 26,970 | 0.31 | −1.16 |
| 1 July–31 July | 36,874.3 | 1287.582 | 7052.379 | 27,746 | 50,886 | 0.61 | −0.94 |
| 1 August–31 August | 70,602.366 | 1930.889 | 10,575.917 | 53,186 | 87,540 | −0.03 | −1.19 |
| 1 March–31 August | 25,840.071 | 1751.969 | 23,700.201 | 3 | 87,540 | 1.04 | 0.17 |
| (b) Incidence | |||||||
| Interval | Mean | SE Mean | St. Dev | Minimum | Maximum | Skewness | Kurtosis |
| 1 March–31 March | 74.733 | 17.058 | 93.434 | 0 | 308 | 1.33 | 0.69 |
| 1 April–30 April | 337.241 | 16.016 | 86.250 | 190 | 523 | 0.31 | −0.38 |
| 1 May–31 May | 223 | 14.369 | 78.704 | 124 | 431 | 1.08 | 0.59 |
| 1 June–30 June | 261.103 | 16.507 | 88.896 | 119 | 460 | 0.40 | −0.39 |
| 1 July–31 July | 786.333 | 59.450 | 325.623 | 250 | 1356 | 0.19 | −1.28 |
| 1 August–31 August | 1180.966 | 42.478 | 232.664 | 733 | 1504 | −0.63 | −0.85 |
| 1 March–31 August | 478.344 | 31.352 | 424.128 | 0 | 1504 | 1.03 | −0.24 |
| (a) STATGRAPHICS Centurion (v.18.1.13) | ||||
| Romania | Model | RMSE | MAE | MAPE |
| March | (1,2,1) | 40.2064 | 21.7726 | 9.3225 |
| (2,2,0) | 40.1344 | 21.8332 | 9.33149 | |
| (2,1,0) | 37.1349 | 22.3392 | 9.42158 | |
| (3,2,0) | 40.7137 | 22.252 | 9.50679 | |
| (3,0,0) | 36.317 | 21.4381 | 9.58606 | |
| April | (3,2,2) | 84.4845 | 62.4813 | 0.975287 |
| (3,2,3) | 91.4283 | 64.3356 | 0.978607 | |
| (3,2,1) | 86.0235 | 63.5418 | 0.988232 | |
| (1,2,3) | 86.1254 | 66.3094 | 1.03015 | |
| (0,2,3) | 84.8321 | 66.818 | 1.03804 | |
| May | (3,1,3) | 55.1218 | 35.4972 | 0.227675 |
| (3,2,3) | 51.5543 | 37.7316 | 0.233695 | |
| (3,2,2) | 52.2601 | 37.5565 | 0.235246 | |
| (3,2,1) | 52.0651 | 37.7596 | 0.235816 | |
| (3,2,0) | 51.9334 | 38.9065 | 0.243301 | |
| June | (3,2,2) | 53.3883 | 36.8425 | 0.161412 |
| (3,2,3) | 55.042 | 36.8814 | 0.161561 | |
| (3,1,3) | 66.319 | 45.2191 | 0.195068 | |
| (2,1,3) | 66.8927 | 47.8626 | 0.207124 | |
| July | (3,1,3) | 117.982 | 87.1512 | 0.243285 |
| (2,1,1) | 113.198 | 88.1797 | 0.24369 | |
| (2,1,2) | 115.679 | 88.7863 | 0.245774 | |
| (1,1,2) | 115.307 | 92.5001 | 0.256055 | |
| August | (2,2,2) | 153.804 | 113.314 | 0.163873 |
| (3,2,2) | 155.701 | 114.742 | 0.164574 | |
| (3,2,3) | 159.39 | 115.195 | 0.165348 | |
| March–August | (1,2,1) | 121.674 | 85.2619 | 2.29175 |
| (3,2,3) | 118.411 | 82.2194 | 2.37771 | |
| (1,2,3) | 118.36 | 82.5649 | 2.37918 | |
| (3,2,1) | 113.778 | 80.2205 | 2.40063 | |
| (3,2,0) | 121.301 | 84.6413 | 2.41403 | |
| (b) IBM SPSS (v.20.0.0) | ||||
| Romania | Model | RMSE | MAE | MAPE |
| March | (1,2,1) | 38.127 | 24.651 | 57.505 |
| April | (3,2,2) | 96.089 | 68.365 | 1.152 |
| May | (3,1,3) | 68.403 | 39.996 | 0.259 |
| June | (3,2,2) | 58.588 | 41.854 | 0.185 |
| July | (3,1,3) | 156.476 | 106.572 | 0.307 |
| August | (2,2,2) | 179.309 | 129.350 | 0.194 |
| March–August | (1,2,1) | 121.054 | 85.524 | 6.013 |
| (a) STATGRAPHICS Centurion (v.18.1.13) | ||||||
| Romania | Parameters | Estimate | Standard Error | t-Statistic | p-Value | |
| March (1,2,1) | AR(1) MA(1) | −0.865514 −0.209212 | 0.194131 0.291261 | −4.45841 −0.718298 | 0.000131 0.478744 | |
| April (3,2,2) | AR(3) MA(2) | −0.329312 −0.528086 | 0.225307 0.247375 | −1.46161 −2.13475 | 0.157377 0.043660 | |
| May (3,1,3) | AR(3) MA(3) | 0.625887 0.570657 | 0.145922 0.0544548 | 4.28918 10.4795 | 0.000253 0.000000 | |
| June (3,2,2) | AR(3) MA(2) | −0.312216 −0.964198 | 0.209998 0.0269271 | −1.48676 −35.8077 | 0.150660 0.000000 | |
| July (3,1,3) | AR(3) MA(3) | −0.560219 −0.0478648 | 0.258752 0.274587 | −2.16508 −0.174315 | 0.040545 0.863080 | |
| August (2,2,2) | AR(2) MA(2) | −0.826566 −0.782937 | 0.112664 0.171731 | −7.33655 −4.5591 | 0.000000 0.000117 | |
| March–August (1,2,1) | AR(1) MA(1) | 0.479999 0.781228 | 0.122096 0.0765947 | 3.93133 10.1995 | 0.000120 0.000000 | |
| (b) IBM SPSS (v.20.0.0) | ||||||
| ARIMA Model Parameters | ||||||
| Estimate | Standard Error | |||||
| Cumulative-Model (March) | Cumulative | No Transformation | Constant | 8.881 | 3.986 | |
| AR | Lag 1 | −0.740 | 0.206 | |||
| Difference | 2 | |||||
| MA | Lag 1 | 0.037 | 0.287 | |||
| t-statistic | p-value | |||||
| Cumulative-Model (March) | Cumulative | No Transformation | Constant | 2.228 | 0.035 | |
| AR | Lag 1 | −3.595 | −0.001 | |||
| Difference | ||||||
| MA | Lag 1 | 0.130 | 0.898 | |||
| Estimate | Standard Error | |||||
| Cumulative-Model (April) | Cumulative | No Transformation | Constant | −0.902 | 1.468 | |
| AR | Lag 1 | 0.210 | 0.486 | |||
| Lag 2 | −0.216 | 0.203 | ||||
| Lag 3 | −0.268 | 0.257 | ||||
| Difference | 2 | |||||
| MA | Lag 1 | 1.527 | 22.293 | |||
| Lag 2 | −0.528 | 11.600 | ||||
| t-statistic | p-value | |||||
| Cumulative-Model (April) | Cumulative | No Transformation | Constant | −0.615 | 0.545 | |
| AR | Lag 1 | 0.432 | 0.670 | |||
| Lag 2 | −1.065 | 0.298 | ||||
| Lag 3 | −1.042 | 0.309 | ||||
| Difference | ||||||
| MA | Lag 1 | 0.069 | 0.946 | |||
| Lag 2 | −0.046 | 0.964 | ||||
| Estimate | Standard Error | |||||
| Cumulative-Model (May) | Cumulative | No Transformation | Constant | 216.917 | 46.423 | |
| AR | Lag 1 | −0.013 | 0.498 | |||
| Lag 2 | 0.252 | 0.348 | ||||
| Lag 3 | 0.480 | 0.348 | ||||
| Difference | 1 | |||||
| MA | Lag 1 | −0.641 | 3.924 | |||
| Lag 2 | −0.258 | 4.043 | ||||
| Lag 3 | 0.591 | 3.576 | ||||
| t-statistic | p-value | |||||
| Cumulative-Model (May) | Cumulative | No Transformation | Constant | 4.673 | 0.000 | |
| AR | Lag 1 | −0.026 | 0.980 | |||
| Lag 2 | 0.725 | 0.476 | ||||
| Lag 3 | 1.381 | 0.181 | ||||
| Difference | ||||||
| MA | Lag 1 | −0.163 | 0.872 | |||
| Lag 2 | −0.064 | 0.950 | ||||
| Lag 3 | 0.165 | 0.870 | ||||
| Estimate | Standard Error | |||||
| Cumulative-Model (June) | Cumulative | No Transformation | Constant | 8.194 | 1.482 | |
| AR | Lag 1 | 0.161 | 0.487 | |||
| Lag 2 | −0.159 | 0.291 | ||||
| Lag 3 | −0.451 | 0.234 | ||||
| Difference | 2 | |||||
| MA | Lag 1 | 0.914 | 4.922 | |||
| Lag 2 | 0.080 | 0.849 | ||||
| t-statistic | p-value | |||||
| Cumulative-Model (June) | Cumulative | No Transformation | Constant | 5.529 | 0.000 | |
| AR | Lag 1 | 0.332 | 0.743 | |||
| Lag 2 | −0.549 | 0.589 | ||||
| Lag 3 | −1.928 | 0.067 | ||||
| Difference | ||||||
| MA | Lag 1 | 0.186 | 0.854 | |||
| Lag 2 | 0.094 | 0.926 | ||||
| Estimate | Standard Error | |||||
| Cumulative-Model (July) | Cumulative | No Transformation | Constant | 837.899 | 505.059 | |
| AR | Lag 1 | 0.274 | 20.176 | |||
| Lag 2 | 0.753 | 3.824 | ||||
| Lag 3 | −0.087 | 15.011 | ||||
| Difference | 1 | |||||
| MA | Lag 1 | −0.629 | 20.192 | |||
| Lag 2 | 0.259 | 14.442 | ||||
| Lag 3 | −0.003 | 3.383 | ||||
| t-statistic | p-value | |||||
| Cumulative-Model (July) | Cumulative | No Transformation | Constant | 1.659 | 0.111 | |
| AR | Lag 1 | 0.014 | 0.989 | |||
| Lag 2 | 0.197 | 0.846 | ||||
| Lag 3 | −0.006 | 0.995 | ||||
| Difference | ||||||
| MA | Lag 1 | −0.031 | 0.975 | |||
| Lag 2 | 0.018 | 0.986 | ||||
| Lag 3 | −0.001 | 0.999 | ||||
| Estimate | Standard Error | |||||
| Cumulative-Model (August) | Cumulative | No Transformation | Constant | −4.351 | 1.253 | |
| AR | Lag 1 | 1.120 | 0.139 | |||
| Lag 2 | −0.832 | 0.107 | ||||
| Difference | 2 | |||||
| MA | Lag 1 | 1.978 | 6.107 | |||
| Lag 2 | −0.995 | 6.084 | ||||
| t-statistic | p-value | |||||
| Cumulative-Model (August) | Cumulative | No Transformation | Constant | −3.474 | 0.002 | |
| AR | Lag 1 | 8.077 | 0.000 | |||
| Lag 2 | −7.804 | 0.000 | ||||
| Difference | ||||||
| MA | Lag 1 | 0.324 | 0.749 | |||
| Lag 2 | −0.164 | 0.871 | ||||
| Estimate | Standard Error | |||||
| Cumulative-Model (March–August) | Cumulative | No Transformation | Constant | 5.885 | 3.318 | |
| AR | Lag 1 | 0.501 | 0.126 | |||
| Difference | 2 | |||||
| MA | Lag 1 | 0.820 | 0.084 | |||
| t-statistic | p-value | |||||
| Cumulative-Model (March–August) | Cumulative | No Transformation | Constant | 1.773 | 0.078 | |
| AR | Lag 1 | 3.985 | 0.000 | |||
| Difference | ||||||
| MA | Lag 1 | 9.712 | 0.000 | |||
| (a) STATGRAPHICS Centurion (v.18.1.13) | |||||||
| March (1,2,1) | |||||||
| Lower 95% | Upper 95% | ||||||
| Period | Forecast | Limit | Limit | ||||
| 01-4-20 | 2450.74 | 2368.24 | 2533.23 | ||||
| 02-4-20 | 2732.0 | 2593.82 | 2870.18 | ||||
| 03-4-20 | 2947.89 | 2716.13 | 3179.66 | ||||
| 04-4-20 | 3220.37 | 2900.32 | 3540.42 | ||||
| 05-4-20 | 3443.87 | 3011.65 | 3876.09 | ||||
| 06-4-20 | 3709.76 | 3166.05 | 4253.47 | ||||
| 07-4-20 | 3938.96 | 3266.6 | 4611.32 | ||||
| 08-4-20 | 4199.91 | 3397.23 | 5002.6 | ||||
| 09-4-20 | 4433.39 | 3487.15 | 5379.63 | ||||
| 10-4-20 | 4690.65 | 3597.86 | 5783.43 | ||||
| 11-4-20 | 4927.32 | 3677.29 | 6177.34 | ||||
| 12-4-20 | 5181.81 | 3770.81 | 6592.81 | ||||
| 13-4-20 | 5420.88 | 3839.91 | 7001.84 | ||||
| 14-4-20 | 5673.29 | 3918.22 | 7428.36 | ||||
| April (3,2,2) | |||||||
| Lower 95% | Upper 95% | ||||||
| Period | Forecast | Limit | Limit | ||||
| 01-5-20 | 12,616.5 | 12,440.4 | 12,792.5 | ||||
| 02-5-20 | 12,959.9 | 12,738.5 | 13,181.4 | ||||
| 03-5-20 | 13,302.9 | 13,061.4 | 13,544.4 | ||||
| 04-5-20 | 13,615.5 | 13,368.8 | 13,862.3 | ||||
| 05-5-20 | 13,932.3 | 13,674.7 | 14,189.9 | ||||
| 06-5-20 | 14,257.0 | 13,975.5 | 14,538.5 | ||||
| 07-5-20 | 14,592.6 | 14,276.6 | 14,908.7 | ||||
| 08-5-20 | 14,927.5 | 14,579.7 | 15,275.3 | ||||
| 09-5-20 | 15,257.2 | 14,883.3 | 15,631.0 | ||||
| 10-5-20 | 15,582.2 | 15,184.3 | 15,980.1 | ||||
| 11-5-20 | 15,907.6 | 15,482.8 | 16,332.4 | ||||
| 12-5-20 | 16,235.9 | 15,779.8 | 16,692.0 | ||||
| 13-5-20 | 16,566.2 | 16,076.4 | 17,056.0 | ||||
| 14-5-20 | 16,896.3 | 16,372.8 | 17,419.8 | ||||
| May (3,1,3) | |||||||
| Lower 95% | Upper 95% | ||||||
| Period | Forecast | Limit | Limit | ||||
| 01-6-20 | 19,400.9 | 19,280.2 | 19,521.5 | ||||
| 02-6-20 | 19,533.0 | 19,286.3 | 19,779.8 | ||||
| 03-6-20 | 19,689.2 | 19,296.5 | 20,081.9 | ||||
| 04-6-20 | 19,831.8 | 19,307.7 | 20,355.9 | ||||
| 05-6-20 | 19,971.4 | 19,290.8 | 20,651.9 | ||||
| 06-6-20 | 20,122.2 | 19,270.7 | 20,973.7 | ||||
| 07-6-20 | 20,265.2 | 19,240.9 | 21,289.5 | ||||
| 08-6-20 | 20,408.1 | 19,194.8 | 21,621.5 | ||||
| 09-6-20 | 20,556.2 | 19,143.4 | 21,968.9 | ||||
| 10-6-20 | 20,699.9 | 19,081.8 | 22,318.0 | ||||
| 11-6-20 | 20,844.3 | 19,009.0 | 22,679.7 | ||||
| 12-6-20 | 20,991.0 | 18,929.9 | 23,052.1 | ||||
| 13-6-20 | 21,135.4 | 18,841.3 | 23,429.4 | ||||
| 14-6-20 | 21,280.5 | 18,744.1 | 23,816.9 | ||||
| June (3,2,2) | |||||||
| Lower 95% | Upper 95% | ||||||
| Period | Forecast | Limit | Limit | ||||
| 01-7-20 | 27,404.9 | 27,291.5 | 27,518.3 | ||||
| 02-7-20 | 27,860.4 | 27,673.0 | 28,047.7 | ||||
| 03-7-20 | 28,267.6 | 28,019.4 | 28,515.8 | ||||
| 04-7-20 | 28,608.4 | 28,307.9 | 28,908.9 | ||||
| 05-7-20 | 28,916.8 | 28,551.9 | 29,281.8 | ||||
| 06-7-20 | 29,253.3 | 28,792.0 | 29,714.6 | ||||
| 07-7-20 | 29,652.8 | 29,060.9 | 30,244.7 | ||||
| 08-7-20 | 30,097.5 | 29,360.4 | 30,834.6 | ||||
| 09-7-20 | 30,533.1 | 29,658.3 | 31,407.9 | ||||
| 10-7-20 | 30,914.6 | 29,916.3 | 31,912.9 | ||||
| 11-7-20 | 31,243.0 | 30,126.4 | 32,359.6 | ||||
| 12-7-20 | 31,562.8 | 30,317.0 | 32,808.5 | ||||
| 13-7-20 | 31,924.0 | 30,526.8 | 33,321.1 | ||||
| 14-7-20 | 32,340.9 | 30,772.3 | 33,909.5 | ||||
| July (3,1,3) | |||||||
| Lower 95% | Upper 95% | ||||||
| Period | Forecast | Limit | Limit | ||||
| 01-8-20 | 52,247.6 | 51,999.2 | 52,496.1 | ||||
| 02-8-20 | 53,668.7 | 53,169.6 | 54,167.9 | ||||
| 03-8-20 | 55,147.3 | 54,390.9 | 55,903.6 | ||||
| 04-8-20 | 56,685.2 | 55,656.5 | 57,714.0 | ||||
| 05-8-20 | 58,282.6 | 56,976.8 | 59,588.5 | ||||
| 06-8-20 | 59,942.3 | 58,346.7 | 61,537.9 | ||||
| 07-8-20 | 61,665.3 | 59,772.1 | 63,558.4 | ||||
| 08-8-20 | 63,454.6 | 61,250.0 | 65,659.3 | ||||
| 09-8-20 | 65,311.9 | 62,784.7 | 67,839.2 | ||||
| 10-8-20 | 67,240.4 | 64,374.9 | 70,106.0 | ||||
| 11-8-20 | 69,242.1 | 66,024.5 | 72,459.8 | ||||
| 12-8-20 | 71,320.4 | 67,733.2 | 74,907.6 | ||||
| 13-8-20 | 73,477.6 | 69,504.9 | 77,450.3 | ||||
| 14-8-20 | 75,717.2 | 71,340.0 | 80,094.4 | ||||
| August (2,2,2) | |||||||
| Lower 95% | Upper 95% | ||||||
| Period | Forecast | Limit | Limit | ||||
| 01-9-20 | 88,483.4 | 88,163.3 | 88,803.4 | ||||
| 02-9-20 | 89,735.8 | 89,186.2 | 90,285.4 | ||||
| 03-9-20 | 91,171.6 | 90,521.1 | 91,822.0 | ||||
| 04-9-20 | 92,553.1 | 91,883.1 | 93,223.0 | ||||
| 05-9-20 | 93,723.4 | 93,050.4 | 94,396.4 | ||||
| 06-9-20 | 94,707.0 | 94,020.1 | 95,393.9 | ||||
| 07-9-20 | 95,660.3 | 94,899.8 | 96,420.7 | ||||
| 08-9-20 | 96,734.6 | 95,825.9 | 97,643.3 | ||||
| 09-9-20 | 97,966.8 | 96,901.4 | 99,032.2 | ||||
| 10-9-20 | 99,272.2 | 98,093.1 | 100,451. | ||||
| 11-9-20 | 100,527. | 99,273.2 | 101,781. | ||||
| 12-9-20 | 101,667. | 100,347. | 102,986. | ||||
| 13-9-20 | 102,721. | 101,316. | 104,126. | ||||
| 14-9-20 | 103,777. | 102,249. | 105,305. | ||||
| March–August (1,2,1) | |||||||
| Lower 95% | Upper 95% | ||||||
| Period | Forecast | Limit | Limit | ||||
| 01-9-20 | 88,427.4 | 88,187.3 | 88,667.5 | ||||
| 02-9-20 | 89,378.4 | 88,905.1 | 89,851.7 | ||||
| 03-9-20 | 90,359.9 | 89,641.2 | 91,078.7 | ||||
| 04-9-20 | 91,356.1 | 90,382.1 | 92,330.1 | ||||
| 05-9-20 | 92,359.3 | 91,120.4 | 93,598.2 | ||||
| 06-9-20 | 93,365.8 | 91,851.8 | 94,879.9 | ||||
| 07-9-20 | 94,374.0 | 92,574.3 | 96,173.7 | ||||
| 08-9-20 | 95,383.0 | 93,286.8 | 97,479.2 | ||||
| 09-9-20 | 96,392.3 | 93,988.7 | 98,796.0 | ||||
| 10-9-20 | 97,401.8 | 94,679.8 | 100,124. | ||||
| 11-9-20 | 98,411.4 | 95,360.3 | 101,463. | ||||
| 12-9-20 | 99,421.1 | 96,030.1 | 102,812. | ||||
| 13-9-20 | 100,431. | 96,689.5 | 104,172. | ||||
| 14-9-20 | 101,440. | 97,338.6 | 105,542. | ||||
| (b) IBM SPSS (v.20.0.0) | |||||||
| Forecast | |||||||
| Model | Day 1 | Day 2 | Day 3 | Day 4 | Day 5 | Day 6 | |
| Cumulative-Model (March) | Forecast | 2478.78 | 2771.81 | 3036.46 | 3337.56 | 3627.14 | 3940.69 |
| UCL | 2557.11 | 2895.56 | 3237.39 | 3612.37 | 3992.87 | 4399.42 | |
| LCL | 2400.44 | 2648.06 | 2835.53 | 3062.74 | 3261.42 | 3481.96 | |
| Model | Day 7 | Day 8 | Day 9 | Day 10 | Day 11 | Day 12 | |
| Cumulative-Model (March) | Forecast | 4251.96 | 4580.37 | 4911.55 | 5256.13 | 5606.25 | 5967.72 |
| UCL | 4814.73 | 5251.20 | 5698.58 | 6164.03 | 6641.61 | 7135.33 | |
| LCL | 3689.20 | 3909.55 | 4124.53 | 4348.24 | 4570.89 | 4800.11 | |
| Model | Day 13 | Day 14 | |||||
| Cumulative-Model (March) | Forecast | 6336.24 | 6715.00 | ||||
| UCL | 7641.78 | 8163.17 | |||||
| LCL | 5030.71 | 5266.84 | |||||
| Forecast | |||||||
| Model | Day 1 | Day 2 | Day 3 | Day 4 | Day 5 | Day 6 | |
| Cumulative-Model (April) | Forecast | 12,599.76 | 12,935.87 | 13,271.55 | 13,584.87 | 13,898.80 | 14,216.66 |
| UCL | 12,774.44 | 13,150.93 | 13,500.98 | 13,816.96 | 14,136.69 | 14,467.65 | |
| LCL | 12,425.08 | 12,720.81 | 13,042.12 | 13,352.78 | 13,660.91 | 13,965.67 | |
| Model | Day 7 | Day 8 | Day 9 | Day 10 | Day 11 | Day 12 | |
| Cumulative-Model (April) | Forecast | 14,540.05 | 14,862.45 | 15,181.23 | 15,496.84 | 15,811.68 | 16,126.86 |
| UCL | 14,808.71 | 15,145.84 | 15,475.55 | 15,800.64 | 16,125.74 | 16,452.34 | |
| LCL | 14,271.39 | 14,579.05 | 14,886.92 | 15,193.03 | 15,497.61 | 15,801.38 | |
| Model | Day 13 | Day 14 | |||||
| Cumulative-Model (April) | Forecast | 16,441.99 | 16,756.08 | ||||
| UCL | 16,779.10 | 17,104.18 | |||||
| LCL | 16,104.88 | 16,407.98 | |||||
| Forecast | |||||||
| Model | Day 1 | Day 2 | Day 3 | Day 4 | Day 5 | Day 6 | |
| Cumulative-Model (May) | Forecast | 19,412.18 | 19,569.68 | 19,763.17 | 19,935.78 | 20,118.83 | 20,313.78 |
| UCL | 19,543.30 | 19,816.82 | 20,130.38 | 20,397.32 | 20,688.05 | 20,989.84 | |
| LCL | 19,281.05 | 19,322.54 | 19,395.96 | 19,474.23 | 19,549.62 | 19,637.71 | |
| Model | Day 7 | Day 8 | Day 9 | Day 10 | Day 11 | Day 12 | |
| Cumulative-Model (May) | Forecast | 20,501.17 | 20,696.67 | 20,895.88 | 21,093.45 | 21,295.88 | 21,499.60 |
| UCL | 21,277.17 | 21,576.47 | 21,877.30 | 22,173.28 | 22,473.47 | 22,773.08 | |
| LCL | 19,725.17 | 19,816.88 | 19,914.45 | 20,013.63 | 20,118.28 | 20,226.12 | |
| Model | Day 13 | Day 14 | |||||
| Cumulative-Model (May) | Forecast | 21,703.75 | 21,910.55 | ||||
| UCL | 23,071.27 | 23,369.65 | |||||
| LCL | 20,336.23 | 20,451.44 | |||||
| Forecast | |||||||
| Model | Day 1 | Day 2 | Day 3 | Day 4 | Day 5 | Day 6 | |
| Cumulative-Model (June) | Forecast | 27,405.69 | 27,851.25 | 28,248.97 | 28,627.75 | 29,018.52 | 29,447.71 |
| UCL | 27,520.95 | 28,038.23 | 28,481.50 | 28,874.60 | 29,273.56 | 29,714.32 | |
| LCL | 27,290.42 | 27,664.28 | 28,016.44 | 28,380.90 | 28,763.48 | 29,181.10 | |
| Model | Day 7 | Day 8 | Day 9 | Day 10 | Day 11 | Day 12 | |
| Cumulative-Model (June) | Forecast | 29,901.63 | 30,359.87 | 30,809.40 | 31,257.55 | 31,716.79 | 32,193.86 |
| UCL | 30,190.48 | 30,674.74 | 31,145.84 | 31,609.14 | 32,081.24 | 32,572.50 | |
| LCL | 29,612.78 | 30,045.00 | 30,472.95 | 30,905.96 | 31,352.35 | 31,815.21 | |
| Model | Day 13 | Day 14 | |||||
| Cumulative-Model (June) | Forecast | 32,684.53 | 33,181.42 | ||||
| UCL | 33,079.98 | 33,594.43 | |||||
| LCL | 32,289.08 | 32,768.41 | |||||
| Forecast | |||||||
| Model | Day 1 | Day 2 | Day 3 | Day 4 | Day 5 | Day 6 | |
| Cumulative-Model (July) | Forecast | 52,168.29 | 53,426.67 | 54,674.30 | 55,902.11 | 57,118.49 | 58,317.76 |
| UCL | 52,449.73 | 54,031.51 | 55,633.07 | 57,264.85 | 58,911.15 | 60,573.52 | |
| LCL | 51,886.84 | 52,821.82 | 53,715.54 | 54,539.37 | 55,325.84 | 56,061.99 | |
| Model | Day 7 | Day 8 | Day 9 | Day 10 | Day 11 | Day 12 | |
| Cumulative-Model (July) | Forecast | 59,505.46 | 60,678.11 | 61,839.43 | 62,987.33 | 64,124.34 | 65,249.25 |
| UCL | 62,244.36 | 63,923.34 | 65,606.40 | 67,292.68 | 68,979.84 | 70,666.96 | |
| LCL | 56,766.56 | 57,432.88 | 58,072.46 | 58,681.98 | 59,268.84 | 59,831.54 | |
| Model | Day 13 | Day 14 | |||||
| Cumulative-Model (July) | Forecast | 66,363.83 | 67,467.42 | ||||
| UCL | 72,352.60 | 74,035.96 | |||||
| LCL | 60,375.05 | 60,898.88 | |||||
| Forecast | |||||||
| Model | Day 1 | Day 2 | Day 3 | Day 4 | Day 5 | Day 6 | |
| Cumulative-Model (August) | Forecast | 88,444.38 | 89,634.01 | 91,015.67 | 92,372.04 | 93,537.29 | 94,506.51 |
| UCL | 88,730.43 | 90,079.75 | 91,493.00 | 92,852.85 | 94,048.38 | 95,027.52 | |
| LCL | 88,158.32 | 89,188.27 | 90,538.35 | 91,891.23 | 93,026.19 | 93,985.50 | |
| Model | Day 7 | Day 8 | Day 9 | Day 10 | Day 11 | Day 12 | |
| Cumulative-Model (August) | Forecast | 95,412.10 | 96,406.37 | 97,549.71 | 98,783.13 | 99,990.33 | 101,090.16 |
| UCL | 95,938.80 | 96,978.64 | 98,171.45 | 99,421.94 | 100,629.11 | 101,728.19 | |
| LCL | 94,885.41 | 95,834.09 | 96,927.97 | 98,144.32 | 99,351.54 | 100,452.13 | |
| Model | Day 13 | Day 14 | |||||
| Cumulative-Model (August) | Forecast | 102,088.51 | 103,059.41 | ||||
| UCL | 102,726.16 | 103,708.74 | |||||
| LCL | 101,450.85 | 102,410.08 | |||||
| Forecast | |||||||
| Model | Day 1 | Day 2 | Day 3 | Day 4 | Day 5 | Day 6 | |
| Cumulative-Model (March–August) | Forecast | 88,451.83 | 89,445.12 | 90,482.12 | 91,543.96 | 92,621.15 | 93,708.98 |
| UCL | 88,690.71 | 89,912.30 | 91,185.57 | 92,489.10 | 93,813.54 | 95,154.94 | |
| LCL | 88,212.96 | 88,977.94 | 89,778.67 | 90,598.81 | 91,428.77 | 92,263.03 | |
| Model | Day 7 | Day 8 | Day 9 | Day 10 | Day 11 | Day 12 | |
| Cumulative-Model (March–August) | Forecast | 94,805.08 | 95,908.24 | 97,017.89 | 98,133.72 | 99,255.59 | 100,383.41 |
| UCL | 96,511.68 | 97,883.14 | 99,269.09 | 100,669.45 | 102,084.15 | 103,513.14 | |
| LCL | 93,098.47 | 93,933.34 | 94,766.69 | 95,598.00 | 96,427.02 | 97,253.68 | |
| Model | Day 13 | Day 14 | |||||
| Cumulative-Model (March–August) | Forecast | 101,517.16 | 102,656.81 | ||||
| UCL | 104,956.35 | 106,413.66 | |||||
| LCL | 98,077.97 | 98,899.95 | |||||
Publisher’s Note: MDPI stays neutral with regard to jurisdictional claims in published maps and institutional affiliations. |
© 2020 by the authors. Licensee MDPI, Basel, Switzerland. This article is an open access article distributed under the terms and conditions of the Creative Commons Attribution (CC BY) license (http://creativecommons.org/licenses/by/4.0/).
Share and Cite
Ilie, O.-D.; Ciobica, A.; Doroftei, B. Testing the Accuracy of the ARIMA Models in Forecasting the Spreading of COVID-19 and the Associated Mortality Rate. Medicina 2020, 56, 566. https://doi.org/10.3390/medicina56110566
Ilie O-D, Ciobica A, Doroftei B. Testing the Accuracy of the ARIMA Models in Forecasting the Spreading of COVID-19 and the Associated Mortality Rate. Medicina. 2020; 56(11):566. https://doi.org/10.3390/medicina56110566
Chicago/Turabian StyleIlie, Ovidiu-Dumitru, Alin Ciobica, and Bogdan Doroftei. 2020. "Testing the Accuracy of the ARIMA Models in Forecasting the Spreading of COVID-19 and the Associated Mortality Rate" Medicina 56, no. 11: 566. https://doi.org/10.3390/medicina56110566