Differentiation of Clear Cell Renal Cell Carcinoma from other Renal Cell Carcinoma Subtypes and Benign Oncocytoma Using Quantitative MDCT Enhancement Parameters
Abstract
:1. Introduction
2. Materials and Methods
2.1. Patients
2.2. CT Acquisition and Renal Mass Protocol
2.3. CT Image Analysis
2.4. Interobserver Reproducibility
2.5. Statistical Analysis
3. Results
4. Discussion
5. Conclusions
Author Contributions
Funding
Conflicts of Interest
References
- Chow, W.-H.; Dong, L.M.; Devesa, S.S. Epidemiology and risk factors for kidney cancer. Nat. Rev. Urol. 2010, 7, 245–257. [Google Scholar] [CrossRef]
- Moch, H.; Cubilla, A.L.; Humphrey, P.A.; Reuter, V.E.; Ulbright, T.M. The 2016 WHO Classification of Tumours of the Urinary System and Male Genital Organs—Part A: Renal, Penile, and Testicular Tumours. Eur. Urol. 2016, 70, 93–105. [Google Scholar] [CrossRef] [PubMed]
- Inamura, K. Renal Cell Tumors: Understanding Their Molecular Pathological Epidemiology and the 2016 WHO Classification. Int. J. Mol. Sci. 2017, 18, 2195. [Google Scholar] [CrossRef] [PubMed] [Green Version]
- Finelli, A.; Ismaila, N.; Bro, B.; Durack, J.; Eggener, S.; Evans, A.; Gill, I.; Graham, D.; Huang, W.; Jewett, M.A.; et al. Management of Small Renal Masses: American Society of Clinical Oncology Clinical Practice Guideline. J. Clin. Oncol. 2017, 35, 668–680. [Google Scholar] [CrossRef]
- Brookman-May, S.D.; Johannsen, M.; May, M.; Hoschke, B.; Gunschera, J.; Wieland, W.F.; Burger, M. Difference between Clinical and Pathologic Renal Tumor Size, Correlation with Survival, and Implications for Patient Counseling Regarding Nephron-Sparing Surgery. Am. J. Roentgenol. 2011, 197, 1137–1145. [Google Scholar] [CrossRef] [PubMed]
- Davenport, M.S.; Caoili, E.M. Role of Percutaneous Needle Biopsy for Renal Masses. Semin. Interv. Radiol. 2014, 31, 20–26. [Google Scholar] [CrossRef] [PubMed] [Green Version]
- Lane, B.R.; Babineau, D.; Kattan, M.W.; Novick, A.C.; Gill, I.S.; Zhou, M.; Weight, C.J.; Campbell, S.C. A Preoperative Prognostic Nomogram for Solid Enhancing Renal Tumors 7 cm or Less Amenable to Partial Nephrectomy. J. Urol. 2007, 178, 429–434. [Google Scholar] [CrossRef]
- Campbell, S.; Uzzo, R.G.; Allaf, M.E.; Bass, E.B.; Cadeddu, J.A.; Chang, A.; Clark, P.E.; Davis, B.J.; Derweesh, I.H.; Giambarresi, L.; et al. Renal Mass and Localized Renal Cancer: AUA Guideline. J. Urol. 2017, 198, 520–529. [Google Scholar] [CrossRef] [Green Version]
- Motzer, R.J.; Jonasch, E.; Agarwal, N.; Bhayani, S.; Bro, W.P.; Chang, S.S.; Choueiri, T.K.; Costello, B.A.; Derweesh, I.H.; Fishman, M.; et al. Kidney Cancer, Version 2.2017, NCCN Clinical Practice Guidelines in Oncology. J. Natl. Compr. Cancer Netw. 2017, 15, 804–834. [Google Scholar] [CrossRef]
- Kopp, R.P.; Aganovic, L.; Palazzi, K.L.; Cassidy, F.H.; Sakamoto, K.; Derweesh, I.H. Differentiation of clear from non-clear cell renal cell carcinoma using CT washout formula. Can. J. Urol. 2013, 20, 6790–6797. [Google Scholar]
- Herts, B.R.; Coll, D.M.; Novick, A.C.; Obuchowski, N.; Linnell, G.; Wirth, S.L.; Baker, M.E. Enhancement Characteristics of Papillary Renal Neoplasms Revealed on Triphasic Helical CT of the Kidneys. Am. J. Roentgenol. 2002, 178, 367–372. [Google Scholar] [CrossRef] [PubMed]
- De Leon, A.D.; Davenport, M.S.; Silverman, S.G.; Schieda, N.; Cadeddu, J.A.; Pedrosa, I. Role of Virtual Biopsy in the Management of Renal Masses. Am. J. Roentgenol. 2019, 212, 1–10. [Google Scholar] [CrossRef] [PubMed]
- Sanchez, A.; Feldman, A.S.; Hakimi, A.A. Current Management of Small Renal Masses, Including Patient Selection, Renal Tumor Biopsy, Active Surveillance, and Thermal Ablation. J. Clin. Oncol. 2018, 36, 3591–3600. [Google Scholar] [CrossRef]
- Sheir, K.Z.; El-Azab, M.; Mosbah, A.; El-Baz, M.; Shaaban, A.A. Differentiation of Renal Cell Carcinoma Subtypes by Multislice Computerized Tomography. J. Urol. 2005, 174, 451–455. [Google Scholar] [CrossRef] [Green Version]
- Coy, H.; Young, J.R.; Douek, M.L.; Pantuck, A.; Brown, M.S.; Sayre, J.; Raman, S.S. Association of qualitative and quantitative imaging features on multiphasic multidetector CT with tumor grade in clear cell renal cell carcinoma. Abdom. Radiol. 2018, 44, 180–189. [Google Scholar] [CrossRef]
- Huhdanpaa, H.T.; Hwang, D.; Cen, S.; Quinn, B.; Nayyar, M.; Zhang, X.; Chen, F.; Desai, B.; Liang, G.; Gill, I.; et al. CT prediction of the Fuhrman grade of clear cell renal cell carcinoma (RCC): Towards the development of computer-assisted diagnostic method. Abdom. Imaging 2015, 40, 3168–3174. [Google Scholar] [CrossRef] [PubMed]
- Bird, V.G.; Kanagarajah, P.; Morillo, G.; Caruso, D.J.; Ayyathurai, R.; Leveillee, R.; Jorda, M. Differentiation of oncocytoma and renal cell carcinoma in small renal masses (<4 cm): The role of 4-phase computerized tomography. World J. Urol. 2011, 29, 787–792. [Google Scholar] [CrossRef] [PubMed]
- Zhang, J.; Lefkowitz, R.A.; Ishill, N.M.; Wang, L.; Moskowitz, C.S.; Russo, P.; Eisenberg, H.; Hricak, H. Solid Renal Cortical Tumors: Differentiation with CT. Radiology 2007, 244, 494–504. [Google Scholar] [CrossRef] [PubMed]
- Young, J.R.; Margolis, D.; Sauk, S.; Pantuck, A.J.; Sayre, J.; Raman, S. Clear Cell Renal Cell Carcinoma: Discrimination from Other Renal Cell Carcinoma Subtypes and Oncocytoma at Multiphasic Multidetector CT. Radiology 2013, 267, 444–453. [Google Scholar] [CrossRef]
- Coy, H.; Young, J.R.; Douek, M.L.; Brown, M.S.; Sayre, J.; Raman, S.S. Quantitative computer-aided diagnostic algorithm for automated detection of peak lesion attenuation in differentiating clear cell from papillary and chromophobe renal cell carcinoma, oncocytoma, and fat-poor angiomyolipoma on multiphasic multidetector computed tomography. Abdom. Radiol. 2017, 42, 1919–1928. [Google Scholar] [CrossRef]
- Lee-Felker, S.; Felker, E.R.; Tan, N.; Margolis, D.; Young, J.R.; Sayre, J.; Raman, S. Qualitative and Quantitative MDCT Features for Differentiating Clear Cell Renal Cell Carcinoma from Other Solid Renal Cortical Masses. Am. J. Roentgenol. 2014, 203, 516–524. [Google Scholar] [CrossRef]
- Kim, S.H.; Kim, C.S.; Kim, M.J.; Cho, J.Y.; Cho, S.H. Differentiation of Clear Cell Renal Cell Carcinoma from Other Subtypes and Fat-Poor Angiomyolipoma by Use of Quantitative Enhancement Measurement during Three-Phase MDCT. Am. J. Roentgenol. 2016, 206, 21–28. [Google Scholar] [CrossRef]
- Kim, J.K.; Kim, T.K.; Ahn, H.J.; Kim, C.S.; Kim, K.-R.; Cho, K.-S. Differentiation of Subtypes of Renal Cell Carcinoma on Helical CT Scans. Am. J. Roentgenol. 2002, 178, 1499–1506. [Google Scholar] [CrossRef] [PubMed]
- Ruppert-Kohlmayr, A.J.; Uggowitzer, M.; Meissnitzer, T.; Ruppert, G. Differentiation of Renal Clear Cell Carcinoma and Renal Papillary Carcinoma Using Quantitative CT Enhancement Parameters. Am. J. Roentgenol. 2004, 183, 1387–1391. [Google Scholar] [CrossRef] [PubMed] [Green Version]
- Pierorazio, P.M.; Hyams, E.S.; Tsai, S.; Feng, Z.; Trock, B.J.; Mullins, J.K.; Johnson, P.T.; Fishman, E.K.; Allaf, M.E. Multiphasic Enhancement Patterns of Small Renal Masses (≤4 cm) on Preoperative Computed Tomography: Utility for Distinguishing Subtypes of Renal Cell Carcinoma, Angiomyolipoma, and Oncocytoma. Urology 2013, 81, 1265–1272. [Google Scholar] [CrossRef] [Green Version]
- Yuan, Q.; Kapur, P.; Zhang, Y.; Xi, Y.; Carvo, I.; Signoretti, S.; Dimitrov, I.E.; Cadeddu, J.A.; Margulis, V.; Brugarolas, J.; et al. Intratumor Heterogeneity of Perfusion and Diffusion in Clear-Cell Renal Cell Carcinoma: Correlation with Tumor Cellularity. Clin. Genitourin. Cancer 2016, 14, e585–e594. [Google Scholar] [CrossRef] [Green Version]
- Shebel, H.M.; Elsayes, K.M.; Sheir, K.Z.; El Atta, H.M.A.; El-Sherbiny, A.F.; Ellis, J.H.; El-Diasty, T.A. Quantitative Enhancement Washout Analysis of Solid Cortical Renal Masses Using Multidetector Computed Tomography. J. Comput. Assist. Tomogr. 2011, 35, 337–342. [Google Scholar] [CrossRef]
- Bindayi, A.; McDonald, M.L.; Beksac, A.T.; Rivera-Sanfeliz, G.; Shabaik, A.; Hughes, F.; Aganovic, L.; Hansel, D.E.; Derweesh, I.H. Can multiphase CT scan distinguish between papillary renal cell carcinoma type 1 and type 2? Türk Ürol. Derg./Turk. J. Urol. 2018, 44, 316–322. [Google Scholar] [CrossRef]
- Jinzaki, M.; Tanimoto, A.; Mukai, M.; Ikeda, E.; Kobayashi, S.; Yuasa, Y.; Narimatsu, Y.; Murai, M. Double-Phase Helical CT of Small Renal Parenchymal Neoplasms: Correlation with Pathologic Findings and Tumor Angiogenesis. J. Comput. Assist. Tomogr. 2000, 24, 835–842. [Google Scholar] [CrossRef]
- Chen, F.K.; Huhdanpaa, H.; Desai, B.; Hwang, D.; Cen, S.Y.; Sherrod, A.; Bernhard, J.-C.; Desai, M.M.; Gill, I.; Duddalwar, V.A. Whole lesion quantitative CT evaluation of renal cell carcinoma: differentiation of clear cell from papillary renal cell carcinoma. SpringerPlus 2015, 4, 66. [Google Scholar] [CrossRef] [Green Version]


| Characteristic | Clear Cell RCC n = 123 (79) | Papillary RCC n = 10 (6) | Chromophobe RCC n = 10 (6) | Oncocytoma n = 11 (7) |
|---|---|---|---|---|
| Gender | ||||
| Male | 85 (55) | 7 (5) | 5 (3) | 5 (3) |
| Female | 38 (25) | 3 (3) | 5 (3) | 6 (4) |
| Mean age (y) * | 61 (30–84) | 61 (49–79) | 54 (34–71) | 56 (34–73) |
| Method of specimen acquisition | ||||
| Partial nephrectomy | 21 (14) | 2 (2) | 1 (1) | 5 (3) |
| Radical nephrectomy | 56 (36) | 6 (4) | 4 (3) | 4 (3) |
| Total nephrectomy | 46 (30) | 2 (2) | 5 (3) | 2 (1) |
| Pathologic tumor stage | ||||
| T1a | 31 (20) | 3 (3) | 1 (1) | - |
| T1b | 29 (19) | 1 (1) | 4 (3) | - |
| T2a | 11 (7) | 3 (3) | 1 (1) | - |
| T2b | 3 (3) | 0 (0) | 1 (1) | - |
| T3a | 32 (21) | 3 (3) | 1 (1) | - |
| T3b | 13 (8) | 0 (0) | 2 (2) | - |
| T4 | 1 (1) | 0 (0) | 0 (0) | - |
| Fuhrman grade | ||||
| I | 26 (17) | 2 (2) | 1 (1) | - |
| II | 62 (40) | 6 (4) | 8 (5) | - |
| III | 27 (18) | 2 (1) | 1 (1) | - |
| IV | 8 (5) | 0 (0) | 0 (0) | - |
| Side | ||||
| Left | 59 (38) | 4 (3) | 5 (3) | 7 (5) |
| Right | 59 (38) | 6 (4) | 5 (3) | 4 (3) |
| Both kidneys | 3 (3) | 0 (0) | 0 (0) | 0 (0) |
| Lesion size (cm) | ||||
| <4 | 32 (21) | 6 (4) | 1 (1) | 7 (5) |
| 4–7 | 41 (27) | 2 (2) | 6 (4) | 4 (3) |
| 7–10 | 37 (24) | 1 (1) | 1 (1) | 0 (0) |
| >10 | 13 (8) | 1 (1) | 2 (1) | 0 (0) |
| Enhancement Characteristic | Clear Cell RCC | Papillary RCC | Chromophobe RCC | Oncocytoma |
|---|---|---|---|---|
| Absolute peak lesion enhancement (HU) | 67.28 (60.49–74.06) | 3.40 (−3.45–10.25) | 35.10 (18.17–52.03) | 81.36 (56.08–106.65) |
| p vs. clear cell RCC | <0.001 * | 0.010 * | 0.792 | |
| p vs. papillary RCC | <0.001 * | 0.012 * | <0.001 * | |
| p vs. chromophobe RCC | 0.010 * | 0.012 * | 0.019 * | |
| p vs. oncocytoma | 0.792 | <0.001 * | 0.019 * | |
| Absolute peak lesion de-enhancement (HU) | ||||
| Corticomedullary to nephrographic | 17.67 (13.02–22.31) | −1.20 (−16.01–13.61) | 5.00 (−4.55–14.55) | 10.18 (−16.95–37.32) |
| p vs. clear cell RCC | 0.101 | 0.101 | 0.988 | |
| p vs. papillary RCC | 0.101 | 0.958 | 0.951 | |
| p vs. chromophobe RCC | 0.101 | 0.958 | 0.999 | |
| p vs. oncocytoma | 0.988 | 0.951 | 0.999 | |
| Nephrographic to excretory | 27.04 (22.78–31.30) | −5.10 (−23.94–13.74) | 23.80 (16.76–30.84) | 50.64 (36.55–64.72) |
| p vs. clear cell RCC | <0.020 * | 0.943 | 0.022 * | |
| p vs. papillary RCC | <0.020 * | 0.040 * | <0.001 * | |
| p vs. chromophobe RCC | 0.943 | 0.040 * | 0.010 * | |
| p vs. oncocytoma | 0.022 * | <0.001 * | 0.010 * | |
| Relative tumor enhancement ratio | ||||
| Corticomedullary phase | 0.97 (0.78–1.17) | 0.02 (−0.07–0.12) | 0.36 (0.19–0.53) | 0.76 (0.49–1.02) |
| p vs. clear cell RCC | <0.001 * | <0.001 * | 0.655 | |
| p vs. papillary RCC | <0.001 * | 0.008 * | <0.001 * | |
| p vs. chromophobe RCC | <0.001 * | 0.008 * | 0.069 | |
| p vs. oncocytoma | 0.655 | <0.001 * | 0.069 | |
| Nephrographic phase | 0.57 (0.50–0.63) | 0.01 (−0.23–0.267) | 0.34 (0.20–0.47) | 0.77 (0.42–1.11) |
| p vs. clear cell RCC | 0.003 * | 0.024 * | 0.743 | |
| p vs. papillary RCC | 0.003 * | 0.119 | 0.005 * | |
| p vs. chromophobe RCC | 0.024 * | 0.119 | 0.112 | |
| p vs. oncocytoma | 0.743 | 0.005 * | 0.112 | |
| 3D tumor volume enhancement (HU) | 44.86 (40.08–49.64) | 9.80 (4.88–14.72) | 30.20 (20.67–39.73) | 74.36 (58.65–90.07) |
| p vs. clear cell RCC | <0.001 * | 0.046 * | 0.010 * | |
| p vs. papillary RCC | <0.001 * | 0.005 * | <0.001 * | |
| p vs. chromophobe RCC | 0.046 * | 0.005 * | <0.001 * | |
| p vs. oncocytoma | 0.010 * | <0.001 * | <0.001 * | |
| 3D tumor volume de-enhancement (HU) | ||||
| Nephrographic to excretory | 21.93 (18.86–25.01) | 3.20 (−7.91–14.31) | 13.60 (7.00–20.20) | 44.64 (33.51–55.77) |
| p vs. clear cell RCC | 0.022 * | 0.125 | 0.005 * | |
| p vs. papillary RCC | 0.022 * | 0.395 | <0.001 * | |
| p vs. chromophobe RCC | 0.125 | 0.395 | <0.001 * | |
| p vs. oncocytoma | 0.022 * | <0.001 * | <0.001* | |
| 3D tumor volume enhancement wash-out (%) | 43.34 (37.79–48.89) | −5.33 (−73.72–63.05) | 38.97 (15.25–62.69) | 64.10 (58.71–69.48) |
| p vs. clear cell RCC | 0.540 | 0.999 | <0.001 * | |
| p vs. papillary RCC | 0.540 | 0.672 | 0.220 | |
| p vs. chromophobe RCC | 0.999 | 0.672 | 0.199 | |
| p vs. oncocytoma | <0.001 * | 0.220 | 0.199 |
| Discrimination of Clear Cell RCC | AUC (95%CI) | * p Value | Sensitivity (95%CI) | Specificity (95%CI) | Cutoff Value |
|---|---|---|---|---|---|
| From papillary RCC | |||||
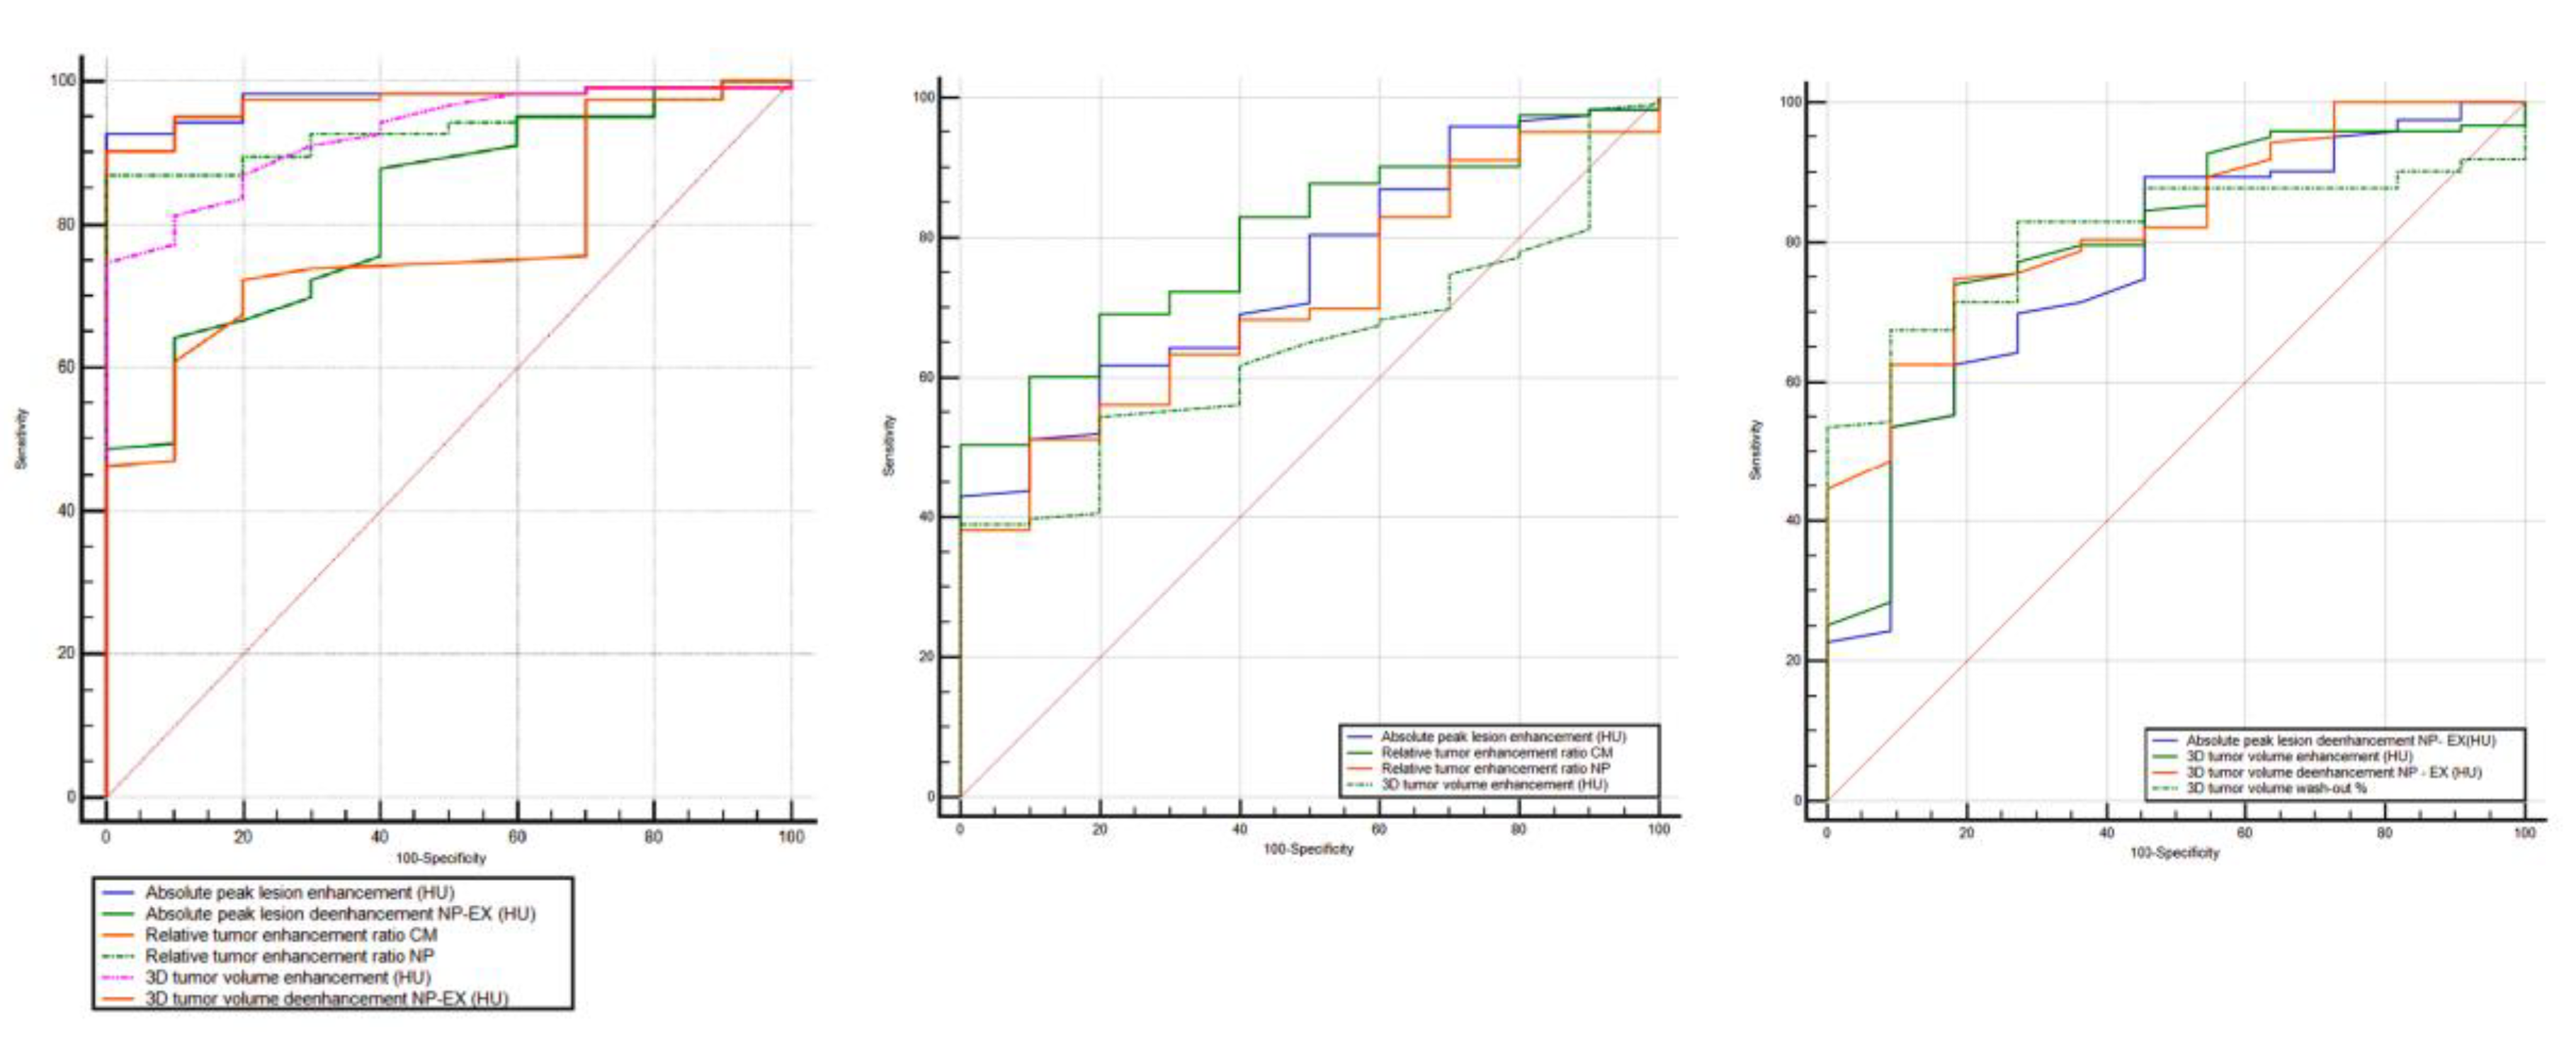
| Absolute peak lesion enhancement | 0.976 (0.924–0.995) | <0.001 | 92.7 (86.6–96.6) | 100 (69.2–100) | 17 |
| Absolute peak lesion de-enhancement NP to EX phase | 0.825 (0.750–0.886) | <0.020 | 64.2 (55.1–72.7) | 90 (55.5–99.7) | 15 |
| Relative tumor enhancement ratio CM phase | 0.973 (0.929–0.993) | <0.001 | 90.2 (83.6–94.9) | 100 (69.2–100) | 0.21 |
| Relative tumor enhancement ratio NP phase | 0.931 (0.874–0.968) | 0.003 | 87 (79.7–92.4) | 100 (69.2–100) | 0.24 |
| 3D tumor volume enhancement | 0.928 (0.871–0.966) | <0.001 | 74.8 (66.2–82.2) | 100 (79.2–100) | 22 |
| 3D tumor volume de-enhancement NP to EX phase | 0.778 (0.698–0.846) | 0.022 | 72.4 (63.6–80) | 80 (64.2–97.5) | 10 |
| From chromophobe RCC | |||||
| Absolute peak lesion enhancement | 0.759 (0.668–0.821) | 0.010 | 43.1 (34.2–52.3) | 100 (69.2–100) | 71 |
| Relative tumor enhancement ratio CM phase | 0.799 (0.721–0.864) | <0.001 | 50.4 (41.2–59.5) | 100 (69.2–100) | 0.72 |
| Relative tumor enhancement ratio NP phase | 0.711 (0.626–0.787) | 0.024 | 51.2 (42.0–60.3) | 90.0 (55.5–99.7) | 0.54 |
| 3D tumor volume enhancement | 0.643 (0.555–0.724) | 0.046 | 39 (30.4–48.2) | 100 (69.2–100) | 51 |
| From oncocytoma | |||||
| Absolute peak lesion de-enhancement NP to EX phase | 0.771 (0.690–0.839) | 0.022 | 53.7 (44.4–62.7) | 90.9 (68.7–99.8) | 32 |
| 3D tumor volume enhancement | 0.798 (0.720–0.862) | 0.010 | 74.0 (65.3–81.5) | 81.8 (68.2–97.7) | 67 |
| 3D tumor de-enhancement NP to EX phase | 0.827 (0.752–0.887) | 0.005 | 74.8 (66.2–82.2) | 81.8 (68.2–97.7) | 33 |
| 3D tumor volume wash-out | 0.798 (0.720–0.862) | <0.001 | 74 (65.3–81.5) | 81.8 (48.2–97.7) | 67 |
Publisher’s Note: MDPI stays neutral with regard to jurisdictional claims in published maps and institutional affiliations. |
© 2020 by the authors. Licensee MDPI, Basel, Switzerland. This article is an open access article distributed under the terms and conditions of the Creative Commons Attribution (CC BY) license (http://creativecommons.org/licenses/by/4.0/).
Share and Cite
Moldovanu, C.-G.; Petresc, B.; Lebovici, A.; Tamas-Szora, A.; Suciu, M.; Crisan, N.; Medan, P.; Buruian, M.M. Differentiation of Clear Cell Renal Cell Carcinoma from other Renal Cell Carcinoma Subtypes and Benign Oncocytoma Using Quantitative MDCT Enhancement Parameters. Medicina 2020, 56, 569. https://doi.org/10.3390/medicina56110569
Moldovanu C-G, Petresc B, Lebovici A, Tamas-Szora A, Suciu M, Crisan N, Medan P, Buruian MM. Differentiation of Clear Cell Renal Cell Carcinoma from other Renal Cell Carcinoma Subtypes and Benign Oncocytoma Using Quantitative MDCT Enhancement Parameters. Medicina. 2020; 56(11):569. https://doi.org/10.3390/medicina56110569
Chicago/Turabian StyleMoldovanu, Claudia-Gabriela, Bianca Petresc, Andrei Lebovici, Attila Tamas-Szora, Mihai Suciu, Nicolae Crisan, Paul Medan, and Mircea Marian Buruian. 2020. "Differentiation of Clear Cell Renal Cell Carcinoma from other Renal Cell Carcinoma Subtypes and Benign Oncocytoma Using Quantitative MDCT Enhancement Parameters" Medicina 56, no. 11: 569. https://doi.org/10.3390/medicina56110569
APA StyleMoldovanu, C.-G., Petresc, B., Lebovici, A., Tamas-Szora, A., Suciu, M., Crisan, N., Medan, P., & Buruian, M. M. (2020). Differentiation of Clear Cell Renal Cell Carcinoma from other Renal Cell Carcinoma Subtypes and Benign Oncocytoma Using Quantitative MDCT Enhancement Parameters. Medicina, 56(11), 569. https://doi.org/10.3390/medicina56110569


