
Rs10204525 Polymorphism of the Programmed Death (PD-1) Gene Is Associated with Increased Risk in a Saudi Arabian Population with Colorectal Cancer


 , ,
, ,
Abstract
:1. Introduction
2. Materials and Methods
2.1. Study Population
2.2. DNA Extraction
2.3. SNP Selection and Genotyping
2.4. RNA Extraction and Real-Time Quantitative Polymerase Chain Reaction
2.5. In Silico Analysis
2.6. Statistical Analysis
3. Results
3.1. Demographic Characteristics of Study Population
3.2. PD-1 SNP Association with CRC
3.3. Age and Gender Stratified Analysis
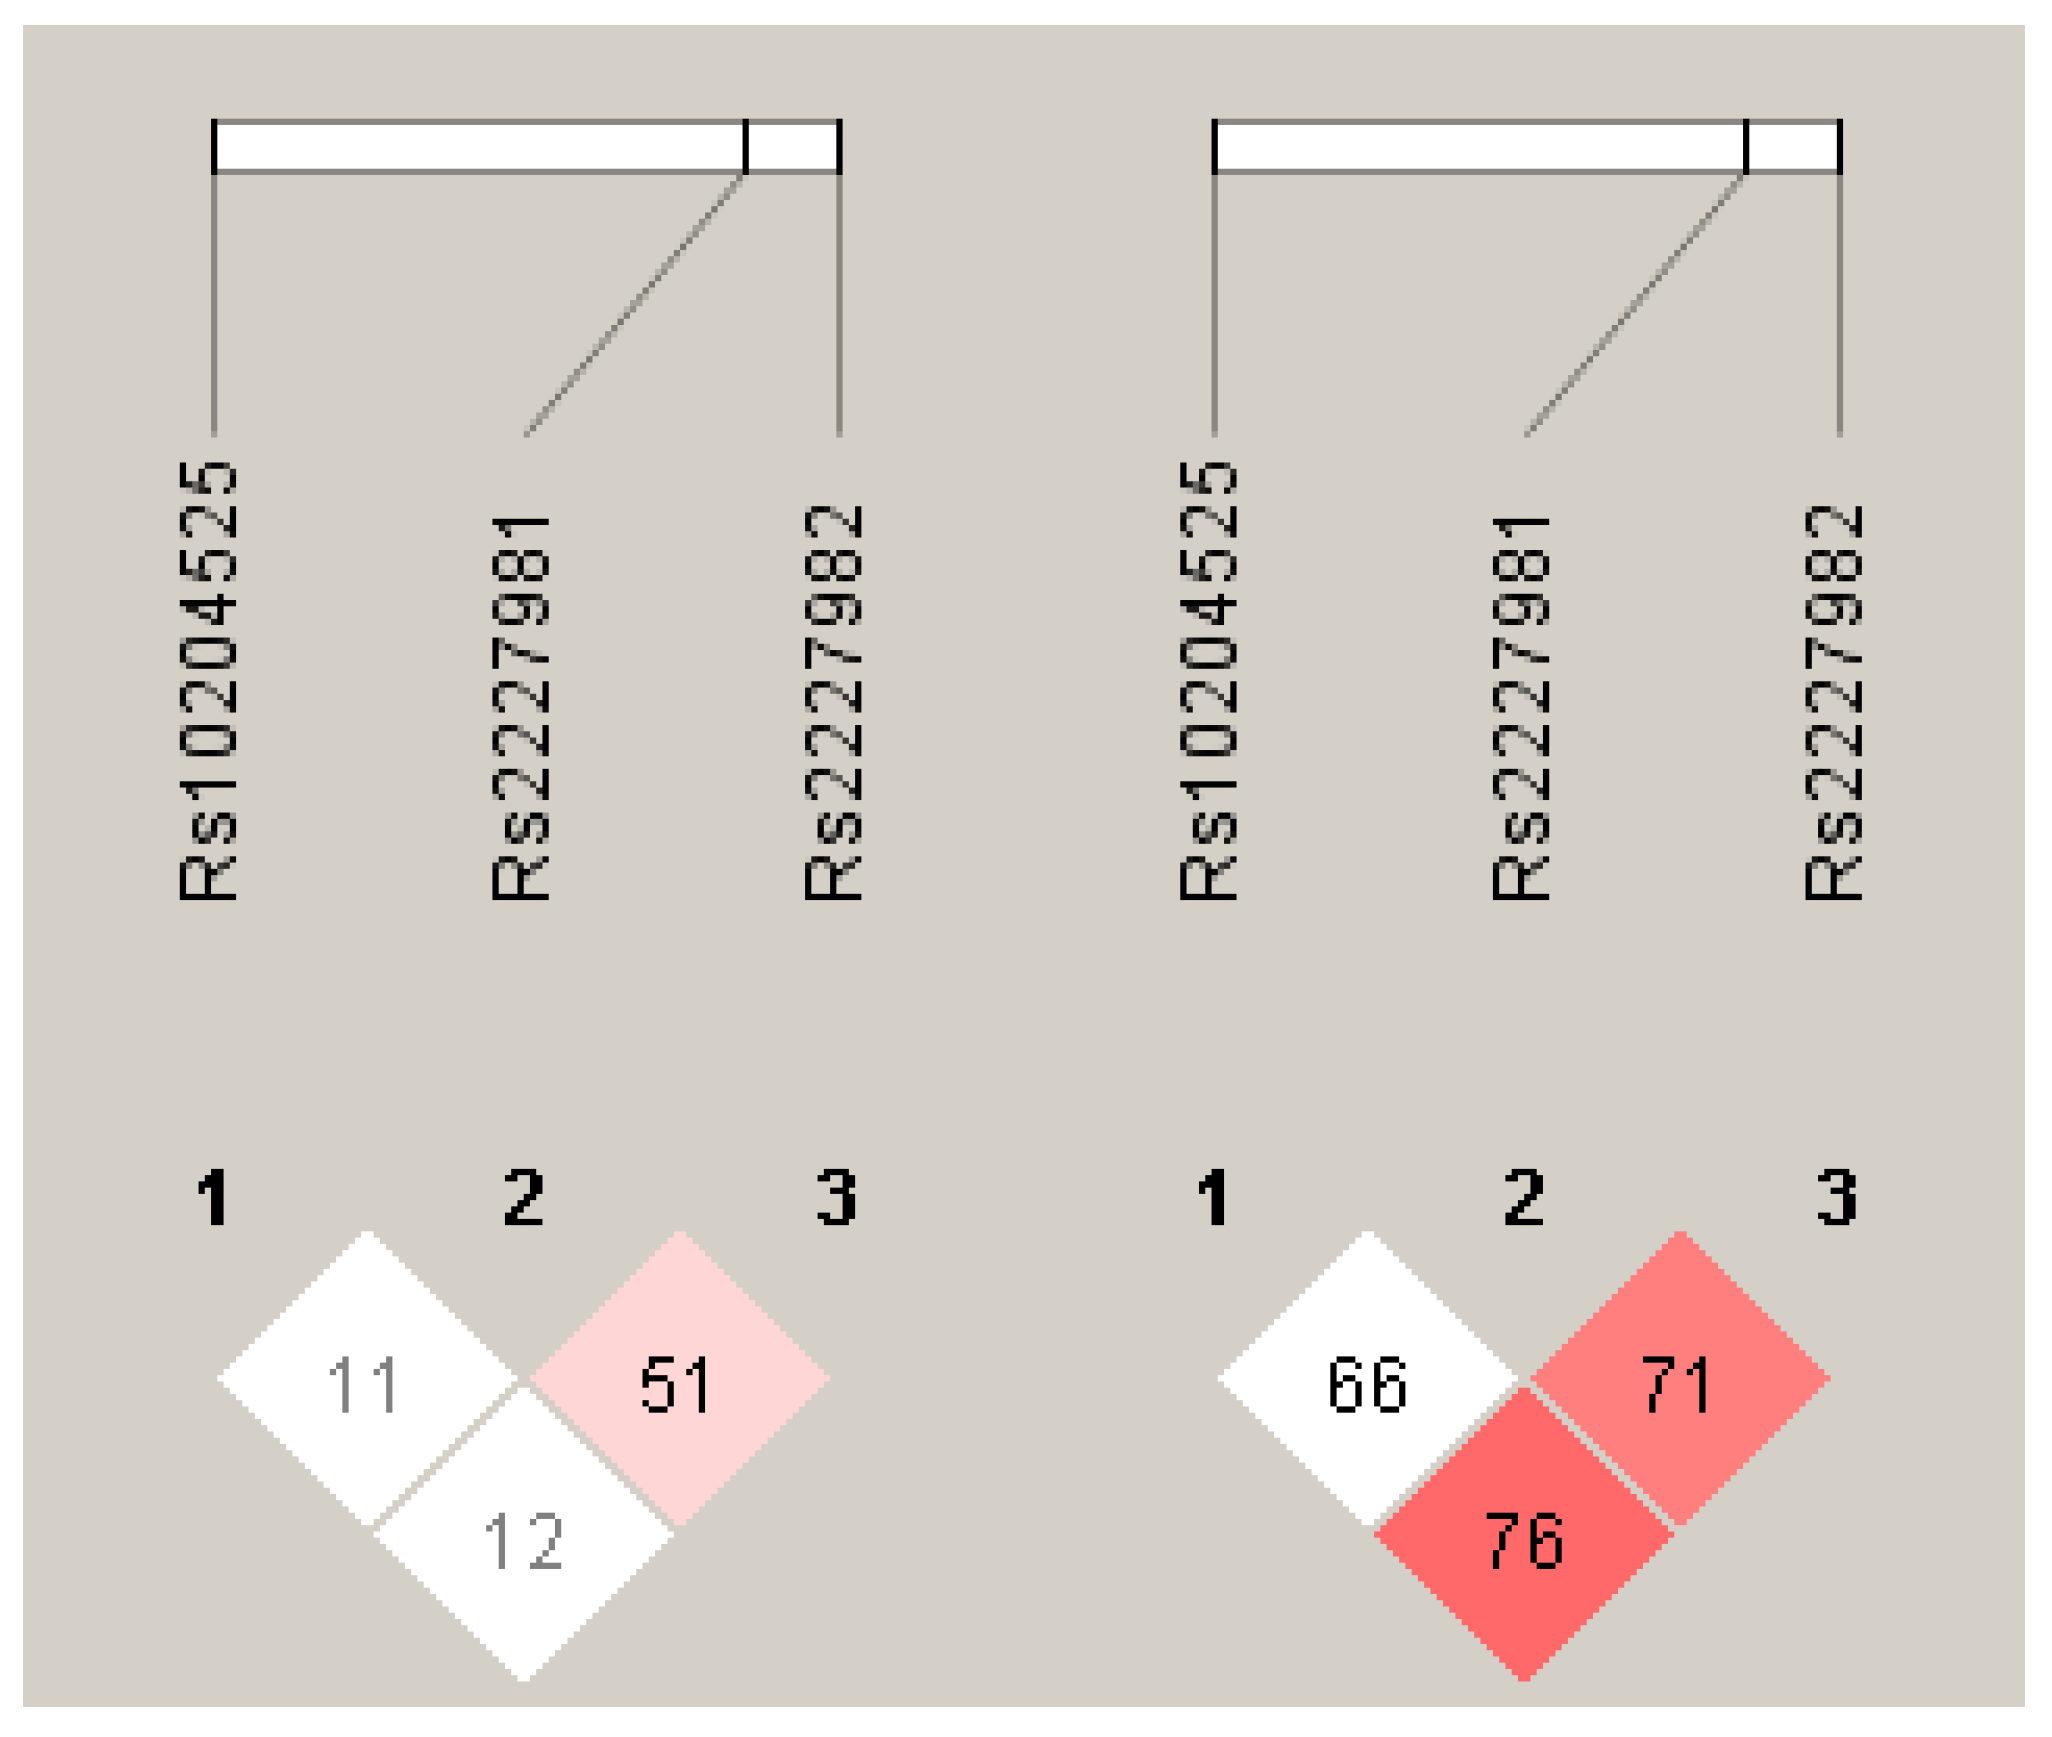
3.4. Haplotype Analysis
3.5. Gene Expression Analysis of PD-1 mRNA
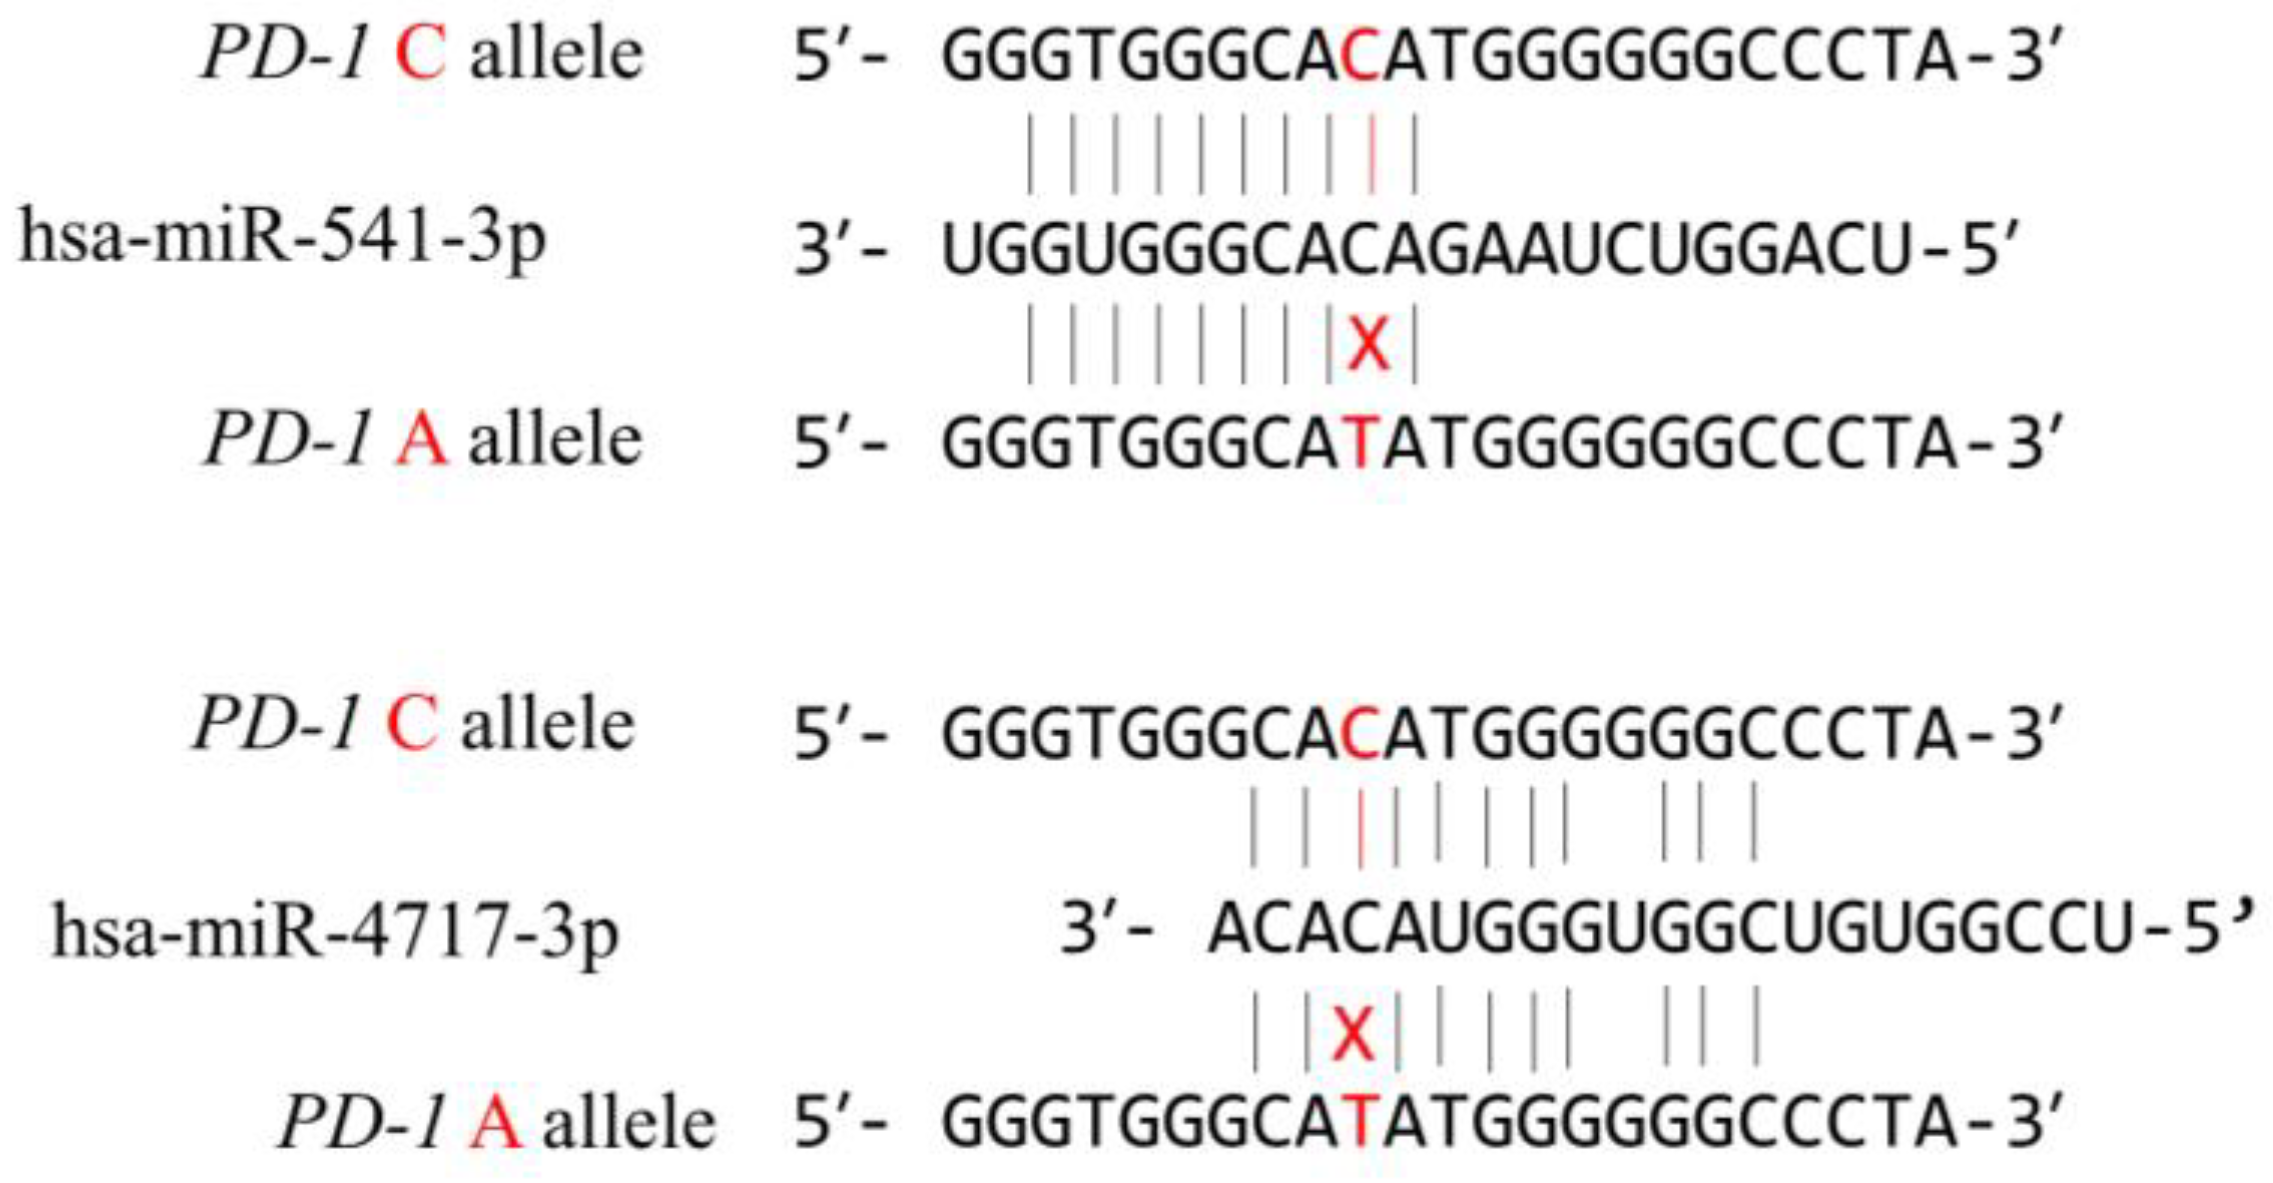
3.6. In Silico Functional Analysis of the PD-1.6 Polymorphism
4. Discussion
5. Conclusions
Author Contributions
Funding
Institutional Review Board Statement
Informed Consent Statement
Data Availability Statement
Conflicts of Interest
References
- Alharithy, R.N. Polymorphisms in RETN gene and susceptibility to colon cancer in Saudi patients. Ann. Saudi. Med. 2014, 34, 334–339. [Google Scholar] [CrossRef] [PubMed]
- Ge, J.; Zhu, L.; Zhou, J.; Li, G.; Li, Y.; Li, S.; Wu, Z.; Rong, J.; Yuan, H.; Liu, Y.; et al. Association between co-inhibitory molecule gene tagging single nucleotide polymorphisms and the risk of colorectal cancer in Chinese. J. Cancer Res. Clin. Oncol. 2015, 141, 1533–1544. [Google Scholar] [CrossRef]
- Kupchella, C.E. Environmental factors in cancer etiology. Semin. Oncol. Nurs. 1986, 2, 161–169. [Google Scholar] [CrossRef]
- Parsa, N. Environmental factors inducing human cancers. Iran. J. Public Health 2012, 41, 1–9. [Google Scholar]
- Frías, J.L.; Gilbert-Barness, E. Human teratogens: Current controversies. Adv. Pediatr. 2008, 55, 171–211. [Google Scholar] [CrossRef] [PubMed]
- Schmit, S.L.; Edlund, C.K.; Schumacher, F.R.; Gong, J.; Harrison, T.A.; Huyghe, J.R.; Qu, C.; Melas, M.; Van Den Berg, D.J.; Wang, H.; et al. Novel Common Genetic Susceptibility Loci for Colorectal Cancer. J. Natl. Cancer Inst. 2019, 111, 146–157. [Google Scholar] [CrossRef]
- Schumacher, F.R.; Schmit, S.L.; Jiao, S.; Edlund, C.K.; Wang, H.; Zhang, B.; Hsu, L.; Huang, S.-C.; Fischer, C.P.; Harju, J.F.; et al. Genome-wide association study of colorectal cancer identifies six new susceptibility loci. Nat. Commun. 2015, 6, 7138. [Google Scholar] [CrossRef] [PubMed] [Green Version]
- Jiang, K.; Sun, Y.; Wang, C.; Ji, J.; Li, Y.; Ye, Y.; Lv, L.; Guo, Y.; Guo, S.; Li, H.; et al. Genome-wide association study identifies two new susceptibility loci for colorectal cancer at 5q23.3 and 17q12 in Han Chinese. Oncotarget 2015, 6, 40327–40336. [Google Scholar] [CrossRef] [Green Version]
- Lu, Y.; Kweon, S.S.; Tanikawa, C.; Jia, W.H.; Xiang, Y.B.; Cai, Q.; Zeng, C.; Schmit, S.L.; Shin, A.; Matsuo, K.; et al. Large-Scale Genome-Wide Association Study of East Asians Identifies Loci Associated with Risk for Colorectal Cancer. Gastroenterology 2019, 156, 1455–1466. [Google Scholar] [CrossRef] [Green Version]
- Nebbia, M.; Yassin, N.A.; Spinelli, A. Colorectal Cancer in Inflammatory Bowel Disease. Clin. Colon. Rectal Surg. 2020, 33, 305–317. [Google Scholar] [CrossRef]
- Huyghe, J.R.; Bien, S.A.; Harrison, T.A.; Kang, H.M.; Chen, S.; Schmit, S.L.; Conti, D.V.; Qu, C.; Jeon, J.; Edlund, C.K.; et al. Discovery of common and rare genetic risk variants for colorectal cancer. Nat. Genet. 2019, 51, 76–87. [Google Scholar] [CrossRef]
- Law, P.J.; Timofeeva, M.; Fernandez-Rozadilla, C.; Broderick, P.; Studd, J.; Fernandez-Tajes, J.; Farrington, S.; Svinti, V.; Palles, C.; Orlando, G.; et al. Association analyses identify 31 new risk loci for colorectal cancer susceptibility. Nat. Commun. 2019, 10, 2154. [Google Scholar] [CrossRef] [Green Version]
- Zeng, C.; Matsuda, K.; Jia, W.-H.; Chang, J.; Kweon, S.-S.; Xiang, Y.-B.; Shin, A.; Jee, S.H.; Kim, D.-H.; Zhang, B. Identification of susceptibility loci and genes for colorectal cancer risk. Gastroenterology 2016, 150, 1633–1645. [Google Scholar] [CrossRef] [PubMed] [Green Version]
- Tanikawa, C.; Kamatani, Y.; Takahashi, A.; Momozawa, Y.; Leveque, K.; Nagayama, S.; Mimori, K.; Mori, M.; Ishii, H.; Inazawa, J. GWAS identifies two novel colorectal cancer loci at 16q24. 1 and 20q13. 12. Carcinogenesis 2018, 39, 652–660. [Google Scholar] [CrossRef] [PubMed]
- Giannakis, M.; Mu, X.J.; Shukla, S.A.; Qian, Z.R.; Cohen, O.; Nishihara, R.; Bahl, S.; Cao, Y.; Amin-Mansour, A.; Yamauchi, M.; et al. Genomic Correlates of Immune-Cell Infiltrates in Colorectal Carcinoma. Cell Rep. 2016, 15, 857–865. [Google Scholar] [CrossRef] [Green Version]
- MacArthur, J.; Bowler, E.; Cerezo, M.; Gil, L.; Hall, P.; Hastings, E.; Junkins, H.; McMahon, A.; Milano, A.; Morales, J. The new NHGRI-EBI Catalog of published genome-wide association studies (GWAS Catalog). Nucleic Acids Res. 2017, 45, D896–D901. [Google Scholar] [CrossRef]
- Wagner, M.; Jasek, M.; Karabon, L. Immune Checkpoint Molecules-Inherited Variations as Markers for Cancer Risk. Front. Immunol. 2020, 11, 606721. [Google Scholar] [CrossRef] [PubMed]
- Ramos, R.I.; Shaw, M.A.; Foshag, L.; Stern, S.L.; Rahimzadeh, N.; Elashoff, D.; Hoon, D.S.B. Genetic Variants in Immune Related Genes as Predictors of Responsiveness to BCG Immunotherapy in Metastatic Melanoma Patients. Cancers 2020, 13, 91. [Google Scholar] [CrossRef] [PubMed]
- Kumagai, S.; Togashi, Y.; Kamada, T.; Sugiyama, E.; Nishinakamura, H.; Takeuchi, Y.; Vitaly, K.; Itahashi, K.; Maeda, Y.; Matsui, S.; et al. The PD-1 expression balance between effector and regulatory T cells predicts the clinical efficacy of PD-1 blockade therapies. Nat. Immunol. 2020, 21, 1346–1358. [Google Scholar] [CrossRef]
- Hua, S.; Fan, B.; Mao, W.; Xu, R.; Wang, Y.; Kuai, L.; Ding, X.; Li, B.; Chen, J.; Miao, X. Association between PDCD1 gene polymorphisms and psoriasis susceptibility in the Chinese population. Int. J. Dermatol. 2021, 60, 1411–1417. [Google Scholar] [CrossRef]
- Yamamoto, M.; Kobayashi, T.; Mashima, H.; Miki, D.; Kuroda, S.; Hamaoka, M.; Aikata, H.; Chayama, K.; Ohdan, H. PD1 gene polymorphism is associated with a poor prognosis in hepatocellular carcinoma following liver resection, cohort study. Int. J. Surg. 2020, 80, 84–90. [Google Scholar] [CrossRef]
- Zhao, Y.; Mao, Z.; Pang, H.; Zhao, X.; Zhang, S.; Gao, Z.; Yang, Y.; Fang, T.; Ma, Q.; Ma, X.; et al. Association of programmed cell death 1 (PDCD1) gene polymorphisms with colorectal cancer among Han Chinese population. Zhonghua Yi Xue Yi Chuan Xue Za Zhi 2018, 35, 219–223. [Google Scholar] [CrossRef]
- Hashemi, M.; Karami, S.; Sarabandi, S.; Moazeni-Roodi, A.; Małecki, A.; Ghavami, S.; Wiechec, E. Association between PD-1 and PD-L1 Polymorphisms and the Risk of Cancer: A Meta-Analysis of Case-Control Studies. Cancers 2019, 11, 1150. [Google Scholar] [CrossRef] [Green Version]
- Cortazar, F.B.; Marrone, K.A.; Troxell, M.L.; Ralto, K.M.; Hoenig, M.P.; Brahmer, J.R.; Le, D.T.; Lipson, E.J.; Glezerman, I.G.; Wolchok, J.; et al. Clinicopathological features of acute kidney injury associated with immune checkpoint inhibitors. Kidney Int. 2016, 90, 638–647. [Google Scholar] [CrossRef] [Green Version]
- Qin, W.; Hu, L.; Zhang, X.; Jiang, S.; Li, J.; Zhang, Z.; Wang, X. The Diverse Function of PD-1/PD-L Pathway Beyond Cancer. Front Immunol. 2019, 10, 2298. [Google Scholar] [CrossRef] [Green Version]
- Zhou, Z.Y.; Liu, S.R.; Xu, L.B.; Liu, C.; Zhang, R. Clinicopathological and Prognostic Value of Programmed Cell Death 1 Expression in Hepatitis B Virus-related Hepatocellular Carcinoma: A Meta-analysis. J. Clin. Transl. Hepatol. 2021, 9, 889–897. [Google Scholar] [CrossRef]
- Momin, S.; Flores, S.; Angel, B.B.; Codner, D.E.; Carrasco, P.E.; Perez-Bravo, F. Interactions between programmed death 1 (PD-1) and cytotoxic T lymphocyte antigen 4 (CTLA-4) gene polymorphisms in type 1 diabetes. Diabetes Res. Clin. Pract. 2009, 83, 289–294. [Google Scholar] [CrossRef]
- Hua, Z.; Li, D.; Xiang, G.; Xu, F.; Jie, G.; Fu, Z.; Jie, Z.; Da, P.; Li, D. PD-1 polymorphisms are associated with sporadic breast cancer in Chinese Han population of Northeast China. Breast Cancer Res. Treat. 2011, 129, 195–201. [Google Scholar] [CrossRef]
- Liu, X.; Hu, L.H.; Li, Y.R.; Chen, F.H.; Ning, Y.; Yao, Q.F. Programmed cell death 1 gene polymorphisms is associated with ankylosing spondylitis in Chinese Han population. Rheumatol. Int. 2011, 31, 209–213. [Google Scholar] [CrossRef]
- Tahoori, M.T.; Pourfathollah, A.A.; Akhlaghi, M.; Daneshmandi, S.; Nicknam, M.H.; Soleimanifar, N. Association of programmed cell death-1 (PDCD-1) gene polymorphisms with rheumatoid arthritis in Iranian patients. Clin. Exp. Rheumatol. 2011, 29, 763–767. [Google Scholar]
- Huang, K.; Hu, E.; Li, W.; Lv, J.; He, Y.; Deng, G.; Xiao, J.; Yang, C.; Zhao, X.; Chen, L.; et al. Association of PD-1 polymorphisms with the risk and prognosis of lung adenocarcinoma in the northeastern Chinese Han population. BMC Med. Genet. 2019, 20, 177. [Google Scholar] [CrossRef] [Green Version]
- Li, X.F.; Jiang, X.Q.; Zhang, J.W.; Jia, Y.J. Association of the programmed cell death-1 PD1.5 C>T polymorphism with cervical cancer risk in a Chinese population. Genet Mol. Res. 2016, 15, 10.4238. [Google Scholar] [CrossRef]
- Yin, L.; Guo, H.; Zhao, L.; Wang, J. The programmed death-1 gene polymorphism (PD-1.5 C/T) is associated with non-small cell lung cancer risk in a Chinese Han population. Int. J. Clin. Exp. Med. 2014, 7, 5832–5836. [Google Scholar]
- Savabkar, S.; Azimzadeh, P.; Chaleshi, V.; Nazemalhosseini Mojarad, E.; Aghdaei, H.A. Programmed death-1 gene polymorphism (PD-1.5 C/T) is associated with gastric cancer. Gastroenterol. Hepatol. Bed Bench 2013, 6, 178–182. [Google Scholar]
- Haghshenas, M.R.; Dabbaghmanesh, M.H.; Miri, A.; Ghaderi, A.; Erfani, N. Association of PDCD1 gene markers with susceptibility to thyroid cancer. J. Endocrinol. Invest. 2017, 40, 481–486. [Google Scholar] [CrossRef]
- Lin, J.; Chen, H.; Huang, Y.; Tang, W.; Zhang, S.; Chen, Y. Lack of Association Between PDCD-1 Polymorphisms and Colorectal Cancer Risk: A Case-Control Study. Immunol. Invest. 2022, 51, 1867–1882. [Google Scholar] [CrossRef]
- Mojtahedi, Z.; Mohmedi, M.; Rahimifar, S.; Erfani, N.; Hosseini, S.V.; Ghaderi, A. Programmed death-1 gene polymorphism (PD-1.5 C/T) is associated with colon cancer. Gene 2012, 508, 229–232. [Google Scholar] [CrossRef]
- Livak, K.J. Allelic discrimination using fluorogenic probes and the 5′ nuclease assay. Genet. Anal. 1999, 14, 143–149. [Google Scholar] [CrossRef]
- Livak, K.J.; Schmittgen, T.D. Analysis of relative gene expression data using real-time quantitative PCR and the 2(-Delta Delta C(T)) Method. Methods 2001, 25, 402–408. [Google Scholar] [CrossRef]
- Barenboim, M.; Zoltick, B.J.; Guo, Y.; Weinberger, D.R. MicroSNiPer: A web tool for prediction of SNP effects on putative microRNA targets. Hum. Mutat. 2010, 31, 1223–1232. [Google Scholar] [CrossRef] [Green Version]
- Liu, C.-J.; Fu, X.; Xia, M.; Zhang, Q.; Gu, Z.; Guo, A.-Y. miRNASNP-v3: A comprehensive database for SNPs and disease-related variations in miRNAs and miRNA targets. Nucleic Acids Res. 2020, 49, D1276–D1281. [Google Scholar] [CrossRef]
- Lewis, B.P.; Burge, C.B.; Bartel, D.P. Conserved seed pairing, often flanked by adenosines, indicates that thousands of human genes are microRNA targets. Cell 2005, 120, 15–20. [Google Scholar] [CrossRef] [Green Version]
- Mathews, D.H.; Disney, M.D.; Childs, J.L.; Schroeder, S.J.; Zuker, M.; Turner, D.H. Incorporating chemical modification constraints into a dynamic programming algorithm for prediction of RNA secondary structure. Proc. Natl. Acad. Sci. USA 2004, 101, 7287–7292. [Google Scholar] [CrossRef] [Green Version]
- Bendl, J.; Musil, M.; Štourač, J.; Zendulka, J.; Damborský, J.; Brezovský, J. PredictSNP2: A Unified Platform for Accurately Evaluating SNP Effects by Exploiting the Different Characteristics of Variants in Distinct Genomic Regions. PLoS Comput. Biol. 2016, 12, e1004962. [Google Scholar] [CrossRef]
- Solé, X.; Guinó, E.; Valls, J.; Iniesta, R.; Moreno, V. SNPStats: A web tool for the analysis of association studies. Bioinformatics 2006, 22, 1928–1929. [Google Scholar] [CrossRef] [Green Version]
- Dehaghani, A.S.; Kashef, M.A.; Ghaemenia, M.; Sarraf, Z.; Khaghanzadeh, N.; Fattahi, M.J.; Ghaderi, A. PDCD1, CTLA-4 and p53 gene polymorphism and susceptibility to gestational trophoblastic diseases. J. Reprod. Med. 2009, 54, 25–31. [Google Scholar]
- Le Marchand, L. Genome-wide association studies and colorectal cancer. Surg. Oncol. Clin. N. Am. 2009, 18, 663–668. [Google Scholar] [CrossRef] [Green Version]
- Cevik, M.; Namal, E.; Iner-Koksal, U.; Dinc-Sener, N.; Karaalp, A.; Ciftci, C.; Susleyici, B. Association of PD-1 and PDL-1 gene polymorphisms with colorectal cancer risk and prognosis. Mol. Biol. Rep. 2022, 49, 1827–1836. [Google Scholar] [CrossRef]
- Zhang, W.; Song, Y.; Zhang, X. Relationship of Programmed Death-1 (PD-1) and Programmed Death Ligand-1 (PD-L1) Polymorphisms with Overall Cancer Susceptibility: An Updated Meta-Analysis of 28 Studies with 60 612 Subjects. Med. Sci. Monit. 2021, 27, e932146. [Google Scholar] [CrossRef]
- Drakes, M.L.; Mehrotra, S.; Aldulescu, M.; Potkul, R.K.; Liu, Y.; Grisoli, A.; Joyce, C.; O’Brien, T.E.; Stack, M.S.; Stiff, P.J. Stratification of ovarian tumor pathology by expression of programmed cell death-1 (PD-1) and PD-ligand- 1 (PD-L1) in ovarian cancer. J. Ovarian Res. 2018, 11, 43. [Google Scholar] [CrossRef]
- Darb-Esfahani, S.; Kunze, C.A.; Kulbe, H.; Sehouli, J.; Wienert, S.; Lindner, J.; Budczies, J.; Bockmayr, M.; Dietel, M.; Denkert, C.; et al. Prognostic impact of programmed cell death-1 (PD-1) and PD-ligand 1 (PD-L1) expression in cancer cells and tumor-infiltrating lymphocytes in ovarian high grade serous carcinoma. Oncotarget 2016, 7, 1486–1499. [Google Scholar] [CrossRef] [PubMed] [Green Version]
- Bakhrebah, M.A.; Nasrullah, M.; Abdulaal, W.H.; Hassan, M.A.; Siddiqui, H.; Doghaither, H.A.A.; Omar, U.M.; Helmi, N.; Fallatah, M.M.; Al-Ghafari, A.B.; et al. High Expression of Pd-1 in Circulating Cells of Patients with Advanced Colorectal Cancer Receiving Adjuvant Therapy. Technol. Cancer Res. Treat. 2020, 19, 1533033820969446. [Google Scholar] [CrossRef] [PubMed]
- Zang, B.; Chen, C.; Zhao, J.Q. PD-1 gene rs10204525 and rs7421861 polymorphisms are associated with increased risk and clinical features of esophageal cancer in a Chinese Han population. Aging 2020, 12, 3771–3790. [Google Scholar] [CrossRef] [PubMed]
- Hezave, Y.A.; Sharifi, Z.; Ranjbar Kermani, F.; Shahabi, M. The association of polymorphisms (rs2227981 and rs10204525) of PDCD1 gene with susceptibility to human T-cell leukemia virus type 1. Microb. Pathog. 2021, 158, 105049. [Google Scholar] [CrossRef]
- Fathi, F.; Zamani, B.; Piroozmand, A.; Mozafarpoor, S.; Seyedhashemi, E.; ArefNezhad, R.; Motedayyen, H. Programmed cell death 1 (PDCD1) gene haplotypes and susceptibility of patients to basal cell carcinoma. Mol. Biol. Rep. 2021, 48, 2047–2052. [Google Scholar] [CrossRef]
- Baba, H.; Kettani, A.; Bouqdayr, M.; Ouladlahsen, A.; Bensghir, R.; Marih, L.; Sodqi, M.; Benjelloun, S.; Ezzikouri, S.; Zaidane, I.; et al. Programmed cell death-1 single-nucleotide polymorphism rs10204525 is associated with human immunodeficiency virus type 1 RNA viral load in HIV-1-infected Moroccan subjects. Med. Microbiol. Immunol. 2021, 210, 187–196. [Google Scholar] [CrossRef]
- Özyalçin, B.; Sanlier, N. The effect of diet components on cancer with epigenetic mechanisms. Trends Food Sci. Technol. 2020, 102, 138–145. [Google Scholar] [CrossRef]
- Cartmel, B.; Loescher, L.J.; Villar-Werstler, P. Professional and consumer concerns about the environment, lifestyle, and cancer. Semin. Oncol. Nurs. 1992, 8, 20–29. [Google Scholar] [CrossRef]
- Li, Z.; Li, N.; Li, F.; Zhou, Z.; Sang, J.; Chen, Y.; Han, Q.; Lv, Y.; Liu, Z. Immune checkpoint proteins PD-1 and TIM-3 are both highly expressed in liver tissues and correlate with their gene polymorphisms in patients with HBV-related hepatocellular carcinoma. Medicine 2016, 95, e5749. [Google Scholar] [CrossRef]
- McDermott, D.F.; Atkins, M.B. PD-1 as a potential target in cancer therapy. Cancer Med. 2013, 2, 662–673. [Google Scholar] [CrossRef]
- Kraehenbuehl, L.; Weng, C.H.; Eghbali, S.; Wolchok, J.D.; Merghoub, T. Enhancing immunotherapy in cancer by targeting emerging immunomodulatory pathways. Nat. Rev. Clin. Oncol. 2022, 19, 37–50. [Google Scholar] [CrossRef]
- Zhang, G.; Li, Z.; Zhu, Q.; Li, F.; Yang, C.; Han, Q.; Lv, Y.; Zhou, Z.; Liu, Z. MicroRNA-4717 differentially interacts with its polymorphic target in the PD1 3′ untranslated region: A mechanism for regulating PD-1 expression and function in HBV-associated liver diseases. Oncotarget 2015, 6, 18933. [Google Scholar] [CrossRef]


| Characteristics | CRC (100) | Control (100) | ||
|---|---|---|---|---|
| Gender (number) | Male | 64 | 65 | |
| Female | 36 | 35 | ||
| Age (average ± SD) | 56.33 ± 14.56 | 56.31 ± 14.56 | ||
| Localization | Colon | 40 | - | |
| Recto-sigmoid | 60 | - | ||
| Stages | I | 11 | - | |
| II | 57 | - | ||
| III | 32 | - | ||
| IV | 0 | - | ||
| SNP ID/Assay ID | Common Name | Chromosome Position | NucleotideChange | Region | MAF in Human Populations | Present Study | ||
|---|---|---|---|---|---|---|---|---|
| Global | European | South Asian | ||||||
| Rs10204525 | PD-1.6 | Chr2/241851121 | G/A | 3′ UTR | A = 0.35 | A = 0.12 | A = 0.19 | A = 0.19 |
| Rs2227981 | PD-1.5 | Chr 2/241850169 | A/G | Exon 5 | A = 0.35 | A = 0.40 | A = 0.24 | A = 0.67 |
| Rs2227982 | PD-1.9 | Chr 2/242793433 | G/A | Exon 5 | A = 0.14 | A = 0.01 | A = 0.06 | A = 0.34 |
| Locus | Model | Genotype | CRC (%) n = 100 | Controls (%) n = 100 | OR (95% CI) | p-Value | AIC |
|---|---|---|---|---|---|---|---|
| Rs10204525 G > A | Alleles | G | 0.81 | 0.91 | 1 | ||
| A | 0.19 | 0.09 | 2.35 (1.24–4.03) | 0.00657 | |||
| Codominant | GG | 71 (71%) | 81 (81%) | 1.00 | |||
| GA | 20 (20%) | 19 (19%) | 1.20 (0.59–2.43) | 270.1 | |||
| AA | 9 (9%) | 0 (0%) | 21.65 (1.23–378.73) | 0.0014 | |||
| Dominant | GG | 71 (71%) | 81 (81%) | 1.00 | |||
| GA + AA | 29 (29%) | 19 (19%) | 1.74 (0.90–3.37) | 0.097 | 278.5 | ||
| Recessive | GA + GG | 91 (91%) | 100 (100%) | 1.00 | |||
| AA | 9 (9%) | 0 (0%) | 10.97 (1.37–87.43) | 0.0015 | 268.4 | ||
| Over-Dominant | GG + AA | 80 (80%) | 81 (81%) | 1.00 | |||
| GA | 20 (20%) | 19 (19%) | 1.07 (0.53–2.15) | 0.86 | 281.2 | ||
| Log-Additive | 1.98 (1.14–3.45) | 0.012 | 274.9 | ||||
| Rs2227981 A > G | Alleles | A | 0.67 | 0.72 | Ref | - | |
| G | 0.33 | 0.28 | 0.79 (0.43–1.11) | 0.53 | |||
| Codominant | AA | 52 (52%) | 52 (52%) | 1.00 | 1 | 277.9 | |
| AG | 30 (30%) | 40 (40%) | 0.75 (0.41–1.38) | ||||
| GG | 18 (18%) | 8 (8%) | 2.25 (0.90–5.63) | 0.078 | |||
| Dominant | AA | 52 (52%) | 52 (52%) | 1.00 | |||
| AG + GG | 48 (48%) | 48 (48%) | 1.00 (0.57–1.74) | 1 | 281.3 | ||
| Recessive | AG + AA | 82 (82%) | 92 (92%) | 1.00 | |||
| GG | 18 (18%) | 8 (8%) | 2.52 (1.04–6.11) | 0.034 | 276.7 | ||
| Over-Dominant | AA-GG | 70 (70%) | 60 (60%) | 1.00 | 0.14 | 279.1 | |
| AG | 30 (30%) | 40 (40%) | 0.64 (0.36–1.15) | ||||
| Log-Additive | 1.22 (0.82–1.82) | 0.32 | 280.3 | ||||
| Rs2227982 G > A | Alleles | G | 0.66 | 0.68 | 1 | ||
| A | 0.34 | 0.32 | 0.93 (0.61–1.41) | 0.83 | |||
| Codominant | GG | 38 (38%) | 40 (40%) | 1.00 | |||
| AG | 57 (57%) | 56 (56%) | 1.07 (0.60–1.91) | 0.92 | 283.1 | ||
| AA | 5 (5%) | 4 (4%) | 1.32 (0.33–5.27) | ||||
| Dominant | GG | 38 (38%) | 40 (40%) | 1.00 | |||
| AG+ AA | 62 (62%) | 60 (60%) | 1.09 (0.62–1.92) | 0.77 | 281.2 | ||
| Recessive | GG+ AG | 95 (95%) | 96 (96%) | 1.00 | |||
| AA | 5 (5%) | 4 (4%) | 1.26 (0.33–4.85) | 0.73 | 281.1 | ||
| Over-Dominant | AA +GG | 43 (43%) | 44 (44%) | 1.00 | |||
| AG | 57 (57%) | 56 (56%) | 1.04 (0.60–1.82) | 0.89 | 281.2 | ||
| Log-Additive | --- | --- | 1.10 (0.67–1.80) | 0.71 |
| Locus | Model | Genotype | CRC <56 (%) n = 41 | CRC ≥56 (%) n = 59 | OR (95% CI) | p-Value | AIC |
|---|---|---|---|---|---|---|---|
| Rs10204525 | Allele | G | 0.77 | 0.87 | 1 | ||
| A | 0.23 | 0.13 | 0.52 (0.24–1.24) | 0.09 | |||
| Codominant | GG | 31 (75.6%) | 40 (67.8%) | 1 | 0.12 | 137.1 | |
| GA | 9 (21.9%) | 11 (18.6%) | 0.95 (0.35–2.57) | ||||
| AA | 1 (2.4%) | 8 (13.6%) | 6.20 (0.74–52.23) | ||||
| Dominant | GG | 31 (75.6%) | 40 (67.8%) | 1 | 0.39 | 138.6 | |
| GA-AA | 10 (24.4%) | 19 (32.2%) | 1.47 (0.60–3.61) | ||||
| Recessive | GG-GA | 40 (97.6%) | 51 (86.4%) | 1 | 0.039 | 135.1 | |
| AA | 1 (2.4%) | 8 (13.6%) | 6.27 (0.75–52.26) | ||||
| Over-Dominant | GG-AA | 32 (78%) | 48 (81.4%) | 1 | 0.69 | 139.2 | |
| GA | 9 (21.9%) | 11 (18.6%) | 0.81 (0.30–2.19) | ||||
| Log-Additive | --- | --- | --- | 1.63 (0.83–3.20) | 0.14 | 137.2 | |
| Rs2227981 A/G | Allele | A | 0.68 | 0.66 | Ref | - | |
| G | 0.32 | 0.34 | 0.9 (0.49–1.65) | 0.74 | |||
| Codominant | AA | 22 (53.7%) | 30 (50.9%) | 1 | 0.96 | 141.3 | |
| AG | 12 (29.3%) | 18 (30.5%) | 1.10 (0.44–2.74) | ||||
| GG | 7 (17.1%) | 11 (18.6%) | 1.15 (0.39–3.45) | ||||
| Dominant | AA | 22 (53.7%) | 30 (50.9%) | 1 | 0.78 | 139.3 | |
| AG-GG | 19 (46.3%) | 29 (49.1%) | 1.12 (0.50–2.49) | ||||
| Recessive | AA-AG | 34 (82.9%) | 48 (81.4%) | 1 | 0.84 | 139.3 | |
| GG | 7 (17.1%) | 11 (18.6%) | 1.11 (0.39–3.16) | ||||
| Over-Dominant | AA-GG | 29 (70.7%) | 41 (69.5%) | 1 | 0.89 | 139.4 | |
| A/G | 12 (29.3%) | 18 (30.5%) | 1.06 (0.44–2.54) | ||||
| Log-Additive | --- | --- | --- | 1.08 (0.64–1.82) | 0.78 | 139.3 | |
| Rs2227982 | Allele | G | 0.71 | 0.64 | |||
| A | 0.29 | 0.36 | 0.77 (0.39–1.32) | 0.29 | |||
| Codominant | GG | 19 (46.3%) | 19 (32.2%) | 1 | 0.35 | 139.3 | |
| AG | 20 (48.8%) | 37 (62.7%) | 1.85 (0.80–4.27) | ||||
| AA | 2 (4.9%) | 3 (5.1%) | 1.50 (0.22–10.02) | ||||
| Dominant | GG | 19 (46.3%) | 19 (32.2%) | 1 | |||
| AG-AA | 22 (53.7%) | 40 (67.8%) | 1.82 (0.80–4.13) | 0.15 | 137.3 | ||
| Recessive | GG-AG | 39 (95.1%) | 56 (94.9%) | 1 | |||
| AA | 2 (4.9%) | 3 (5.1%) | 1.04 (0.17–6.55) | 0.96 | 139.4 | ||
| Over-Dominant | GG-AA | 21 (51.2%) | 22 (37.3%) | 1 | |||
| AG | 20 (48.8%) | 37 (62.7%) | 1.77 (0.79–3.96) | 0.17 | 137.5 | ||
| Log-Additive | --- | --- | --- | 1.57 (0.77–3.23) | 0.21 | 137.8 |
| Locus | Model | Genotype | CRC Female n = 36 | CRC Male n = 64 | OR (95% CI) | p-Value | AIC |
|---|---|---|---|---|---|---|---|
| Rs10204525 | Allele | G | 0.82 | 0.8 | 1 | ||
| A | 0.18 | 0.2 | 1.102 (0.524–2.315) | 0.79 | |||
| Codominant | GG | 25 (69.4%) | 46 (71.9%) | 1 | |||
| GA | 9 (25%) | 11 (17.2%) | 0.66 (0.24–1.82) | 0.47 | 135.2 | ||
| AA | 2 (5.6%) | 7 (10.9%) | 1.90 (0.37–9.86) | ||||
| Dominant | GG | 25 (69.4%) | 46 (71.9%) | 1 | |||
| GA-AA | 11 (30.6%) | 18 (28.1%) | 0.89(0.36–2.18) | 0.8 | 134.6 | ||
| Recessive | GG-GA | 34 (94.4%) | 57 (89%) | 1 | |||
| AA | 2 (5.6%) | 7 (10.9%) | 2.09 (0.41–10.63) | 0.35 | 133.8 | ||
| Over-Dominant | GG-AA | 27 (75%) | 53 (82.8%) | 1 | |||
| GA | 9 (25%) | 11 (17.2%) | 0.62 (0.23–1.68) | 0.35 | 133.8 | ||
| Log-Additive | --- | --- | --- | 1.07 (0.57–2.04) | 0.83 | 134.6 | |
| Rs2227981 A/G | Allele | A | 0.6 | 0.71 | Ref | - | |
| G | 0.4 | 0.29 | 0.603 (0.329–1.106) | 0.10 | |||
| Codominant | AA | 16 (44.4%) | 36 (56.2%) | 1 | 0.35 | 134.6 | |
| AG | 11 (30.6%) | 19 (29.7%) | 0.77 (0.30–1.98) | ||||
| GG | 9 (25%) | 9 (14.1%) | 0.44 (0.15–1.33) | ||||
| Dominant | AA | 16 (44.4%) | 36 (56.2%) | 1 | 0.26 | 133.4 | |
| AG-GG | 20 (55.6%) | 28 (43.8%) | 0.62 (0.27–1.42) | ||||
| Recessive | AA-AG | 27 (75%) | 55 (85.9%) | 1 | 0.18 | 132.9 | |
| GG | 9 (25%) | 9 (14.1%) | 0.49 (0.17–1.38) | ||||
| Over-Dominant | AA-GG | 25 (69.4%) | 45 (70.3%) | 1 | 0.93 | 134.7 | |
| AG | 11 (30.6%) | 19 (29.7%) | 0.96 (0.39–2.33) | ||||
| Log-Additive | --- | --- | --- | 0.68 (0.40–1.16) | 0.16 | 132.7 | |
| Rs2227982 | Allele | G | 0.67 | 0.66 | Ref | ||
| A | 0.33 | 0.34 | 1.012 (0.549–1.866) | 0.970 | |||
| Codominant | GG | 13(36.1%) | 25 (39.1%) | 1 | |||
| AG | 22 (61.1%) | 35 (54.7%) | 0.83 (0.35–1.95) | 0.66 | 135.9 | ||
| AA | 1 (2.8%) | 4 (6.2%) | 2.08 (0.21–20.57) | ||||
| Dominant | GG | 13(36.1%) | 25 (39.1%) | 1 | |||
| AG-AA | 23 (63.9%) | 39(60.9%) | 0.88 (0.38–2.05) | 0.77 | 134.6 | ||
| Recessive | GG-AG | 35 (97.2%) | 60 (93.8%) | 1 | |||
| AA | 1 (2.8%) | 4 (6.2%) | 2.33 (0.25–21.71) | 0.42 | 134 | ||
| Over-Dominant | GG-AA | 14 (38.9%) | 29 (45.3%) | 1 | |||
| AG | 22 (61.1%) | 35 (54.7%) | 0.77 (0.33–1.76) | 0.53 | 134.3 | ||
| Log-Additive | --- | --- | --- | 1.02 (0.49–2.09) | 0.96 | 134.7 |
| Rs10204525 | Rs2227982 | Rs2227981 | CRC | Control | OR (95% CI) | p-Value |
|---|---|---|---|---|---|---|
| G | A | G | 0.28 | 0.41 | Ref | |
| G | A | A | 0.24 | 0.23 | 1.27 (0.66–2.45) | 0.47 |
| G | G | G | 0.25 | 0.26 | 1.73 (0.73–4.10) | 0.21 |
| A | A | G | 0.11 | 0.02 | 6.79 (1.21–38.25) | 0.031 |
| A | A | A | 0.03 | 0.07 | 0.56 (0.12–2.67) | 0.46 |
| G | G | A | 0.04 | 0.02 | 2.66 (0.70–10.04) | 0.15 |
| MFE (kcal/mol) | |||||
|---|---|---|---|---|---|
| Putative miRNAs | Length | Seed Region | Wild Allele | Mutant Allele | ΔMFE (kcal/mol) |
| hsa-miR-541-3p | 22 | 10 | −26.1 | −24.4 | −1.7 |
| hsa-miR-4717-3p | 22 | 8 | −17.00 | −15.68 | −1.33 |
| hsa-miR-5189 | 24 | 8 | −12.25 | −11.97 | −28 |
Publisher’s Note: MDPI stays neutral with regard to jurisdictional claims in published maps and institutional affiliations. |
© 2022 by the authors. Licensee MDPI, Basel, Switzerland. This article is an open access article distributed under the terms and conditions of the Creative Commons Attribution (CC BY) license (https://creativecommons.org/licenses/by/4.0/).
Share and Cite
Al-Harbi, N.; Vaali-Mohammed, M.-A.; Al-Omar, S.; Zubaidi, A.; Al-Obeed, O.; Abdulla, M.-H.; Mansour, L. Rs10204525 Polymorphism of the Programmed Death (PD-1) Gene Is Associated with Increased Risk in a Saudi Arabian Population with Colorectal Cancer. Medicina 2022, 58, 1439. https://doi.org/10.3390/medicina58101439
Al-Harbi N, Vaali-Mohammed M-A, Al-Omar S, Zubaidi A, Al-Obeed O, Abdulla M-H, Mansour L. Rs10204525 Polymorphism of the Programmed Death (PD-1) Gene Is Associated with Increased Risk in a Saudi Arabian Population with Colorectal Cancer. Medicina. 2022; 58(10):1439. https://doi.org/10.3390/medicina58101439
Chicago/Turabian StyleAl-Harbi, Nouf, Mansoor-Ali Vaali-Mohammed, Suliman Al-Omar, Ahmed Zubaidi, Omar Al-Obeed, Maha-Hamadien Abdulla, and Lamjed Mansour. 2022. "Rs10204525 Polymorphism of the Programmed Death (PD-1) Gene Is Associated with Increased Risk in a Saudi Arabian Population with Colorectal Cancer" Medicina 58, no. 10: 1439. https://doi.org/10.3390/medicina58101439