
Hepatic Fat Quantification with the Multi-Material Decomposition Algorithm by Using Low-Dose Non-Contrast Material-Enhanced Dual-Energy Computed Tomography in a Prospectively Enrolled Cohort


Abstract
:1. Introduction
2. Materials and Methods
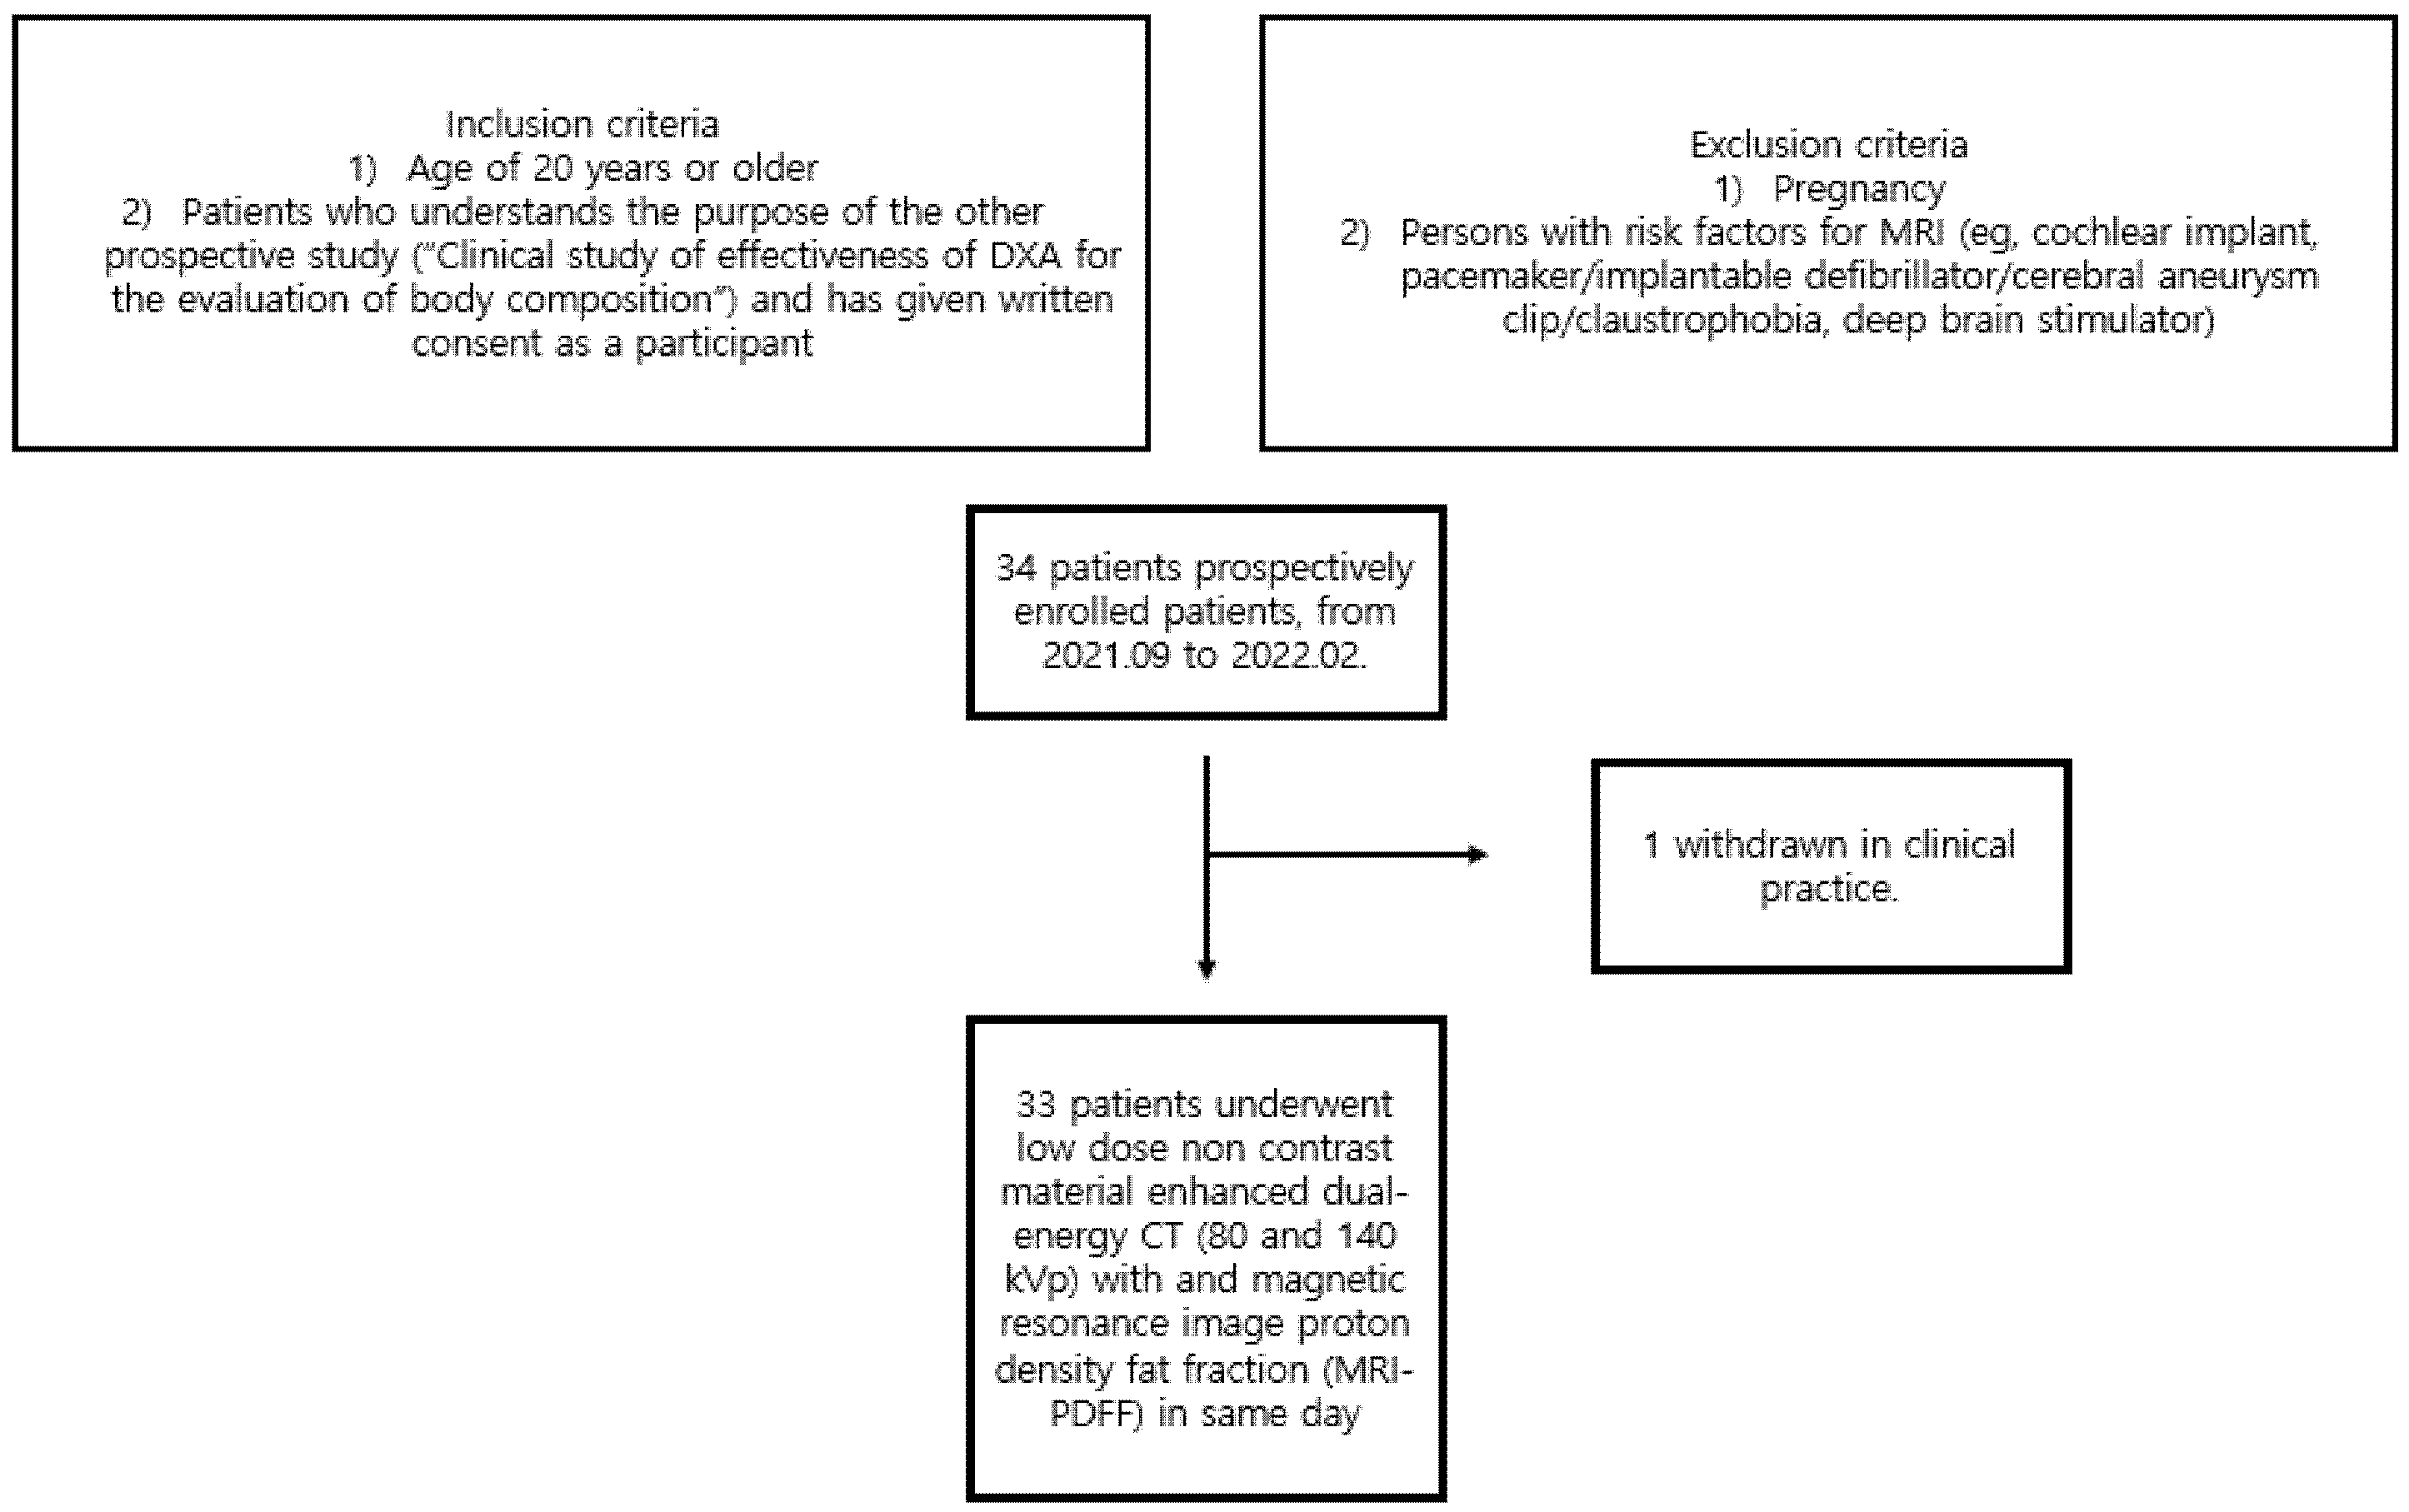
2.1. Patients
2.2. Imaging Technique
2.2.1. Dual-Energy CT Acquisition
2.2.2. MRI-PDFF
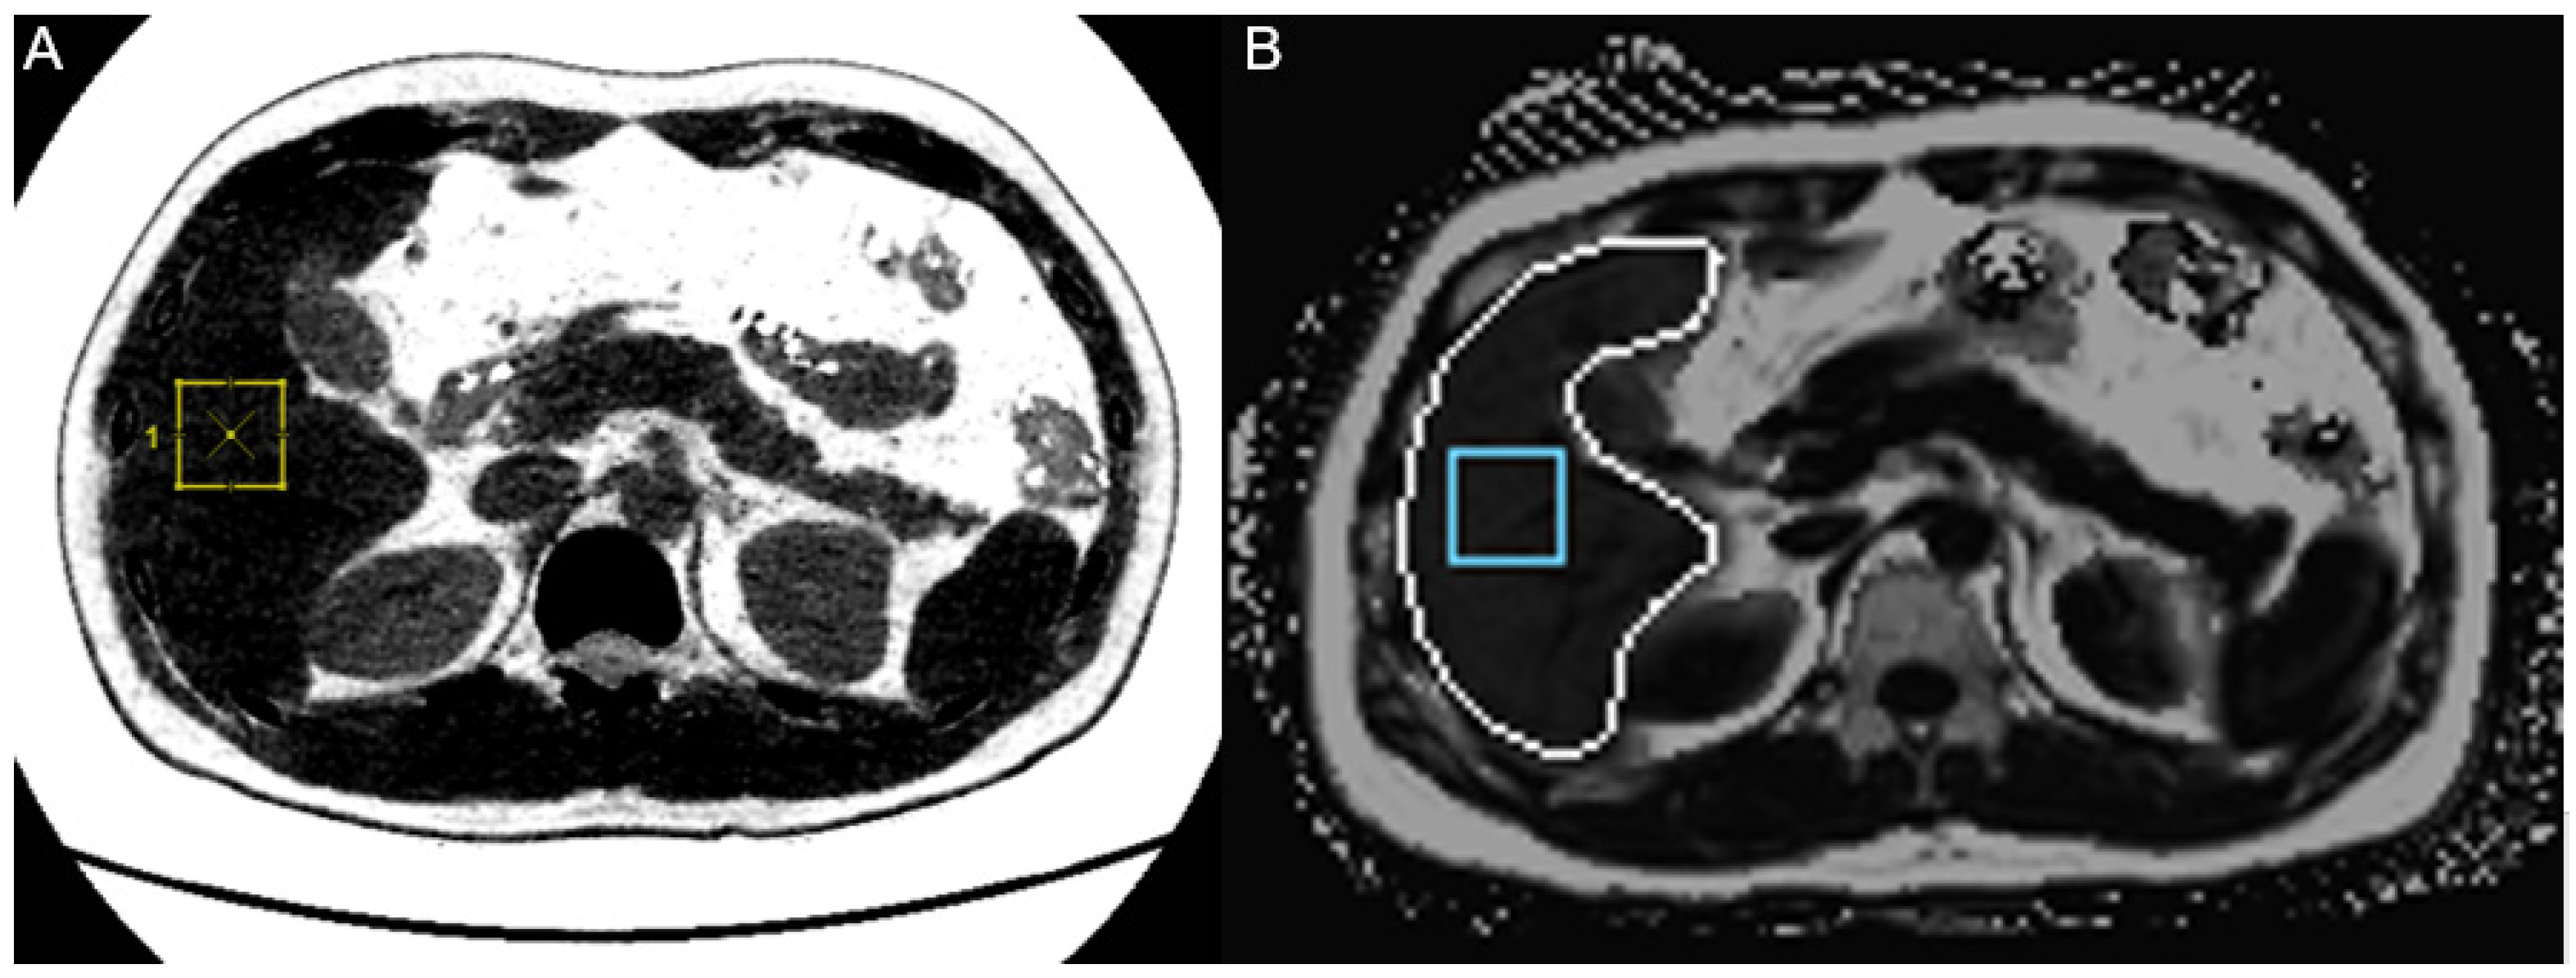
2.3. Data Analysis
2.4. Statistical Analysis
3. Results
3.1. Patient Demographics
3.2. Radiation Dose Measurement in Low-Dose Dual-Energy CT
3.3. Inter-Observer Agreement
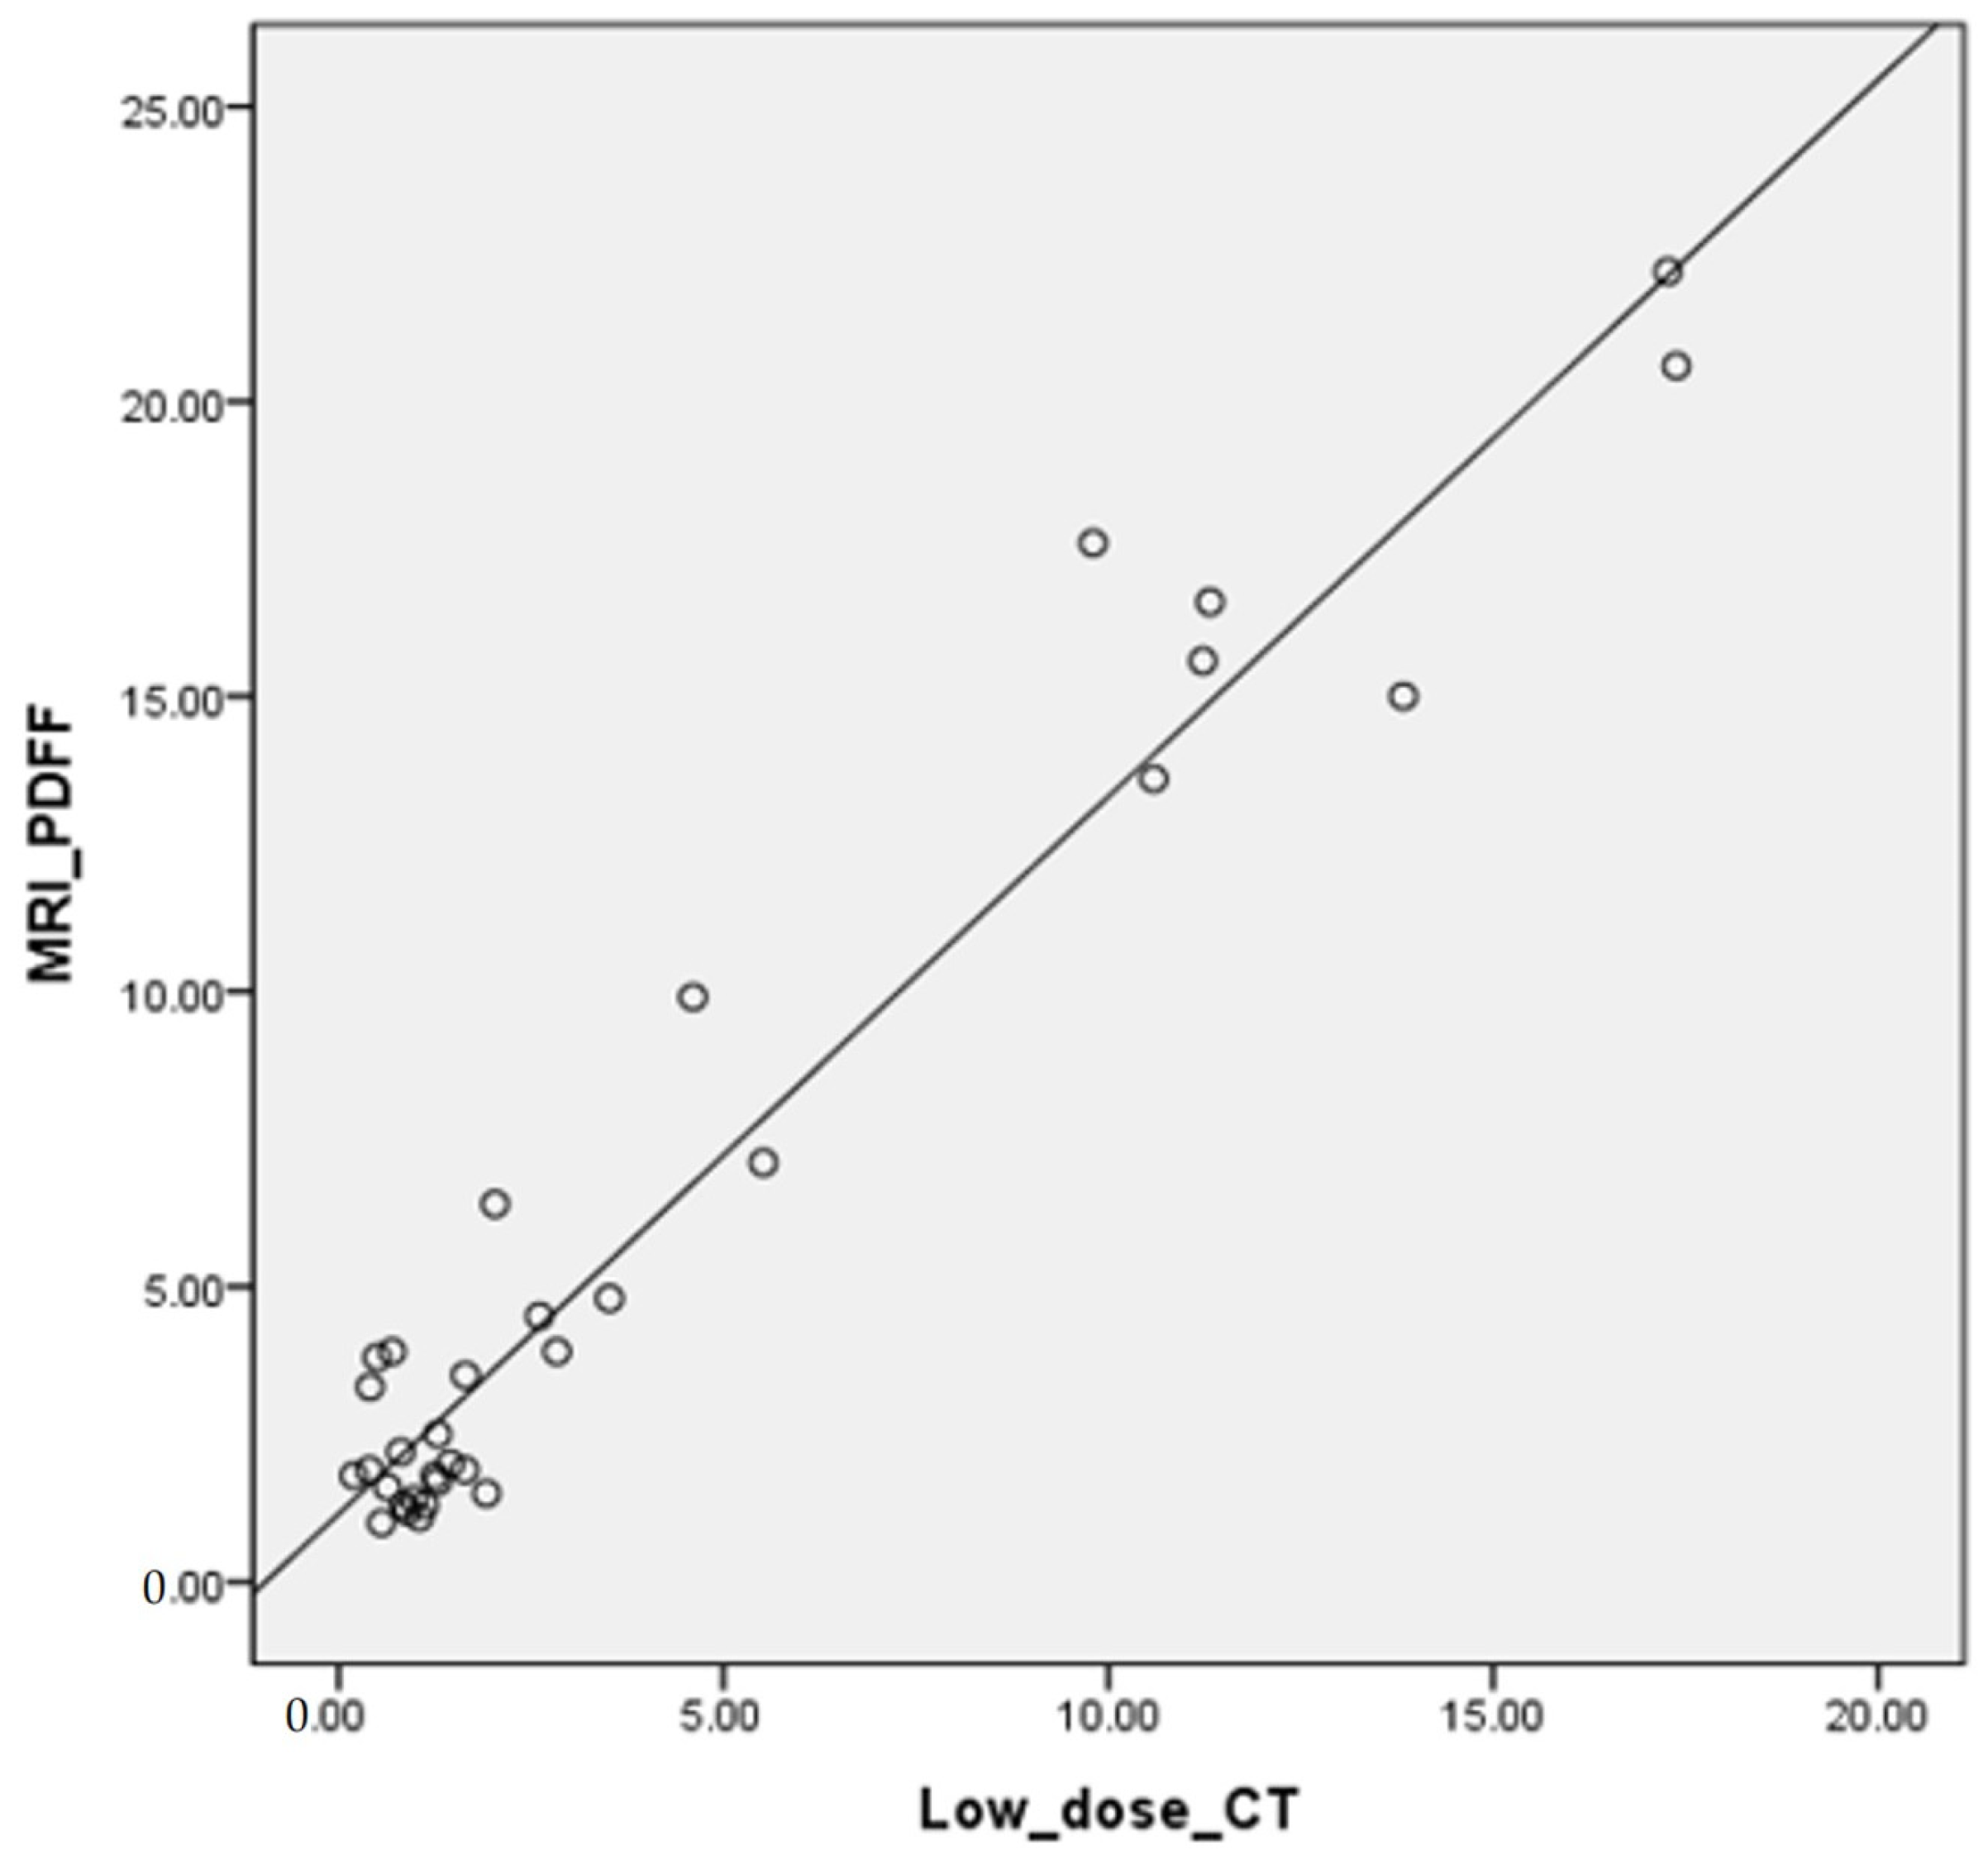
3.4. Correlation of FVF with MRI-PDFF
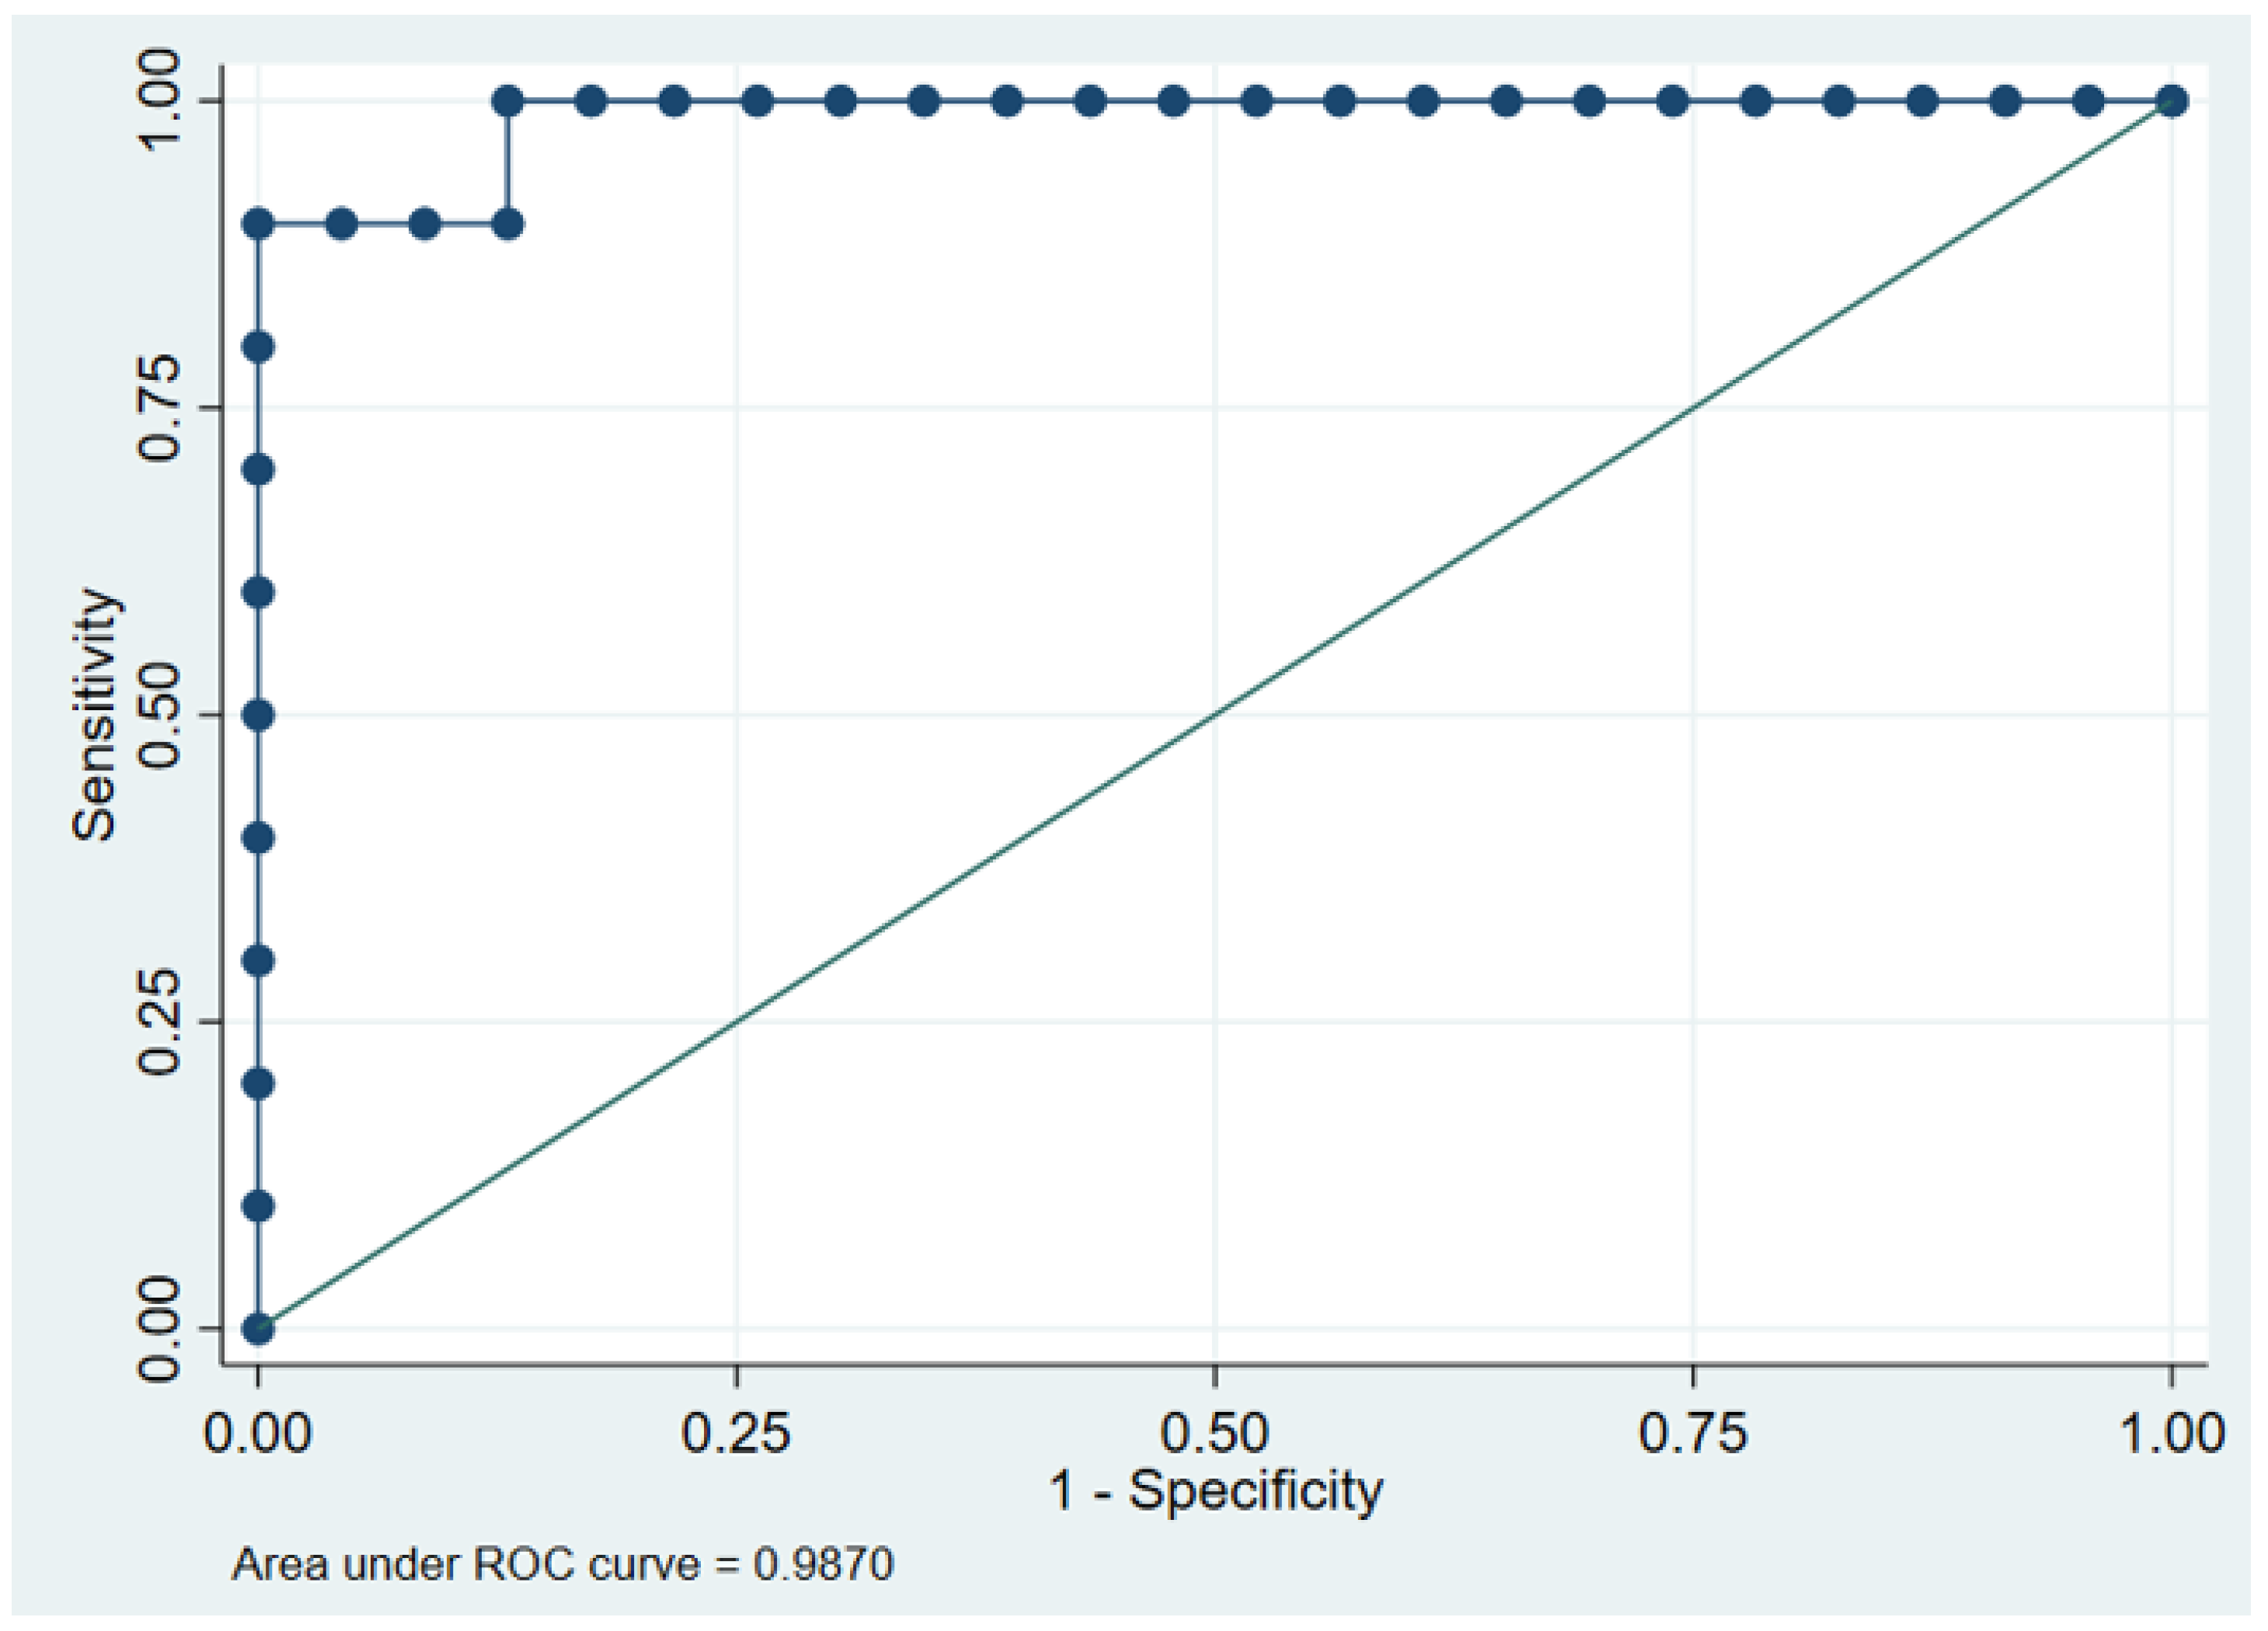
3.5. ROC Curve Analysis of FVF for Diagnosing Fatty Liver
4. Discussion
5. Conclusions
Author Contributions
Funding
Institutional Review Board Statement
Informed Consent Statement
Data Availability Statement
Conflicts of Interest
References
- Younossi, Z.M.; Koenig, A.B.; Abdelatif, D.; Fazel, Y.; Henry, L.; Wymer, M. Global epidemiology of nonalcoholic fatty liver disease-Meta-analytic assessment of prevalence, incidence, and outcomes. Hepatology 2016, 64, 73–84. [Google Scholar] [CrossRef] [Green Version]
- Sanyal, A.J.; American Gastroenterological, A. AGA technical review on nonalcoholic fatty liver disease. Gastroenterology 2002, 123, 1705–1725. [Google Scholar] [CrossRef] [PubMed]
- Goldberg, D.; Ditah, I.C.; Saeian, K.; Lalehzari, M.; Aronsohn, A.; Gorospe, E.C.; Charlton, M. Changes in the Prevalence of Hepatitis C Virus Infection, Nonalcoholic Steatohepatitis, and Alcoholic Liver Disease Among Patients With Cirrhosis or Liver Failure on the Waitlist for Liver Transplantation. Gastroenterology 2017, 152, 1090–1099. [Google Scholar] [CrossRef] [PubMed] [Green Version]
- Singh, S.; Allen, A.M.; Wang, Z.; Prokop, L.J.; Murad, M.H.; Loomba, R. Fibrosis progression in nonalcoholic fatty liver vs nonalcoholic steatohepatitis: A systematic review and meta-analysis of paired-biopsy studies. Clin. Gastroenterol. Hepatol. 2015, 13, 643–654, e641–e649, quiz e639–640. [Google Scholar] [CrossRef] [Green Version]
- Chalasani, N.; Younossi, Z.; Lavine, J.E.; Charlton, M.; Cusi, K.; Rinella, M.; Harrison, S.A.; Brunt, E.M.; Sanyal, A.J. The diagnosis and management of nonalcoholic fatty liver disease: Practice guidance from the American Association for the Study of Liver Diseases. Hepatology 2018, 67, 328–357. [Google Scholar] [CrossRef] [PubMed] [Green Version]
- European Association for the Study of The Liver; European Association for the Study of Diabetes. EASL-EASD-EASO Clinical Practice Guidelines for the management of non-alcoholic fatty liver disease. J. Hepatol. 2016, 64, 1388–1402. [Google Scholar] [CrossRef]
- Bravo, A.A.; Sheth, S.G.; Chopra, S. Liver biopsy. N. Engl. J. Med. 2001, 344, 495–500. [Google Scholar] [CrossRef]
- Fassio, E.; Alvarez, E.; Dominguez, N.; Landeira, G.; Longo, C. Natural history of nonalcoholic steatohepatitis: A longitudinal study of repeat liver biopsies. Hepatology 2004, 40, 820–826. [Google Scholar] [CrossRef]
- Vuppalanchi, R.; Unalp, A.; Van Natta, M.L.; Cummings, O.W.; Sandrasegaran, K.E.; Hameed, T.; Tonascia, J.; Chalasani, N. Effects of liver biopsy sample length and number of readings on sampling variability in nonalcoholic Fatty liver disease. Clin. Gastroenterol. Hepatol. 2009, 7, 481–486. [Google Scholar] [CrossRef] [Green Version]
- Juluri, R.; Vuppalanchi, R.; Olson, J.; Unalp, A.; Van Natta, M.L.; Cummings, O.W.; Tonascia, J.; Chalasani, N. Generalizability of the nonalcoholic steatohepatitis Clinical Research Network histologic scoring system for nonalcoholic fatty liver disease. J. Clin. Gastroenterol. 2011, 45, 55–58. [Google Scholar] [CrossRef] [PubMed] [Green Version]
- Castera, L.; Friedrich-Rust, M.; Loomba, R. Noninvasive Assessment of Liver Disease in Patients With Nonalcoholic Fatty Liver Disease. Gastroenterology 2019, 156, 1264–1281. [Google Scholar] [CrossRef] [PubMed] [Green Version]
- Starekova, J.; Hernando, D.; Pickhardt, P.J.; Reeder, S.B. Quantification of Liver Fat Content with CT and MRI: State of the Art. Radiology 2021, 301, 250–262. [Google Scholar] [CrossRef] [PubMed]
- Kodama, Y.; Ng, C.S.; Wu, T.T.; Ayers, G.D.; Curley, S.A.; Abdalla, E.K.; Vauthey, J.N.; Charnsangavej, C. Comparison of CT methods for determining the fat content of the liver. AJR Am. J. Roentgenol. 2007, 188, 1307–1312. [Google Scholar] [CrossRef] [PubMed] [Green Version]
- Pickhardt, P.J.; Park, S.H.; Hahn, L.; Lee, S.G.; Bae, K.T.; Yu, E.S. Specificity of unenhanced CT for non-invasive diagnosis of hepatic steatosis: Implications for the investigation of the natural history of incidental steatosis. Eur. Radiol. 2012, 22, 1075–1082. [Google Scholar] [CrossRef] [PubMed]
- Bohte, A.E.; van Werven, J.R.; Bipat, S.; Stoker, J. The diagnostic accuracy of US, CT, MRI and 1H-MRS for the evaluation of hepatic steatosis compared with liver biopsy: A meta-analysis. Eur. Radiol. 2011, 21, 87–97. [Google Scholar] [CrossRef] [Green Version]
- Zhang, Q.; Zhao, Y.; Wu, J.; Xie, L.; Chen, A.; Liu, Y.; Song, Q.; Li, J.; Wu, T.; Xie, L.; et al. Quantification of Hepatic Fat Fraction in Patients With Nonalcoholic Fatty Liver Disease: Comparison of Multimaterial Decomposition Algorithm and Fat (Water)-Based Material Decomposition Algorithm Using Single-Source Dual-Energy Computed Tomography. J. Comput Assist. Tomogr. 2021, 45, 12–17. [Google Scholar] [CrossRef]
- Hyodo, T.; Yada, N.; Hori, M.; Maenishi, O.; Lamb, P.; Sasaki, K.; Onoda, M.; Kudo, M.; Mochizuki, T.; Murakami, T. Multimaterial Decomposition Algorithm for the Quantification of Liver Fat Content by Using Fast-Kilovolt-Peak Switching Dual-Energy CT: Clinical Evaluation. Radiology 2017, 283, 108–118. [Google Scholar] [CrossRef]
- Xu, J.J.; Boesen, M.R.; Hansen, S.L.; Ulriksen, P.S.; Holm, S.; Lonn, L.; Hansen, K.L. Assessment of Liver Fat: Dual-Energy CT versus Conventional CT with and without Contrast. Diagnostics (Basel) 2022, 12, 708. [Google Scholar] [CrossRef]
- Cunha, G.M.; Thai, T.T.; Hamilton, G.; Covarrubias, Y.; Schlein, A.; Middleton, M.S.; Wiens, C.N.; McMillan, A.; Agni, R.; Funk, L.M.; et al. Accuracy of common proton density fat fraction thresholds for magnitude- and complex-based chemical shift-encoded MRI for assessing hepatic steatosis in patients with obesity. Abdom. Radiol. 2020, 45, 661–671. [Google Scholar] [CrossRef]
- Pickhardt, P.J.; Blake, G.M.; Graffy, P.M.; Sandfort, V.; Elton, D.C.; Perez, A.A.; Summers, R.M. Liver Steatosis Categorization on Contrast-Enhanced CT Using a Fully Automated Deep Learning Volumetric Segmentation Tool: Evaluation in 1204 Healthy Adults Using Unenhanced CT as a Reference Standard. AJR Am. J. Roentgenol. 2021, 217, 359–367. [Google Scholar] [CrossRef]
- Park, J.; Shin, J.; Min, I.K.; Bae, H.; Kim, Y.E.; Chung, Y.E. Image Quality and Lesion Detectability of Lower-Dose Abdominopelvic CT Obtained Using Deep Learning Image Reconstruction. Korean J. Radiol. 2022, 23, 402–412. [Google Scholar] [CrossRef] [PubMed]
- Park, S.; Yoon, J.H.; Joo, I.; Yu, M.H.; Kim, J.H.; Park, J.; Kim, S.W.; Han, S.; Ahn, C.; Kim, J.H.; et al. Image quality in liver CT: Low-dose deep learning vs standard-dose model-based iterative reconstructions. Eur. Radiol. 2022, 32, 2865–2874. [Google Scholar] [CrossRef] [PubMed]
- Ozturk, A.; Grajo, J.R.; Gee, M.S.; Benjamin, A.; Zubajlo, R.E.; Thomenius, K.E.; Anthony, B.W.; Samir, A.E.; Dhyani, M. Quantitative Hepatic Fat Quantification in Non-alcoholic Fatty Liver Disease Using Ultrasound-Based Techniques: A Review of Literature and Their Diagnostic Performance. Ultrasound Med. Biol. 2018, 44, 2461–2475. [Google Scholar] [CrossRef] [PubMed]
- Ferraioli, G.; Soares Monteiro, L.B. Ultrasound-based techniques for the diagnosis of liver steatosis. World J. Gastroenterol. 2019, 25, 6053–6062. [Google Scholar] [CrossRef] [PubMed]
- Paige, J.S.; Bernstein, G.S.; Heba, E.; Costa, E.A.C.; Fereirra, M.; Wolfson, T.; Gamst, A.C.; Valasek, M.A.; Lin, G.Y.; Han, A.; et al. A Pilot Comparative Study of Quantitative Ultrasound, Conventional Ultrasound, and MRI for Predicting Histology-Determined Steatosis Grade in Adult Nonalcoholic Fatty Liver Disease. AJR Am. J. Roentgenol. 2017, 208, W168–W177. [Google Scholar] [CrossRef] [PubMed]

| Parameter | Values |
|---|---|
| Tube voltage (kV) | 80–140 |
| Tube current (mAs) | 145 |
| Rotation time (second) | 0.5 |
| Beam collimation (mm) | 40 |
| Pitch | 1.375:1 |
| Slice thickness (mm) | 2.5 |
| Data | |
|---|---|
| No. of patients | 33 |
| Male/Female | 17/16 |
| Age * | 46.5 (13.2) |
| MRI PDFF | |
| MRI PDFF < 5.0% | 23 |
| 5.0% ≤ MRI PDFF < 15.0% | 5 |
| 15.0% ≤ MRI PDFF | 5 |
Publisher’s Note: MDPI stays neutral with regard to jurisdictional claims in published maps and institutional affiliations. |
© 2022 by the authors. Licensee MDPI, Basel, Switzerland. This article is an open access article distributed under the terms and conditions of the Creative Commons Attribution (CC BY) license (https://creativecommons.org/licenses/by/4.0/).
Share and Cite
Hong, S.B.; Lee, N.K.; Kim, S.; Um, K.; Kim, K.; Kim, I.J. Hepatic Fat Quantification with the Multi-Material Decomposition Algorithm by Using Low-Dose Non-Contrast Material-Enhanced Dual-Energy Computed Tomography in a Prospectively Enrolled Cohort. Medicina 2022, 58, 1459. https://doi.org/10.3390/medicina58101459
Hong SB, Lee NK, Kim S, Um K, Kim K, Kim IJ. Hepatic Fat Quantification with the Multi-Material Decomposition Algorithm by Using Low-Dose Non-Contrast Material-Enhanced Dual-Energy Computed Tomography in a Prospectively Enrolled Cohort. Medicina. 2022; 58(10):1459. https://doi.org/10.3390/medicina58101459
Chicago/Turabian StyleHong, Seung Baek, Nam Kyung Lee, Suk Kim, Kyunga Um, Keunyoung Kim, and In Joo Kim. 2022. "Hepatic Fat Quantification with the Multi-Material Decomposition Algorithm by Using Low-Dose Non-Contrast Material-Enhanced Dual-Energy Computed Tomography in a Prospectively Enrolled Cohort" Medicina 58, no. 10: 1459. https://doi.org/10.3390/medicina58101459