
Increased Expression of Circulating Stress Markers, Inflammatory Cytokines and Decreased Antioxidant Level in Diabetic Nephropathy

 ,
,
Abstract
:1. Introduction
2. Materials and Methods
2.1. Study Aims
2.2. Study Participants
2.3. Sampling Technique
2.4. Inclusion and Exclusion Criteria
2.5. Determination of Malondialdehyde (MDA)
2.6. Determination of Glutathione (GSH)
2.7. Evaluation of Advanced Oxidative Protein Products (AOPPS)
2.8. Determination of Advanced Glycation Endproducts (AGES)
2.9. Determination of IL-6 and TNF-α by ELISA Kit Method
2.10. Determination of MPO by Using ELISA Kit Assay
2.11. Estimation of Insulin and Glucagon
2.12. Meaurement of Urinary Albumin and Urinary Albumin to Creatinine
2.13. Measurement of Serum Creatinine
2.14. Measurement of Low Density Lipoprotein (LDL)
2.15. Determination of High Density Lipoprotein (HDL)
2.16. Estimation of Triglycerides (TG)
2.17. Evaluation of CBC (Complete Blood Count)
2.18. Statistical Analysis
3. Results
4. Discussion
4.1. Study Limitations
4.2. Strength of the Study
4.3. Future Recommendations
Author Contributions
Funding
Institutional Review Board Statement
Informed Consent Statement
Data Availability Statement
Conflicts of Interest
References
- Adeshara, A.; Diwan, G.; Tupe, S. Diabetes and complications: Cellular signaling pathways, current understanding and targeted therapies. Curr. Drug Targets 2016, 17, 1309–1328. [Google Scholar] [CrossRef] [PubMed]
- Ngsin, P.; Jain, P.; Gill, S.; Heer, G.; Townend, J.; Freemantle, N. Results and lessons from the Spironolactone To Prevent Cardiovascular Events in Early Stage Chronic Kidney Disease [STOP-CKD] randomised controlled trial. BMJ Open 2016, 6, 010519. [Google Scholar]
- Mahmoodnia, L.; Aghadavod, E.; Beigrezaei, S.; Rafieian-Kopaei, M. An update on Diabetic kidney disease, oxidative stress and antioxidant agents. J. Ren. Inj. Prev. 2017, 6, 153–157. [Google Scholar] [CrossRef] [PubMed]
- Akhter, F.; Khan, M.S.; Alatar, A.A.; Faisal, M.; Ahmad, S. Antigenic role of the adaptive immune response to d-ribose glycated LDL in diabetes, atherosclerosis and diabetes atherosclerotic patients. Life Sci. 2016, 151, 139–146. [Google Scholar] [CrossRef]
- Akhter, F.; Khan, M.S.; Singh, S.; Ahmad, S. An immunohistochemical analysis to validate the rationale behind the enhanced immunogenicity of D-ribosylated low density lipo-protein. PLoS ONE 2014, 9, e113144. [Google Scholar] [CrossRef] [Green Version]
- Khalid, M.; Petroianu, G.; Adem, A. Advanced Glycation End Products and Diabetes Mellitus: Mechanisms and Perspectives. Biomolecules 2022, 12, 542. [Google Scholar] [CrossRef]
- Aghadavod, E.; Khodadadi, S.; Baradaran, A.; Nasri, P.; Bahmani, M.; Rafieian, M. Role of oxidative stress and inflammatory factors in Diabetic Kidney Disease. Iran. J. Kidney Dis. 2016, 10, 337–343. [Google Scholar]
- Wu, J.; Han, J.; Hou, B.; Deng, C.; Wu, H.; Shen, L. Sulforaphane inhibits TGF-β-induced epithelial-mesenchymal transition of hepatocellular carcinoma cells via the reactive oxygen species-dependent pathway. Oncol. Rep. 2016, 35, 2977–2983. [Google Scholar] [CrossRef] [Green Version]
- Vasanthakumar, R.; Mohan, V.; Anand, G.; Deepa, M.; Babu, M.; Aravindhan, V. Serum IL-9, IL-7, and TGF-β levels in subjects with diabetic kidney disease [CURES-134]. Cytokine 2015, 72, 109–112. [Google Scholar] [CrossRef]
- Maqbool, T.; Awan, S.J.; Malik, S.; Hadi, F.; Shehzadi, S.; Tariq, K. In-vitro anti-proliferative, apoptotic and antioxidative activities of medicinal herb Kalonji (Nigella sativa). Curr. Pharm. Biotechnol. 2019, 20, 1288–1308. [Google Scholar] [CrossRef]
- Rasool, R.; Ullah, I.; Shahid, S.; Mubeen, B.; Imam, S.S.; Alshehri, S.; Ghoneim, M.M.; Alzarea, S.I.; Murtaza, B.N.; Nadeem, M.S.; et al. In Vivo Assessment of the Ameliorative Impact of Some Medicinal Plant Extracts on Lipopolysaccharide-Induced Multiple Sclerosis in Wistar Rats. Molecules 2022, 27, 1608. [Google Scholar] [CrossRef] [PubMed]
- Luo, X.; Wu, J.; Jing, S.; Yan, J. Hyperglycemic stress and carbon stress in diabetic glucotoxicity. Aging Dis. 2016, 7, 90–110. [Google Scholar] [CrossRef] [PubMed]
- Muhl, L.; Moessinger, C.; Adzemovic, Z.; Dijkstra, H.; Nilsson Zeitelhofer, M.; Hagberg, C.E.; Huusko, J.; Falkevall, A.; Ylä-Herttuala, S.; Eriksson, U.; et al. Expression of vascular endothelial growth factor [VEGF]-B and its receptor [VEGFR1] in murine heart, lung and kidney. Cell Tissue Res. 2016, 365, 51–63. [Google Scholar] [CrossRef] [PubMed]
- Domingueti, P.; Sant’Ana, M.; Das, M.; das Graças Carvalho, P.; Gomes, B.; Fernandes, P. Diabetes mellitus: The linkage between oxidative stress, inflammation, hypercoagulability and vascular complications. J. Diabetes Complicat. 2016, 30, 738–745. [Google Scholar] [CrossRef] [PubMed]
- Hojs, V.; Bevc, S.; Ekart, R.; Hojs, R. Oxidative Stress Markers in Chronic Kidney Disease with Emphasis on Diabetic Nephropathy. Antioxidants 2020, 9, 925. [Google Scholar] [CrossRef] [PubMed]
- Verma, M.; Kachhawa, K.; Sahu, A.; Kachhawa, P. Association of Antioxidant Enzymes and MDA level in Diabetic Nephropathy Patients in Indore Region of Madhya Pradesh. J. Pure Appl. Microbiol. 2014, 8, 4137–4141. [Google Scholar]
- Rani, K.; Gavel, P.; Bharti, S. MDA, Oxidative Stress Marker-Role in Diabetic Nephropathy With Special Reference to Type II Diabetes Mellitus. Indian J. Appl. Res. 2019, 6, 128–130. [Google Scholar]
- Hou, Y.; Lin, M.; Qui, X.; He, M.; Zhang, Y.; Guo, F. Effect of Type-2 Diabetes Mellitus in Retinopathy Patients on MDA, SOD Activity and its Correlation with HbA1c. Hum. Anim. Health 2021, 64, 21200075. [Google Scholar] [CrossRef]
- Calabrese, V.; Cornelius, C.; Leso, V.; Trovato, A.; Ventimiglia, B.; Cavallaro, M.; Scuto, M.; Rizza, S.; Zanoli, L.; Neri, S.; et al. Oxidative stress, glutathione status, sirtuin and cellular stress response in type 2 diabetes. Bichem. Biophys. Acta 2012, 1822, 729–736. [Google Scholar] [CrossRef] [Green Version]
- Miranda-Diaz, A.G.; Pazarin-Villasenor, L.; Yanowsky-Escatell, F.G.; Andrade-Sierra, J. Oxidative Stress in Diabetic Nephropathy with Early Chronic Kidney Disease. J. Diabetes Res. 2016, 16, 704–723. [Google Scholar] [CrossRef] [Green Version]
- Conti, G.; Caccamo, D.; Siligato, R.; Gembillo, G.; Satta, E.; Pazzano, D.; Carucci, N.; Carella, A.; Del Campo, G.; Salvo, A.; et al. Association of Higher Advanced Oxidation Protein Products [AOPPs] Levels in Patients with Diabetic and Hypertensive Nephropathy. Medicina 2019, 55, 675. [Google Scholar] [CrossRef] [PubMed] [Green Version]
- Kar, K.; Sinha, S. Correlation between Advanced Oxidation Protein Products [AOPP] and Antioxidant status in Type 2 diabetics in Southern Asian Region. SJAMS 2014, 2, 647–652. [Google Scholar]
- Sharada, M.; Abdalla, S.; Amin, I.; Khouly, A.; Sherif, A. Plasma Levels of Oxidation Protein Products in Type 2 Diabetic Patients with Nephropathy. Aust. J. Basic Appl. Sci. 2012, 6, 537–544. [Google Scholar]
- Taylor, L.; Armstrong, R.; Perrett, D.; Hattersley, T.; Winyard, G. Optimisation of an Advanced Oxidation Protein Products Assay: Its Application to Studies of Oxidative Stress in Diabetes Mellitus. Oxidative Med. Cell. Longev. 2015, 15, 496271. [Google Scholar] [CrossRef] [Green Version]
- Nishad, R.; Tahaseen, V.; Kavvuri, R.; Motrapu, M.; Singh, A.K.; Peddi, K.; Pasupulati, A.K. Advanced-Glycation End-Products Induce Podocyte Injury and Contribute to Proteinuria. Front. Med. 2021, 8, 685447. [Google Scholar] [CrossRef]
- Akhter, F.; Khan, M.S.; Ahmad, S. Acquired immunogenicity of calf thymus DNA and LDL modified by D-ribose: A comparative study. Int. J. Biol. Macromol. 2015, 72, 1222–1227. [Google Scholar] [CrossRef]
- Steenbeke, M.; Speeckaert, R.; Desmedt, S.; Glorieux, G.; Delanghe, R.; Speeckaert, M. The Role of Advanced Glycation End Products and Its Soluble Receptor in Kidney Diseases. Int. J. Mol. Sci. 2022, 23, 3439. [Google Scholar] [CrossRef]
- Yamagishi, S.; Matsui, T. Advanced glycation end products, oxidative stress and diabetic nephropathy. Oxidative Med. Cell. Longev. 2010, 3, 101–108. [Google Scholar] [CrossRef] [Green Version]
- Kreiner, F.; Kraaijenhof, M.; Herrath, M.; Hovingh, K.; Scholten, J. Interleukin 6 in diabetes, chronic kidney disease, and cardiovascular disease: Mechanisms and therapeutic perspectives. Expert Rev. Clin. Immunol. 2022, 18, 377–389. [Google Scholar] [CrossRef]
- Ha, T.; Binh, G.; Nguyen, T.; Huong, T. The role of Serum Interleukine-6 level in type 2 diabetic nephropathy. Res. J. Biotechnol. 2021, 16, 2. [Google Scholar]
- Sindhughosa, A.; Pranamartha, K. The involvement of proinflammatory cytokines in diabetic nephropathy: Focus on interleukin 1 [Il-1], interleukin 6 [Il-6], and tumor necrosis factor-alpha [TNF-A] signaling mechanism. Bali Med. J. 2017, 6, 44–51. [Google Scholar] [CrossRef]
- Nazari, A.; Sardoo, M.; Fard, T.; Hassanshahi, G.; Goujani, R.; Bagheri, E. Is IL-6 Increased in Type 2 Diabetes Mellitus Patients Independent of Nephropathic Complication? J. Endocrinol. Diabetes Obes. 2017, 5, 1102. [Google Scholar]
- Chen, Y.L.; Qiao, Y.C.; Xu, Y.; Ling, W.; Pan, Y.H.; Huang, Y.C.; Geng, L.J.; Zhao, H.L.; Zhang, X.X. Serum TNF-α concentrations in type 2 diabetes mellitus patients and diabetic nephropathy patients: A systematic review and meta-analysis. Immunol. Lett. 2017, 186, 52–58. [Google Scholar] [CrossRef] [PubMed]
- Edal, H.; Fathy, M.; Elela, H.; Emara, M.; Khair, A. Role of tumor necrosis factor alpha in type 2 diabetic nephropathy. Menoufia Med. J. 2020, 33, 920–925. [Google Scholar]
- Yeo, E.; Hwang, J.; Park, E.; Choi, J.; Huh, B.; Kim, Y. Tumor necrosis factor [TNF-alpha] and C-reactive protein [CRP] are positively associated with the risk of chronic kidney disease in patients with type 2 diabetes. Yonsei Med. J. 2010, 51, 519–525. [Google Scholar] [CrossRef] [Green Version]
- El-Badawy, M.A.; Farrag, D.A.; El-Rehem, A.; Samia, M.R.; El-Mahdi, A.R.; El-Sherbeny, A.A.; Abdel Hady, E.A.M.; Abdel-Sattar, H.A.; Abdelaziz, D.M. Tumor necrosis factor-α is a novel biomarker for peripheral neuropathy in type II diabetes mellitus: A clinical and electrophysiological study. Egypt. Rheumatol. Rehabil. 2017, 44, 83–90. [Google Scholar] [CrossRef]
- Moneam, S.; Saeed, H.; Khudair, S. Serum Myeloperoxidase Activity Association with Cardiovascular and Kidney Disease Risk Factors In Pre-Diabetic And Type 2 Diabetic Patients. Nat. Volatiles Essent. Oils 2021, 8, 14084–14092. [Google Scholar]
- Rovira-Llopis, S.; Rocha, M.; Falcon, R.; de Pablo, C.; Alvarez, A.; Jover, A.; Hernandez-Mijares, A.; Victor, V.M. Is myeloperoxidase a key component in the ROS-induced vascular damage related to nephropathy in type 2 diabetes? Antioxid. Redox Signal. 2013, 19, 1452–1458. [Google Scholar] [CrossRef] [Green Version]
- Mansoor, G.; Muhammad, T.; Hadi, F.; Maqbool, T.; Shakoori, T.; Malik, A. Deranged Haematological Profile and Dyslipidaemiain Diabetes Induced Nephropathy. J. Pharm. Res. Int. 2022, 34, 64–72. [Google Scholar] [CrossRef]

| Variable | Control (n = 150) | Diabetics (n = 150) | Diabetic Nephropathy (n = 150) | p Value |
|---|---|---|---|---|
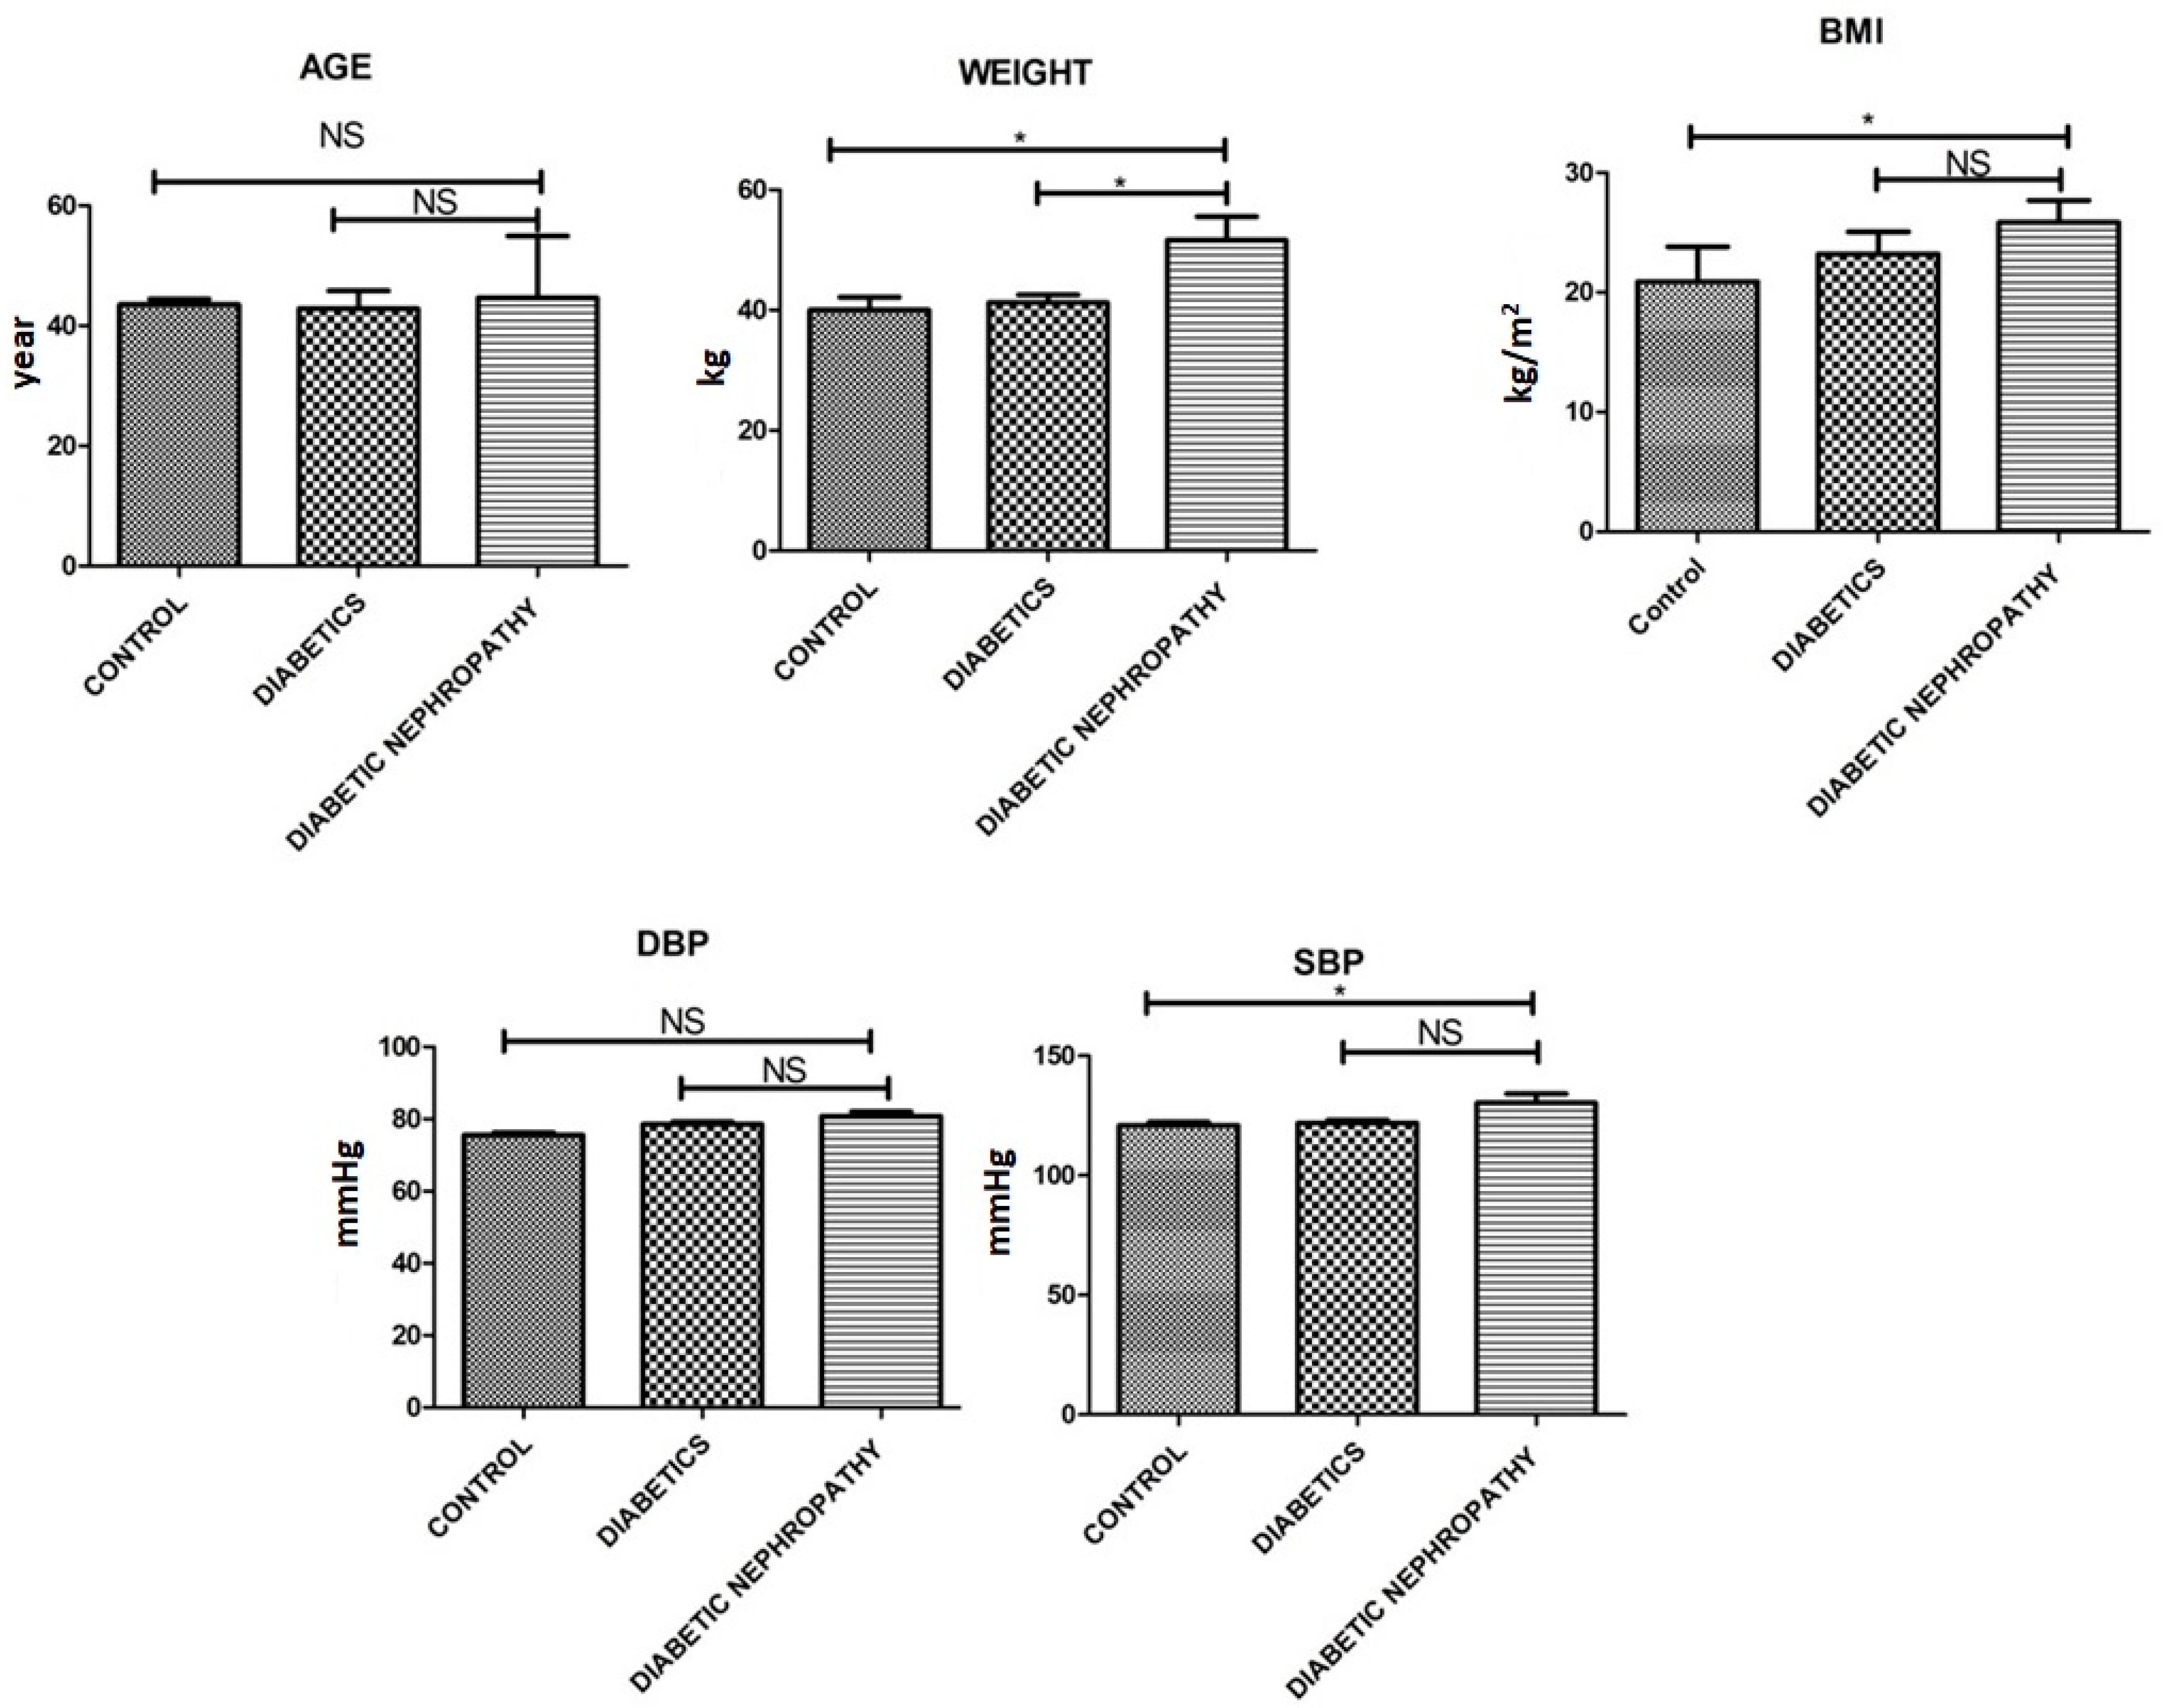
| Weight [kg] | 40.25 ± 3.3 | 41.22 ± 2.25 | 51.61 ± 6.8 | 0.001 |
| Age [Yrs.] | 43.55 ± 1.5 | 42.85 ± 5.15 | 44.61 ± 7.89 | 0.054 |
| BMI [kg/m]2 | 20.88 ± 5.1 | 23.22 ± 3.2 | 25.84 ± 3.2 | 0.03 |
| Systolic BP [mmHg] | 120.99 ± 2.2 | 121.91 ± 2.24 | 130.33 ± 6.75 | 0.51 |
| Diastolic BP [mmHg] | 75.55 ± 1.15 | 78.56 ± 1.19 | 80.75 ± 2.27 | 0.523 |
| Variable | Control (n = 150) | Diabetics (n = 150) | Diabetic Nephropathy (n = 150) | p Value |
|---|---|---|---|---|
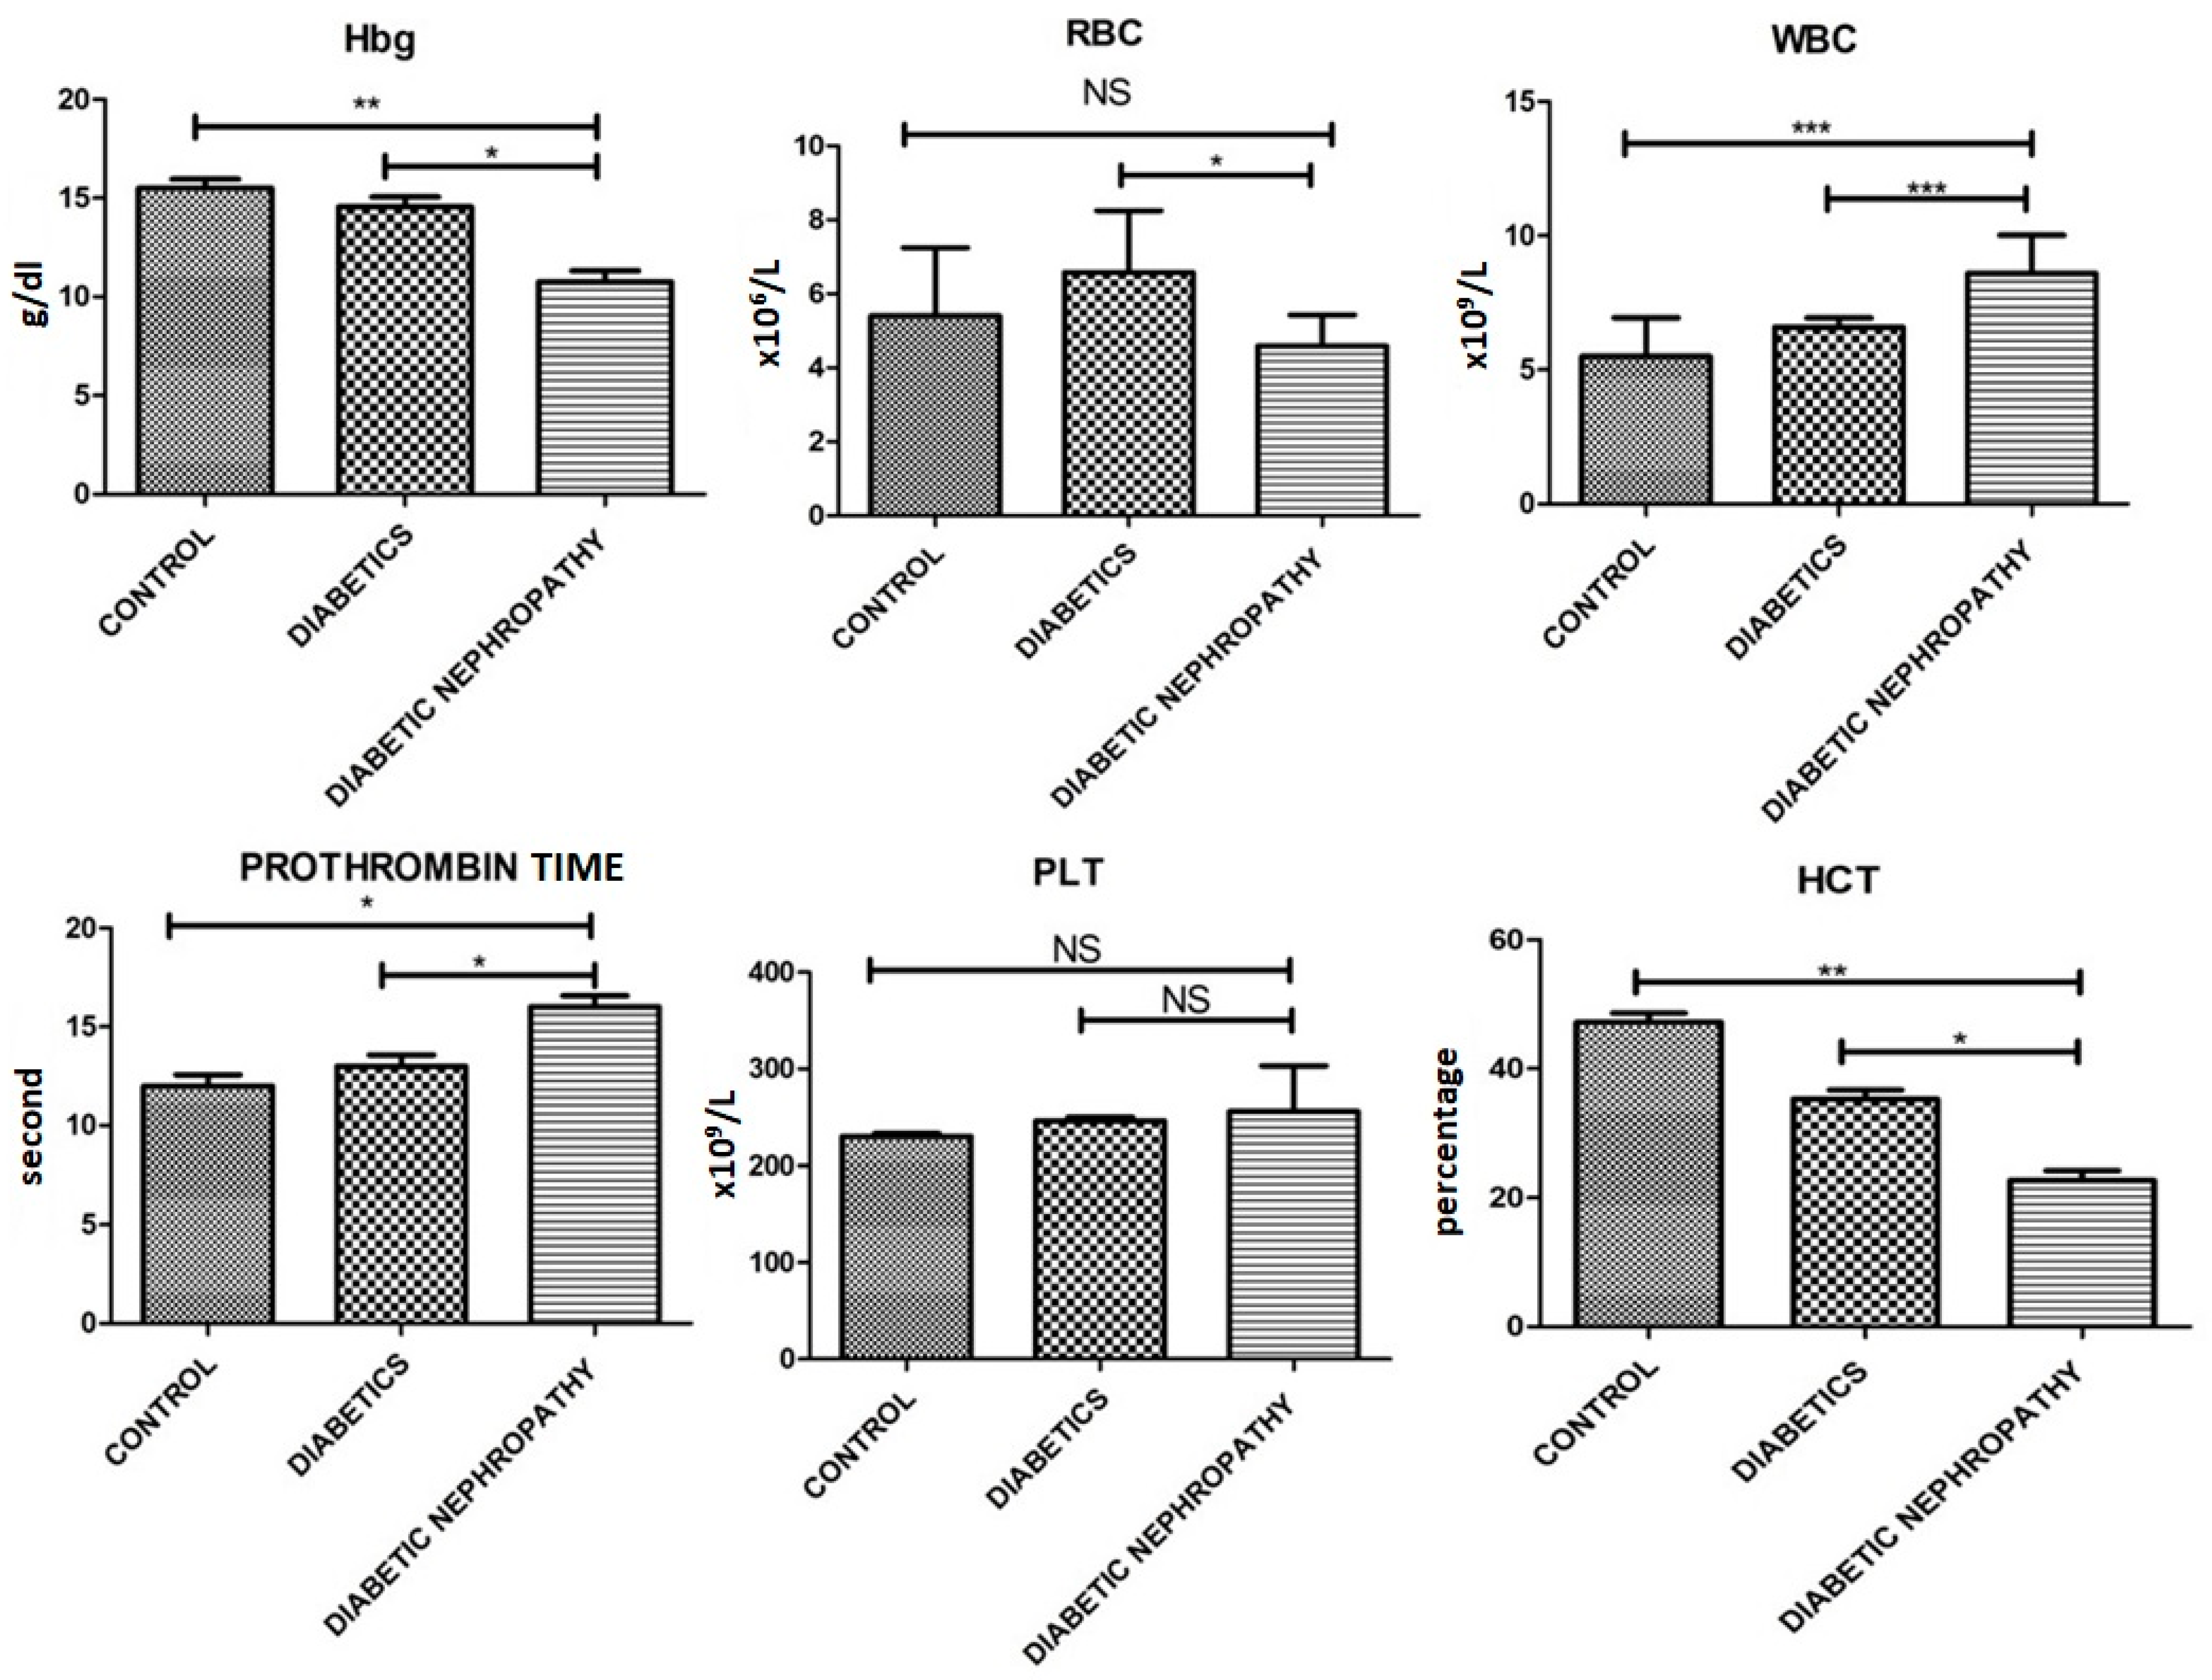
| Hb (g/dL) | 15.5 ± 0.78 | 14.55 ± 0.88 | 10.76 ± 0.98 | 0.001 |
| RBCs (×106/uL) | 5.4 ± 3.2 | 6.58 ± 2.88 | 4.59 ± 1.45 | 0.05 |
| WBCs (×109/L) | 5.5 ± 2.5 | 6.59 ± 0.59 | 8.59 ± 2.48 | 0.0041 |
| PLTs (×109/L) | 230.3 ± 5.4 | 246.3 ± 6.7 | 255.7 ± 82.0 | 0.01 |
| Hct (%) | 47.2 ± 2.5 | 35.27 ± 2.45 | 22.74 ± 2.61 | 0.0001 |
| Prothrombin time (s) | 12 s | 13 s | 16 s | 0.041 |
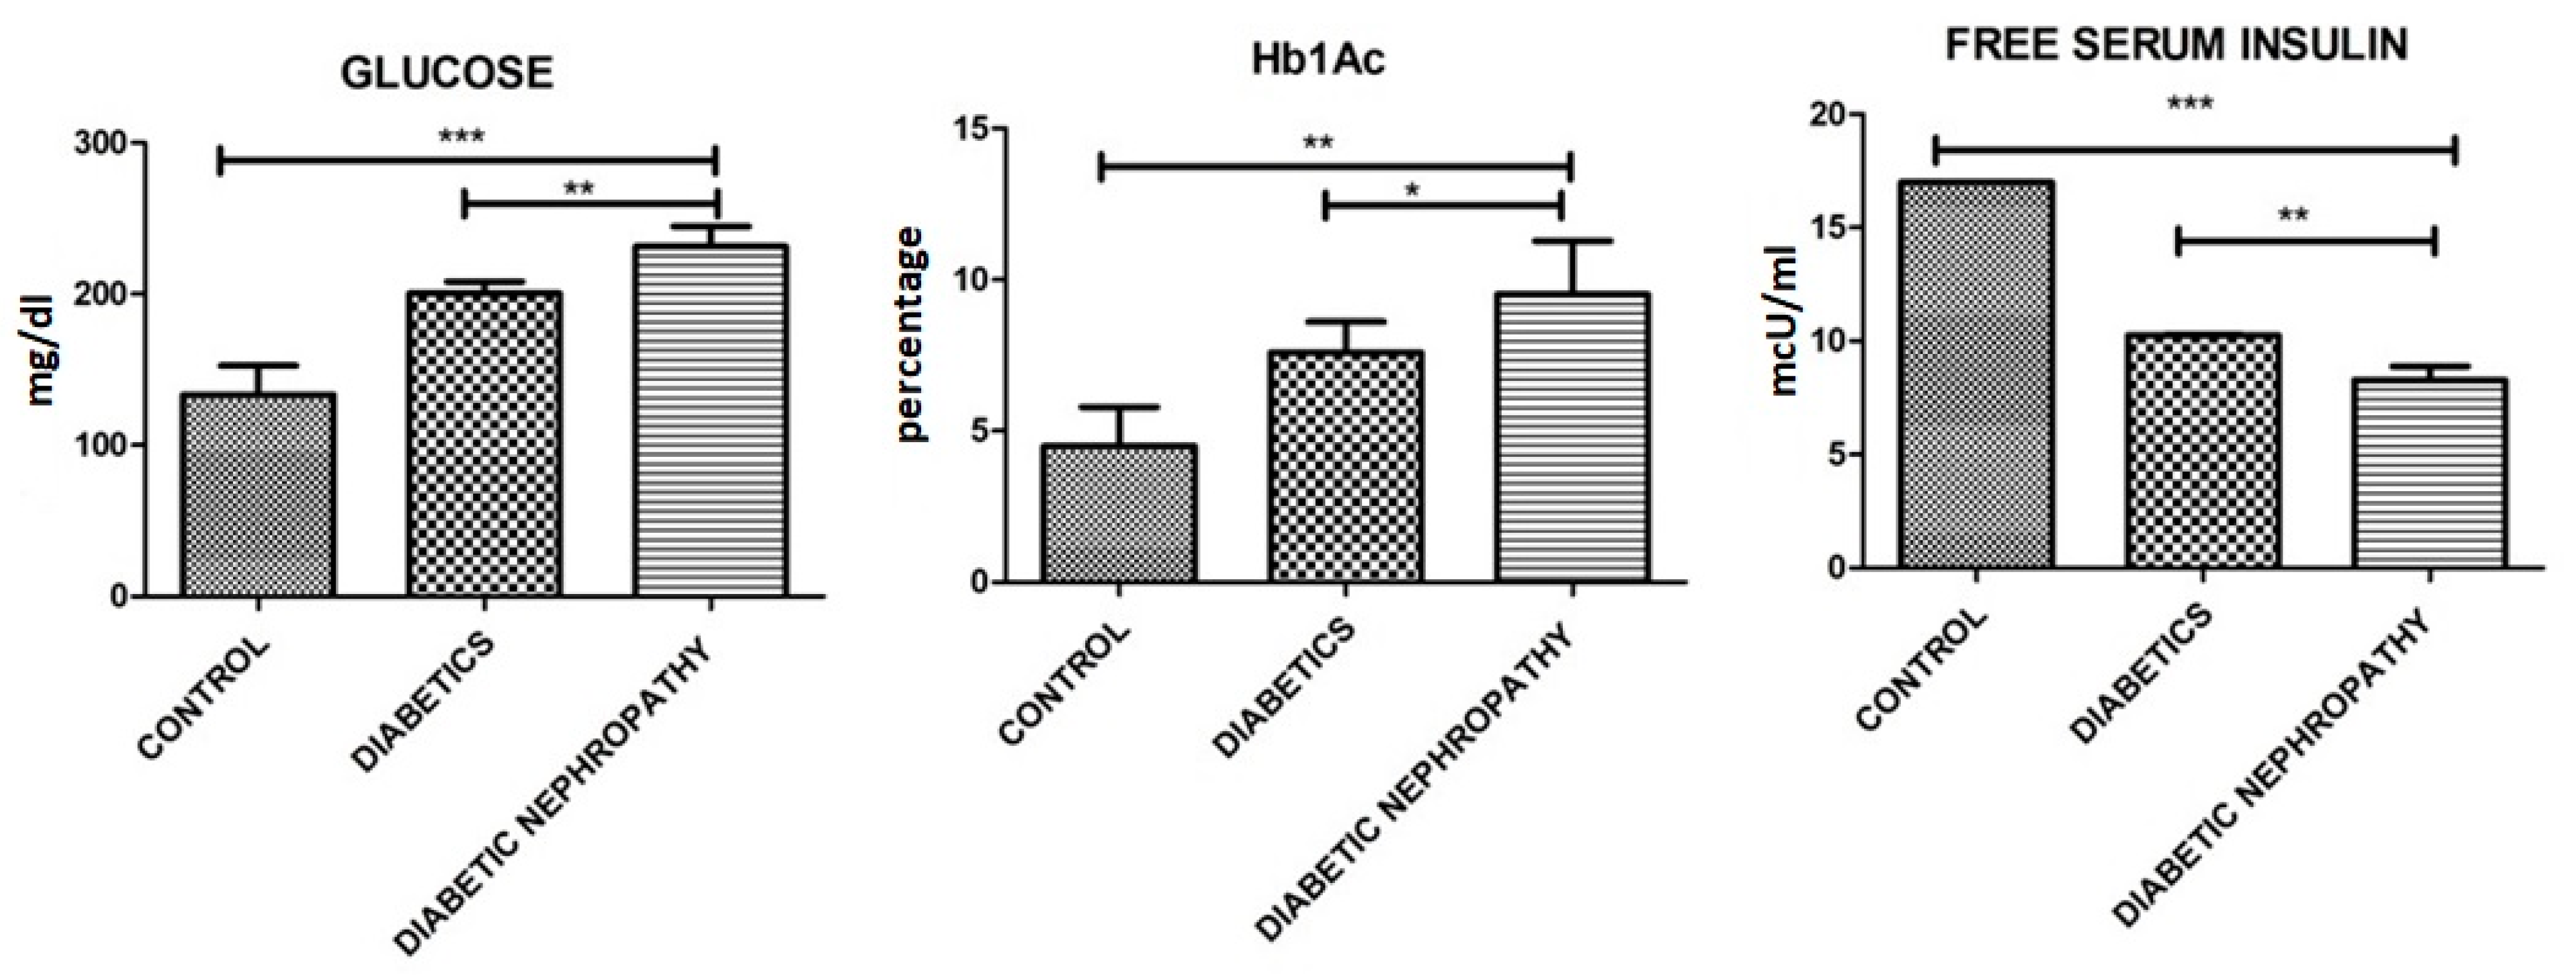
| HbA1c (%) | 4.5 ± 2.55 | 7.59 ± 1.77 | 9.55 ± 3.01 | 0.001 |
| Free Serum Insulin levels (mcU/mL) | 17.01 ± 0.02 | 10.25 ± 0.06 | 8.29 ± 1.03 | 0.0014 |
| Glucose (mg/dL) | 130 ± 20.0 | 200.21 ± 13.25 | 231.33 ± 23.11 | 0.0001 |
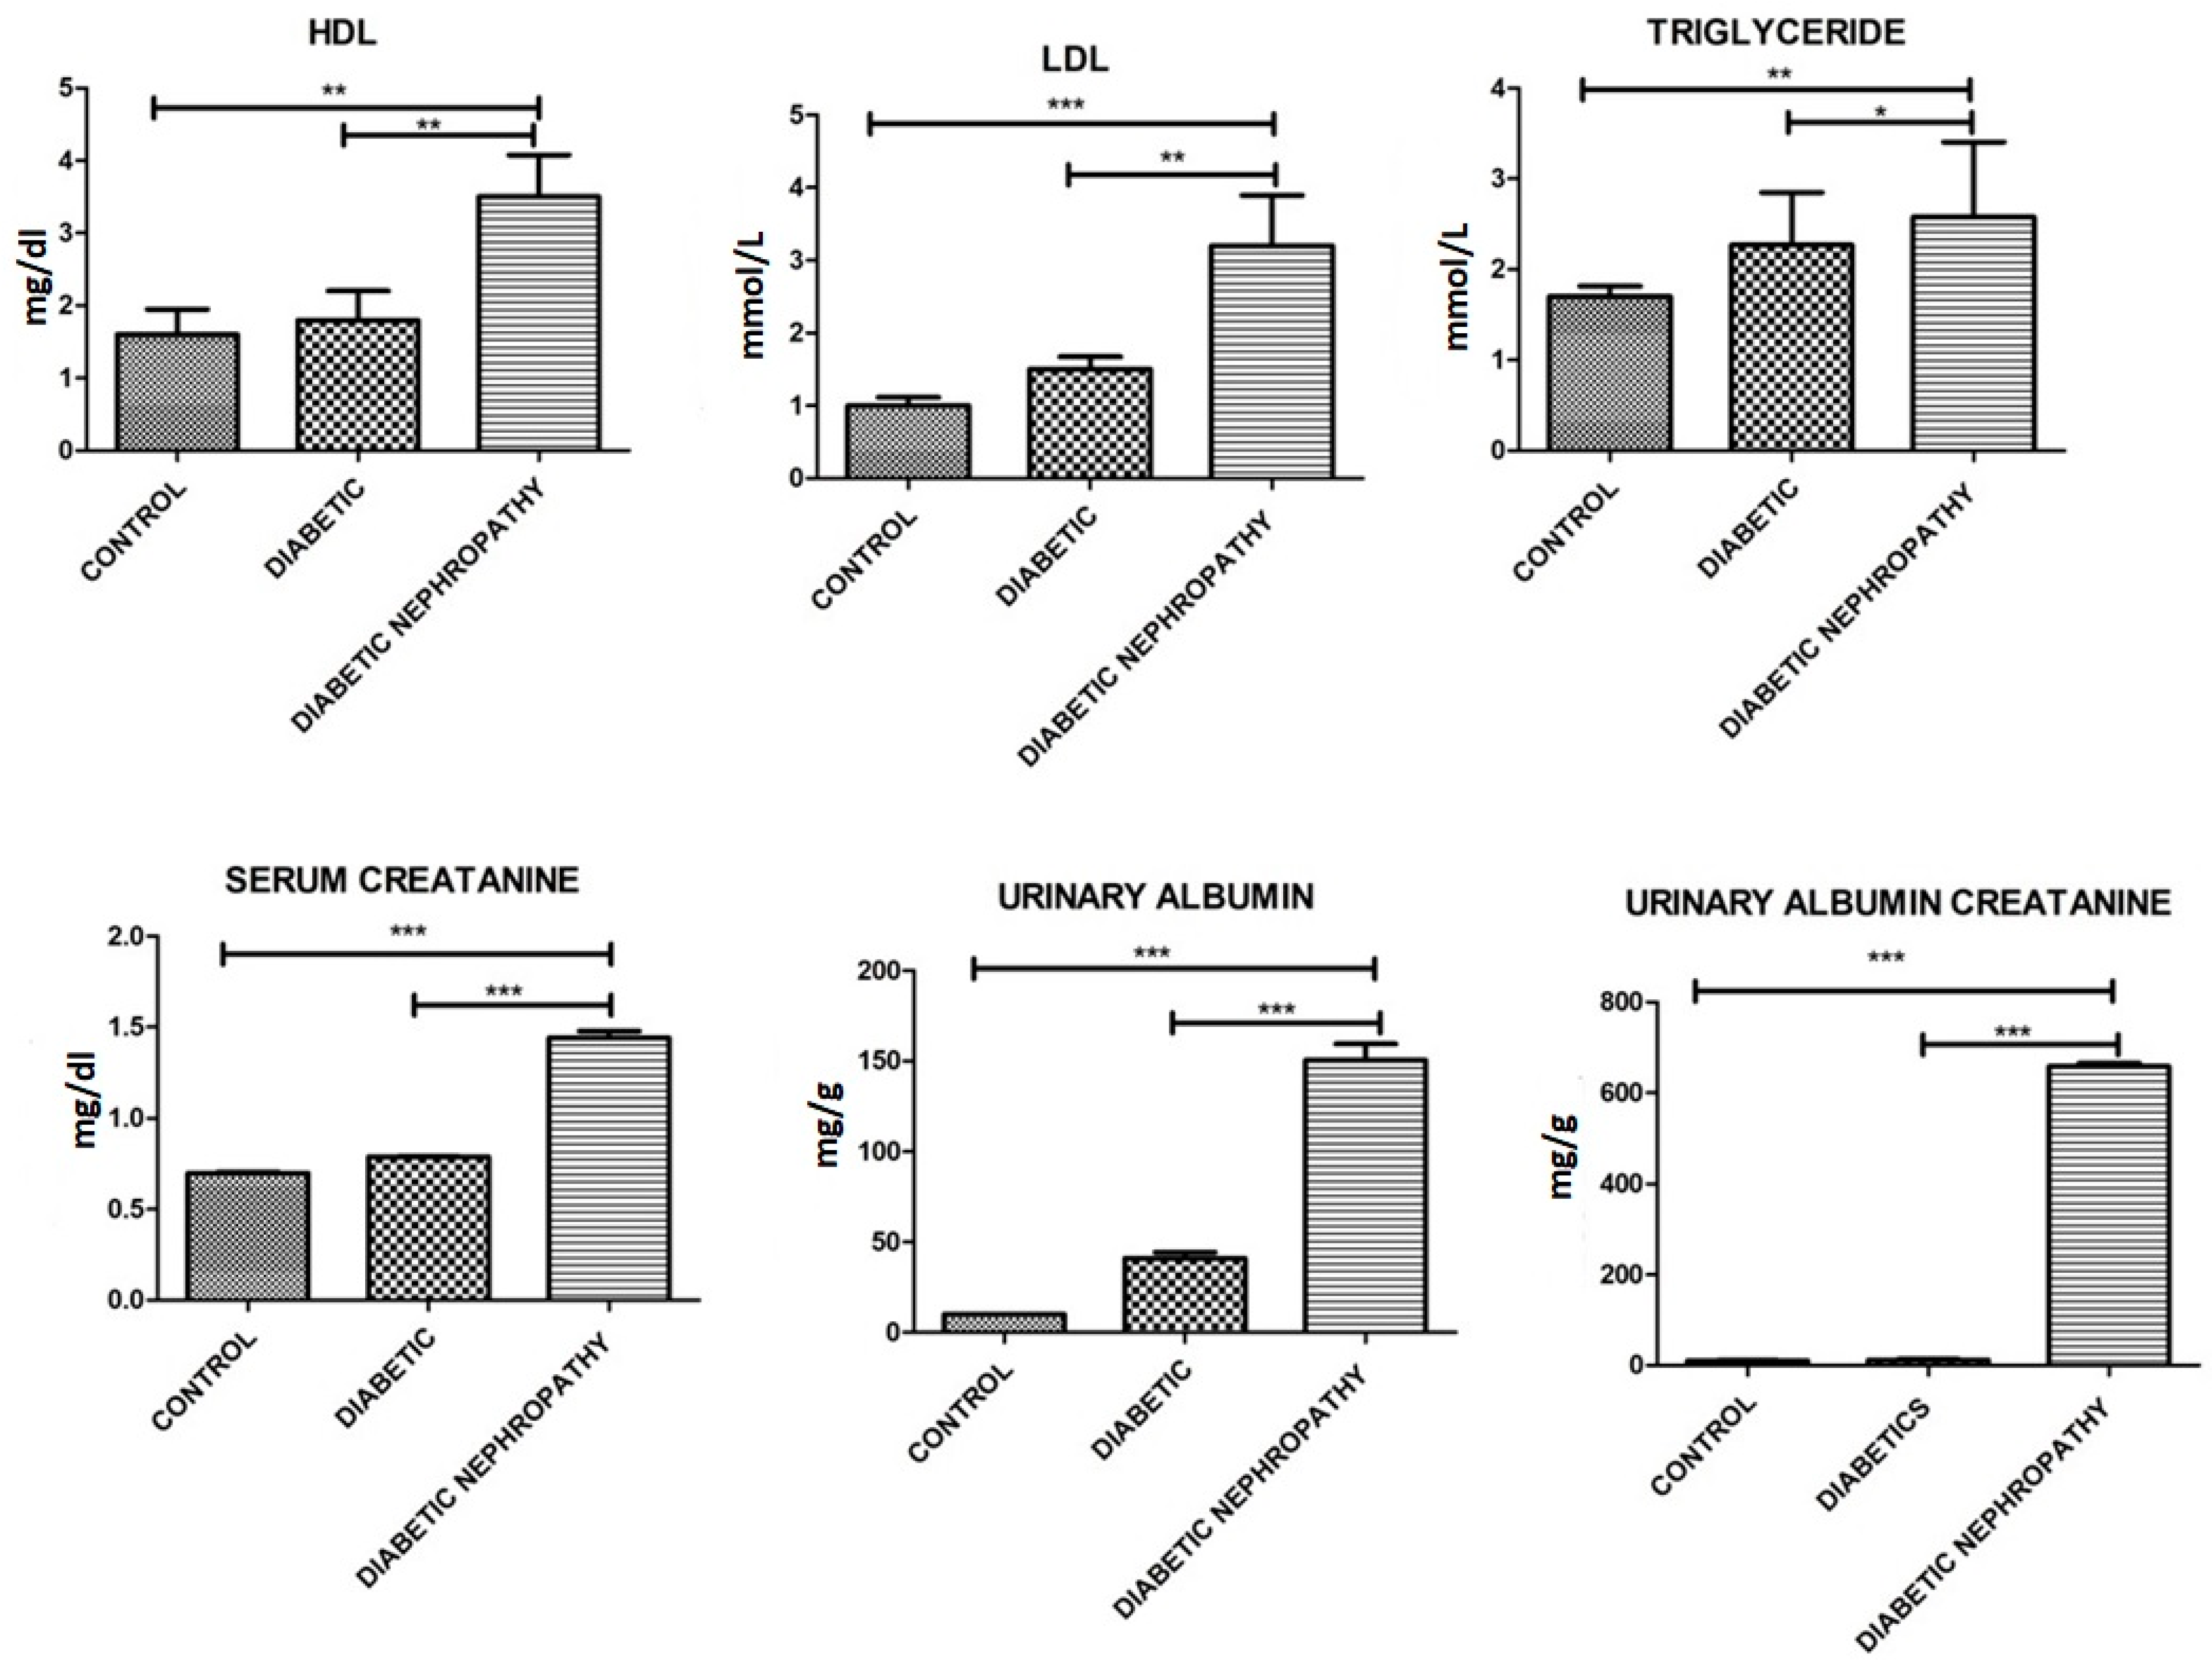
| Urinary albumin-to creatinine ratio (UACR) mg/g | 10.22 ± 1.0 | 11.56 ± 3.58 | 658.26 ± 12.59 | 0.0001 |
| eGFR (mL/min) | 79.65 ± 6.99 | 59.45 ± 6.99 | 41.58 ± 4.78 | 0.01 |
| Triglycerides (mmol/L) | 1.7 ± 0.5 | 2.27 ± 1.0 | 3.2 ± 1.0 | 0.04 |
| LDL (mmol/L) | 1.0 ± 0.3 | 1.5 ± 0.3 | 3.5 ± 0.8 | 0.021 |
| HDL (mmol/L) | 1.6 ± 0.6 | 1.8 ± 0.7 | 3.5 ± 0.5 | 0.02 |
| Serum creatinine (mg/dL) | 0.70 ± 0.01 | 0.789 ± 0.0024 | 1.44 ± 0.065 | 0.001 |
| Urinary Albumin (mg/g Creatinine) | 10.12 ± 0.01 | 41.15 ± 5.56 | 150.35 ± 15.58 | 0.0001 |
| Variable | Control (n = 150) | Diabetics (n = 150) | Diabetic Nephropathy (n = 150) | p-Value |
|---|---|---|---|---|
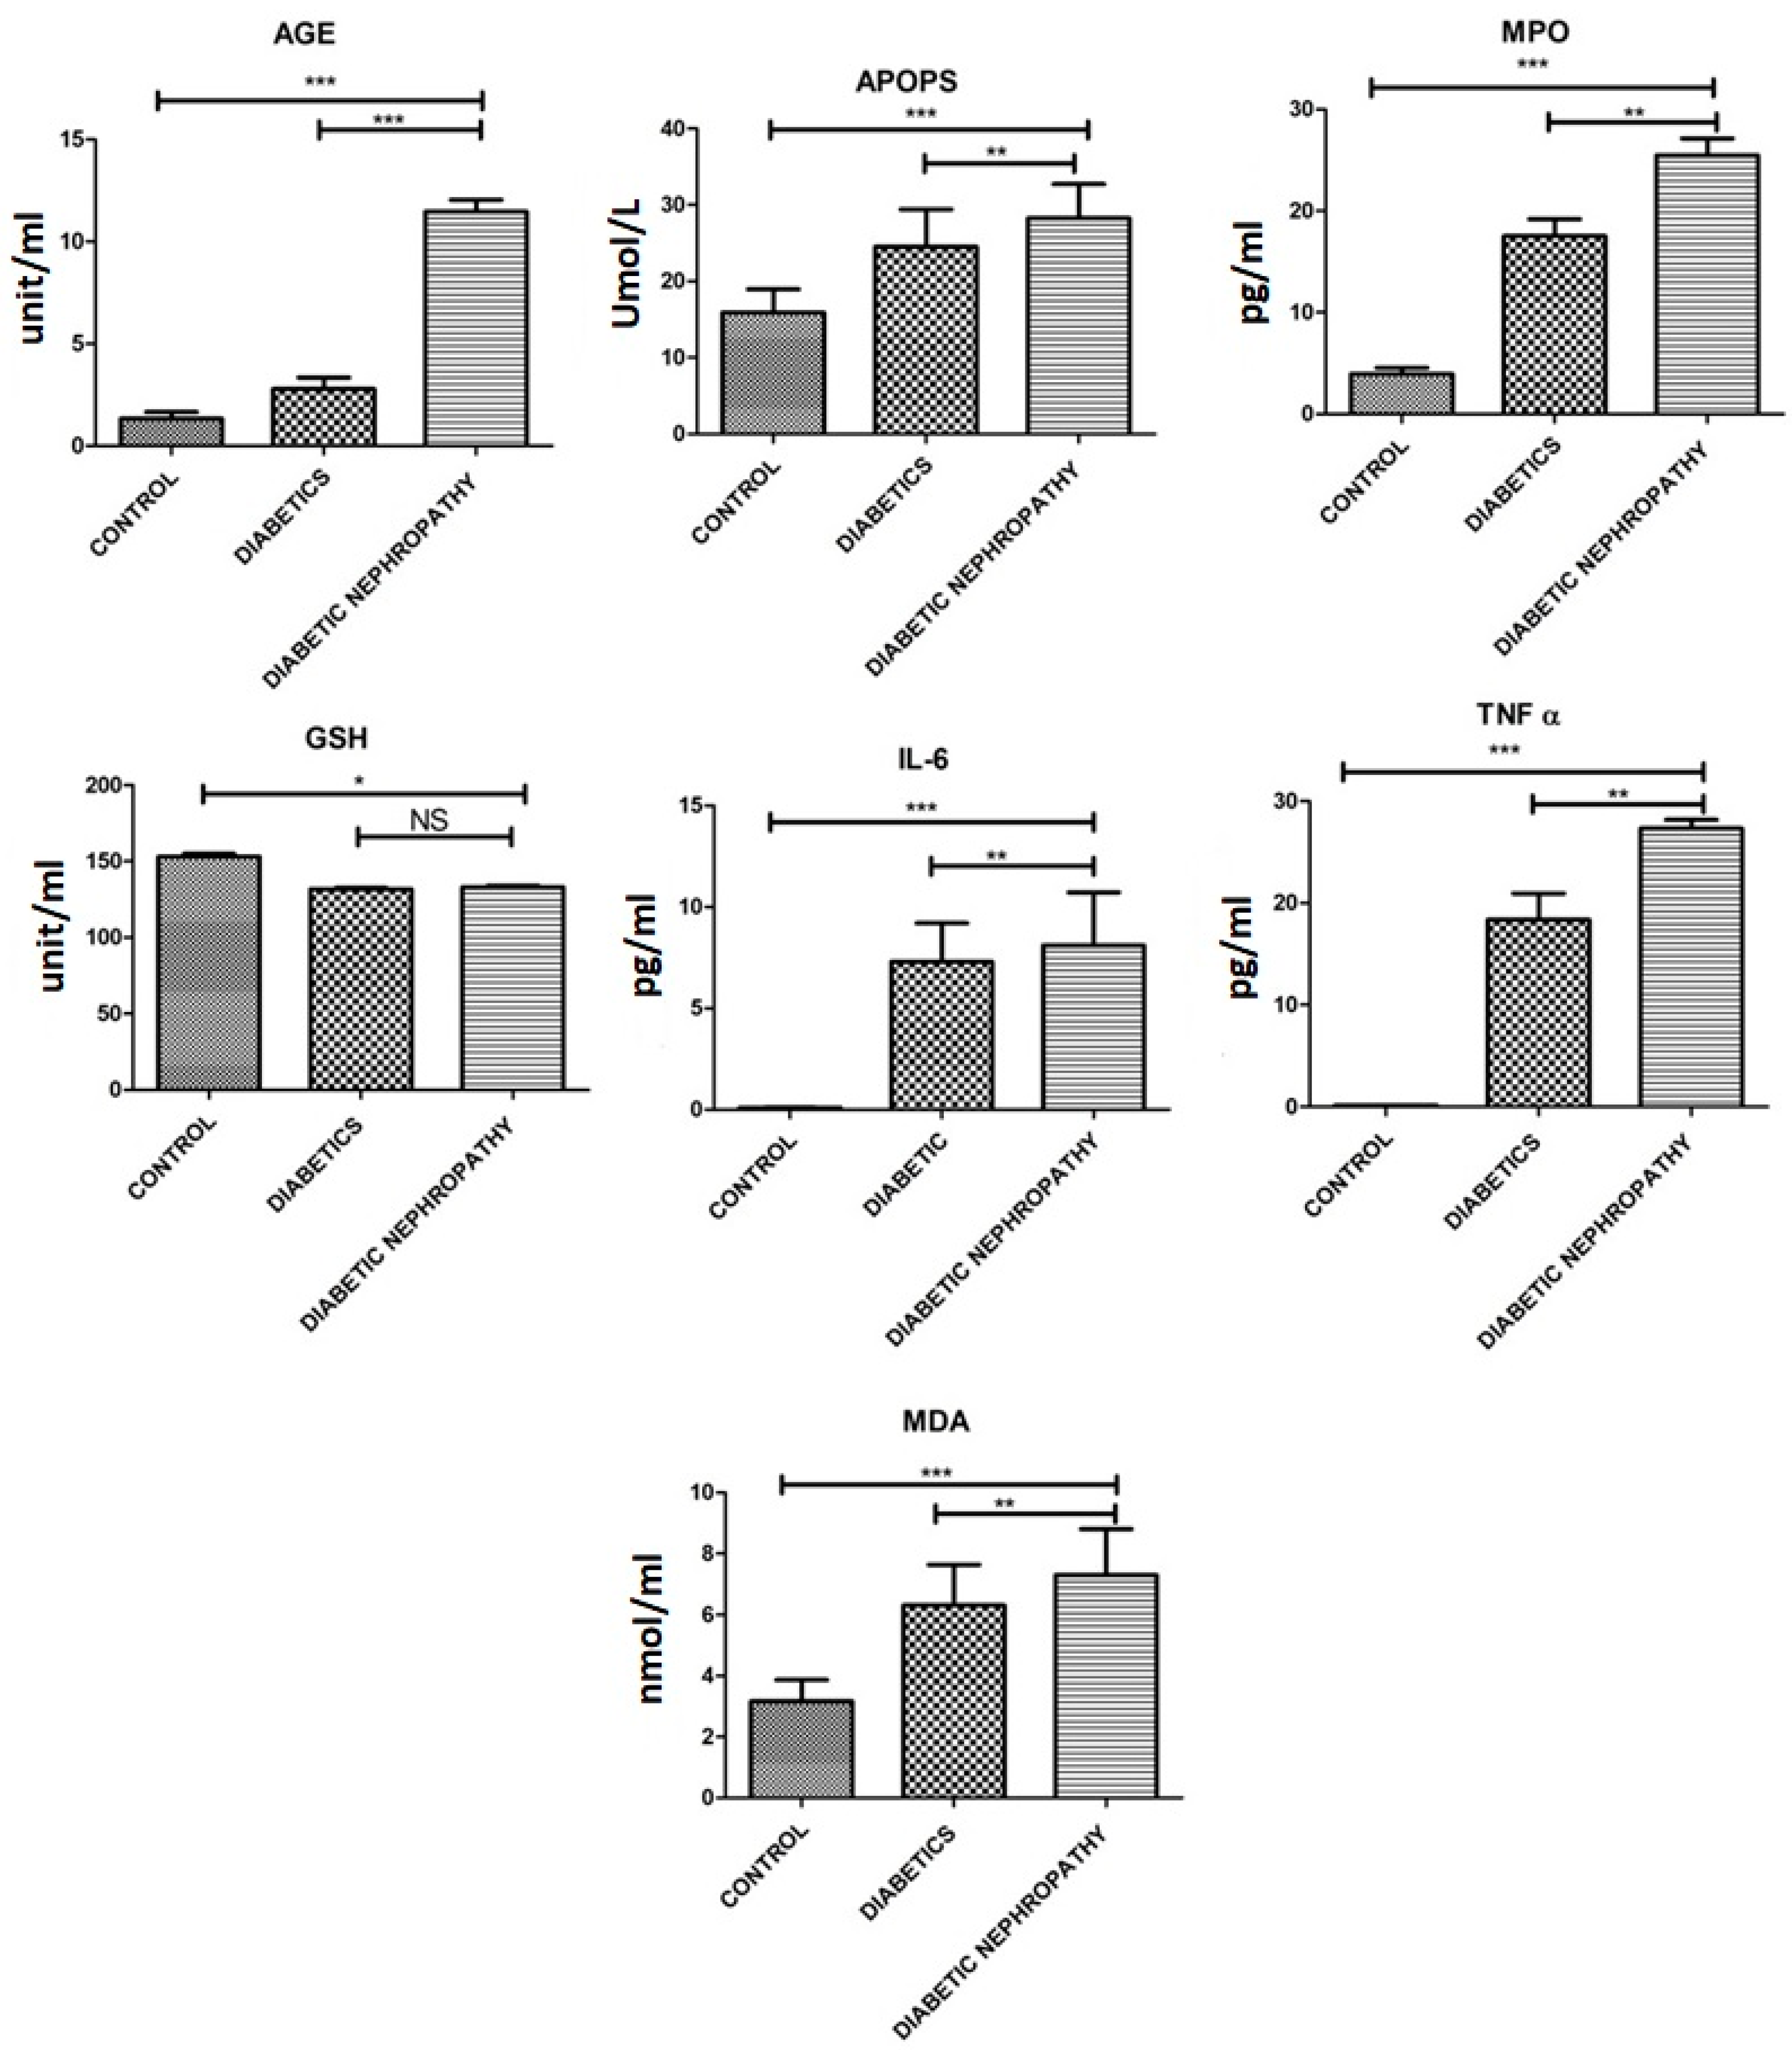
| MDA [nmol/mL] | 3.16 ± 1.21 | 6.30 ± 2.32 | 7.30 ± 2.60 | 0.002 |
| GSH U/mL | 153.13 ± 3.2 | 131.79 ± 1.27 | 133.04 ± 1.68 | 0.014 |
| AOPPs [mmol/L] | 15.90 ± 5.3 | 24.52 ± 8.47 | 28.25 ± 7.73 | 0.0021 |
| AGEs [U/mL] | 1.33 ± 0.57 | 2.78 ± 0.97 | 11.46 ± 0.98 | 0.0001 |
| IL-6 [pg/mL] | 13.57 ± 2.608 | 56.73 ± 10.30 | 110.8 ± 10.30 | 0.0001 |
| TNF-α [pg/mL] | 0.14 ± 0.01 | 18.39 ± 4.44 | 27.34 ± 1.45 | 0.0001 |
| MPO [pg/mL] | 3.54 ± 2.2 | 17.51 ± 2.89 | 25.47 ± 2.87 | 0.0001 |
Publisher’s Note: MDPI stays neutral with regard to jurisdictional claims in published maps and institutional affiliations. |
© 2022 by the authors. Licensee MDPI, Basel, Switzerland. This article is an open access article distributed under the terms and conditions of the Creative Commons Attribution (CC BY) license (https://creativecommons.org/licenses/by/4.0/).
Share and Cite
Mansoor, G.; Tahir, M.; Maqbool, T.; Abbasi, S.Q.; Hadi, F.; Shakoori, T.A.; Akhtar, S.; Rafiq, M.; Ashraf, M.; Ullah, I. Increased Expression of Circulating Stress Markers, Inflammatory Cytokines and Decreased Antioxidant Level in Diabetic Nephropathy. Medicina 2022, 58, 1604. https://doi.org/10.3390/medicina58111604
Mansoor G, Tahir M, Maqbool T, Abbasi SQ, Hadi F, Shakoori TA, Akhtar S, Rafiq M, Ashraf M, Ullah I. Increased Expression of Circulating Stress Markers, Inflammatory Cytokines and Decreased Antioxidant Level in Diabetic Nephropathy. Medicina. 2022; 58(11):1604. https://doi.org/10.3390/medicina58111604
Chicago/Turabian StyleMansoor, Ghazal, Muhammad Tahir, Tahir Maqbool, Sana Qanber Abbasi, Faheem Hadi, Tania Ahmad Shakoori, Shabana Akhtar, Muhammad Rafiq, Muhammad Ashraf, and Inam Ullah. 2022. "Increased Expression of Circulating Stress Markers, Inflammatory Cytokines and Decreased Antioxidant Level in Diabetic Nephropathy" Medicina 58, no. 11: 1604. https://doi.org/10.3390/medicina58111604