1. Introduction
The opportune weaning from the mechanical ventilator (MV) after acute respiratory failure prevents not only the jeopardy of premature weaning and extubation failure but also the risk of ventilator-associated pneumonia, vocal cord injury, tracheomalacia, and post-extubation laryngeal edema after prolonged intubation in the intensive care units (ICU) [
1,
2,
3,
4]. In many hospitals, the MV is initiated with volume-controlled ventilation (VCV) or pressure-controlled ventilation (PCV) modes (full support mode), and the readiness of successful weaning usually is determined with the physician-driven or protocol-based screening of weaning parameters. Many parameters derived from lung mechanics and respiratory patterns have been proposed for the prediction of successful weaning, including airway occlusion pressure 0.1 s (P 0.1), maximal inspiratory pressure (MIP), rapid-shallow breathing index (RSBI), and CROP (dynamic compliance, respiratory rate, oxygenation, maximum inspiratory pressure) index, etc. [
5]. When the weaning parameters are acceptable, MV support may be reduced to partial support modes such as pressure support ventilation (PSV), synchronized intermittent mandatory ventilation, and continuous positive airway pressure ventilation (CPAP). After patients tolerate partial support modes, the international consensus recommended a spontaneous breathing trial (SBT) with T-piece (T-P) breathing or lower levels of pressure support 30 min to determine whether adult critical-ill patients can be successfully extubated [
6].
The factors governing the weaning are multifactorial and interactional. Clinicians may be not able to notice the multidimensional factors effectively and initiate the weaning screening efficiently. Most of the weaning parameters require manual measurements with disconnecting the MV which increases the workload and risk of the air-born infection to therapists. And a single weaning parameter rarely provides sufficient accuracy to predict weaning outcomes [
7]. Computer-aid decision-making systems may avoid human error and delay. Recent machine learning techniques are considered for timely and reliable weaning prediction. In predicting successful extubation in mechanically ventilated patients with the Artificial Neural Network (ANN), the area under the receiver operating characteristic curves (AUROC) was better than the traditional weaning parameter RSBI (0.83 vs. 0.66) [
8]. In a recent review, there were only five research applying machine learning techniques in predicting successful weaning, and all training sets were small (8~179 patients). The model parameters were selected from demographics, vital signs, and ventilator data [
9]. However, nonpulmonary factors such as serum hemoglobin and creatinine may also affect the outcome of MV weaning [
10,
11,
12]. There was no study focused on predicting successful ventilator mode shifting from full support mode, partial support mode, and SBT.
The readiness of MV weaning was assessed daily by the ICU physicians and respiratory therapists in our hospital. The weaning parameters (tidal volume, maximal inspiratory/expiratory pressure, and RSBI) were screened before mode shifting. To improve our weaning process, we hypothesized that prediction models using machine learning techniques with parameters from the MV and nonpulmonary parameters could provide better predictions of successful ventilator mode shifting than traditional weaning parameters.
2. Materials and Methods
2.1. Study Subjects
This study was a retrospective analysis using data mining and supervised machine-learning methods based on a large electric database. The study protocol was approved by the Institutional Review Board of the MacKay Memorial Hospital (18MMHIS063e, approval on 30 July 2018).
2.1.1. Data Source
Mackay Memorial hospital is a tertiary medical center with 120 ICU beds. The data of clinical diagnoses, age, gender, vital signs, laboratory data, arterial blood gas, vital signs, patients’ diagnoses, demographics, and prescribed medications were stored in the electronic medical records (EMRs) system. The MV setting and monitoring parameters were recorded and uploaded automatically by the Vital Info Portal Gateway (Maya International Company, Ltd., Taipei, Taiwan) per hour. The data of EMR and MV from three medical ICU (39 beds) between April 2015 and October 2017 were analyzed retrospectively.
2.1.2. Participants
Patients older than 19 years old who required invasive mechanical ventilator support in the ICU were included. Exclusion criteria included patients who expired during the ICU course or were readmitted to the ICUs within 14 days because critically ill patients may have few attempts of MV weaning. Eventually, 1483 patients were enrolled, and the data were analyzed from the first day of ICU admission.
In our cohort, the readiness of MV weaning was assessed daily by the ICU physicians and respiratory therapists. The weaning parameters (tidal volume, maximal inspiratory/expiratory pressure, and RSBI) were screened before SBT. The MV setting and measurement data were captured, stored, and uploaded automatically by Vital Info Portal Gateway per hour. The MV alarm and setting changes were recorded and uploaded immediately into the database.
2.2. Predicting Models
Outcomes
In the retrospective dataset, weaning of MV mostly was conducted through a sequence of full-support MV mode shifting. The primary outcomes were successful events of the MV mode shifting. Full support modes comprised of VCV and PCV. Partial support modes included PSV and CPAP. A successful shifting from full support to partial support mode was defined arbitrarily as a PSV or CPAP followed by a T-P trial regardless of the duration and pressure levels of PSV. The unsuccessful shift was defined when the PSV/CPAP trial was not followed by a T-P trial (meaning shifting back to full-support mode).
A T-P trial of 30–120 min can predict 75.9% of patients who remain extubated for 48 h [
13]. Therefore, a successful shifting from partial support mode to T-P was defined as T-P duration longer than 2 h in the study. An unsuccessful shift meant the T-P switching back to a full-support mode in less than 2 h.
2.3. Candidate Predictors
The candidate predictors for MV weaning were classified into five categories: demographic data, arterial blood gas, laboratory data, vital sign, and ventilator information.
Table 1 lists the potential predictors during ICU admission and the range for discarded outliers.
Several predictors within a specific time window were further derived statistically, including average, variance, median, slope, coefficient of variation (CV). The Slope was calculated from the fitted simple line regression. All derivatives were named with the following rule: PredictorName_Statistics_TimeWindow.
2.4. Missing Data
For values missing at random in the dataset, the index (NA indicator) was designed to calculate whether the data were recorded or not within the time window.
2.5. Data Mining
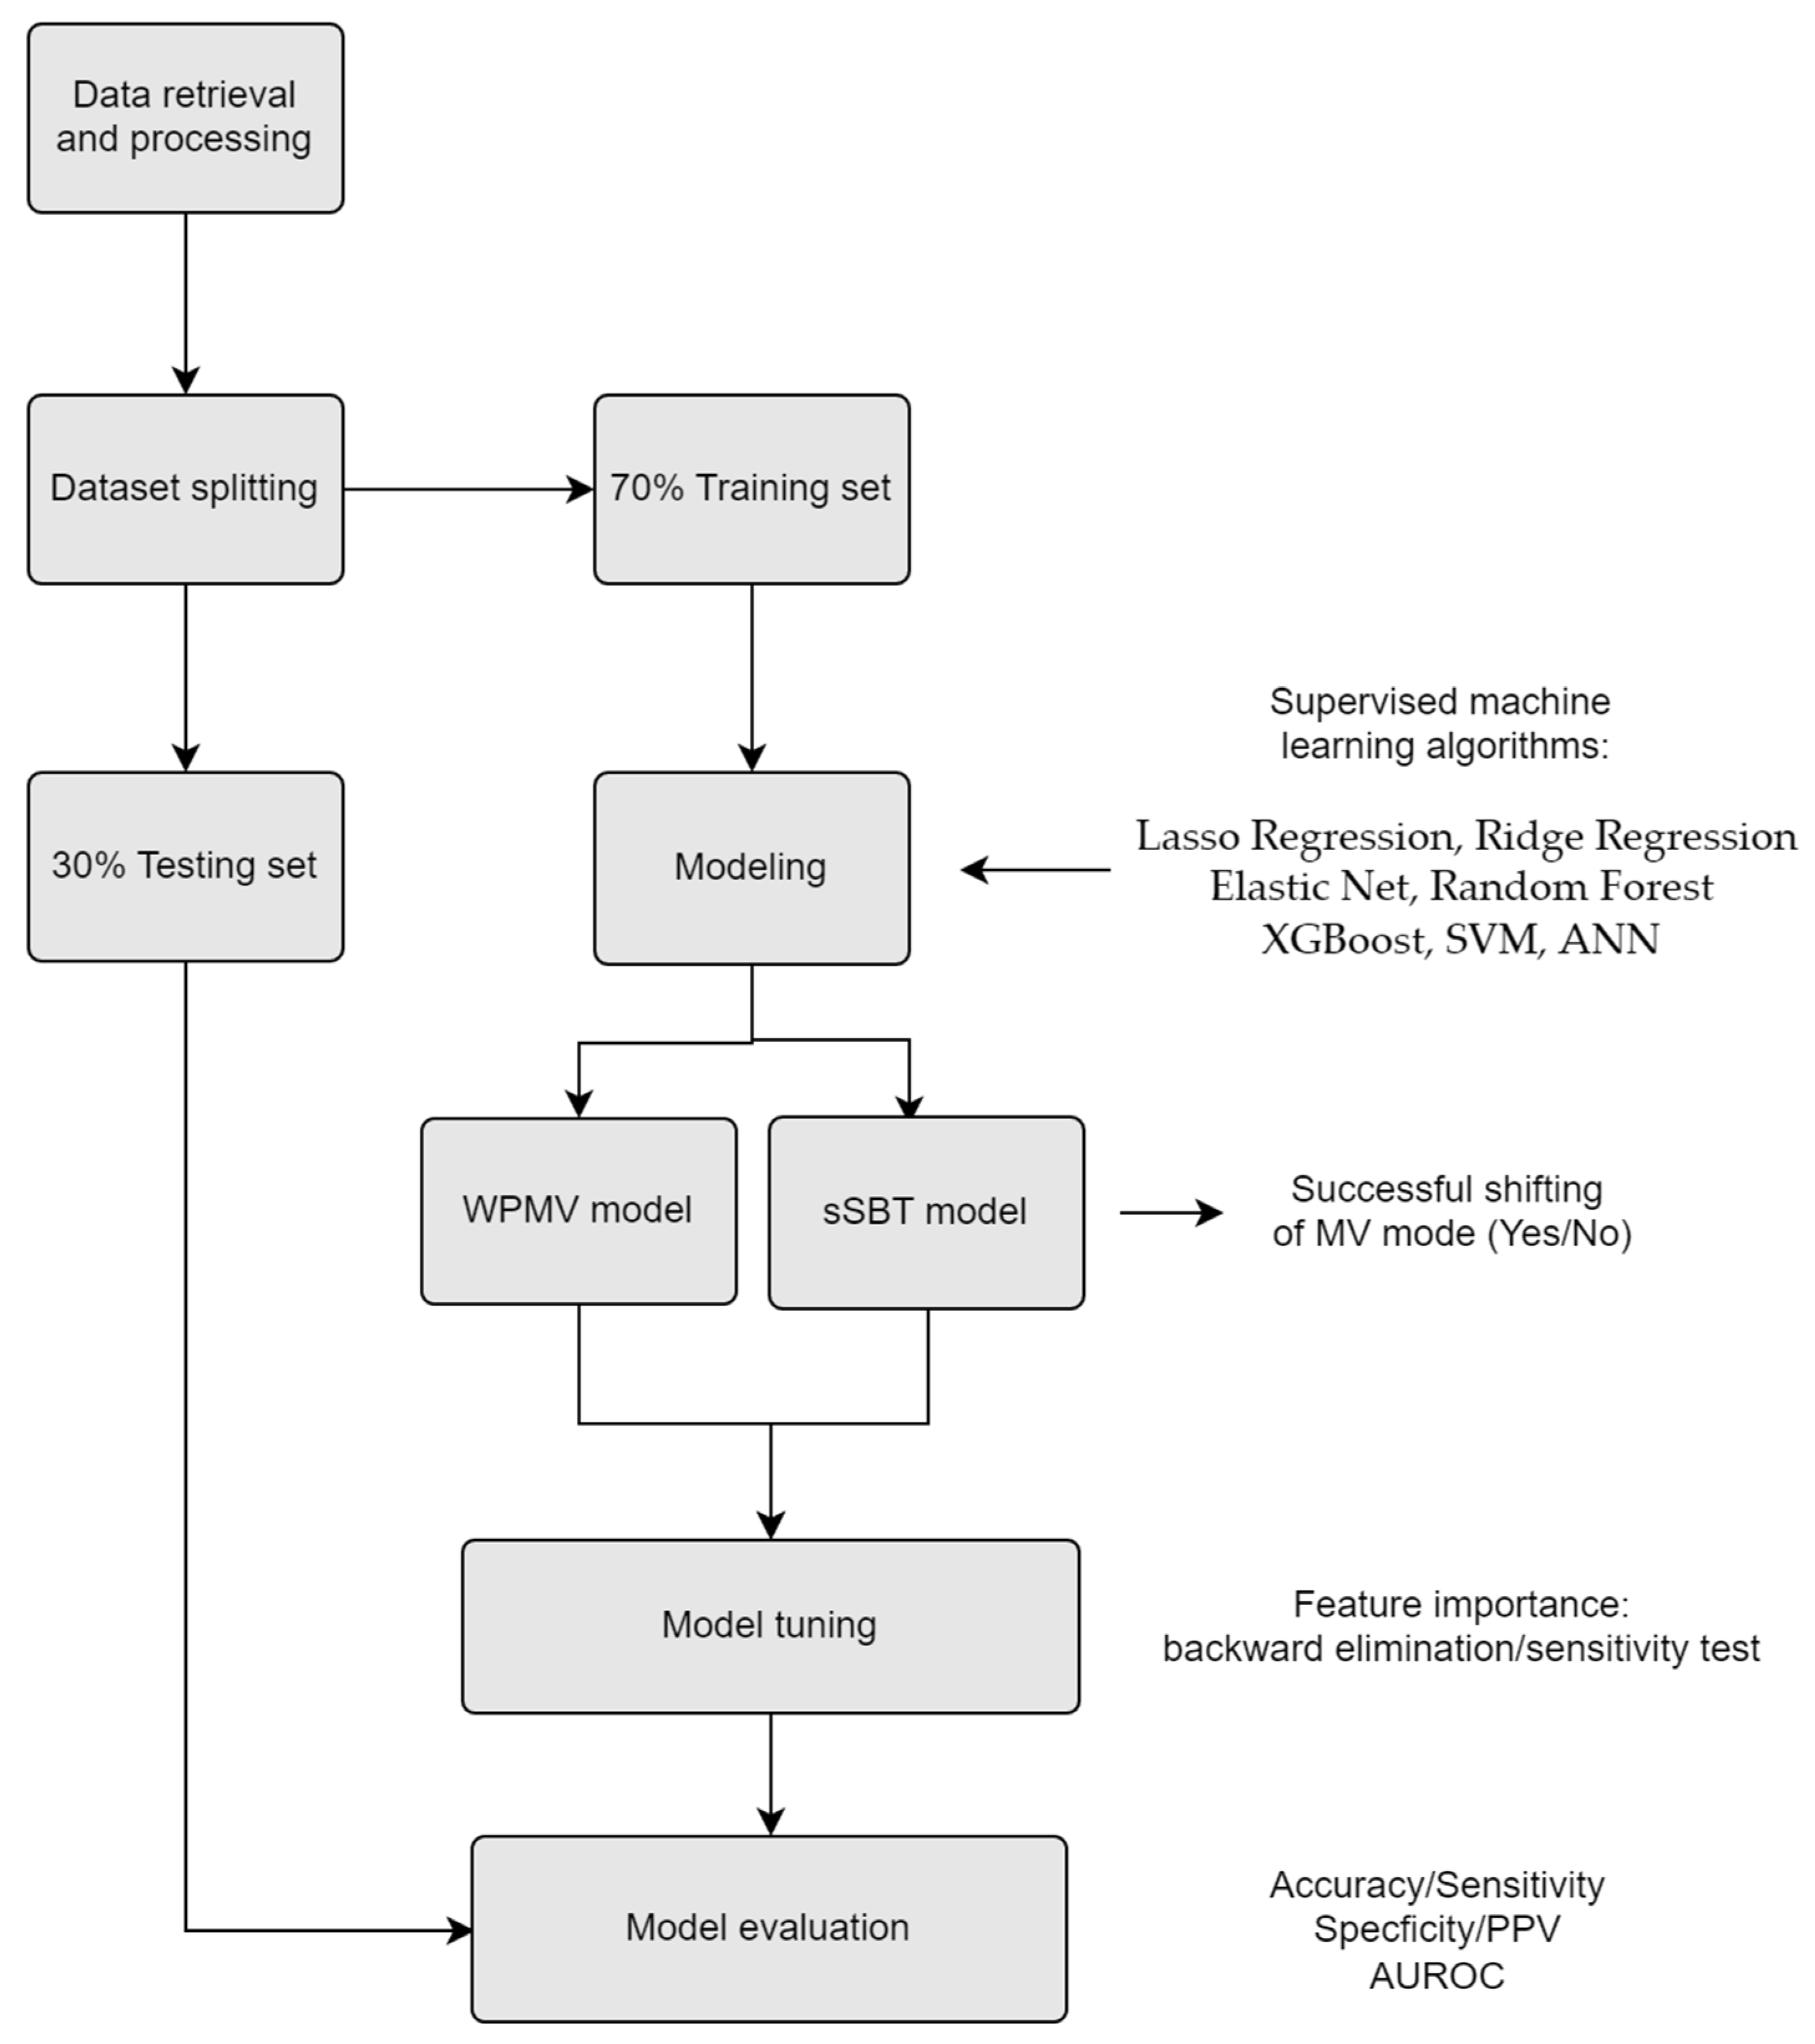
The training sets randomly selected from 70% of the cleaned dataset were used to train the prediction model, and the residual 30% of the cleaned dataset was used to evaluate the performance of the prediction model.
2.6. Modeling
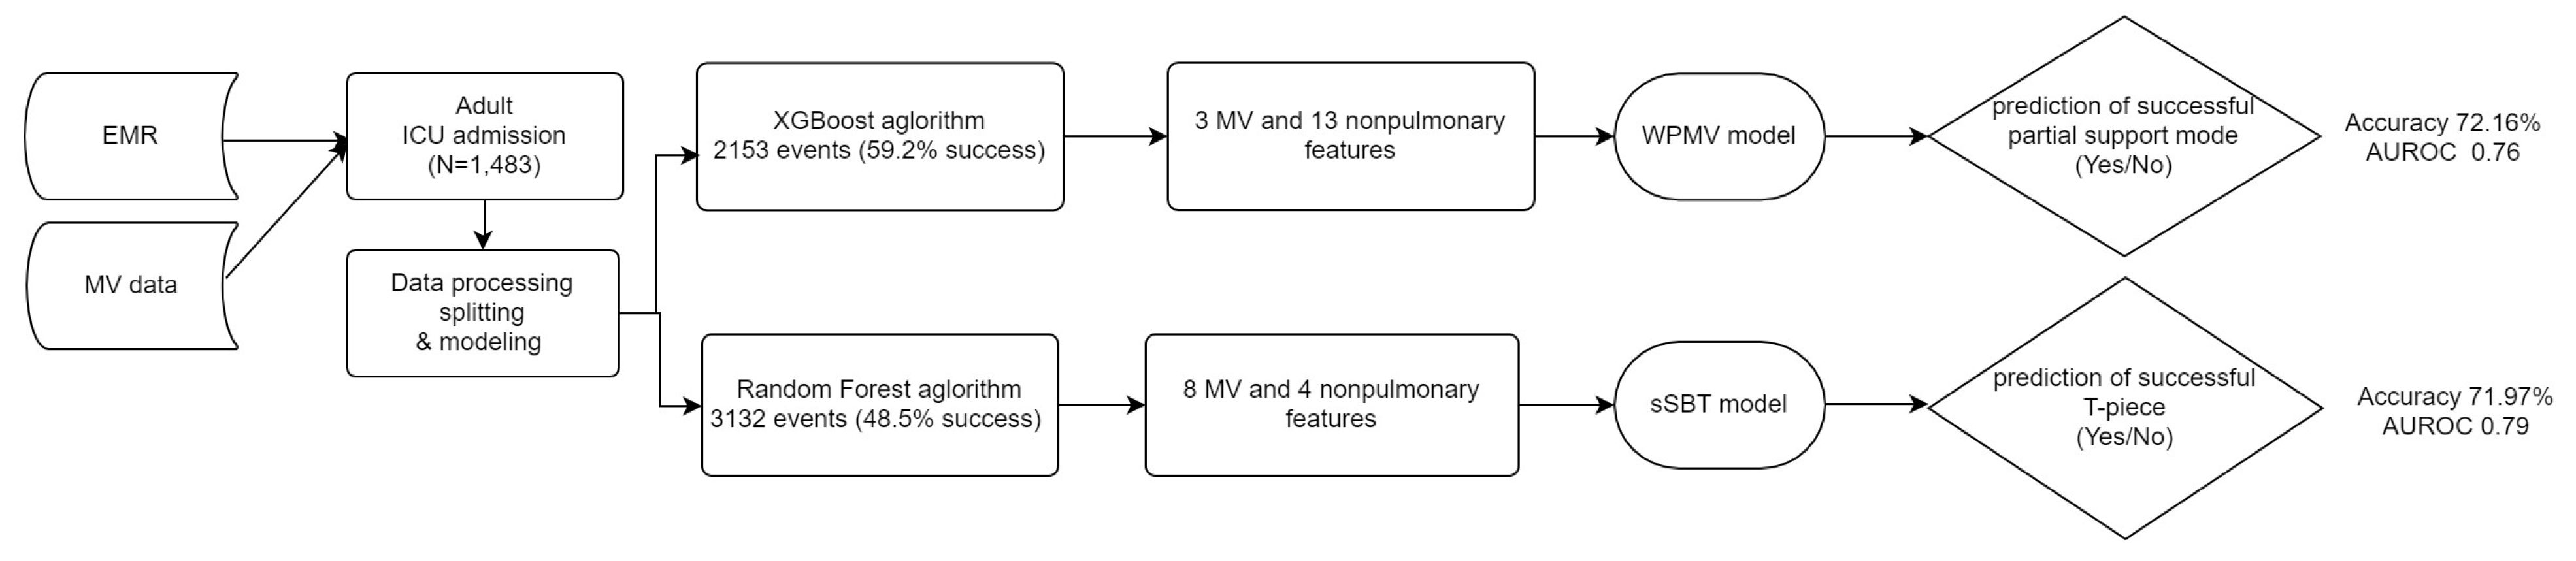
The first model (weaning probability of mandatory ventilation, WPMV) was built to predict successful shifting from full-support to partial-support modes. The second model (successful SBT, sSBT) was built to predict the shifting from partial-support mode to successful T-P trials.
We tried several classification algorithms to fit the models, including Lasso Regression, Ridge Regression, Elastic Net, Random Forest, Extreme Gradient Boosting (XGBoost), Support Vector Machine (SVM), and Artificial Neural Network (ANN).
Feature selection is an essential procedure in building a machine learning classifier. We selected the features in three steps. First, a t-test was used to choose significant predictors from candidate predictors. Second, variable importance was measured in XGBoost and Random Forest by information gain and mean decrease in Gini separately. Then the top 30 predictors were extracted. Third, combining the two subsets of candidate predictors, we utilized backward elimination to delete predictors that perform worse.
The performance of binary classification models was determined by drawing the receiver operating characteristic (ROC) curves and analyzing the indicators of the confusion matrix. The algorithm with had the largest area under the ROC (AUROC) would be chosen for the final model.
All analyses were carried out in R software version 3.4.1 (R Core Team, Vienna, Austria) with XGboost and random Forest packages. The workflow of the analysis is illustrated in
Figure 1.
3. Results
3.1. Participants and Outcomes
A total of 1483 patients were enrolled, and the data were analyzed from the first day of ICU admission. The dataset came from elderly patients (mean age 66.9 years old) with multiple comorbidities, and infection was the most frequent etiology of their acute respiratory failure (39.8%). The successful rate of weaning from MV for more than 5 days was 77% in the cohort. The demographic characteristics of the enrolled patients are outlined in
Table 2.
For the WPMV prediction model, a total of 2153 events of full-support shifting to partial-support mode were randomly assigned to the training set (n = 1510) and test set (n = 643). The 1275 events (59.2%) were found successful.
For the sSBT model, there were 3132 events of partial mode shifting to T-P randomly assigned to the training set (n = 2201) and test set (n = 931). A total of 1520 successful events (48.5%) with T-P longer than 2 h were found.
3.2. Model Performance
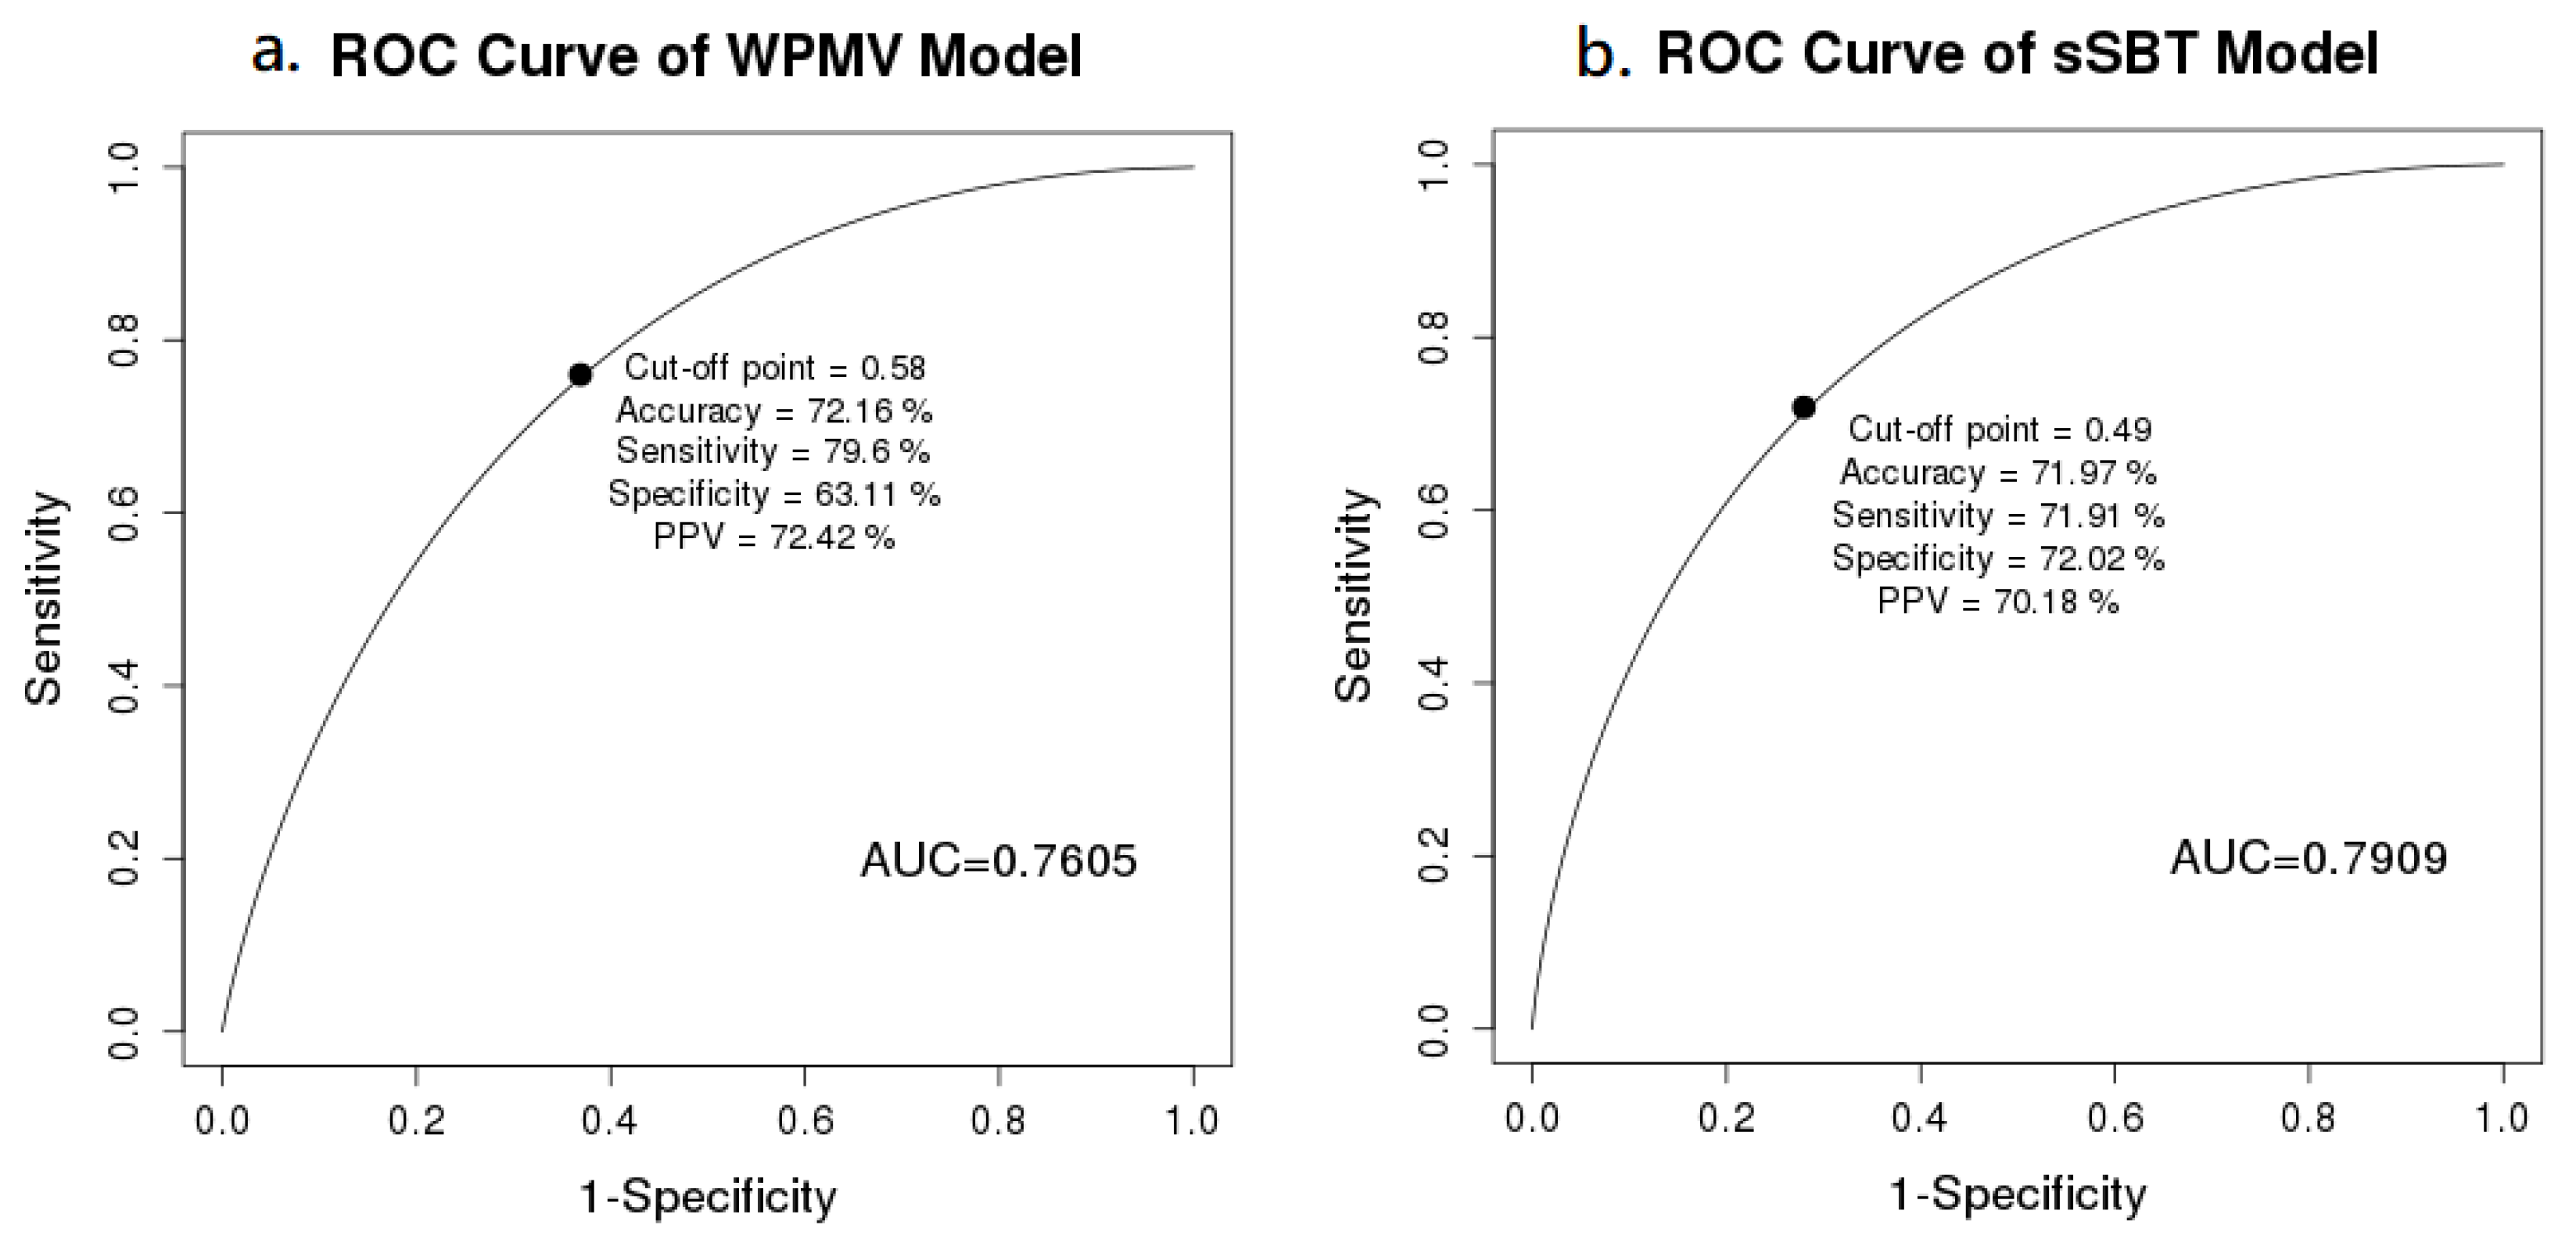
The performances of the binary classification models were determined by the ROC and confusion matrix (
Figure 2). The XGBoost algorithm had the largest AUROC 0.76 applied for WPMV, and Random Forest with the largest AUROC 0.79 was chosen for sSBT model. The AUROC of the WPMV model and the sSBT model were 0.76 and 0.79, respectively. At the cut-off value of 0.58 for best accuracy, the WPMV model had the sensitivity 79.6%, specificity 63.1%, and accuracy 72.2%. The sSBT model had the best accuracy (80%) at cut-off value of 0.49 (sensitivity 71.9%, specificity 72%).
3.3. Predictor Importance
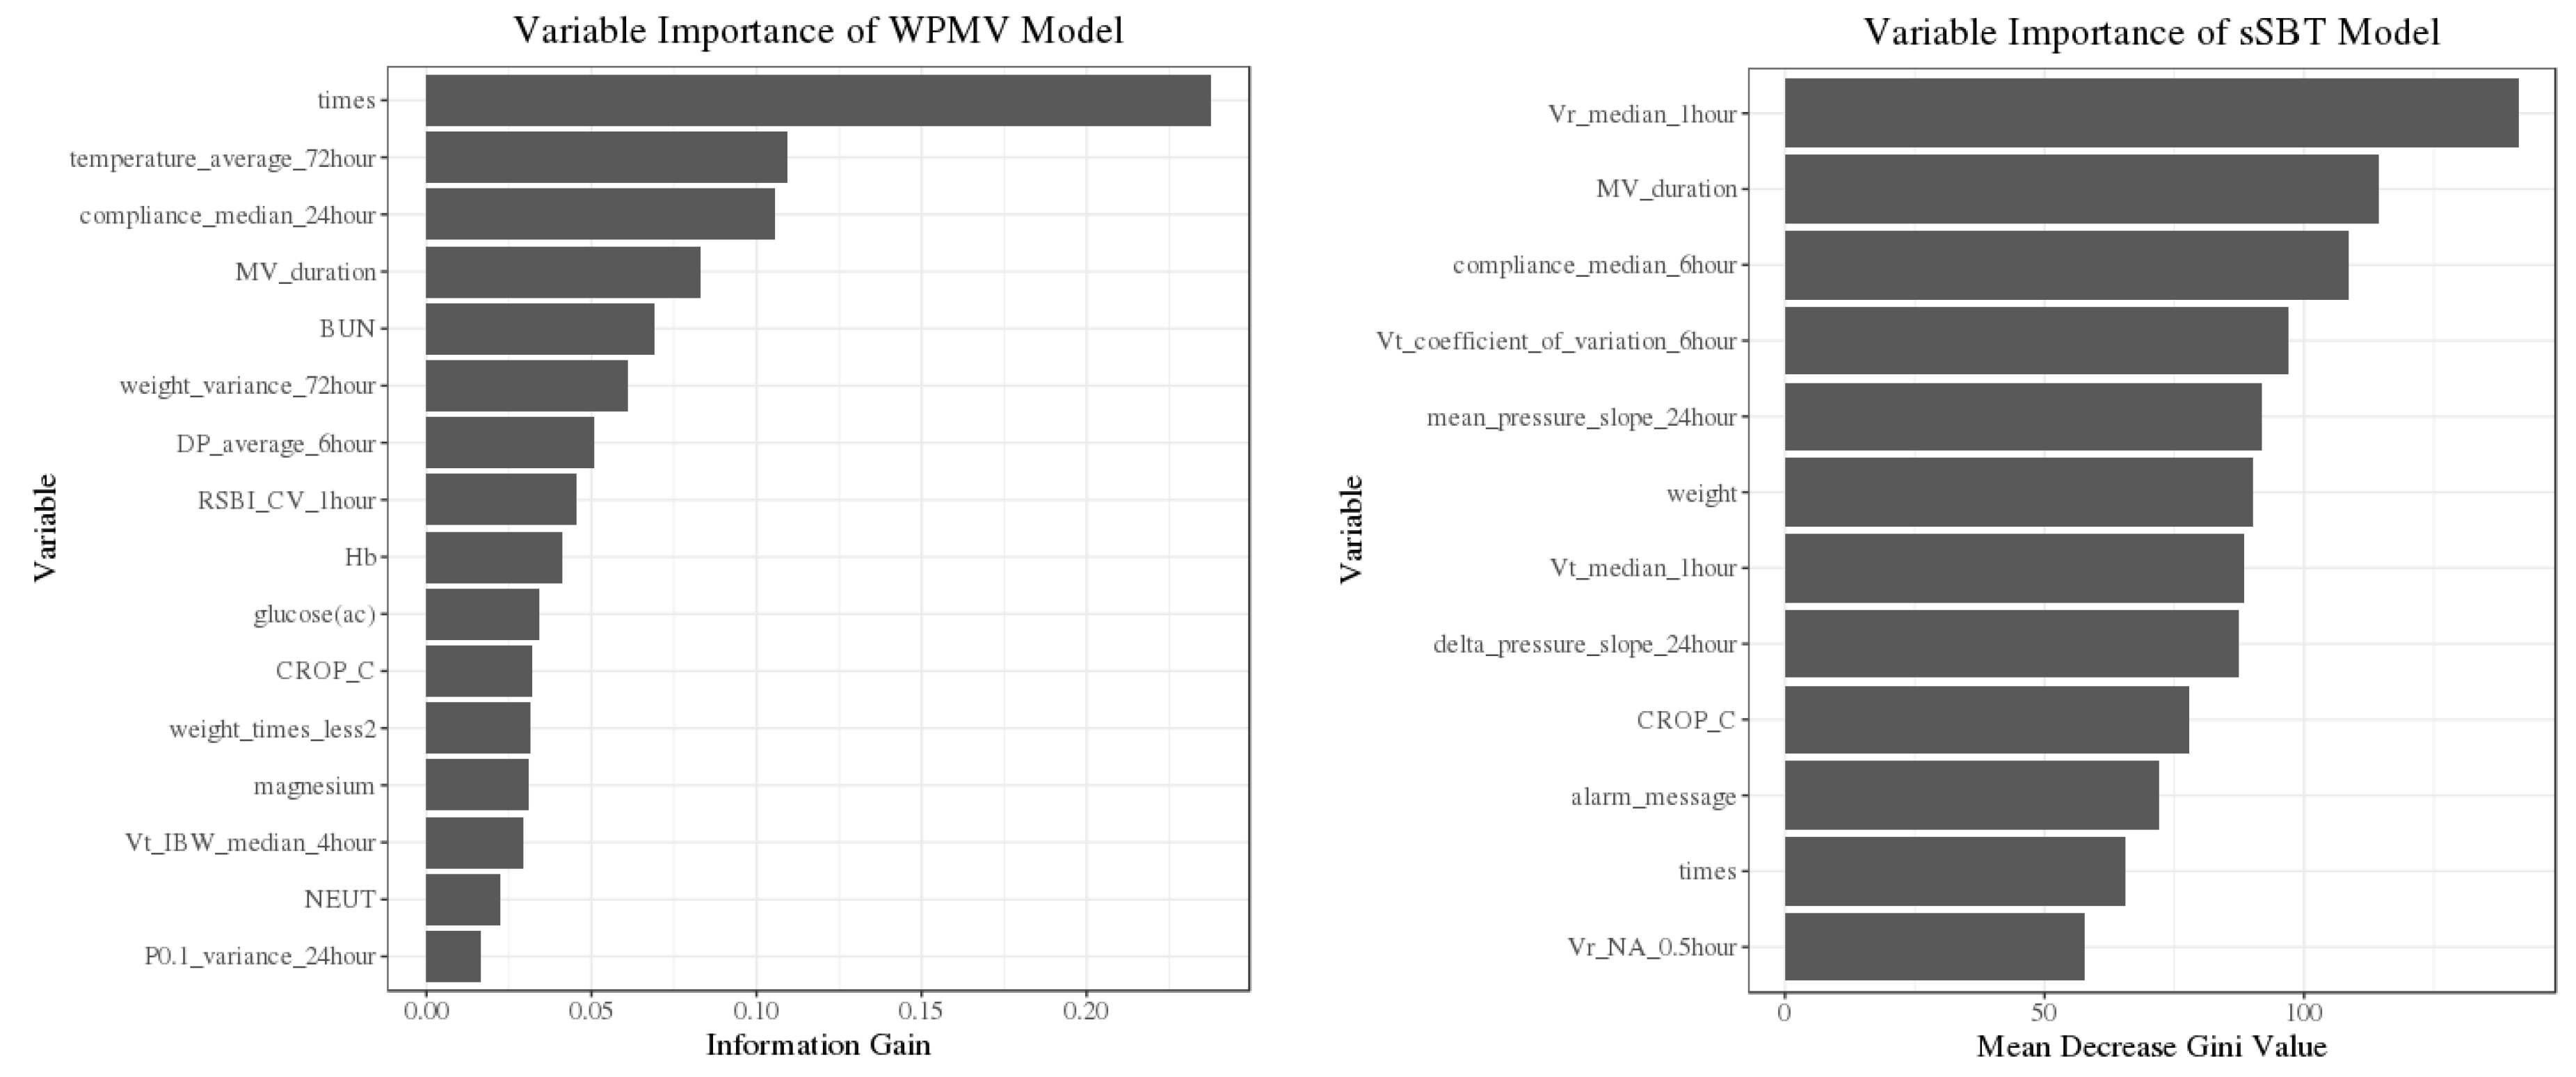
The importance of predictors was shown from high to low importance according to the information gain (WPMV model) and mean decrease Gini (sSBT model) in
Figure 3. The characters of selected features in successful and unsuccessful events were outlined in
Table 3. Several predictors have no significant difference between successful and unsuccessful events. However, the insignificant predictors still provide important scores in XGBoost and Random Forest. When insignificant predictors were removed from the models, the AUROC of the WPMV and sSBT models were reduced to 0.73 and 0.77.
Among the 16 selected predictors in the WPMV model (3 MV and 13 nonpulmonary parameters), many of them related to clinical conditions e.g., body temperature, body weight, blood urea nitrogen, hemoglobin, and the ratio of neutrophils. The average body temperature in the previous 72 h was the most important nonpulmonary feature. In the sSBT model, 12 predictors were chosen (8 MV and four nonpulmonary parameters), and the most important one was “vr_median_1hour” which indicated the median of ventilation rates within 1 h. The many of selected features highlighted that the trend of respiratory mechanics over a specific time window had greater predictive value than at a single time point, e.g., “median of compliances with 6 h”, “median of tidal volumes within 1 h”, and” slope of mean airway pressure within 24 h”.
For sensitivity analysis, the predictors in
Table 3 were divided into two groups: ventilator (MV) and non-ventilator (nonpulmonary). When non-MV predictors were removed, the AUROC of the WPMV and sSBT models was reduced to 0.66 and 0.76. On the other hand, the AUROC of the WPMV and sSBT models were 0.74 and 0.65 if the MV predictors were removed from the models. The results indicated that non-MV predictors were more dominant than MV predictors in the WPMV, while MV predictors were more important than non-MV predictors in the sSBT model.
The 1275 events (59.2%) were found successful in the 2153 events of full-support shifting to partial-support mode in the WPMV model. For the sSBT model, 1520 successful events (48.5%) were found in the 3132 partial-support shifting to T-P. The XGBoost and Random Forest were found to have the largest AUROC and chosen for the WPMV and sSBT model accordingly.
XGBoost and Random Forest can measure the importance of features by information gain and mean decrease in Gini separately.
Table 3 lists the selected predictors in ranking from high to low importance according to the information gain (WPMV model) and mean decrease Gini (sSBT model). Among the 16 selected predictors in the WPMV model (three ventilatory and 13 clinical parameters), the number of transitions events from full to partial-support mode during weaning was the most important predictor. In the sSBT model, 12 predictors were chosen (eight ventilatory and four clinical parameters), and the most important one was “vr_median_1hour” which indicated the median of ventilation rate within 1 h.
4. Discussion
With the integration of machine learning algorithms and variables from the MV and EMRs, our prediction models (WPMV and sSBT) showed acceptable discrimination for predicting successful MV mode shifting. By sSBT model, the performance in predicting of discontinuing MV support is better than traditional parameter RSBI, where AUROC was 0.69 in a previous review article [
14].
The strength of our prediction models includes the large number of participants and the hourly data input from MV. Therefore, we could find that the novel predictor “median of ventilation rate within 1 h” is the most important feature in sSBT model. In previous studies, the AUROC of an Artificial Neural Network (ANN) model was 0.83 for predicting successful weaning and extubation [
8] and 0.942 for difficult weaning [
15]. For predicting successful SBT, the accuracy was 81–86.7% by Support Vector Machine (SVM) [
16,
17]. However, all the models need parameters of the respiratory pattern in 30-min SBT. The models cannot help the early initiation of MV mode shifting before SBT. Our dataset was larger than the previous study used with ANN and SVM. Our models were trained with time-series variables from MV and EMR since the first day of ICU admission. Thus, it may be feasible to continuously predict successful MV mode shifting when a platform would be built with our models to process real-time variables from MV and EMRs simultaneously.
The most common processes of weaning were conducted by T-P following PSV, and the practice may be different from other hospitals. However, our studied population and weaning outcomes were comparable to a recent study [
18]. The success rate of the first SBT in our cohort was 75%, which was similar to the previous report (79% in J-M. Boles et al.) [
6]. Thus, the performance of the weaning protocol in our hospital was comparable to other institutions.
Compared with traditional algorithms such as linear regression, XGBoost, and Random Forest, they are more reliable in discovering non-linear relationships from our data [
19,
20], and can measure the importance of features. Among the nonpulmonary parameters in the WPMV model, blood urea nitrogen, hemoglobin, and fluid balance have contributions consistent with previous reports [
21,
22,
23]. The glucose, magnesium level, and average diastolic blood pressure are first reported, and their clinical significances in the weaning process need further investigation.
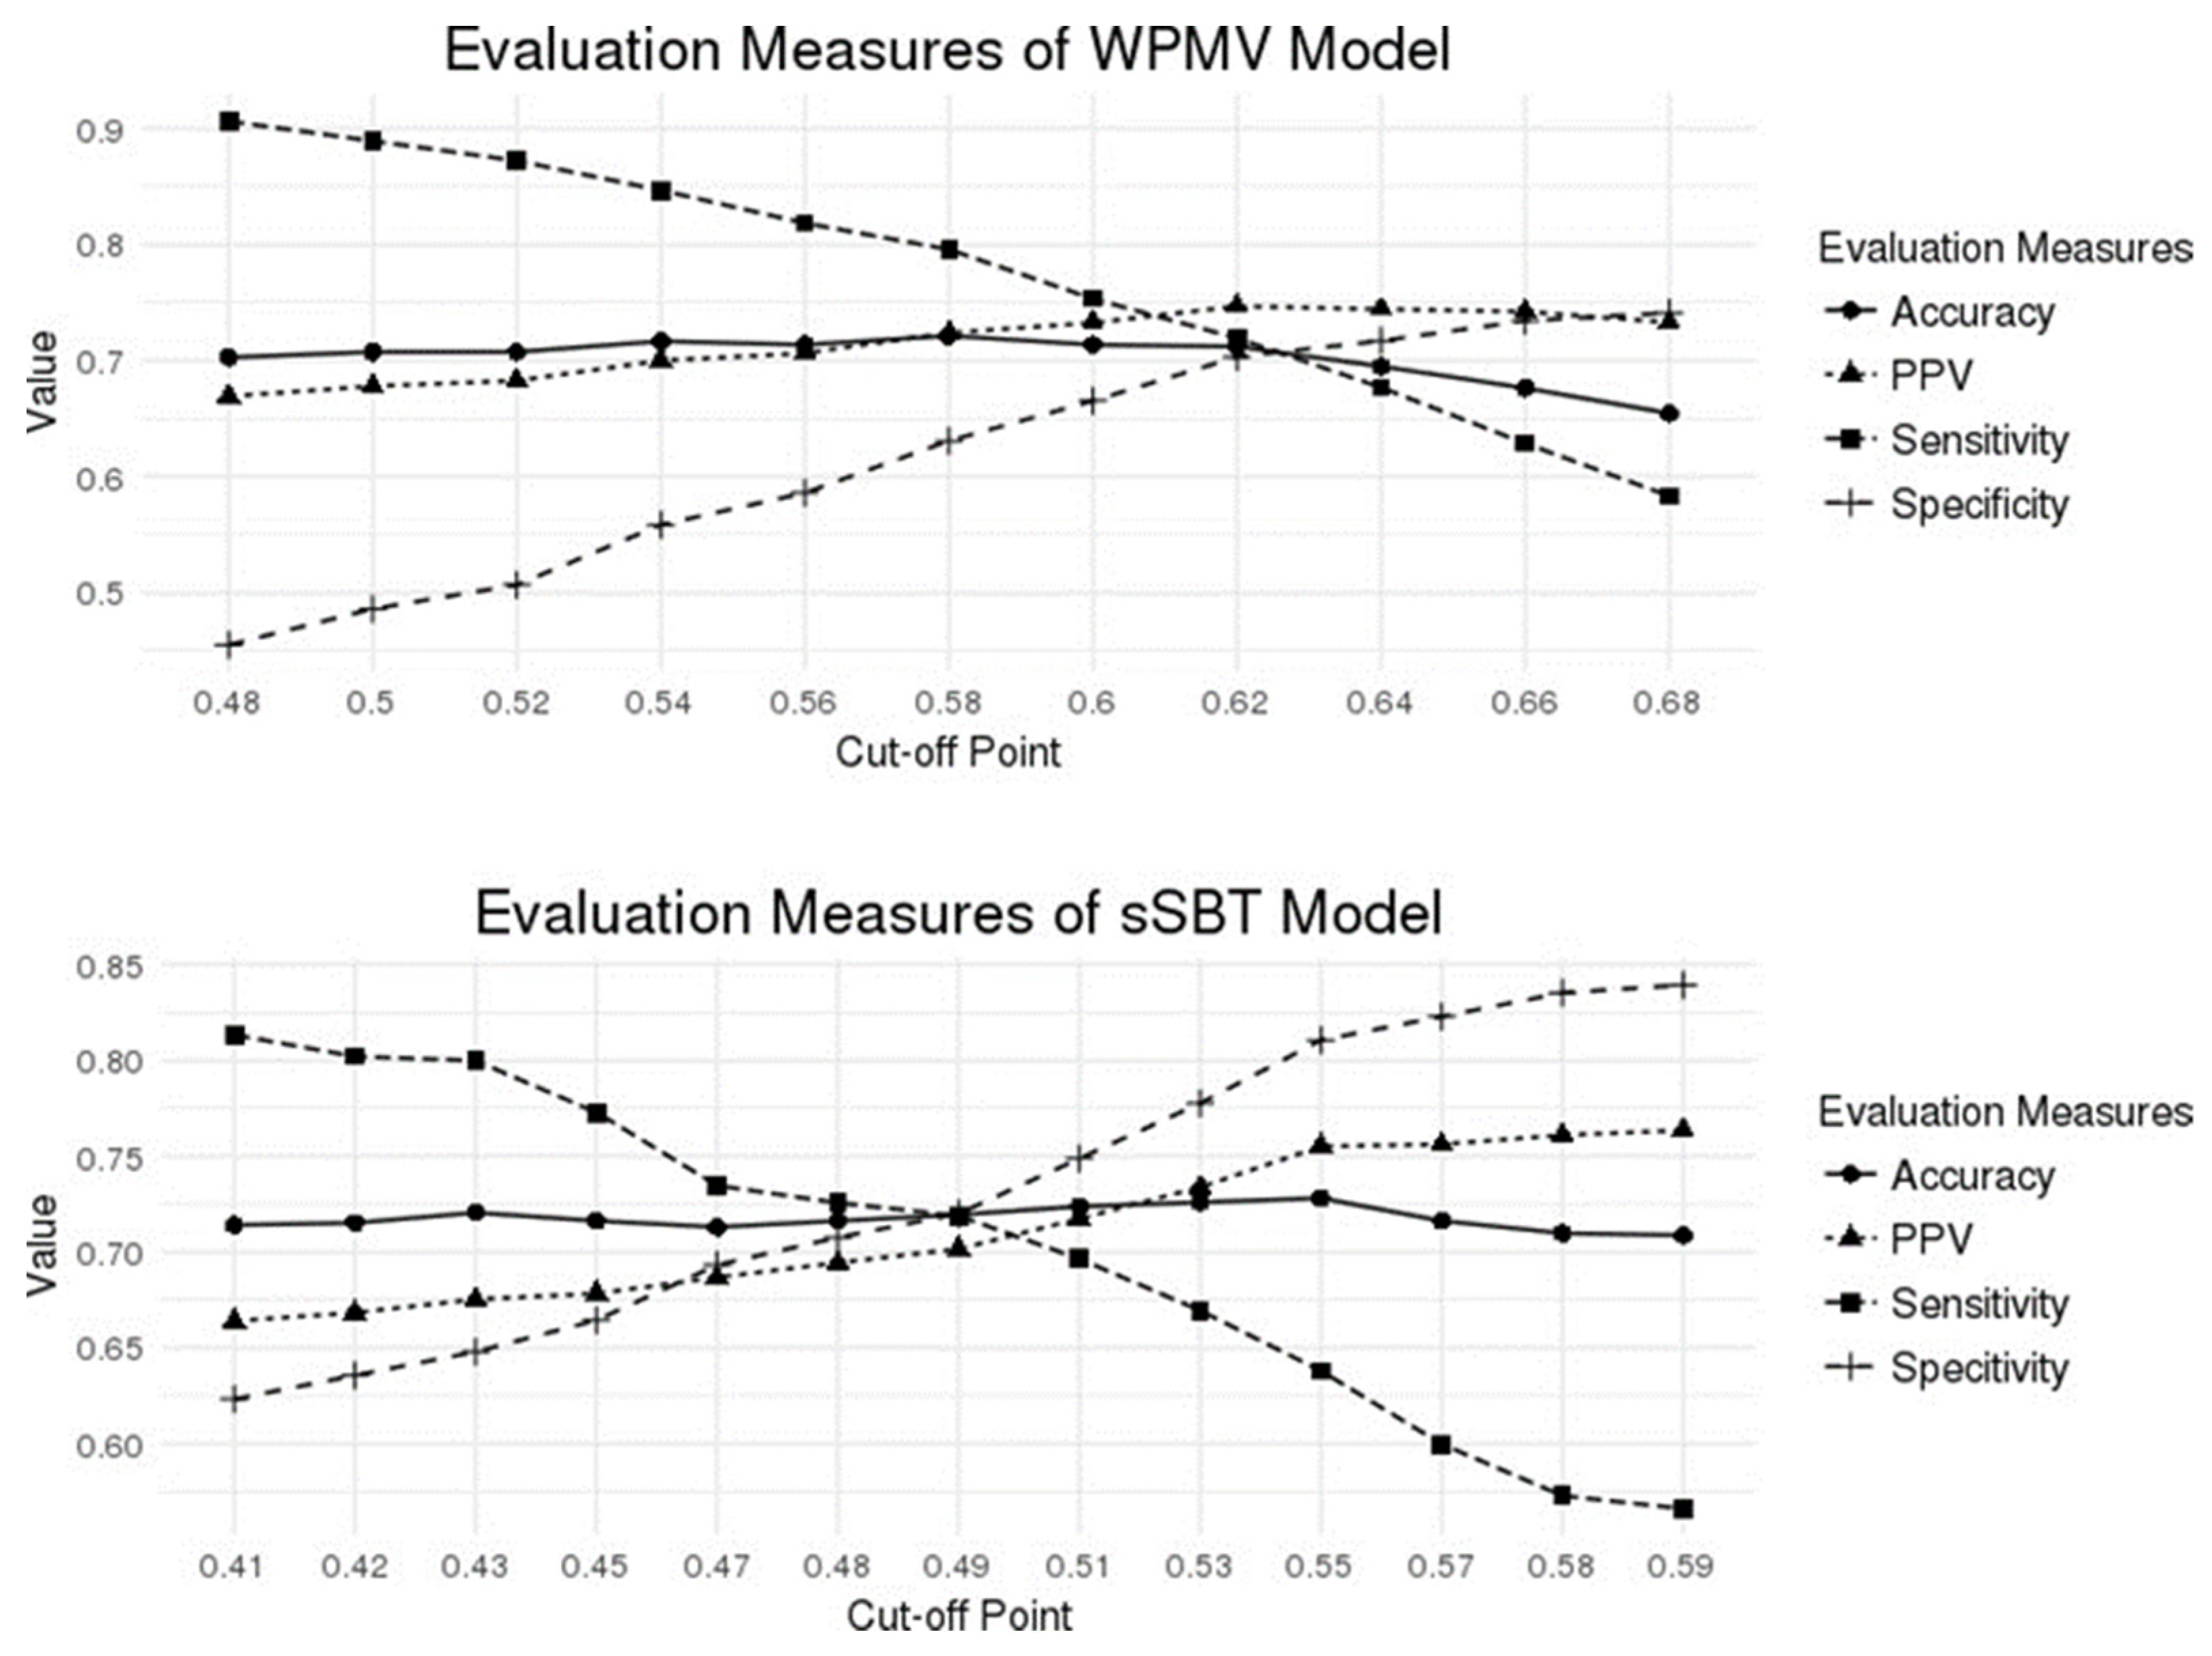
The current cut-off value was targeted at the best accuracy. In real-world practice, the value selection can depend on the intention of the physicians. For early weaning, the cut-off value should be chosen for the highest sensitivity. Then, our WPMV model would identify the 90% of patients ready for partial support at a cut-off value of 0.48, while the sSBT model detects the 80% of patients who can tolerate T-P 2 h at a cut-off value of 0.41, as shown in
Figure 4. However, the positive predictive value (PPV) at these cut-off values was around 70%, and further confirmation tests may be performed to avoid premature weaning in high-risk populations
5. Limitation
First, this single-center designed project may have the risk of overfitting and limit the generalization ability of the predictive model to other ICUs as the weaning practice may differ in other institutions [
24]. Second, some parameters were dependent on the clinicians’ practice rather than patient characteristics (e.g., frequency of ABG, blood pressure, laboratory tests, weights recording, MV alarm and tidal volume setting, etc.). As a result, some parameters, such as Vt_weight_median_4hour, weight_variance_72hour, count of the alarm message, and DP_average_6hour may be affected in the retrospective study.
Third, the amount of clinical data collected for 2 years in a single hospital may not be sufficient to train the models because of complicated situations in medical ICUs. Our model excluded expired and re-admitted patients’ data due to the low possibility of successful weaning. However, this may hinder the models to predict weaning in the real-world setting.
Fourth, extubation is an important issue after successful weaning from the ventilator. In our retrospective dataset, the time of extubation was not recorded and the current study cannot address the prediction of successful extubation. The cause of resuming MV support after a T-P trial could not distinguish SBT failure from extubation failure. A further prospective study with a better information recording is mandatory for the issue of successful extubation.
Finally, the accuracy of our current WPMV and sSBT models are 72.2% and 71.97%. The values may fulfill the minimal requirement for clinical practices. In theory, transfer learning techniques and multi-center data would improve the predictive ability of our models applying in other institutions.
6. Conclusions
This is the first study focused on predicting successful MV mode shifting from full support, partial support to SBT with machine learning techniques. Our study highlighted the accurate prediction of MV weaning using multiple domains of clinical parameters and hourly input of MV variables with novel statistics (average/variance/median/slope) of pulmonary mechanics. The prediction models using data from EMR and MV require no manual measurement of weaning parameters and have better AUROC than traditional RSBI. Nonpulmonary features related to body temperature, weight, blood urea nitrogen, hemoglobin, and the ratio of neutrophils are important for successful partial support ventilation. The trend of pulmonary mechanics hours before SBT is crucial in predicting a successful T-P trial. Further larger multi-center training datasets with transfer machine learning techniques may improve the performance of these classification models. A decision-making system will be feasible for opportune weaning when the novel models process real-time data from MV and EMRs continuously. The tangible results of our study are demonstrated in
Figure 5.
Author Contributions
Conceptualization, K.-H.C.; Data curation, L.-K.K. and T.-M.C.; Formal analysis, Y.-H.L.; Investigation, M.-C.T. and Y.-J.C.; Methodology, M.-C.T., L.-K.K. and C.-W.L.; Project administration, L.-K.K.; Resources, L.-K.K., Y.-J.C. and C.-W.L.; Software, C.-W.L. and Y.-H.L.; Supervision, L.-K.K.; Validation, T.-M.C.; Writing—original draft, K.-H.C.; Writing—review and editing, K.-H.C. and T.-M.C. All authors have read and agreed to the published version of the manuscript.
Funding
This research received no external funding.
Institutional Review Board Statement
Before the start of the study, the study protocol was approved by the Institutional Review Board of the MacKay Memorial Hospital (18MMHIS063e).
Informed Consent Statement
Not applicable.
Data Availability Statement
All the data supporting our findings are available from the corresponding author upon reasonable request.
Acknowledgments
The authors in Mackay Memorial Hospital appreciates Wistron Corporation for its assistance in data acquisition, cleaning, extraction, transformation, modeling, and suggestions for statistical analysis.
Conflicts of Interest
The authors declare no conflict of interest.
References
- Jaber, S.; Chanques, G.; Matecki, S.; Ramonatxo, M.; Vergne, C.; Souche, B.; Perrigault, P.F.; Eledjam, J.J. Post-extubation stridor in intensive care unit patients. Risk factors evaluation and importance of the cuff-leak test. Intensive Care Med. 2003, 29, 69–74. [Google Scholar] [CrossRef] [PubMed]
- Sue, R.D.; Susanto, I. Long-term complications of artificial airways. Clin. Chest Med. 2003, 24, 457–471. [Google Scholar] [CrossRef]
- Carden, K.A.; Boiselle, P.M.; Waltz, D.A.; Ernst, A. Tracheomalacia and tracheobronchomalacia in children and adults: An in-depth review. Chest 2005, 127, 984–1005. [Google Scholar] [CrossRef] [PubMed] [Green Version]
- Cheng, A.-C.; Cheng, K.-C.; Chen, C.-M.; Hsing, S.-C.; Sung, M.-Y. The outcome and predictors of failed extubation in intensive care patients—The elderly is an important predictor. Int. J. Gerontol. 2011, 5, 206–211. [Google Scholar] [CrossRef] [Green Version]
- Yang, K.L.; Tobin, M.J. A prospective study of indexes predicting the outcome of trials of weaning from mechanical ventilation. New Engl. J. Med. 1991, 324, 1445–1450. [Google Scholar] [CrossRef] [PubMed]
- Boles, J.M.; Bion, J.; Connors, A.; Herridge, M.; Marsh, B.; Melot, C.; Pearl, R.; Silverman, H.; Stanchina, M.; Vieillard-Baron, A.; et al. Weaning from mechanical ventilation. Eur. Respir. J. 2007, 29, 1033–1056. [Google Scholar] [CrossRef]
- Heunks, L.M.; van der Hoeven, J.G. Clinical review: The ABC of weaning failure--a structured approach. Crit. Care 2010, 14, 245. [Google Scholar] [CrossRef] [Green Version]
- Kuo, H.J.; Chiu, H.W.; Lee, C.N.; Chen, T.T.; Chang, C.C.; Bien, M.Y. Improvement in the Prediction of Ventilator Weaning Outcomes by an Artificial Neural Network in a Medical ICU. Respir. Care 2015, 60, 1560–1569. [Google Scholar] [CrossRef] [Green Version]
- Kwong, M.T.; Colopy, G.W.; Weber, A.M.; Ercole, A.; Bergmann, J.H. The efficacy and effectiveness of machine learning for weaning in mechanically ventilated patients at the intensive care unit: A systematic review. Bio-Des. Manuf. 2019, 2, 31–40. [Google Scholar] [CrossRef] [Green Version]
- Todorova, L.; Temelkov, A. Weaning from long-term mechanical ventilation: A nonpulmonary weaning index. J. Clin. Monit. Comput. 2004, 18, 275–281. [Google Scholar] [CrossRef]
- Wu, Y.K.; Kao, K.C.; Hsu, K.H.; Hsieh, M.J.; Tsai, Y.H. Predictors of successful weaning from prolonged mechanical ventilation in Taiwan. Respir. Med. 2009, 103, 1189–1195. [Google Scholar] [CrossRef] [PubMed] [Green Version]
- Datta, D.; Foley, R.; Wu, R.; Grady, J.; Scalise, P. Can creatinine height index predict weaning and survival outcomes in patients on prolonged mechanical ventilation after critical illness? J. Intensive Care Med. 2018, 33, 104–110. [Google Scholar] [CrossRef]
- Esteban, A.; AlÍa, I.; Tobin, M.J.; Gil, A.; Gordo, F.; VallverdÚ, I.; Blanch, L.; Bonet, A.; VÁzquez, A.; de PABLO, R. Effect of spontaneous breathing trial duration on outcome of attempts to discontinue mechanical ventilation. Am. J. Respir. Crit. Care Med. 1999, 159, 512–518. [Google Scholar] [CrossRef] [PubMed]
- Meade, M.; Guyatt, G.; Cook, D.; Griffith, L.; Sinuff, T.; Kergl, C.; Mancebo, J.; Esteban, A.; Epstein, S. Predicting success in weaning from mechanical ventilation. Chest 2001, 120, 400S–424S. [Google Scholar] [CrossRef] [PubMed] [Green Version]
- Hsieh, M.H.; Hsieh, M.J.; Cheng, A.C.; Chen, C.M.; Hsieh, C.C.; Chao, C.M.; Lai, C.C.; Cheng, K.C.; Chou, W. Predicting weaning difficulty for planned extubation patients with an artificial neural network. Medicine 2019, 98, e17392. [Google Scholar] [CrossRef] [PubMed]
- Giraldo, B.; Garde, A.; Arizmendi, C.; Jane, R.; Benito, S.; Diaz, I.; Ballesteros, D. Support vector machine classification applied on weaning trials patients. Conf. Proc. IEEE Eng. Med. Biol. Soc. 2006, 2006, 5587–5590. [Google Scholar] [CrossRef] [PubMed]
- Garde, A.; Schroeder, R.; Voss, A.; Caminal, P.; Benito, S.; Giraldo, B.F. Patients on weaning trials classified with support vector machines. Physiol. Meas. 2010, 31, 979–993. [Google Scholar] [CrossRef]
- Beduneau, G.; Pham, T.; Schortgen, F.; Piquilloud, L.; Zogheib, E.; Jonas, M.; Grelon, F.; Runge, I.; Nicolas, T.; Grange, S.; et al. Epidemiology of Weaning Outcome according to a New Definition. The WIND Study. Am. J. Respir. Crit. Care Med. 2017, 195, 772–783. [Google Scholar] [CrossRef]
- Breiman, L. Random forests. Mach. Learn. 2001, 45, 5–32. [Google Scholar] [CrossRef] [Green Version]
- Chen, T.; Guestrin, C. Xgboost: A scalable tree boosting system. In Proceedings of the 22nd ACM Sigkdd International Conference on Knowledge Discovery and Data Mining, San Francisco, CA, USA, 13–17 August 2016; pp. 785–794. [Google Scholar]
- Epstein, C.D.; Peerless, J.R. Weaning readiness and fluid balance in older critically ill surgical patients. Am. J. Crit. Care 2006, 15, 54–64. [Google Scholar] [CrossRef]
- Vieira, J.M., Jr.; Castro, I.; Curvello-Neto, A.; Demarzo, S.; Caruso, P.; Pastore, L., Jr.; Imanishe, M.H.; Abdulkader, R.C.; Deheinzelin, D. Effect of acute kidney injury on weaning from mechanical ventilation in critically ill patients. Crit. Care Med. 2007, 35, 184–191. [Google Scholar] [CrossRef] [PubMed]
- Lai, Y.-C.; Ruan, S.-Y.; Huang, C.-T.; Kuo, P.-H.; Yu, C.-J. Hemoglobin levels and weaning outcome of mechanical ventilation in difficult-to-wean patients: A retrospective cohort study. PLoS ONE 2013, 8, e73743. [Google Scholar] [CrossRef] [PubMed] [Green Version]
- Nguyen, Y.-L.; Perrodeau, E.; Guidet, B.; Trinquart, L.; Richard, J.-C.M.; Mercat, A.; Jolliet, P.; Ravaud, P.; Brochard, L. Mechanical ventilation and clinical practice heterogeneity in intensive care units: A multicenter case-vignette study. Ann. Intensive Care 2014, 4, 1–8. [Google Scholar] [CrossRef] [PubMed] [Green Version]
| Publisher’s Note: MDPI stays neutral with regard to jurisdictional claims in published maps and institutional affiliations. |
© 2022 by the authors. Licensee MDPI, Basel, Switzerland. This article is an open access article distributed under the terms and conditions of the Creative Commons Attribution (CC BY) license (https://creativecommons.org/licenses/by/4.0/).


 ,
, 
