
Comparative Analysis of Myocardial Viability Multimodality Imaging in Patients with Previous Myocardial Infarction and Symptomatic Heart Failure

 , , ,
, , ,  , and
, and
Abstract
:1. Introduction
2. Methods
2.1. Study Population
2.2. Transthoracic Echocardiography
2.3. Cardiovascular Magnetic Resonance
2.3.1. CMR: Study Protocol
2.3.2. CMR: Image Analysis
2.4. Cardiac Nuclear Medicine Imaging
2.4.1. SPECT MPI: Study Protocol
2.4.2. SPECT MPI: Image Analysis
2.4.3. FDG PET: Study Protocol
2.5. PET, MPI, and CMR Comparative Analysis
2.6. Statistical Analysis
3. Results
3.1. Study Population
3.2. Cardiovascular Imaging
4. Discussion
5. Conclusions
Author Contributions
Funding
Institutional Review Board Statement
Informed Consent Statement
Conflicts of Interest
References
- Braunwald, E.; Kloner, R.A. The stunned myocardium: Prolonged, postischemic ventricular dysfunction. Circulation 1982, 66, 1146–1149. [Google Scholar] [CrossRef] [Green Version]
- Diamond, G.A.; Forrester, J.S.; deLuz, P.L.; Wyatt, H.L.; Swan, H.J. Post-extrasystolic potentiation of ischemic myocardium by atrial stimulation. Am. Heart J. 1978, 95, 204–209. [Google Scholar] [CrossRef]
- Rahimtoola, S.H. The hibernating myocardium. Am. Heart J. 1989, 117, 211–221. [Google Scholar] [CrossRef]
- Wijns, W.; Vatner, S.F.; Camici, P.G. Hibernating myocardium. N. Engl. J. Med. 1998, 339, 173–181. [Google Scholar] [CrossRef] [PubMed]
- Braunwald, E.; Rutherford, J.D. Reversible ischemic left ventricular dysfunction: Evidence for the “hibernating myocardium”. J. Am. Coll. Cardiol. 1986, 8, 1467–1470. [Google Scholar] [CrossRef] [Green Version]
- Fathala, A. Myocardial perfusion scintigraphy: Techniques, interpretation, indications and reporting. Ann. Saudi Med. 2011, 31, 625–634. [Google Scholar] [CrossRef] [PubMed]
- Van Dongen, A.J.; van Rijk, P.P. Minimizing liver, bowel, and gastric activity in myocardial perfusion SPECT. J. Nucl. Med. 2000, 41, 1315–1317. [Google Scholar] [PubMed]
- Miles, J.; Cullom, S.J.; Case, J.A. An introduction to attenuation correction. J. Nucl. Cardiol. 1999, 6, 449–457. [Google Scholar] [CrossRef]
- DePuey, E.G.; Guertler-Krawczynska, E.; Perkins, J.V.; Robbins, W.L.; Whelchel, J.D.; Clements, S.D. Alterations in myocardial thallium-201 distribution in patients with chronic systemic hypertension undergoing single-photon emission computed tomography. Am. J. Cardiol. 1988, 62, 234–238. [Google Scholar] [CrossRef]
- Townsend, D.W. Positron emission tomography/computed tomography. Semin. Nucl. Med. 2008, 38, 152–166. [Google Scholar] [CrossRef] [Green Version]
- Klein, C.; Nekolla, S.G.; Bengel, F.M.; Momose, M.; Sammer, A.; Haas, F.; Schnackenburg, B.; Delius, W.; Mudra, H.; Wolfram, D.; et al. Assessment of myocardial viability with contrast-enhanced magnetic resonance imaging: Comparison with positron emission tomography. Circulation 2002, 105, 162–167. [Google Scholar] [CrossRef] [PubMed] [Green Version]
- Schwitter, J.; DeMarco, T.; Kneifel, S.; von Schulthess, G.K.; Jorg, M.C.; Arheden, H.; Ruhm, S.; Stumpe, K.; Buck, A.; Parmley, W.W.; et al. Magnetic resonance-based assessment of global coronary flow and flow reserve and its relation to left ventricular functional parameters: A comparison with positron emission tomography. Circulation 2000, 101, 2696–2702. [Google Scholar] [CrossRef] [PubMed] [Green Version]
- Gerber, B.L.; Garot, J.; Bluemke, D.A.; Wu, K.C.; Lima, J.A. Accuracy of contrast-enhanced magnetic resonance imaging in predicting improvement of regional myocardial function in patients after acute myocardial infarction. Circulation 2002, 106, 1083–1089. [Google Scholar] [CrossRef] [Green Version]
- Kuhl, H.P.; Lipke, C.S.; Krombach, G.A.; Katoh, M.; Battenberg, T.F.; Nowak, B.; Heussen, N.; Buecker, A.; Schaefer, W.M. Assessment of reversible myocardial dysfunction in chronic ischaemic heart disease: Comparison of contrast-enhanced cardiovascular magnetic resonance and a combined positron emission tomography-single photon emission computed tomography imaging protocol. Eur. Heart J. 2006, 27, 846–853. [Google Scholar] [CrossRef] [Green Version]
- Kim, R.J.; Wu, E.; Rafael, A.; Chen, E.L.; Parker, M.A.; Simonetti, O.; Klocke, F.J.; Bonow, R.O.; Judd, R.M. The use of contrast-enhanced magnetic resonance imaging to identify reversible myocardial dysfunction. N. Engl. J. Med. 2000, 343, 1445–1453. [Google Scholar] [CrossRef]
- Romero, J.; Xue, X.; Gonzalez, W.; Garcia, M.J. CMR imaging assessing viability in patients with chronic ventricular dysfunction due to coronary artery disease: A meta-analysis of prospective trials. JACC Cardiovasc. Imaging 2012, 5, 494–508. [Google Scholar] [CrossRef] [Green Version]
- Selvanayagam, J.B.; Kardos, A.; Francis, J.M.; Wiesmann, F.; Petersen, S.E.; Taggart, D.P.; Neubauer, S. Value of delayed-enhancement cardiovascular magnetic resonance imaging in predicting myocardial viability after surgical revascularization. Circulation 2004, 110, 1535–1541. [Google Scholar] [CrossRef] [PubMed] [Green Version]
- Simonetti, O.P.; Kim, R.J.; Fieno, D.S.; Hillenbrand, H.B.; Wu, E.; Bundy, J.M.; Finn, J.P.; Judd, R.M. An improved MR imaging technique for the visualization of myocardial infarction. Radiology 2001, 218, 215–223. [Google Scholar] [CrossRef]
- Korosoglou, G.; Youssef, A.A.; Bilchick, K.C.; Ibrahim, E.-S.; Lardo, A.C.; Lai, S.; Osman, N.F. Real-time fast strain-encoded magnetic resonance imaging to evaluate regional myocardial function at 3.0 Tesla: Comparison to conventional tagging. J. Magn. Reson. Imaging 2008, 27, 1012–1018. [Google Scholar] [CrossRef]
- Garot, J.; Lima, J.A.; Gerber, B.L.; Sampath, S.; Wu, K.C.; Bluemke, D.A.; Prince, J.L.; Osman, N.F. Spatially resolved imaging of myocardial function with strain-encoded MR: Comparison with delayed contrast-enhanced MR imaging after myocardial infarction. Radiology 2004, 233, 596–602. [Google Scholar] [CrossRef] [PubMed] [Green Version]
- Neizel, M.; Lossnitzer, D.; Korosoglou, G.; Schaufele, T.; Peykarjou, H.; Steen, H.; Ocklenburg, C.; Giannitsis, E.; Katus, H.A.; Osman, N.F. Strain-encoded MRI for evaluation of left ventricular function and transmurality in acute myocardial infarction. Circ. Cardiovasc. Imaging 2009, 2, 116–122. [Google Scholar] [CrossRef] [Green Version]
- Lang, R.M.; Badano, L.P.; Mor-Avi, V.; Afilalo, J.; Armstrong, A.; Ernande, L.; Flachskampf, F.A.; Foster, E.; Goldstein, S.A.; Kuznetsova, T.; et al. Recommendations for cardiac chamber quantification by echocardiography in adults: An update from the American Society of Echocardiography and the European Association of Cardiovascular Imaging. J. Am. Soc. Echocardiogr. 2015, 28, 233–271. [Google Scholar] [CrossRef] [Green Version]
- Schulz-Menger, J.; Bluemke, D.A.; Bremerich, J.; Flamm, S.D.; Fogel, M.A.; Friedrich, M.G.; Kim, R.J.; von Knobelsdorff-Brenkenhoff, F.; Kramer, C.M.; Pennell, D.J.; et al. Standardized image interpretation and post processing in cardiovascular magnetic resonance: Society for Cardiovascular Magnetic Resonance (SCMR) board of trustees task force on standardized post processing. J. Cardiovasc. Magn. Reson. 2013, 15, 35. [Google Scholar] [CrossRef] [PubMed] [Green Version]
- Mikami, Y.; Kolman, L.; Joncas, S.X.; Stirrat, J.; Scholl, D.; Rajchl, M.; Lydell, C.P.; Weeks, S.G.; Howarth, A.G.; White, J.A. Accuracy and reproducibility of semi-automated late gadolinium enhancement quantification techniques in patients with hypertrophic cardiomyopathy. J. Cardiovasc. Magn. Reson. 2014, 16, 85. [Google Scholar] [CrossRef] [PubMed] [Green Version]
- Hunold, P.; Jakob, H.; Erbel, R.; Barkhausen, J.; Heilmaier, C. Accuracy of myocardial viability imaging by cardiac MRI and PET depending on left ventricular function. World J. Cardiol. 2018, 10, 110–118. [Google Scholar] [CrossRef]
- Wu, Y.W.; Tadamura, E.; Kanao, S.; Yamamuro, M.; Marui, A.; Komeda, M.; Toma, M.; Kimura, T.; Togashi, K. Myocardial viability by contrast-enhanced cardiovascular magnetic resonance in patients with coronary artery disease: Comparison with gated single-photon emission tomography and FDG position emission tomography. Int. J. Cardiovasc. Imaging 2007, 23, 757–765. [Google Scholar] [CrossRef] [PubMed]
- Nekolla, S.G.; Martinez-Moeller, A.; Saraste, A. PET and MRI in cardiac imaging: From validation studies to integrated applications. Eur. J. Nucl. Med. Mol. Imaging 2009, 36, 121–130. [Google Scholar] [CrossRef] [PubMed]
- Rischpler, C.; Langwieser, N.; Souvatzoglou, M.; Batrice, A.; van Marwick, S.; Snajberk, J.; Ibrahim, T.; Laugwitz, K.L.; Nekolla, S.G.; Schwaiger, M. PET/MRI early after myocardial infarction: Evaluation of viability with late gadolinium enhancement transmurality vs. 18F-FDG uptake. Eur. Heart J. Cardiovasc. Imaging 2015, 16, 661–669. [Google Scholar] [CrossRef] [Green Version]
- Ryan, M.J.; Perera, D. Identifying and Managing Hibernating Myocardium: What’s New and What Remains Unknown? Curr. Heart Fail. Rep. 2018, 15, 214–223. [Google Scholar] [CrossRef] [Green Version]
- Desideri, A.; Cortigiani, L.; Christen, A.I.; Coscarelli, S.; Gregori, D.; Zanco, P.; Komorovsky, R.; Bax, J.J. The extent of perfusion-F18-fluorodeoxyglucose positron emission tomography mismatch determines mortality in medically treated patients with chronic ischemic left ventricular dysfunction. J. Am. Coll. Cardiol. 2005, 46, 1264–1269. [Google Scholar] [CrossRef]
- Allman, K.C.; Shaw, L.J.; Hachamovitch, R.; Udelson, J.E. Myocardial viability testing and impact of revascularization on prognosis in patients with coronary artery disease and left ventricular dysfunction: A meta-analysis. J. Am. Coll. Cardiol. 2002, 39, 1151–1158. [Google Scholar] [CrossRef] [Green Version]
- Ling, L.F.; Marwick, T.H.; Flores, D.R.; Jaber, W.A.; Brunken, R.C.; Cerqueira, M.D.; Hachamovitch, R. Identification of therapeutic benefit from revascularization in patients with left ventricular systolic dysfunction: Inducible ischemia versus hibernating myocardium. Circ. Cardiovasc. Imaging 2013, 6, 363–372. [Google Scholar] [CrossRef] [PubMed] [Green Version]
- Beanlands, R.S.; Nichol, G.; Huszti, E.; Humen, D.; Racine, N.; Freeman, M.; Gulenchyn, K.Y.; Garrard, L.; deKemp, R.; Guo, A.; et al. F-18-fluorodeoxyglucose positron emission tomography imaging-assisted management of patients with severe left ventricular dysfunction and suspected coronary disease: A randomized, controlled trial (PARR-2). J. Am. Coll. Cardiol. 2007, 50, 2002–2012. [Google Scholar] [CrossRef] [PubMed] [Green Version]
- Cleland, J.G.; Freemantle, N. Revascularization for patients with heart failure. Inconsistencies between theory and practice. Eur. J. Heart Fail. 2011, 13, 694–697. [Google Scholar] [CrossRef] [PubMed] [Green Version]
- Bonow, R.O.; Maurer, G.; Lee, K.L.; Holly, T.A.; Binkley, P.F.; Desvigne-Nickens, P.; Drozdz, J.; Farsky, P.S.; Feldman, A.M.; Doenst, T.; et al. Myocardial viability and survival in ischemic left ventricular dysfunction. N. Engl. J. Med. 2011, 364, 1617–1625. [Google Scholar] [CrossRef] [Green Version]
- Shah, B.N.; Khattar, R.S.; Senior, R. The hibernating myocardium: Current concepts, diagnostic dilemmas, and clinical challenges in the post-STICH era. Eur. Heart J. 2013, 34, 1323–1336. [Google Scholar] [CrossRef] [Green Version]
- Perrone-Filardi, P.; Pinto, F.J. Looking for myocardial viability after a STICH trial: Not enough to close the door. J. Nucl. Med. 2012, 53, 349–352. [Google Scholar] [CrossRef] [Green Version]
- Neumann, F.J.; Sousa-Uva, M.; Ahlsson, A.; Alfonso, F.; Banning, A.P.; Benedetto, U.; Byrne, R.A.; Collet, J.P.; Falk, V.; Head, S.J.; et al. 2018 ESC/EACTS Guidelines on myocardial revascularization. Eur. Heart J. 2019, 40, 87–165. [Google Scholar] [CrossRef]
- Nandalur, K.R.; Dwamena, B.A.; Choudhri, A.F.; Nandalur, M.R.; Carlos, R.C. Diagnostic performance of stress cardiac magnetic resonance imaging in the detection of coronary artery disease: A meta-analysis. J. Am. Coll. Cardiol. 2007, 50, 1343–1353. [Google Scholar] [CrossRef] [PubMed] [Green Version]
- Wellnhofer, E.; Olariu, A.; Klein, C.; Grafe, M.; Wahl, A.; Fleck, E.; Nagel, E. Magnetic resonance low-dose dobutamine test is superior to SCAR quantification for the prediction of functional recovery. Circulation 2004, 109, 2172–2174. [Google Scholar] [CrossRef]
- Glaveckaite, S.; Valeviciene, N.; Palionis, D.; Skorniakov, V.; Celutkiene, J.; Tamosiunas, A.; Uzdavinys, G.; Laucevicius, A. Value of scar imaging and inotropic reserve combination for the prediction of segmental and global left ventricular functional recovery after revascularisation. J. Cardiovasc. Magn. Reson. 2011, 13, 35. [Google Scholar] [CrossRef] [PubMed] [Green Version]
- Hammer-Hansen, S.; Bandettini, W.P.; Hsu, L.Y.; Leung, S.W.; Shanbhag, S.; Mancini, C.; Greve, A.M.; Kober, L.; Thune, J.J.; Kellman, P.; et al. Mechanisms for overestimating acute myocardial infarct size with gadolinium-enhanced cardiovascular magnetic resonance imaging in humans: A quantitative and kinetic study. Eur. Heart J. Cardiovasc. Imaging 2016, 17, 76–84. [Google Scholar] [CrossRef] [PubMed] [Green Version]
- Koos, R.; Altiok, E.; Doetsch, J.; Neizel, M.; Krombach, G.; Marx, N.; Hoffmann, R. Layer-specific strain-encoded MRI for the evaluation of left ventricular function and infarct transmurality in patients with chronic coronary artery disease. Int. J. Cardiol. 2013, 166, 85–89. [Google Scholar] [CrossRef] [PubMed]
- Altiok, E.; Neizel, M.; Tiemann, S.; Krass, V.; Becker, M.; Zwicker, C.; Koos, R.; Kelm, M.; Kraemer, N.; Schoth, F.; et al. Layer-specific analysis of myocardial deformation for assessment of infarct transmurality: Comparison of strain-encoded cardiovascular magnetic resonance with 2D speckle tracking echocardiography. Eur. Heart J. Cardiovasc. Imaging 2013, 14, 570–578. [Google Scholar] [CrossRef] [PubMed] [Green Version]
- Oyama-Manabe, N.; Ishimori, N.; Sugimori, H.; Van Cauteren, M.; Kudo, K.; Manabe, O.; Okuaki, T.; Kamishima, T.; Ito, Y.M.; Tsutsui, H.; et al. Identification and further differentiation of subendocardial and transmural myocardial infarction by fast strain-encoded (SENC) magnetic resonance imaging at 3.0 Tesla. Eur. Radiol. 2011, 21, 2362–2368. [Google Scholar] [CrossRef] [Green Version]
- Neizel, M.; Lossnitzer, D.; Korosoglou, G.; Schaufele, T.; Lewien, A.; Steen, H.; Katus, H.A.; Osman, N.F.; Giannitsis, E. Strain-encoded (SENC) magnetic resonance imaging to evaluate regional heterogeneity of myocardial strain in healthy volunteers: Comparison with conventional tagging. J. Magn. Reson. Imaging 2009, 29, 99–105. [Google Scholar] [CrossRef]

| Baseline Characteristics | Total n = 31 |
|---|---|
| Age in years, M ± SD | 61.6 ± 10.3 |
| Gender (Male/Female), n (%) | 28 (9.3)/3 (9.7) |
| Coronary risk factors, n (%) | |
| - Hypertension, | 30 (96.8) |
| - Diabetes, | 2 (6.5) |
| - Obesity (BMI ≥ 30), | 14 (45.2) |
| - Hyperlipidemia | 31 (100.0) |
| - Smoking | 18 (58.1) |
| - Family history of premature CAD | 14 (45.2) |
| CAD history, n (%) | |
| - Prior STEMI/NSTEMI | 31 (100.0) |
| - Prior PCI | 21 (67.7) |
| - Prior CABG | 2 (6.5) |
| - Conservative treatment | 8 (25.8) |
| Comorbidities, n (%) | |
| - Stroke | 2 (6.5) |
| - COPD | 1 (3.2) |
| - Asthma | 1 (3.2) |
| - Pulmonary thromboembolism | 3 (9.7) |
| - Atrial fibrillation/flutter | 6 (19.4) |
| - Pacemaker | 3 (9.7) |
| - Oncological disease | 3 (9.7) |
| Symptoms, n (%) | |
| - Angina | 11 (35.5) |
| - Dyspnoea | 29 (93.5) |
| - Others | 6 (19.4) |
| NYHA class (M ± SD) | |
| - II, n (%) | 15 (48.4) |
| - III, n (%) | 15 (48.4) |
| - IV, n (%) | 1 (3.2) |
| 6 MWT, M ± SD | 348.6 (81.9) |
| Coronary artery disease, culprit lesion, n (%) | |
| - LAD | 21 (67.7) |
| - CX | 1 (3.2) |
| - RCA | 3 (9.7) |
| - LAD + CX | 1 (3.2) |
| - LAD + RCA | 3 (9.7) |
| - CX + RCA | 2 (6.5) |
| Significant valvular heart disease, n (%) | 14 (45.2) |
| - Aortic stenosis | 0 (0) |
| - Aortic regurgitation | 1 (3.2) |
| - Mitral stenosis | 0 (0) |
| - Mitral regurgitation | 13 (41.9) |
| - Tricuspidal regurgitation | 4 (12.9) |
| Medications, n (%) | |
| - Aspirin | 25 (80.6) |
| - Clopidogrel/Ticagrelor | 11 (35.5) |
| - Anticoagulant | 6 (19.4) |
| - ACEI/ARB | 31 (100) |
| - Beta-blocker | 30 (96.8) |
| - CCB | 1 (3.2) |
| - Statin | 31 (100.0) |
| - Nitrate | 8 (25.8) |
| - Digoxin | 3 (9.7) |
| - Ivabradine | 9 (29.0) |
| - Spironolactone | 24 (77.4) |
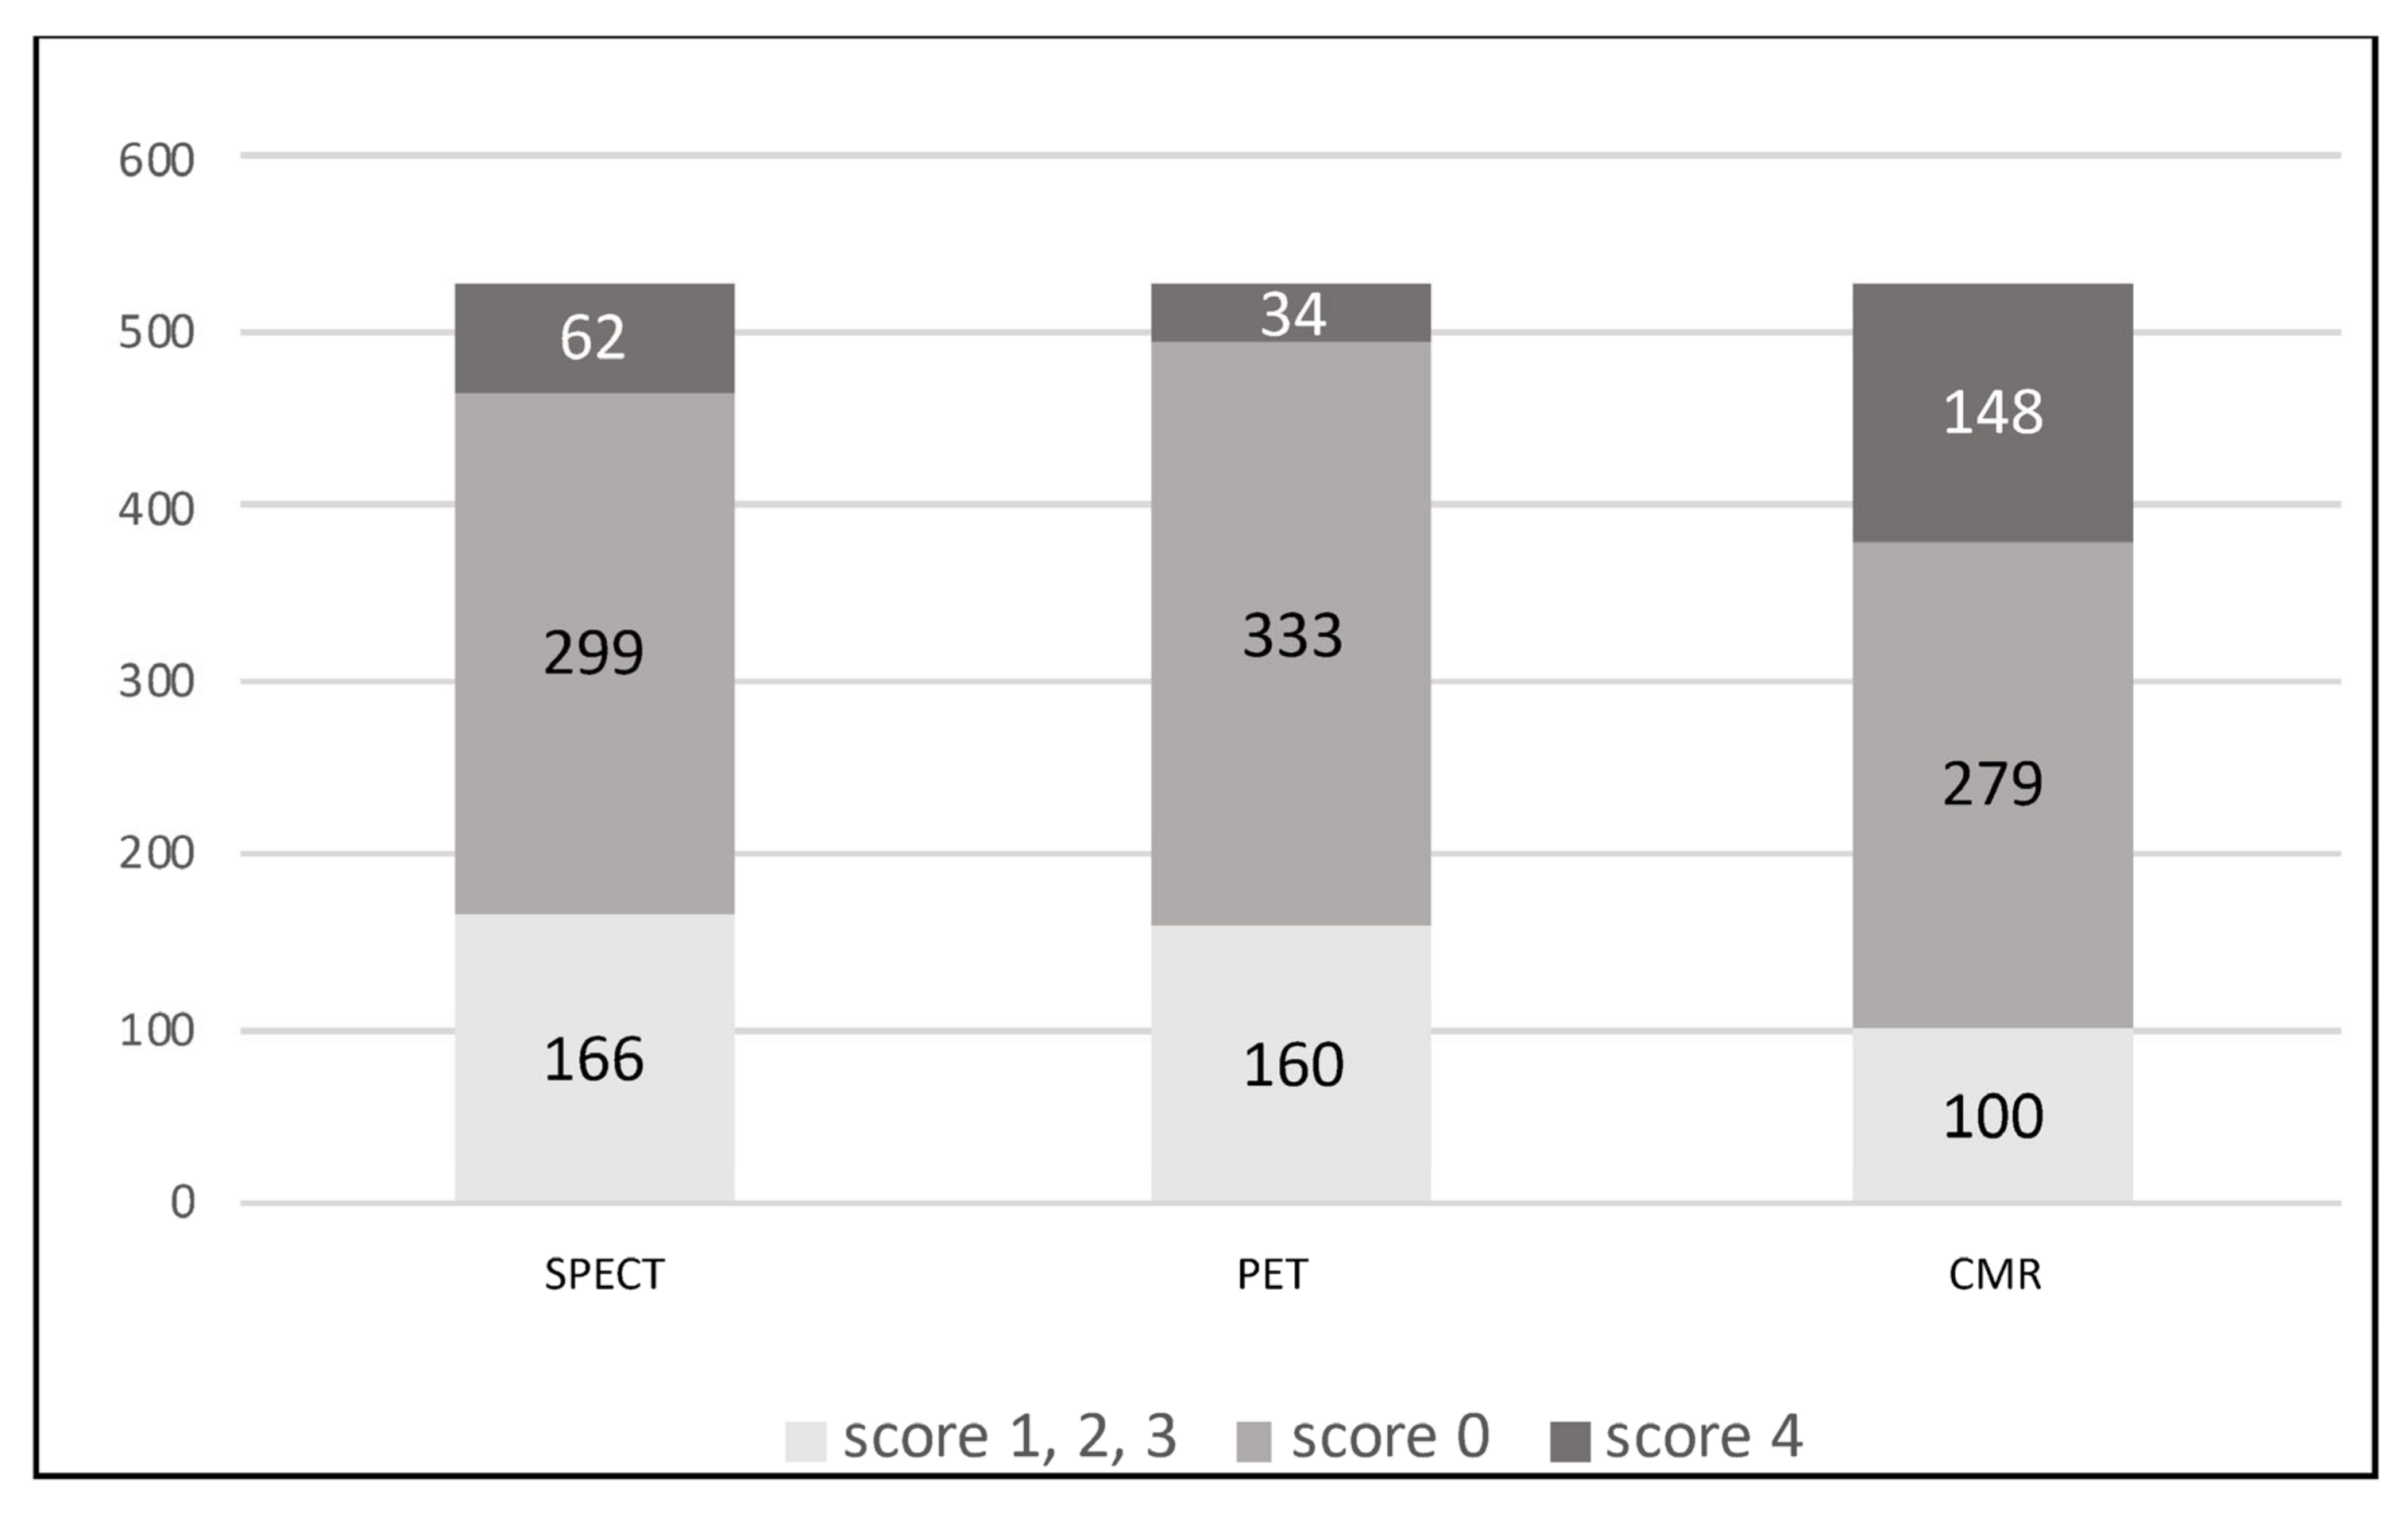
| Viable Myocardium (Score 0) | Subendocardial Scar (Score 1–3) | Transmural Scar (Score 4) | |||||||
|---|---|---|---|---|---|---|---|---|---|
| CMR | CMR | CMR | |||||||
| 279 (52.9%) | 100 (19%) | 148 (28.1%) | |||||||
| SPECT | 299 (56.7%) | 166 (31.5%) | 62 (11.8%) | ||||||
| p-value | p = 0.11 | p < 0.05 | p < 0.05 | ||||||
| PET | 333 (63.2%) | 160 (30.4%) | 34 (6.5%) | ||||||
| p-value | p < 0.05 | p < 0.05 | p < 0.05 | ||||||
| Group 1 N = 17 | Group 2 N = 14 | p-Value | |
|---|---|---|---|
| Mean score CMR LGE | 28.8 ± 9.6 | 28.2 ± 6.8 | 0.64 |
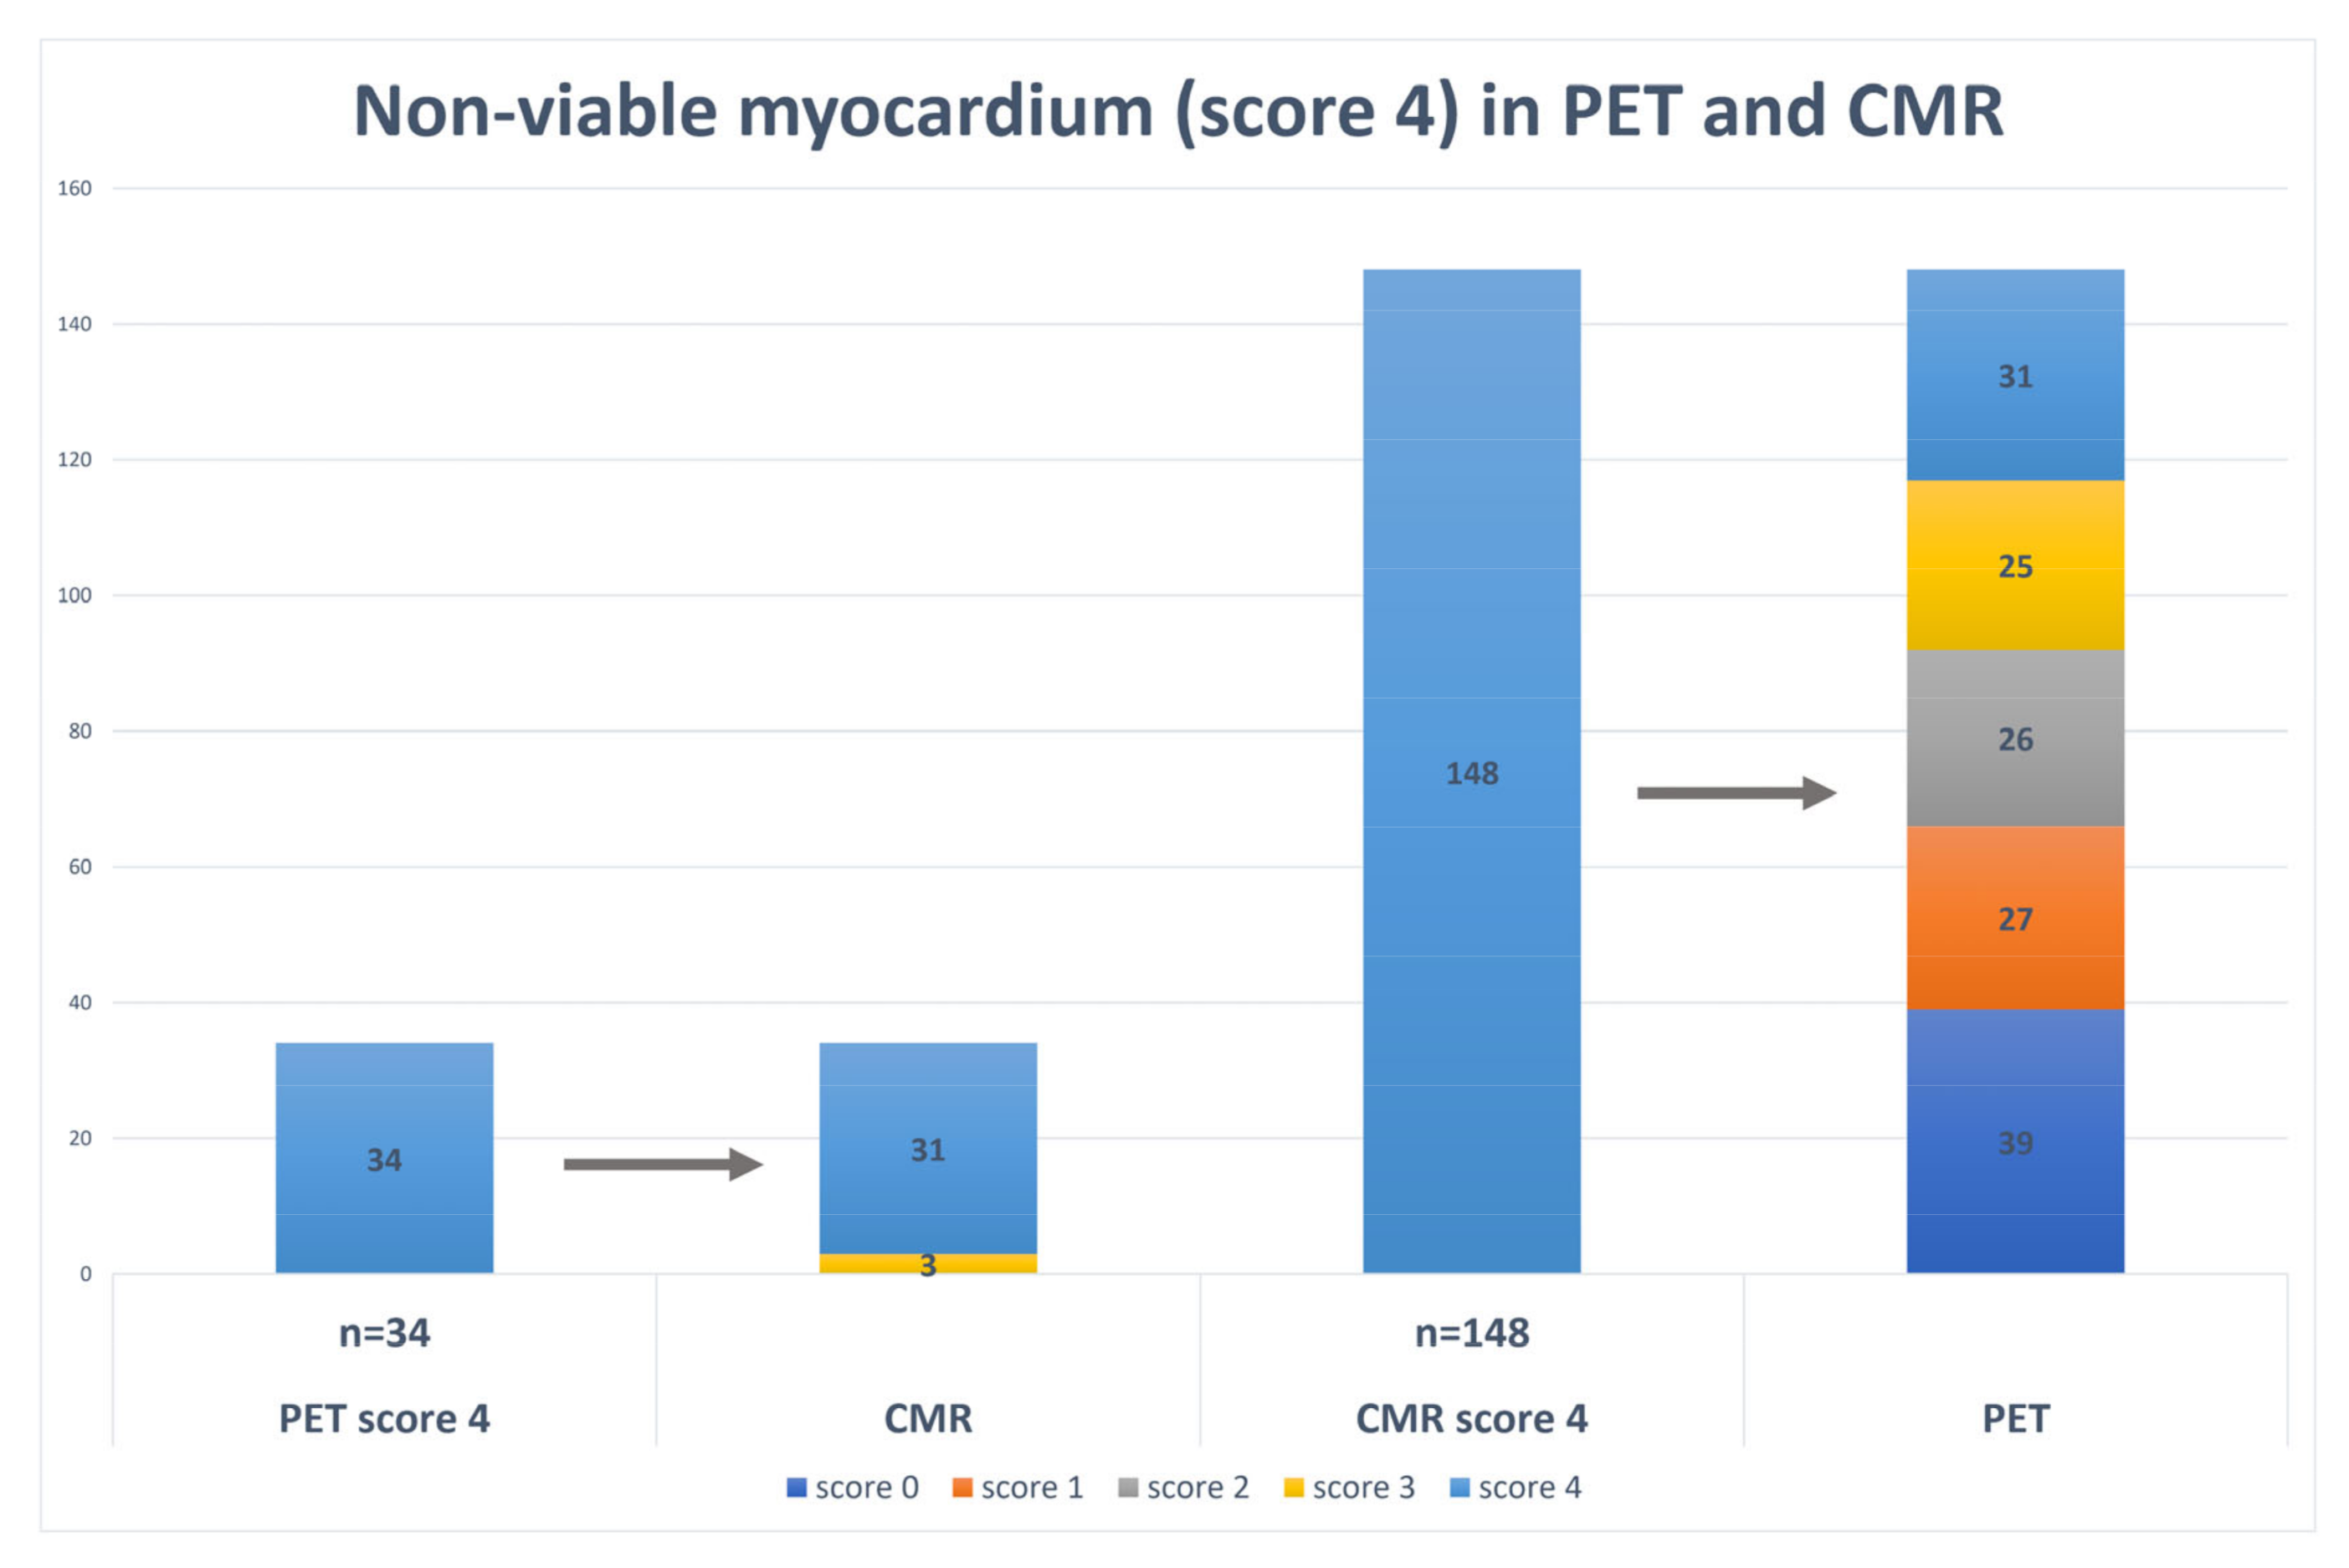
| Reversibility Score (CMR 4 vs. PET 3/2/1/0) | 14.4 ± 3.0 | 5.9 ± 2.8 | <0.05 |
| Age (years) | 59.4 ± 9.2 | 62.4 ± 9.7 | 0.54 |
| BMI (kg/m2) | 28.9 ± 6.8 | 28.9 ± 2.6 | 0.72 |
| 6 MWT (m) | 389.2 ± 94.5 | 301.4 ± 48.2 | <0.05 |
| LV EDD (TTE) (mm) | 53.2 ± 7.9 | 63.4 ± 8.9 | <0.05 |
| MM (TTE) (g) | 239.5 ± 85.9 | 276.3 ± 62.7 | <0.05 |
| LV EF (TTE) (%) | 31.5 ±8.0 | 26.5 ± 7.8 | 0.24 |
| RV (TTE) (mm) | 33.4 ± 6.9 | 38.5 ± 5.0 | <0.05 |
| TAPSE (TTE) (mm) | 18.7 ± 2.0 | 15.2 ± 2.0 | <0.05 |
| LVEDD (CMR) (mm) | 61.7 ± 8.1 | 69.0 ± 6.1 | <0.05 |
| LVEDDi (CMR) (mm/m2) | 29.8 ± 3.7 | 35.2 ± 3.1 | <0.05 |
| LVEDV (CMR) (ml) | 282.9 ± 95.7 | 313.7 ± 114.4 | 0.43 |
| LVEDVi (CMR) (ml/m2) | 137.5 ± 48.5 | 156.7 ± 53.7 | 0.16 |
| LV EF (CMR) (%) | 34.1 ± 10.3 | 29.5 ± 9.3 | 0.27 |
| LV GLS (CMR) | −14.3 ± 2.1 | −11.4 ± 2.9 | <0.05 |
| LV GCS (CMR) | −17.2 ± 4.6 | −12.7 ± 2.6 | <0.05 |
| Infarct size (g) (CMR) | 40.4 ± 15.7 | 54.2 ± 25.0 | 0.62 |
| Infarct size (%) (CMR) | 24.5 ± 9.6 | 34.8 ± 11.1 | <0.05 |
| Correlation Coefficient | |
|---|---|
| 6 MWT | rS = 0.48 |
| LV EDD (TTE) | r = −0.70 |
| MM (TTE) | r = −0.55 |
| LV EF (TTE) | r = 0.46 |
| RV (TTE) | r = −0.36 |
| TAPSE (TTE) | r = 0.60 |
| LVEDD (CMR) | r = −0.76 |
| LVEDDi (CMR) | rS = −0.72 |
| LVEDV (CMR) | r = −0.64 |
| LVEDVi (CMR) | r = −0.60 |
| LV EF (CMR) | rS = 0.39 |
| LV GLS (CMR) | r = −0.64 |
| LV GCS (CMR) | rS = −0.72 |
| Infarct size (g) (CMR) | rS = −0.52 |
| Infarct size (%) (CMR) | r = −0.61 |
| B, 95% CI | p-Value | |
|---|---|---|
| Constant | 25.8 [8.2–43.4] | <0.05 |
| LVEDD (CMR) | −0.4 [0.5–0.2] | <0.05 |
| LV EF (CMR) | −0.2 [0.4–0.0] | <0.05 |
| LV GCS (CMR) | −0.9 [1.5–0.4] | <0.05 |
| Group 1 N = 17 (100%) | Group 2 N = 14 (100%) | OR, 95% CI | AUC | Sensitivity | Specificity | p-Value | |
|---|---|---|---|---|---|---|---|
| 6 MWT (m) >350 ≤350 | 9 (52.9) 8 (47.1) | 1 (7.1) 13 (92.9) | 14.6 [1.5–138.2] | 77.1 | 92.9 | 52.9 | <0.05 |
| LV EDD (TTE) (mm) <60 >60 | 13 (76.5) 4 (23.5) | 5 (35.7) 9 (64.3) | 5.9 [1.2–28.0] | 88.7 | 64.3 | 76.5 | <0.05 |
| MM (TTE) (g) <240 >240 | 10 (58.8) 7 (41.2) | 3 (21.4) 11 (78.6) | 5.2 [1.1–26.0] | 75.6 | 100 | 47.1 | <0.05 |
| RV (TTE) (mm) <34 >34 | 10 (58.5) 7 (41.2) | 1 (7.1) 13 (92.9) | 18.6 [2.0–176.5] | 82.8 | 92.9 | 70.6 | <0.05 |
| TAPSE (TTE) (mm) >15 ≤15 | 16 (94.1) 1 (5.9) | 5 (35.7) 9 (64.3) | 28.8 [2.9–286.4] | 84.5 | 64.3 | 94.1 | <0.05 |
| LVEDD (CMR) (mm) <64 >64 | 16 (94.1) 1 (5.9) | 1 (7.1) 13 (92.9) | 208.0 [11.8–3656.8] | 97.1 | 92.9 | 94.1 | <0.05 |
| LVEDDi (CMR) (mm/m2) <32 >32 | 12 (70.6) 5 (29.4) | 0 (0) 14 (100) | 0.3 [0.1–0.6] | 95.8 | 71.4 | 100 | <0.05 |
| LVEDV (CMR) (ml) <330 >330 | 14 (82.4) 3 (17.6) | 6 (42.9) 8 (57.1) | 0.2 [0.0–0.8] | 71.2 | 57.1 | 88.2 | <0.05 |
| LVEDVi (CMR) (ml/m2) <140 >140 | 13 (76.5) 4 (23.5) | 5 (35.7) 9 (64.3) | 0.2 [0.0–0.8] | 76.9 | 64.3 | 82.4 | <0.05 |
| LV EF (CMR) (%) >40 ≤40 | 7 (41.2) 10 (58.8) | 1 (7.1) 13 (92.9) | 9.1 [1.0–86.5] | 64.5 | 92.9 | 41.2 | <0.05 |
| LV GLS (CMR) >−12.1 <−12.1 | 16 (94.1) 1 (5.9) | 6 (42.9) 8 (57.1) | 21.3 [2.2.–208.3] | 81.9 | 57.1 | 100 | <0.05 |
| LV GCS (CMR) >−15.8 <−15.8 | 11 (64.7) 6 (35.3) | 2 (14.3) 12 (85.7) | 11.0 [1.8–66.4] | 83.6 | 85.7 | 70.6 | <0.05 |
| Infarct size (g) (CMR) <48 >48 | 15 (88.2) 2 (11.8) | 6 (42.9) 8 (57.1) | 0.1 [0.0–0.6] | 80.9 | 57.1 | 100 | <0.05 |
| Infarct size (%) (CMR) <26 >26 | 12 (70.6) 5 (29.4) | 4 (28.6) 10 (71.4) | 0.2 [0.0–0.8] | 78.2 | 71.4 | 88.2 | <0.05 |
| B, 95% CI | p-Value | |
|---|---|---|
| LVEDV > 330 mL (CMR) | 2.0 [0.9–68.2] | 0.07 |
| Infarct size > 26% (CMR) | 2.2 [1.1–69.4] | <0.05 |
| LV GCS < −15.8 (CMR) | 2.5 [1.4–102.3] | <0.05 |
Publisher’s Note: MDPI stays neutral with regard to jurisdictional claims in published maps and institutional affiliations. |
© 2022 by the authors. Licensee MDPI, Basel, Switzerland. This article is an open access article distributed under the terms and conditions of the Creative Commons Attribution (CC BY) license (https://creativecommons.org/licenses/by/4.0/).
Share and Cite
Kazakauskaite, E.; Vajauskas, D.; Unikaite, R.; Jonauskiene, I.; Virbickiene, A.; Zaliaduonyte, D.; Lapinskas, T.; Jurkevicius, R. Comparative Analysis of Myocardial Viability Multimodality Imaging in Patients with Previous Myocardial Infarction and Symptomatic Heart Failure. Medicina 2022, 58, 368. https://doi.org/10.3390/medicina58030368
Kazakauskaite E, Vajauskas D, Unikaite R, Jonauskiene I, Virbickiene A, Zaliaduonyte D, Lapinskas T, Jurkevicius R. Comparative Analysis of Myocardial Viability Multimodality Imaging in Patients with Previous Myocardial Infarction and Symptomatic Heart Failure. Medicina. 2022; 58(3):368. https://doi.org/10.3390/medicina58030368
Chicago/Turabian StyleKazakauskaite, Egle, Donatas Vajauskas, Ruta Unikaite, Ieva Jonauskiene, Agneta Virbickiene, Diana Zaliaduonyte, Tomas Lapinskas, and Renaldas Jurkevicius. 2022. "Comparative Analysis of Myocardial Viability Multimodality Imaging in Patients with Previous Myocardial Infarction and Symptomatic Heart Failure" Medicina 58, no. 3: 368. https://doi.org/10.3390/medicina58030368
APA StyleKazakauskaite, E., Vajauskas, D., Unikaite, R., Jonauskiene, I., Virbickiene, A., Zaliaduonyte, D., Lapinskas, T., & Jurkevicius, R. (2022). Comparative Analysis of Myocardial Viability Multimodality Imaging in Patients with Previous Myocardial Infarction and Symptomatic Heart Failure. Medicina, 58(3), 368. https://doi.org/10.3390/medicina58030368