
Statin Prescription Patterns and Associations with Subclinical Inflammation

 , , , , and
Abstract
:1. Introduction
2. Materials and Methods
2.1. Study Setting and Population
2.2. Data Collection
2.3. Statistical Analysis
3. Results
3.1. Study Population
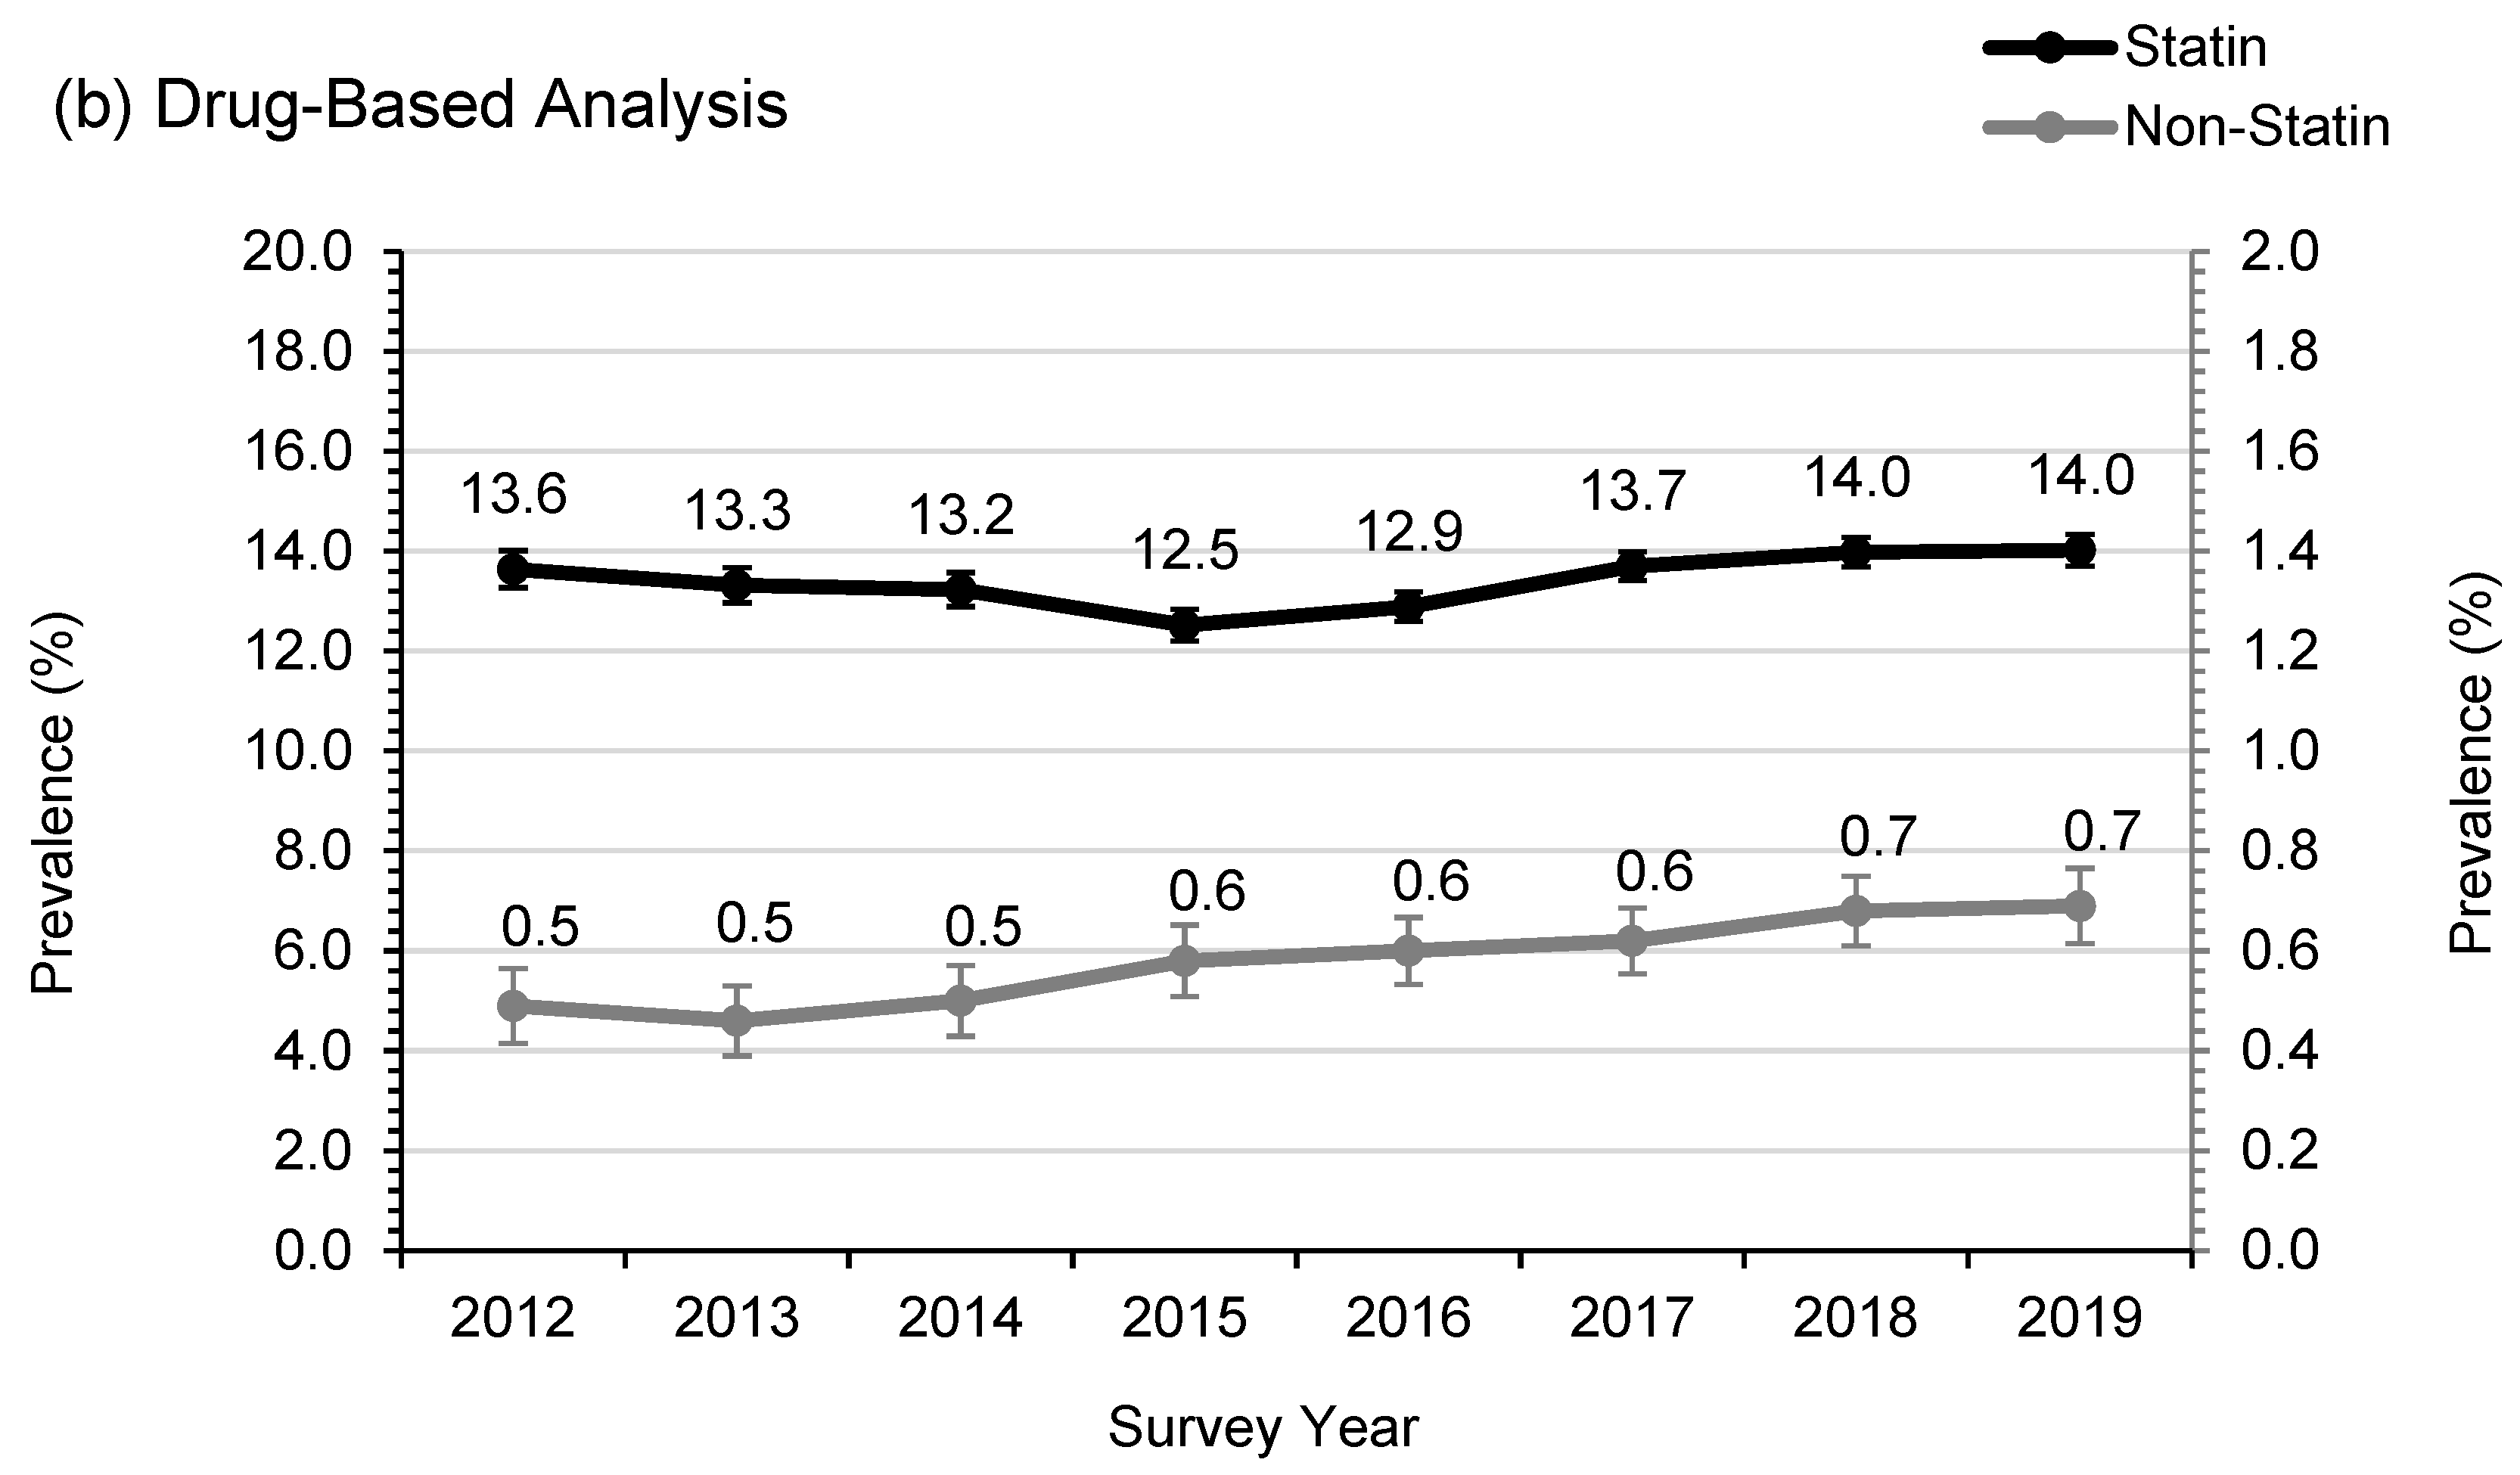
3.2. Statin Usage and Adherence in SWS
3.3. Factors Associated with Elevated CRP Levels
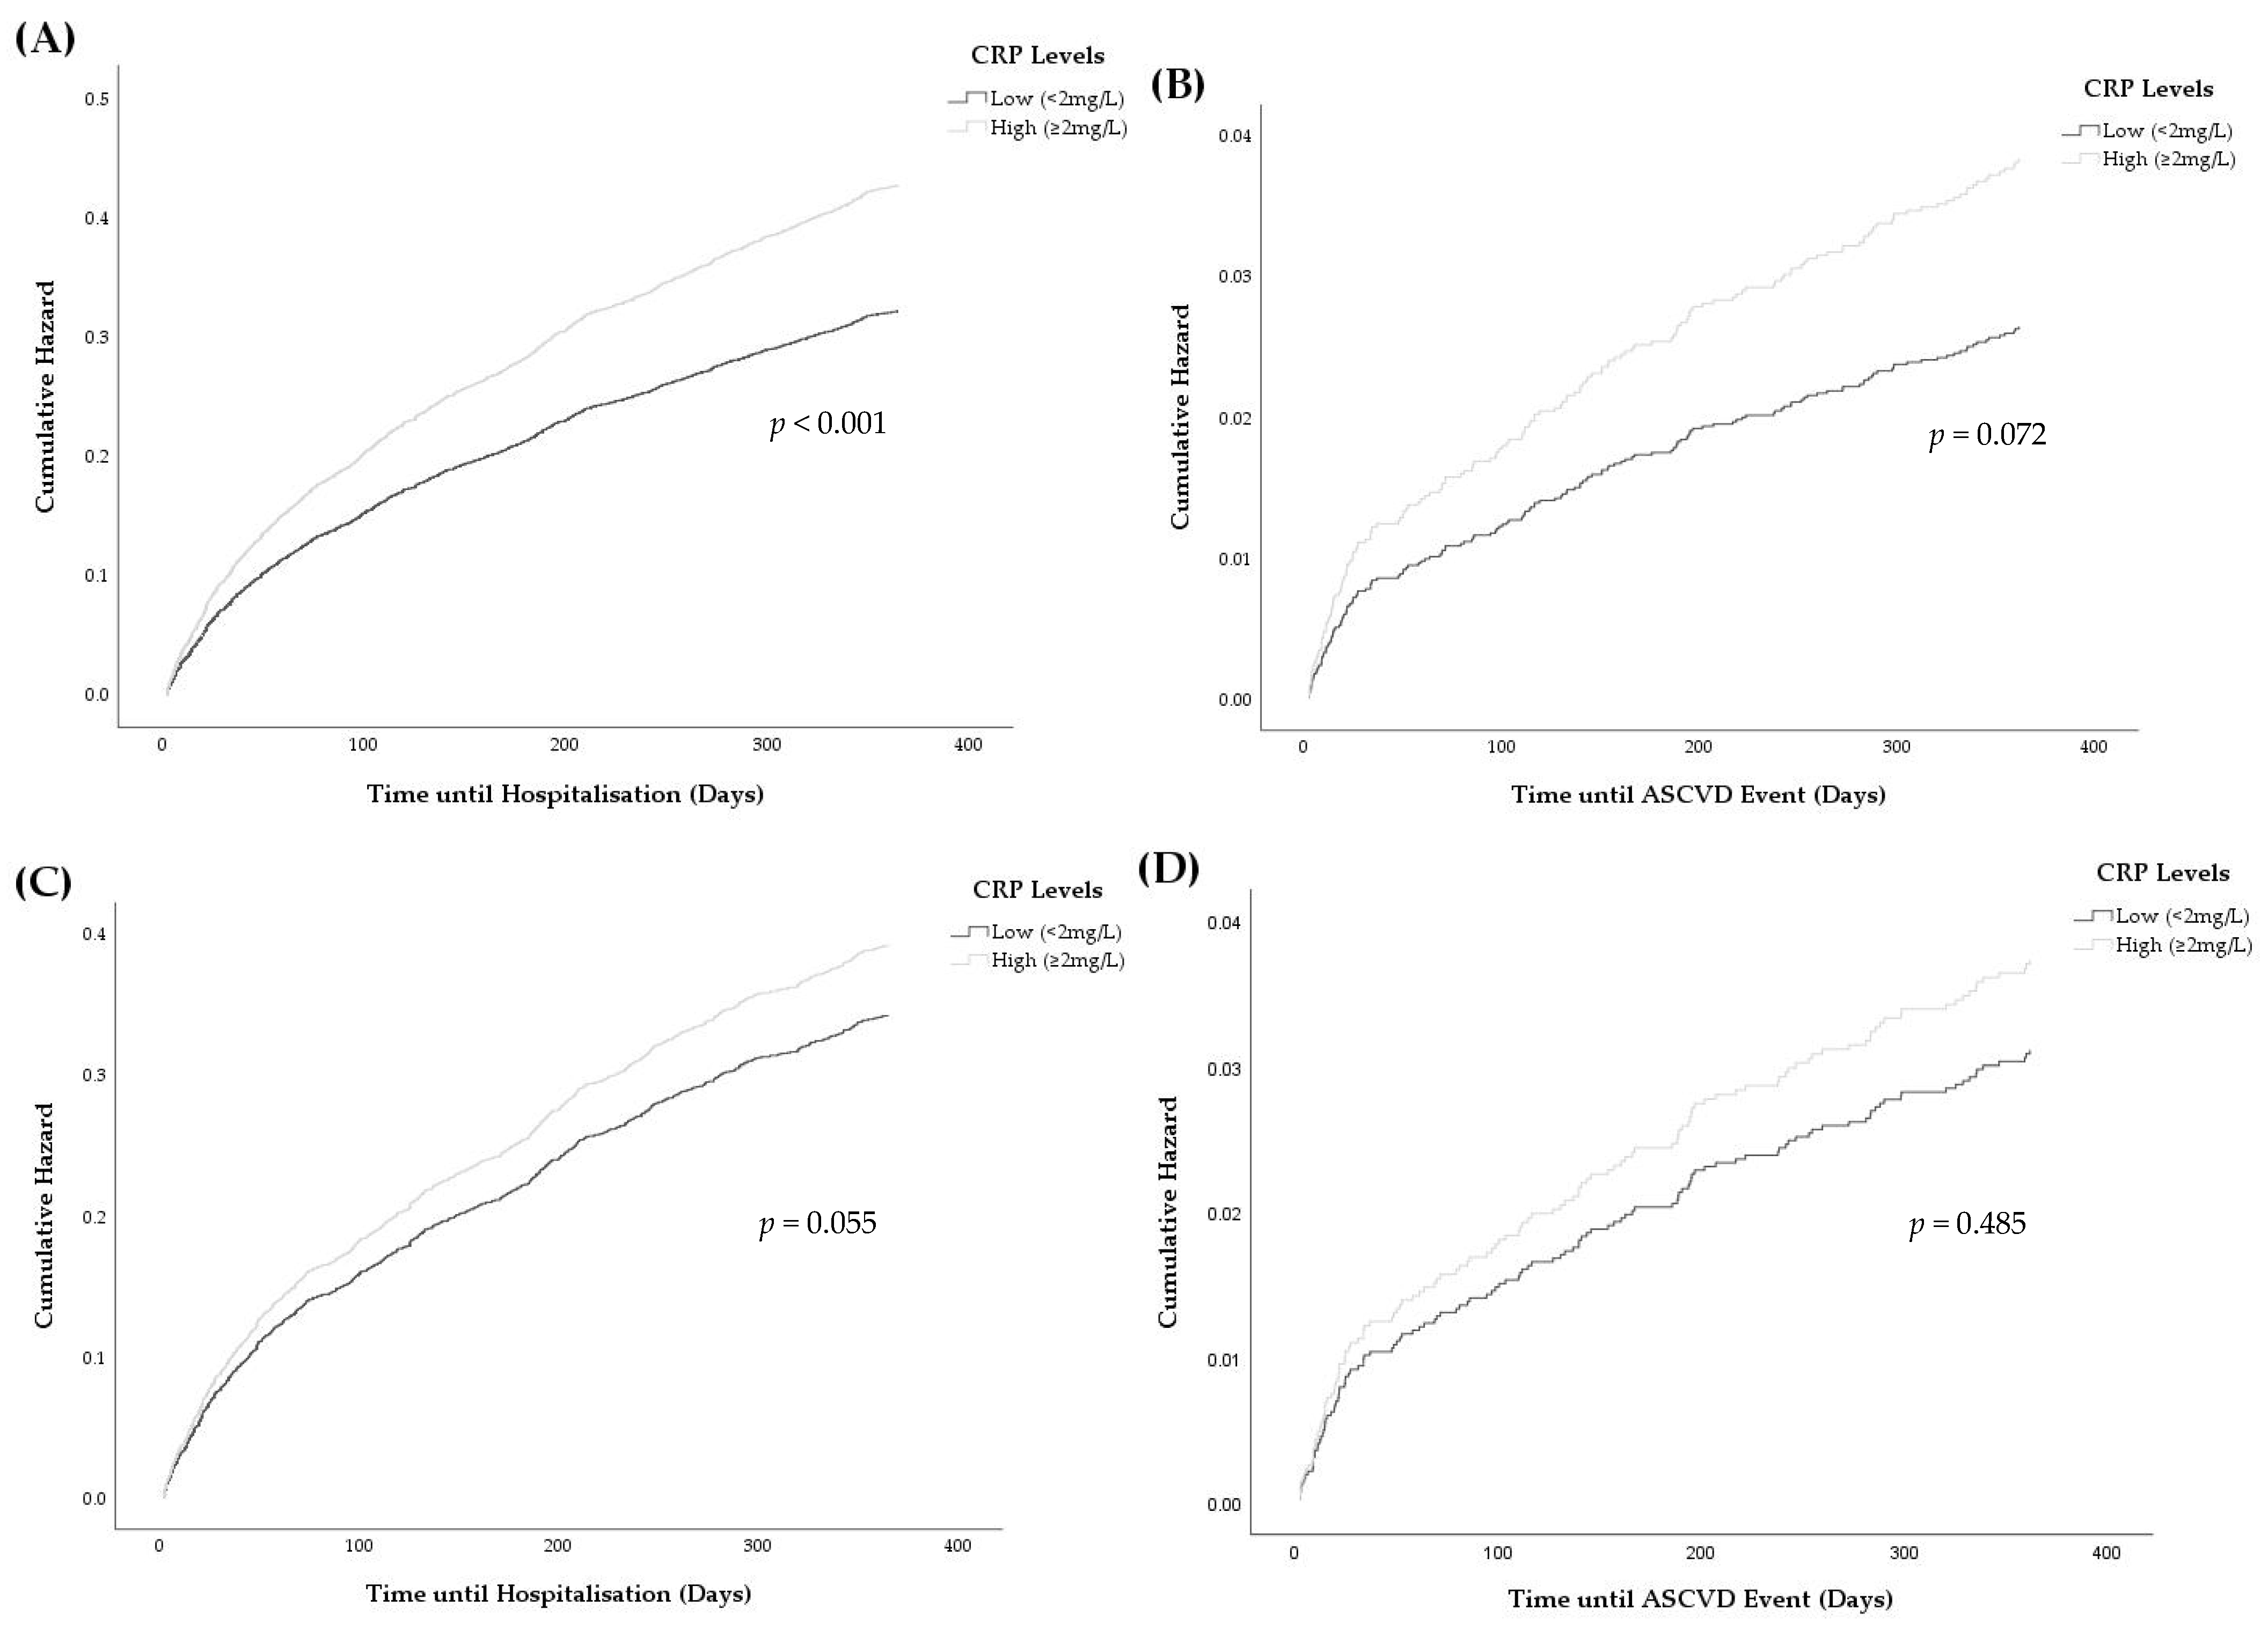
3.4. Associations between Elevated CRP and Hospitalisations
4. Discussion
5. Conclusions
Author Contributions
Funding
Institutional Review Board Statement
Informed Consent Statement
Data Availability Statement
Conflicts of Interest
Appendix A

| Medication | All ATC Codes Searched | ATC Codes Found in ePBRN | Medications Found in ePBRN |
|---|---|---|---|
| Statins |
C10AA C10BA01-09 C10BA11-12 C10BX | C10AA01 C10AA03 C10AA04 C10AA05 C10AA07 C10BA02 C10BA05 C10BX03 | Simvastatin Pravastatin Fluvastatin Atorvastatin Rosuvastatin Simvastatin and ezetimbe Atorvastatin and ezetimbe Atorvastatin and amlodipine |
| Fibrates |
C10AB C10BA03 C10BA04 C10BA09 C10BA12 | C10AB04 C10AB05 | Fenofibrate Gemfibrozil |
| Bile acid sequestrants | C10AC | C10AC01 C10AC02 | Cholestyramine Colestipol |
| Nicotinic acid |
C10AD C10BA01 | C10AD02 | Nicotinic acid |
| Cholesterol adsorption inhibitors |
C10AX09 C10BA02 C10BA05 C10BA06 C10BA10-12 | C10AX09 C10BA02 C10BA05 | Ezetimibe Simvastatin and ezetimbe Atorvastatin and ezetimbe |
| Other | C10 (not listed above) | C10AX08 | Policosanol |
| Medication Type | Medications |
|---|---|
| Statin Intensity | |
| Low | Simvastatin 10 mg Pravastatin 10–20 mg Fluvastatin 20–40 mg |
| Moderate | Simvastatin 20–40 mg Pravastatin 40–80 mg Fluvastatin 80 mg Atorvastatin 10–20 mg Rosuvastatin 5–10 mg |
| High | Atorvastatin 40–80 mg Rosuvastatin 20–40 mg |
| Statin Lipophilicity | |
| Lipophilic | Simvastatin Fluvastatin Atorvastatin |
| Hydrophilic | Pravastatin Rosuvastatin |
| 2012 | 2013 | 2014 | 2015 | 2016 | 2017 | 2018 | 2019 | p for Trend | |
|---|---|---|---|---|---|---|---|---|---|
| Number of total patients | 33,164 | 35,653 | 37,968 | 42,973 | 50,181 | 54,432 | 53,325 | 46,397 | - |
| Number of patients on lipid therapy ^ | 4689 (14.1) | 4914 (13.8) | 5213 (13.7) | 5630 (13.1) | 6903 (13.8) | 7795 (14.3) | 7819 (14.7) | 6824 (14.7) | 0.001 |
| Medication | |||||||||
| Statins | 4525 (88.4) | 4750 (88.0) | 5024 (88.0) | 5381 (87.4) | 6596 (87.4) | 7455 (87.8) | 7454 (86.9) | 6503 (87.5) | 0.009 |
| Fibrates | 159 (3.1) | 185 (3.4) | 219 (3.8) | 267 (4.3) | 331 (4.4) | 389 (4.6) | 414 (4.8) | 373 (5.0) | <0.001 |
| Bile acid sequestrants | 12 (0.2) | 13 (0.2) | 16 (0.3) | 19 (0.3) | 22 (0.3) | 28 (0.3) | 40 (0.5) | 27 (0.4) | 0.001 |
| Nicotinic acid | 2 (0.0) | 2 (0.0) | 2 (0.0) | 6 (0.1) | 4 (0.1) | 3 (0.0) | 4 (0.0) | 0 (0.0) | 0.332 |
| Cholesterol adsorption Inhibitors | 419 (8.2) | 448 (8.3) | 447 (7.8) | 482 (7.8) | 594 (7.9) | 618 (7.3) | 670 (7.8) | 529 (7.1) | 0.008 |
| Other | 0 (0.0) | 0 (0.0) | 0 (0.0) | 0 (0.0) | 1 (0.0) | 0 (0.0) | 0 (0.0) | 0 (0.0) | 0.959 |
| Form of Therapy | |||||||||
| Monotherapy (single medication) | 4276 (91.6) | 4451 (91.0) | 4741 (91.3) | 5131 (91.5) | 6298 (91.5) | 7131 (91.8) | 7100 (91.1) | 6247 (91.8) | 0.493 |
| Combination therapy (2 or more) | 413 (8.4) | 463 (9.0) | 472 (8.7) | 499 (8.5) | 605 (8.5) | 664 (8.2) | 719 (8.9) | 577 (8.2) | 0.493 |
| Statin Intensity * | |||||||||
| Low | 103 (2.5) | 107 (2.49) | 110 (2.41) | 114 (2.33) | 157 (2.61) | 166 (2.44) | 164 (2.43) | 133 (2.24) | 0.518 |
| Moderate | 2765 (67.1) | 2856 (66.5) | 3040 (66.6) | 3266 (66.7) | 4020 (66.9) | 4581 (67.4) | 4506 (66.7) | 3947 (66.5) | 0.913 |
| High | 1250 (30.4) | 1332 (31.0) | 1413 (31.0) | 1516 (31.0) | 1831 (30.5) | 2055 (30.2) | 2082 (30.8) | 1857 (31.3) | 0.743 |
| Statin Lipophilicity * | |||||||||
| Lipophilic | 2415 (58.6) | 2407 (56.0) | 2425 (53.1) | 2451 (50.1) | 2905 (48.4) | 3105 (45.6) | 3092 (45.8) | 2704 (45.5) | <0.001 |
| Hydrophilic | 1705 (41.4) | 1891 (44.0) | 2139 (46.9) | 2445 (49.9) | 3103 (51.6) | 3701 (54.4) | 3662 (54.2) | 3233 (54.5) | <0.001 |
| Male | Female | Odds Ratio for Female Gender (95% CI) | p-Value | |
|---|---|---|---|---|
| Low-intensity statin | 33 (37.9%) | 54 (62.1%) | Referent | - |
| Moderate-intensity statin | 926 (44.0%) | 1177 (56.0%) | 0.78 (0.50–1.21) | 0.262 |
| High-intensity statin | 558 (56.6%) | 428 (43.4%) | 0.47 (0.30–0.74) | 0.001 |
| 2012 | 2013 | 2014 | 2015 | 2016 | 2017 | 2018 | 2019 | p for Trend | |
|---|---|---|---|---|---|---|---|---|---|
| n | 4689 | 4914 | 5213 | 5630 | 6903 | 7795 | 7819 | 6824 | 0.001 |
| Age (years) | 64.0 (12.4) | 64.6 (12.4) | 64.9 (12.2) | 65.0 (12.2) | 65.3 (12.1) | 65.2 (12.3) | 65.5 (12.2) | 66.5 (11.9) | <0.001 |
| Males (%) | 51.4 | 51.8 | 51.6 | 52.6 | 51.8 | 50.8 | 51.7 | 51.5 | 0.596 |
| ATSI (%) | 1.2 | 1.2 | 1.1 | 1.1 | 1.1 | 1.3 | 1.3 | 1.5 | 0.121 |
| Living location (%) | |||||||||
| Urban | 52.6 | 54.1 | 53.9 | 53.6 | 57.7 | 58.5 | 58.0 | 57.8 | |
| Non-urban | 47.4 | 45.9 | 46.1 | 46.4 | 42.3 | 41.5 | 42.0 | 42.2 | <0.001 |
| 2012 | 2013 | 2014 | 2015 | 2016 | 2017 | 2018 | 2019 | p for Trend | |
|---|---|---|---|---|---|---|---|---|---|
| Age Group | |||||||||
| Any Lipid Therapy | |||||||||
| 18–44 | 335 (1.9) | 304 (1.6) | 302 (1.5) | 321 (1.5) | 356 (1.4) | 438 (1.5) | 405 (1.5) | 286 (1.3) | <0.001 |
| 45–54 | 779 (12.2) | 788 (11.8) | 787 (11.3) | 835 (11.2) | 994 (10.6) | 1127 (12.3) | 1083 (12.2) | 860 (11.2) | 0.797 |
| 55–64 | 1433 (30.9) | 1455 (28.7) | 1557 (27.8) | 1652 (25.3) | 1978 (26.4) | 2225 (27.7) | 2217 (28.0) | 1873 (25.9) | <0.001 |
| 65–74 | 1176 (43.9) | 1325 (44.5) | 1449 (43.7) | 1615 (39.9) | 2050 (44.4) | 2321 (45.3) | 2379 (45.5) | 2174 (43.0) | 0.295 |
| 75–84 | 784 (49.9) | 828 (47.9) | 894 (48.0) | 955 (43.5) | 1202 (49.0) | 1324 (50.5) | 1355 (51.7) | 1289 (51.4) | <0.001 |
| 85+ | 182 (39.5) | 214 (40.4) | 224 (37.0) | 252 (31.0) | 323 (35.6) | 360 (35.7) | 380 (37.8) | 342 (35.6) | 0.307 |
| Statin Therapy | |||||||||
| 18–44 | 310 (1.8) | 287 (1.5) | 281 (1.4) | 293 (1.3) | 328 (1.2) | 399 (1.4) | 373 (1.4) | 266 (1.2) | <0.001 |
| 45–54 | 753 (11.8) | 766 (11.4) | 755 (10.9) | 794 (10.6) | 936 (10.0) | 1072 (11.7) | 1017 (11.4) | 809 (10.5) | 0.797 |
| 55–64 | 1381 (29.8) | 1407 (27.7) | 1499 (26.8) | 1596 (24.4) | 1903 (25.4) | 2144 (26.7) | 2127 (26.9) | 1797 (24.9) | <0.001 |
| 65–74 | 1140 (42.6) | 1279 (43.0) | 1401 (42.3) | 1541 (38.1) | 1970 (42.6) | 2216 (43.3) | 2270 (43.4) | 2062 (40.7) | 0.966 |
| 75–84 | 764 (48.7) | 800 (46.3) | 869 (46.7) | 913 (41.6) | 1144 (46.6) | 1273 (48.6) | 1299 (49.6) | 1236 (49.2) | 0.005 |
| 85+ | 177 (38.4) | 211 (39.8) | 219 (36.1) | 244 (30.1) | 315 (34.7) | 351 (34.8) | 368 (36.6) | 333 (34.7) | 0.256 |
| Non-Statin Therapy | |||||||||
| 18–44 | 25 (0.1) | 17 (0.1) | 21 (0.1) | 28 (0.1) | 28 (0.1) | 39 (0.1) | 32 (0.1) | 20 (0.1) | 0.557 |
| 45–54 | 26 (0.4) | 22 (0.3) | 32 (0.5) | 41 (0.6) | 58 (0.6) | 55 (0.6) | 66 (0.8) | 51 (0.7) | <0.001 |
| 55–64 | 52 (1.1) | 48 (1.0) | 58 (1.0) | 56 (0.9) | 75 (1.0) | 81 (1.0) | 90 (1.1) | 76 (1.1) | 0.614 |
| 65–74 | 36 (1.4) | 46 (1.6) | 48 (1.5) | 74 (1.8) | 80 (1.7) | 105 (2.1) | 109 (2.1) | 112 (2.2) | <0.001 |
| 75–84 | 20 (1.3) | 28 (1.6) | 25 (1.3) | 42 (1.9) | 58 (2.4) | 51 (2.0) | 56 (2.1) | 53 (2.1) | 0.010 |
| 85+ | 5 (1.1) | 3 (0.6) | 5 (0.8) | 8 (1.0) | 8 (0.9) | 9 (0.9) | 12 (1.2) | 9 (0.9) | <0.001 |
| Sex Group | |||||||||
| Any Lipid Therapy | |||||||||
| Male | 2411 (16.4) | 2544 (15.9) | 2688 (15.8) | 2960 (15.5) | 3566 (15.9) | 3952 (16.2) | 4036 (17.0) | 3513 (17.1) | <0.001 |
| Female | 2277 (12.4) | 2369 (12.1) | 2523 (12.1) | 2668 (11.2) | 3335 (12.0) | 3839 (12.8) | 3780 (12.9) | 3309 (12.9) | <0.001 |
| Statin Therapy | |||||||||
| Male | 2324 (15.8) | 2464 (15.4) | 2585 (15.2) | 2830 (14.8) | 3413 (15.2) | 3779 (15.5) | 3843 (16.2) | 3349 (16.3) | 0.002 |
| Female | 2200 (12.0) | 2285 (11.6) | 2437 (11.7) | 2549 (10.7) | 3181 (11.5) | 3672 (12.3) | 3608 (12.3) | 3152 (12.3) | 0.001 |
| Non-Statin Therapy | |||||||||
| Male | 87 (0.59) | 80 (0.5) | 103 (0.61) | 130 (0.68) | 153 (0.69) | 173 (0.71) | 193 (0.81) | 164 (0.8) | <0.001 |
| Female | 77 (0.42) | 84 (0.43) | 86 (0.41) | 119 (0.5) | 154 (0.55) | 167 (0.55) | 172 (0.59) | 157 (0.61) | <0.001 |
| Living Location | |||||||||
| Any Lipid Therapy | |||||||||
| Urban | 2460 (11.3) | 2652 (11.2) | 2807 (11.2) | 3016 (10.4) | 3972 (12.1) | 4552 (13.1) | 4527 (13.9) | 3940 (14.1) | <0.001 |
| Non-urban | 2220 (19.7) | 2253 (19.1) | 2400 (18.7) | 2606 (19.0) | 2912 (17.0) | 3228 (16.6) | 3283 (16.0) | 2877 (15.8) | <0.001 |
| Statin Therapy | |||||||||
| Urban | 2358 (10.8) | 2549 (10.8) | 2689 (10.8) | 2868 (9.8) | 3783 (11.5) | 4347 (12.5) | 4326 (13.3) | 3755 (13.4) | <0.001 |
| Non-urban | 2158 (19.1) | 2192 (18.6) | 2329 (18.1) | 2505 (18.3) | 2795 (16.3) | 3093 (15.9) | 3119 (15.2) | 2741 (15.0) | <0.001 |
| Non-Statin Therapy | |||||||||
| Urban | 102 (0.47) | 103 (0.43) | 118 (0.47) | 148 (0.51) | 189 (0.58) | 205 (0.59) | 201 (0.61) | 185 (0.66) | <0.001 |
| Non-urban | 62 (0.55) | 61 (0.52) | 71 (0.55) | 101 (0.74) | 117 (0.68) | 135 (0.69) | 164 (0.8) | 136 (0.75) | <0.001 |
| Demographic Factor | n | Univariable Analysis | Multivariable Analysis | ||
|---|---|---|---|---|---|
| OR (95% CI) | p | OR (95% CI) | p | ||
| Age (year) | 9109 | 1.03 (1.02–1.03) | <0.001 | 1.03 (1.02–1.03) | <0.001 |
| Male gender | 4670 | 0.99 (0.91–1.08) | 0.846 | - | - |
| ATSI | 117 | 0.70 (0.48–1.00) | 0.052 | 0.74 (0.51–1.07) | 0.108 |
| Non-urban residence | 3937 | 0.79 (0.73–0.86) | <0.001 | 0.78 (0.71–0.85) | <0.001 |
| Parameter | n | Estimate | Missing Data (%) |
|---|---|---|---|
| Demographic and Behavioural Factors | |||
| Age | 3224 | 67.2 (12.9) | 0 (0.0) |
| Male gender | 1543 | 47.9 | 0 (0.0) |
| ATSI | 24 | 0.8 | 28 (0.9) |
| Smoking status | |||
| Non-smoker | 1363 | 48.9 | |
| Ex-smoker | 1108 | 39.7 | |
| Smoker | 319 | 11.4 | |
| Overall | 2790 | 434 (13.5) | |
| Non-urban residence | 1118 | 34.7 | 5 (0.2) |
| Number of visits to GP in past year | 2918 | 19.6 (13.8) | 306 (9.5) |
| Elevated CRP | 1842 | 57.1 | 0 (0.0) |
| Medical Conditions | |||
| Arthritis | 1412 | 43.8 | 0 (0.0) |
| Cancer | 443 | 13.7 | 0 (0.0) |
| Atherosclerotic cardiovascular Disease | 975 | 30.2 | 0 (0.0) |
| Other cardiac disease | 638 | 19.8 | 0 (0.0) |
| Other vascular disease | 174 | 5.4 | 0 (0.0) |
| Diabetes | 1144 | 35.5 | 0 (0.0) |
| Dyslipidaemia | 997 | 30.9 | 0 (0.0) |
| Gastrointestinal | 834 | 25.9 | 0 (0.0) |
| Hepatobiliary | 193 | 6.0 | 0 (0.0) |
| Hypertension | 1945 | 60.3 | 0 (0.0) |
| Neurological | 140 | 4.3 | 0 (0.0) |
| Psychiatric | 809 | 25.1 | 0 (0.0) |
| Renal | 241 | 7.5 | 0 (0.0) |
| Respiratory | 810 | 25.1 | 0 (0.0) |
| Medication History | |||
| Anti-thrombotic medication | 1253 | 38.9 | 0 (0.0) |
| Diabetic medication a | 915 | 28.4 | 0 (0.0) |
| Cardiovascular medication | 2370 | 73.5 | 0 (0.0) |
| Statin intensity | |||
| Low | 87 | 2.7 | |
| Moderate | 2103 | 66.2 | |
| High | 986 | 31.1 | |
| Overall | 3176 | 48 (1.5) | |
| Lipophilic statin | 1575 | 48.9 | 0 (0.0) |
| Clinical Characteristics | |||
| Examination Results | |||
| BMI (kg/m2) | 2266 | 29.5 (26.0–33.6) | 958 (29.7) |
| Systolic blood pressure (mmHg) b | 888 | 132.33 (16.7) | 2336 (72.5) |
| Diastolic blood pressure (mmHg) b | 888 | 77.10 (10.5) | 2336 (72.5) |
| Full Blood Count | |||
| Haemoglobin (g/L) | 3117 | 135.6 (17.8) | 107 (3.3) |
| Mean red cell haemoglobin (pg) | 3085 | 29.8 (2.3) | 139 (4.3) |
| Mean red cell haemoglobin Concentration (g/L) | 3085 | 330.3 (13.1) | 139 (4.3) |
| Mean red cell volume (fL) | 3117 | 90.4 (6.0) | 107 (3.3) |
| RCC (1012/L) a | 3113 | 4.6 (0.6) | 111 (3.4) |
| RDW (%) | 3050 | 13.1 (12.3–14.0) | 174 (5.4) |
| Monocyte (109/L) | 3115 | 0.6 (0.5–0.7) | 109 (3.4) |
| Neutrophil (109/L) | 3117 | 4.5 (3.5–6.0) | 107 (3.3) |
| Lymphocyte (109/L) | 3117 | 2.0 (1.5–2.6) | 107 (3.3) |
| WBC (109/L) a | 3118 | 7.6 (6.2–9.2) | 106 (3.3) |
| Platelet (109/L) | 3113 | 243.7 (75.0) | 111 (3.4) |
| Serum Biochemistry | |||
| Bicarbonate (mmol/L) | 3029 | 25.9 (3.3) | 195 (6.1) |
| Chloride (mmol/L) | 3032 | 102.5 (4.3) | 192 (6.0) |
| Potassium (mmol/L) | 2978 | 4.5 (0.5) | 246 (7.6) |
| Sodium (mmol/L) | 3032 | 140.0 (3.2) | 192 (6.0) |
| Liver Function Tests | |||
| Albumin (g/L) | 2977 | 41.9 (4.12) | 247 (7.7) |
| Bilirubin (µmol/L) | 2843 | 9.0 (6–12) | 381 (11.8) |
| ALT (U/L) | 2847 | 23 (17–33) | 377 (11.7) |
| AST (U/L) | 2701 | 23 (20–30) | 523 (16.2) |
| ALP (U/L) | 2853 | 75 (61–92) | 371 (11.5) |
| GGT (U/L) | 2852 | 30 (19–51) | 372 (11.5) |
| Total protein (g/L) | 2856 | 70.6 (5.9) | 368 (11.4) |
| Kidney Function Tests | |||
| Creatinine (µmol/L) | 3031 | 80 (67–96) | 193 (6.0) |
| eGFR | |||
| 1 | 507 | 17.6 | |
| 2 | 811 | 28.2 | |
| 3a | 296 | 10.3 | |
| 3b | 344 | 12.0 | |
| 4 | 634 | 22.0 | |
| 5 | 286 | 9.9 | |
| Overall | 2878 | 346 (10.7) | |
| Urea (mmol/L) | 3029 | 6.4 (5.1–8.1) | 195 (6.1) |
| Lipid Profiles | |||
| Total cholesterol (mmol/L) b | 1242 | 4.5 (1.2) | 1982 (61.5) |
| HDL-C (mmol/L) b | 942 | 1.3 (0.4) | 2282 (70.8) |
| LDL-C (mmol/L) b | 902 | 2.4 (1.0) | 2322 (72.0) |
| Non-HDL cholesterol (mmol/L) b | 942 | 3.2 (1.1) | 2282 (70.8) |
| Total:HDL cholesterol ratiob | 942 | 3.6 (1.2) | 2282 (70.8) |
| Triglyceride (mmol/L) b | 1236 | 1.4 (1.0–2.1) | 1988 (61.7) |
| Blood Glucose | |||
| Glucose (fasting) (mmol/L) b | 550 | 5.5 (4.9–6.5) | 2674 (82.9) |
| Glucose (random) (mmol/L) b | 1876 | 6.2 (5.3–7.9) | 1348 (41.8) |
| HbA1c (%) b | 1142 | 6.3 (5.7–7.4) | 2082 (64.6) |
| Parameters | Univariable Analysis | Multivariable Analysis | |||
|---|---|---|---|---|---|
| n | OR (95% CI) | p | OR (95% CI) | p | |
| Demographic and Behavioural Factors | |||||
| Age | 3224 | 1.01 (1.00–1.01) | 0.032 | ns | ns |
| Male gender | 1543 | 0.94 (0.82–1.08) | 0.370 | - | - |
| ATSI | 24 | 2.25 (0.89–5.67) | 0.087 | ns | ns |
| Smoking status | |||||
| Non-smoker | 1363 | Referent | - | - | - |
| Ex-smoker | 1108 | 1.24 (1.06–1.46) | 0.008 | ns | ns |
| Smoker | 319 | 1.41 (1.10–1.81) | 0.007 | ns | ns |
| Overall | 0.012 | ns | ns | ||
| Non-urban residence | 1118 | 1.92 (1.65–2.24) | <0.001 | 1.76 (1.46–2.13) | <0.001 |
| Number of visits to GP in past year | 2918 | 1.01 (1.01–1.02) | <0.001 | ns | ns |
| Medical Conditions | |||||
| Arthritis | 1412 | 1.02 (0.88–1.17) | 0.815 | - | - |
| Cancer | 443 | 1.04 (0.85–1.28) | 0.687 | - | - |
| Atherosclerotic cardiovascular Disease | 975 | 0.97 (0.83–1.13) | 0.695 | - | - |
| Other cardiac disease | 638 | 1.17 (0.98–1.40) | 0.082 | ns | ns |
| Other vascular disease | 174 | 1.04 (0.76–1.42) | 0.803 | - | - |
| Diabetes | 1144 | 1.13 (0.98–1.32) | 0.100 | ns | ns |
| Dyslipidaemia | 997 | 0.83 (0.72–0.96) | 0.012 | ns | ns |
| Gastrointestinal | 834 | 1.05 (0.90–1.23) | 0.542 | - | - |
| Hepatobiliary | 193 | 1.55 (1.14–2.11) | 0.005 | 1.71 (1.16–2.52) | 0.007 |
| Hypertension | 1945 | 1.03 (0.89–1.18) | 0.724 | - | - |
| Neurological | 140 | 0.74 (0.53–1.04) | 0.082 | - | - |
| Psychiatric | 809 | 1.06 (0.90–1.25) | 0.471 | - | - |
| Renal | 241 | 1.41 (1.07–1.86) | 0.014 | ns | ns |
| Respiratory | 810 | 1.18 (1.0–1.39) | 0.047 | ns | ns |
| Medication History | |||||
| Anti-thrombotic medication | 1253 | 1.16 (1.0–1.33) | 0.048 | ns | ns |
| Diabetic medication a | 915 | 1.09 (0.93–1.27) | 0.297 | - | - |
| Cardiovascular medication | 2370 | 1.30 (1.11–1.52) | 0.001 | ns | ns |
| Statin intensity | |||||
| Low | 87 | Referent | - | - | - |
| Moderate | 2103 | 1.43 (0.93–2.20) | 0.100 | 1.42 (0.85–2.37) | 0.176 |
| High | 986 | 1.24 (0.80–1.93) | 0.329 | 1.14 (0.68–1.91) | 0.629 |
| Overall | 0.067 | 0.032 | |||
| Hydrophilic statin | 1575 | 1.09 (0.95–1.26) | 0.204 | 1.27 (1.07–1.51) | 0.007 |
| Clinical Characteristics | |||||
| Examination Results | |||||
| BMI (kg/m2) | 2266 | 1.02 (1.01–1.04) | <0.001 | - | - |
| Systolic blood pressure (mmHg) b | 888 | 1.00 (0.99–1.01) | 0.902 | - | - |
| Diastolic blood pressure (mmHg) b | 888 | 1.00 (0.99–1.01) | 0.810 | - | - |
| Full Blood Count | |||||
| Haemoglobin (g/L) | 3117 | 0.99 (0.99–0.99) | <0.001 | ns | ns |
| MCH (pg) | 3085 | 0.95 (0.92–0.98) | 0.001 | ns | ns |
| MCHC (g/L) | 3085 | 0.99 (0.98–0.99) | <0.001 | ns | ns |
| MCV (fL) | 3117 | 0.99 (0.98–1.00) | 0.209 | - | - |
| RCC (1012/L) a | 3113 | 0.87 (0.78–0.98) | 0.019 | - | - |
| RDW (%) | 3050 | 1.21 (1.15–1.27) | <0.001 | 1.20 (1.13–1.28) | <0.001 |
| Monocyte (109/L) | 3115 | 2.77 (2.02–3.78) | <0.001 | 2.64 (1.72–4.04) | <0.001 |
| Neutrophil (109/L) | 3117 | 1.17 (1.13–1.21) | <0.001 | 1.09 (1.04–1.13) | <0.001 |
| Lymphocyte (109/L) | 3117 | 0.99 (0.96–1.02) | 0.566 | - | - |
| WBC (109/L) a | 3118 | 1.11 (1.08–1.14) | <0.001 | ns | ns |
| Platelet (109/L) | 3113 | 1.00 (1.00–1.01) | <0.001 | 1.00 (1.00–1.00) | <0.001 |
| Serum Biochemistry | |||||
| Bicarbonate (mmol/L) | 3029 | 1.01 (0.99–1.03) | 0.358 | - | - |
| Chloride (mmol/L) | 3032 | 0.96 (0.94–0.98) | <0.001 | 0.92 (0.90–0.95) | <0.001 |
| Potassium (mmol/L) | 2978 | 0.95 (0.82–1.10) | 0.475 | - | - |
| Sodium (mmol/L) | 3032 | 0.98 (0.96–1.01) | 0.195 | 1.07 (1.03–1.11) | 0.001 |
| Liver Function Tests | |||||
| Albumin (g/L) | 2977 | 0.95 (0.93–0.97) | <0.001 | 0.96 (0.94–0.99) | 0.001 |
| Bilirubin (µmol/L) | 2843 | 0.98 (0.97–1.00) | 0.005 | 0.98 (0.97–1.00) | 0.007 |
| ALT (U/L) | 2847 | 1.00 (1.00–1.01) | 0.052 | ns | ns |
| AST (U/L) | 2701 | 1.00 (1.00–1.00) | 0.101 | ns | ns |
| ALP (U/L) | 2853 | 1.02 (1.01–1.02) | <0.001 | 1.01 (1.01–1.02) | <0.001 |
| GGT (U/L) | 2852 | 1.00 (1.00–1.00) | <0.001 | ns | ns |
| Total protein (g/L) | 2856 | 0.99 (0.98–1.01) | 0.415 | - | - |
| Kidney Function Tests | |||||
| Creatinine (µmol/L) | 3031 | 1.00 (1.00–1.00) | 0.009 | ns | ns |
| eGFR | |||||
| 1 | 507 | 1.01 (0.75–1.35) | 0.971 | 0.89 (0.64–1.24) | 0.493 |
| 2 | 811 | 1.06 (0.81–1.39) | 0.670 | 1.20 (0.82–1.74) | 0.349 |
| 3a | 296 | 1.64 (1.17–2.29) | 0.004 | 1.54 (1.03–2.30) | 0.035 |
| 3b | 344 | 1.29 (0.94–1.77) | 0.119 | 1.51 (1.07–2.12) | 0.019 |
| 4 | 634 | 1.08 (0.82–1.43) | 0.593 | 1.40 (0.97–2.01) | 0.071 |
| 5 | 286 | Referent | - | Referent | |
| Overall | 2878 | 0.014 | 0.003 | ||
| Urea (mmol/L) | 3029 | 1.04 (1.02–1.06) | <0.001 | ns | ns |
| Lipid Profiles | |||||
| Total cholesterol (mmol/L) b | 1242 | 1.08 (0.98–1.19) | 0.125 | - | - |
| HDL-C (mmol/L) b | 942 | 0.74 (0.53–1.05) | 0.095 | - | - |
| LDL-C (mmol/L) b | 902 | 1.18 (1.02–1.35) | 0.023 | - | - |
| Non-HDL cholesterol (mmol/L) b | 942 | 1.16 (1.02–1.30) | 0.019 | - | - |
| Total:HDL-C ratio b | 942 | 1.21 (1.08–1.36) | 0.001 | - | - |
| Triglyceride (mmol/L) b | 1236 | 1.06 (0.97–1.16) | 0.201 | - | - |
| Blood Glucose | |||||
| Glucose (fasting) (mmol/L) b | 550 | 1.03 (0.97–1.09) | 0.387 | - | - |
| Glucose (random) (mmol/L) b | 1876 | 1.04 (1.01–1.07) | 0.011 | - | - |
| HbA1c (%) b | 1142 | 1.14 (1.06–1.23) | 0.001 | - | - |
| Events | Model 1 (n = 3224) | Model 2 (n = 2562) | ||
|---|---|---|---|---|
| Event Rate (%) | Elevated CRP OR (95% CI) | Event Rate (%) | Elevated CRP OR (95% CI) | |
| All Hospitalisations | ||||
| 1 month | 287 | 1.15 (0.91–1.46) | 248 (7.7) | 0.99 (0.75–1.29) |
| 3 months | 546 | 1.30 (1.09–1.55) * | 441 (13.7) | 1.06 (0.87–1.31) |
| 6 months | 773 | 1.29 (1.11–1.49) * | 611 (19.0) | 1.10 (0.92–1.31) |
| 12 months | 1077 | 1.32 (1.17–1.50) * | 861 (26.7) | 1.16 (1.00–1.34) |
| ASCVD Hospitalisations | ||||
| 1 month | 36 | 0.58 (0.3–1.12) | 35 (1.1) | 0.57 (0.30–1.16) |
| 3 months | 54 | 0.91 (0.53–1.55) | 52 (1.6) | 0.82 (0.46–1.46) |
| 6 months | 83 | 1.15 (0.74–1.79) | 77 (2.4) | 1.02 (0.62–1.65) |
| 12 months | 131 | 1.39 (0.97–2.00) | 117 (3.6) | 1.16 (0.77–1.73) |
| Events | Model 3 (n = 1171) | Model 4 (n = 414) | ||
|---|---|---|---|---|
| Event Rate (%) | CRP ≥2 mg/L OR (95% CI) | Event Rate (%) | CRP ≥ 2 mg/L OR (95% CI) | |
| All-cause hospitalisations | 399 (34.1) | 1.13 (0.91–1.40) | 99 (23.9) | 0.99 (0.62–1.58) |
| ASCVD hospitalisations | 62 (2.3) | 1.13 (0.66–1.96) | 22 (5.3) | 1.54 (0.56–4.25) |
References
- Institute for Health Metrics and Evaluation. Global Burden of Disease. Available online: https://vizhub.healthdata.org/gbd-compare/ (accessed on 24 September 2020).
- Soehnlein, O.; Libby, P. Targeting inflammation in atherosclerosis—From experimental insights to the clinic. Nat. Rev. Drug Discov. 2021, 20, 589–610. [Google Scholar] [CrossRef] [PubMed]
- Rached, F.; Santos, R.D. The Role of Statins in Current Guidelines. Curr. Atheroscler. Rep. 2020, 22, 50. [Google Scholar] [CrossRef] [PubMed]
- Ridker, P.M.; Danielson, E.; Fonseca, F.A.H.; Genest, J.; Gotto, A.M.; Kastelein, J.J.P.; Koenig, W.; Libby, P.; Lorenzatti, A.J.; MacFadyen, J.G.; et al. Rosuvastatin to Prevent Vascular Events in Men and Women with Elevated C-Reactive Protein. N. Engl. J. Med. 2008, 359, 2195–2207. [Google Scholar] [CrossRef]
- Arnett, D.K.; Blumenthal, R.S.; Albert, M.A.; Buroker, A.B.; Goldberger, Z.D.; Hahn, E.J.; Himmelfarb, C.D.; Khera, A.; Lloyd-Jones, D.; McEvoy, J.W.; et al. 2019 ACC/AHA Guideline on the Primary Prevention of Cardiovascular Disease: A Report of the American College of Cardiology/American Heart Association Task Force on Clinical Practice Guidelines. Circulation 2019, 140, e596–e646. [Google Scholar] [CrossRef]
- Wolf, D.; Ley, K. Immunity and Inflammation in Atherosclerosis. Circ. Res. 2019, 124, 315–327. [Google Scholar] [CrossRef] [PubMed]
- Avan, A.; Tavakoly Sany, S.B.; Ghayour-Mobarhan, M.; Rahimi, H.R.; Tajfard, M.; Ferns, G. Serum C-reactive protein in the prediction of cardiovascular diseases: Overview of the latest clinical studies and public health practice. J. Cell. Physiol. 2018, 233, 8508–8525. [Google Scholar] [CrossRef]
- Ridker, P.M.; Everett, B.M.; Thuren, T.; MacFadyen, J.G.; Chang, W.H.; Ballantyne, C.; Fonseca, F.; Nicolau, J.; Koenig, W.; Anker, S.D.; et al. Antiinflammatory Therapy with Canakinumab for Atherosclerotic Disease. N. Engl. J. Med. 2017, 377, 1119–1131. [Google Scholar] [CrossRef]
- Nidorf, S.M.; Eikelboom, J.W.; Budgeon, C.A.; Thompson, P.L. Low-dose colchicine for secondary prevention of cardiovascular disease. J. Am. Coll. Cardiol. 2013, 61, 404–410. [Google Scholar] [CrossRef]
- South Western Sydney Primary Health Network (PHN). South West Sydney: Our Health in 2019: An in-Depth Study of the Health of the Population now and into the Future; South Western Sydney Primary Health Network (PHN): Sydney, Australia, 2019. [Google Scholar]
- Guo, G.N.; Jonnagaddala, J.; Farshid, S.; Huser, V.; Reich, C.; Liaw, S.T. Comparison of the cohort selection performance of Australian Medicines Terminology to Anatomical Therapeutic Chemical mappings. J. Am. Med. Inform. Assoc. 2019, 26, 1237–1246. [Google Scholar] [CrossRef]
- Vo, K.; Jonnagaddala, J.; Liaw, S.-T. Statistical supervised meta-ensemble algorithm for medical record linkage. J. Biomed. Inform. 2019, 95, 103220. [Google Scholar] [CrossRef]
- Sara MNehring, A.G.; Bhupendra CPatel, C. Reactive Protein. In StatPearls; StatPearls Publishing: Treasure Island, FL, USA, 2022. [Google Scholar]
- Department of Health and Aged Care. Modified Monash Model. Available online: https://www.health.gov.au/health-topics/rural-health-workforce/classifications/mmm (accessed on 14 July 2022).
- Stone, N.J.; Robinson, J.G.; Lichtenstein, A.H.; Merz, C.N.B.; Blum, C.B.; Eckel, R.H.; Goldberg, A.C.; Gordon, D.; Levy, D.; Lloyd-Jones, D.M.; et al. 2013 ACC/AHA Guideline on the Treatment of Blood Cholesterol to Reduce Atherosclerotic Cardiovascular Risk in Adults. Circulation 2014, 129, S1–S45. [Google Scholar] [CrossRef]
- Ward, N.C.; Watts, G.F.; Eckel, R.H. Statin Toxicity. Circ. Res. 2019, 124, 328–350. [Google Scholar] [CrossRef] [PubMed]
- The Royal College of Pathologists of Australasia. eGFR. Available online: https://www.rcpa.edu.au/Manuals/RCPA-Manual/Pathology-Tests/E/eGFR (accessed on 14 July 2022).
- The Royal Australian College of General Practitioners. Guidelines for Preventive Activities in General Practice, 9th ed.; The Royal Australian College of General Practitioners: Melbourne, Australia, 2016. [Google Scholar]
- Ofori-Asenso, R.; Ilomäki, J.; Zomer, E.; Curtis, A.J.; Zoungas, S.; Liew, D. A 10-Year Trend in Statin Use Among Older Adults in Australia: An Analysis Using National Pharmacy Claims Data. Cardiovasc. Drugs Ther. 2018, 32, 265–272. [Google Scholar] [CrossRef]
- Bayram, C.; Valenti, L.; Britt, H. General practice encounters with men. Aust. Fam. Physician 2016, 45, 171–174. [Google Scholar]
- Australian Institute of Health and Welfare. The Health of Australia’s Males. Available online: https://www.aihw.gov.au/reports/men-women/male-health/contents/who-are-australias-males (accessed on 14 July 2022).
- Imran, T.F.; Wong, A.; Schneeweiss, S.; Desai, R. Abstract 17590: Hydrophilic Statins Are Associated With a Lower Risk of Incident Heart Failure Than Lipophilic Statins in a Large National Database. Circulation 2017, 136, A17590. [Google Scholar] [CrossRef]
- Karlson, B.W.; Palmer, M.K.; Nicholls, S.J.; Lundman, P.; Barter, P.J. A VOYAGER Meta-Analysis of the Impact of Statin Therapy on Low-Density Lipoprotein Cholesterol and Triglyceride Levels in Patients With Hypertriglyceridemia. Am. J. Cardiol. 2016, 117, 1444–1448. [Google Scholar] [CrossRef]
- Vavlukis, A.; Vavlukis, M.; Daka Grapci, A.; Domazetovska, S.; Mladenovska, K. Head to Head Comparison of Efficacy and Safety of Atorvastatin and Rosuvastatin. EC Pharmacol. Toxicol. 2018, 6, 560. [Google Scholar]
- Zhang, L.; Zhang, S.; Yu, Y.; Jiang, H.; Ge, J. Efficacy and safety of rosuvastatin vs. atorvastatin in lowering LDL cholesterol: A meta-analysis of trials with East Asian populations. Herz 2020, 45, 594–602. [Google Scholar] [CrossRef] [PubMed]
- Armitage, J.; Baigent, C.; Barnes, E.; Betteridge, D.J.; Blackwell, L.; Blazing, M.; Bowman, L.; Braunwald, E.; Byington, R.; Cannon, C.; et al. Efficacy and safety of statin therapy in older people: A meta-analysis of individual participant data from 28 randomised controlled trials. Lancet 2019, 393, 407–415. [Google Scholar] [CrossRef]
- Gnjidic, D.; Wilson, N.; March, L.; Cumming, R.G.; Cameron, I.D.; Hilmer, S.N. Statin utilisation patterns in older Australians living in residential care: 1-year prevalence study. Intern. Med. J. 2015, 45, 106–109. [Google Scholar] [CrossRef]
- Schaffer, A.L.; Buckley, N.A.; Dobbins, T.A.; Banks, E.; Pearson, S.-A. The crux of the matter: Did the ABC’s Catalyst program change statin use in Australia? Med. J. Aust. 2015, 202, 591–594. [Google Scholar] [CrossRef]
- Yom-Tov, E.; Shembekar, J.; Barclay, S.; Muennig, P. The effectiveness of public health advertisements to promote health: A randomized-controlled trial on 794,000 participants. Npj Digit. Med. 2018, 1, 24. [Google Scholar] [CrossRef]
- Talic, S.; Marquina, C.; Ofori-Asenso, R.; Petrova, M.; Liew, D.; Owen, A.J.; Lybrand, S.; Thomson, D.; Ilomaki, J.; Zomer, E. Switching, persistence and adherence to statin therapy: A retrospective cohort study using the Australian national pharmacy data. Cardiovasc. Drugs Ther. 2021. online ahead of print. [Google Scholar] [CrossRef]
- Warren, J.R.; Falster, M.O.; Fox, D.; Jorm, L. Factors influencing adherence in long-term use of statins. Pharmacoepidemiol. Drug Saf. 2013, 22, 1298–1307. [Google Scholar] [CrossRef]
- Australian Institute of Health and Welfare. Rural & Remote Health; AIHW: Canberra, Australia, 2019. [Google Scholar]
- Touger, R.; Wood, B.R. A Review of Telehealth Innovations for HIV Pre-Exposure Prophylaxis (PrEP). Curr. HIV AIDS Rep. 2019, 16, 113–119. [Google Scholar] [CrossRef] [PubMed]
- Hogan, M.R.A. Clinical pharmacists connecting with patients in rural and remote towns via telehealth. In Proceedings of the 13th National Rural Health Conference, Darwin, Australia, 24–27 May 2015. [Google Scholar]
- Sever, P.S.; Poulter, N.R.; Chang, C.L.; Thom, S.A.; Hughes, A.D.; Welsh, P.; Sattar, N. Evaluation of C-reactive protein before and on-treatment as a predictor of benefit of atorvastatin: A cohort analysis from the Anglo-Scandinavian Cardiac Outcomes Trial lipid-lowering arm. J. Am. Coll. Cardiol. 2013, 62, 717–729. [Google Scholar] [CrossRef]
- Soedamah-Muthu, S.S.; Livingstone, S.J.; Charlton-Menys, V.; Betteridge, D.J.; Hitman, G.A.; Neil, H.A.; Bao, W.; DeMicco, D.A.; Preston, G.M.; Fuller, J.H.; et al. Effect of atorvastatin on C-reactive protein and benefits for cardiovascular disease in patients with type 2 diabetes: Analyses from the Collaborative Atorvastatin Diabetes Trial. Diabetologia 2015, 58, 1494–1502. [Google Scholar] [CrossRef] [PubMed]
- Australian Institute of Health and Welfare. Australian Health Measurement Survey: Report on the Pilot Test; AIHW: Canberra, Australia, 2004. [Google Scholar]


Publisher’s Note: MDPI stays neutral with regard to jurisdictional claims in published maps and institutional affiliations. |
© 2022 by the authors. Licensee MDPI, Basel, Switzerland. This article is an open access article distributed under the terms and conditions of the Creative Commons Attribution (CC BY) license (https://creativecommons.org/licenses/by/4.0/).
Share and Cite
Kadappu, P.; Jonnagaddala, J.; Liaw, S.-T.; Cochran, B.J.; Rye, K.-A.; Ong, K.L. Statin Prescription Patterns and Associations with Subclinical Inflammation. Medicina 2022, 58, 1096. https://doi.org/10.3390/medicina58081096
Kadappu P, Jonnagaddala J, Liaw S-T, Cochran BJ, Rye K-A, Ong KL. Statin Prescription Patterns and Associations with Subclinical Inflammation. Medicina. 2022; 58(8):1096. https://doi.org/10.3390/medicina58081096
Chicago/Turabian StyleKadappu, Preetham, Jitendra Jonnagaddala, Siaw-Teng Liaw, Blake J. Cochran, Kerry-Anne Rye, and Kwok Leung Ong. 2022. "Statin Prescription Patterns and Associations with Subclinical Inflammation" Medicina 58, no. 8: 1096. https://doi.org/10.3390/medicina58081096