

Long-Term Prognostic Value of Automated Measurements in Nuclear Cardiology: Comparisons with Expert Scoring

 ,
,
Abstract
:1. Introduction
2. Materials and Methods
2.1. Study Population
2.2. Stress Testing
2.3. Coronary Angiography and Angiographic Score
2.4. SPECT MPI & Semi-Quantification
2.5. Follow-Up
2.6. Statistical Analysis
3. Results
4. Discussion
5. Conclusions
Author Contributions
Funding
Institutional Review Board Statement
Informed Consent Statement
Data Availability Statement
Conflicts of Interest
References
- Germano, G.; Kavanagh, P.B.; Slomka, P.J.; Van Kriekinge, S.D.; Pollard, G.; Berman, D.S. Quantitation in gated perfusion SPECT imaging: The Cedars-Sinai approach. J. Nucl. Cardiol. 2007, 14, 433–454. [Google Scholar] [CrossRef]
- Ficaro, E.P.; Lee, B.C.; Kritzman, J.N.; Corbett, J.R. Corridor4DM: The Michigan method for quantitative nuclear cardiology. J. Nucl. Cardiol. 2007, 14, 455–465. [Google Scholar] [CrossRef] [PubMed]
- Garcia, E.V.; Faber, T.L.; Cooke, C.D.; Folks, R.D.; Chen, J.; Santana, C. The increasing role of quantification in clinical nuclear cardiology: The Emory approach. J. Nucl. Cardiol. 2007, 14, 420–432. [Google Scholar] [CrossRef] [PubMed]
- Cerqueira, M.D.; Weissman, N.J.; Dilsizian, V.; Jacobs, A.K.; Kaul, S.; Laskey, W.K.; Pennell, D.J.; Rumberger, J.A.; Ryan, T.; Verani, M.S. Standardized myocardial segmentation and nomenclature for tomographic imaging of the heart. A statement for healthcare professionals from the Cardiac Imaging Committee of the Council on Clinical Cardiology of the American Heart Association. J. Nucl. Cardiol. 2002, 9, 240–245. [Google Scholar] [CrossRef] [PubMed]
- Angelidis, G.; Samara, M.; Papathanassiou, M.; Satra, M.; Valotassiou, V.; Tsougos, I.; Psimadas, D.; Tzavara, C.; Alexiou, S.; Koutsikos, J.; et al. Impact of renin-angiotensin-aldosterone system polymorphisms on myocardial perfusion: Correlations with myocardial single photon emission computed tomography-derived parameters. J. Nucl. Cardiol. 2019, 26, 1298–1308. [Google Scholar] [CrossRef]
- Duvall, W.L.; Slomka, P.J.; Gerlach, J.R.; Sweeny, J.M.; Baber, U.; Croft, L.B.; Guma, K.A.; George, T.; Henzloval, M.J. High-efficiency SPECT MPI: Comparison of automated quantification, visual interpretation, and coronary angiography. J. Nucl. Cardiol. 2013, 20, 763–773. [Google Scholar] [CrossRef]
- Arsanjani, R.; Xu, Y.; Hayes, S.W.; Fish, M.; Lemley, M., Jr.; Gerlach, J.; Dorbala, S.; Berman, D.S.; Germano, G.; Slomka, P. Comparison of fully automated computer analysis and visual scoring for detection of coronary artery disease from myocardial perfusion SPECT in a large population. J. Nucl. Med. 2013, 54, 221–228. [Google Scholar] [CrossRef] [PubMed]
- Driessen, R.S.; Raijmakers, P.G.; Danad, I.; Stuijfzand, W.J.; Schumacher, S.P.; Leipsic, J.A.; Min, J.K.; Knuuti, J.; Lammertsma, A.A.; van Rossum, A.C.; et al. Automated SPECT analysis compared with expert visual scoring for the detection of FFR-defined coronary artery disease. Eur. J. Nucl. Med. Mol. Imaging 2018, 45, 1091–1100. [Google Scholar] [CrossRef]
- Angelidis, G.; Valotassiou, V.; Tsougos, I.; Tzavara, C.; Psimadas, D.; Theodorou, E.; Ziaka, A.; Giannakou, S.; Ziangas, C.; Skoularigis, J.; et al. Automated analysis vs. expert reading in nuclear cardiology: Correlations with the angiographic score. Medicina 2022, 58, 1432. [Google Scholar] [CrossRef]
- Verberne, H.J.; Acampa, W.; Anagnostopoulos, C.; Ballinger, J.; Bengel, F.; De Bondt, P.; Buechel, R.R.; Cuocolo, A.; van Eck-Smit, B.L.F.; Flotats, A.; et al. EANM procedural guidelines for radionuclide myocardial perfusion imaging with SPECT and SPECT/CT: 2015 revision. Eur. J. Nucl. Med. Mol. Imaging 2015, 42, 1929–1940. [Google Scholar] [CrossRef]
- Hesse, B.; Tägil, K.; Cuocolo, A.; Anagnostopoulos, C.; Bardie’s, M.; Bax, J.; Bengel, F.; Busemann Sokole, E.; Davies, G.; Dondi, M.; et al. EANM/ESC procedural guidelines for myocardial perfusion imaging in nuclear cardiology. Eur. J. Nucl. Med. Mol. Imaging 2005, 32, 855–897. [Google Scholar] [CrossRef] [PubMed]
- Kapur, A.; Latus, K.A.; Davies, G.; Dhawan, R.T.; Eastick, S.; Jarritt, P.H.; Roussakis, G.; Young, M.C. A comparison of three radionuclide myocardial perfusion tracers in clinical practice: The ROBUST study. Eur. J. Nucl. Med. Mol. Imaging 2002, 29, 1608–1616. [Google Scholar] [CrossRef] [PubMed]
- Georgoulias, P.; Demakopoulos, N.; Orfanakis, A.; Xydis, K.; Xaplanteris, P.; Vardas, P.; Fezoulidis, I. Evaluation of abnormal heart-rate recovery after exercise testing in patients with diabetes mellitus: Correlation with myocardial SPECT and chronotropic parameters. Nucl. Med. Commun. 2007, 28, 165–171. [Google Scholar] [CrossRef]
- Germano, G. Quantitative measurements of myocardial perfusion and function from SPECT (and PET) studies depend on the method used to perform those measurements. J. Nucl. Cardiol. 2018, 25, 925–928. [Google Scholar] [CrossRef] [PubMed]
- Momose, Μ.; Nakajima, Κ.; Nishimura, Τ. Prognostic significance of stress myocardial gated SPECT among Japanese patients referred for coronary angiography: A study of data from the J-ACCESS database. Eur. J. Nucl. Med. Mol. Imaging 2009, 36, 1329–1337. [Google Scholar] [CrossRef] [PubMed]
- Zhang, Χ.; Liu, Χ.; He, Ζ.Χ.; Shi, R.; Yang, M.; Gao, R.; Chen, J.; Yang, Y.; Fang, W. Long-term prognostic value of exercise 99mTc-MIBI SPET myocardial perfusion imaging in patients after percutaneous coronary intervention. Eur. J. Nucl. Med. Mol. Imaging 2004, 31, 655–662. [Google Scholar]
- Toyama, T.; Kasama, S.; Sato, M.; Sano, H.; Ueda, T.; Sasaki, T.; Nakahara, T.; Higuchi, T.; Tsushima, Y.; Kurabayashi, M. A 2-year prospective study on the differences in prognostic factors for major adverse cardiovascular, cerebrovascular and renal events between patients with mild and severe chronic kidney disease. Ann. Nucl. Cardiol. 2021, 7, 17–26. [Google Scholar] [CrossRef]
- Nakamura, S.; Kawano, Y.; Nakajima, K.; Hase, H.; Joki, N.; Hatta, T.; Nishimura, S.; Moroi, M.; Nakagawa, S.; Kasai, T.; et al. Prognostic study of cardiac events in Japanese patients with chronic kidney disease using ECG-gated myocardial Perfusion imaging: Final 3-year report of the J-ACCESS 3 study. J. Nucl. Cardiol. 2019, 26, 431–440. [Google Scholar] [CrossRef]
- Bucerius, J.; Joe, A.Y.; Herder, E.; Brockmann, H.; Biermann, K.; Palmedo, H.; Tiemann, K.; Biersack, H.J. Pathological 99mTc-sestamibi myocardial perfusion scintigraphy is independently associated with emerging cardiac events in elderly patients with known or suspected coronary artery disease. Acta Radiol. 2011, 52, 52–58. [Google Scholar] [CrossRef]
- Gimelli, A.; Aimo, A.; Pasanisi, E.M.; Coceani, M.A.; Clemente, A.; Emdin, M.; Shaw, L.J. Myocardial stress perfusion scintigraphy for outcome prediction in patients with severe left ventricular systolic dysfunction. Eur. J. Nucl. Med. Mol. Imaging 2021, 48, 3502–3511. [Google Scholar] [CrossRef]
- Koh, A.S.; Lye, W.K.; Chia, S.Y.; Salunat-Flores, J.; Sim, L.L.; Keng, F.Y.J.; Tan, R.S.; Chua, T.S. Long-term prognostic value of appropriate myocardial perfusion imaging. Am. J. Cardiol. 2017, 119, 1957–1962. [Google Scholar] [CrossRef] [PubMed]
- Lima, R.S.L.; Peclat, T.R.; Souza, A.C.A.H.; Nakamoto, A.M.K.; Neves, F.M.; Souza, V.F.; Glerian, L.B.; De Lorenzo, A. Prognostic value of a faster, low-radiation myocardial perfusion SPECT protocol in a CZT camera. Int. J. Cardiovasc. Imaging 2017, 33, 2049–2056. [Google Scholar] [CrossRef] [PubMed]
- Alexiou, S.; Georgoulias, P.; Angelidis, G.; Valotassiou, V.; Tsougos, I.; Psimadas, D.; Lakiotis, V.; Kaspiri, A.; Alexopoulos, D.; Apostolopoulos, D.; et al. Myocardial perfusion and left ventricular quantitative parameters obtained using gated myocardial SPECT: Comparison of three software packages. J. Nucl. Cardiol. 2018, 25, 911–924. [Google Scholar] [CrossRef]
- Wolak, A.; Slomka, P.J.; Fish, M.B.; Lorenzo, S.; Acampa, W.; Berman, D.S.; Germano, G. Quantitative myocardial-perfusion SPECT: Comparison of three state-of-the-art software packages. J. Nucl. Cardiol. 2008, 15, 27–34. [Google Scholar] [CrossRef] [PubMed]
- Knollmann, D.; Knebel, I.; Koch, K.C.; Gebhard, M.; Krohn, T.; Buell, U.; Schaefer, W.M. Comparison of SSS and SRS calculated from normal databases provided by QPS and 4D-MSPECT manufacturers and from identical institutional normals. Eur. J. Nucl. Med. Mol. Imaging 2008, 35, 311–318. [Google Scholar] [CrossRef] [PubMed]
- Johansson, L.; Lomsky, M.; Marving, J.; Ohlsson, M.; Svensson, S.E.; Edenbrandt, L. Diagnostic evaluation of three cardiac software packages using a consecutive group of patients. EJNMMI Res. 2011, 1, 22. [Google Scholar] [CrossRef] [PubMed]
- Knollmann, D.; Raptis, M.; Meyer, P.T.; Winz, O.H.; Krohn, T.; Schaefer, W.M. Quantitative myocardial perfusion-SPECT: Algorithm-specific influence of reorientation on calculation of summed stress score. Clin. Nucl. Med. 2012, 37, 1089–1093. [Google Scholar] [CrossRef] [PubMed]
- Johansson, L.; Edenbrandt, L.; Nakajima, K.; Lomsky, M.; Svensson, S.E.; Trägårdh, E. Computer-aided diagnosis system outperforms scoring analysis in myocardial perfusion imaging. J. Nucl. Cardiol. 2014, 21, 416–423. [Google Scholar] [CrossRef]
- Efe, S.Ç.; Özdemir Candan, Ö.; Gündoğan, C.; Öz, A.; Yüksel, Y.; Ayca, B.; Çermik, T.F. Value of C-reactive protein/albumin ratio for predicting ischemia in myocardial perfusion scintigraphy. Mol. Imaging Radionucl. Ther. 2020, 29, 112–117. [Google Scholar] [CrossRef]


| N (%) | |
|---|---|
| Gender | |
| Females | 144 (38.1) |
| Males | 234 (61.9) |
| Age, mean (SD) | 63.8 (9.6) |
| BMI, mean (SD) | 29.5 (5.4) |
| Symptoms | 272 (72) |
| Angina | 94 (24.9) |
| Angina-like symptoms | 104 (27.5) |
| Dyspnea | 86 (22.8) |
| Palpitations | 74 (19.6) |
| Fatigue | 72 (19) |
| Number of risk factors, median (IQR) | 3 (2–4) |
| Smoking | 148 (39.2) |
| Hypertension | 282 (74.6) |
| Diabetes | 130 (34.4) |
| Lipid Disorders | 300 (79.4) |
| Obesity | 158 (41.8) |
| Family history of coronary artery disease | 152 (40.2) |
| Comorbidities | 86 (22.8) |
| Peripheral angiopathy | 22 (5.8) |
| Stroke | 28 (7.4) |
| COPD | 50 (13.2) |
| LVEF, mean (SD) | 0.58 (0.05) |
| Coronary angiography | 378 (100) |
| Left main coronary artery | 0 (0) |
| Left anterior descending artery | 128 (33.9) |
| Left circumflex artery | 86 (22.8) |
| Right coronary artery | 128 (33.9) |
| Angiographic score, median (IQR) | 1 (0–2) |
| Therapy with cardioactive agents | 272 (72) |
| Bruce protocol | 154 (44) |
| Pharmacologic stress | 196 (56) |
| Hard events | 44 (11.6) |
| All-cause death | 24 (6.3) |
| Cardiovascular death | 14 (3.7) |
| Non-fatal myocardial infarction (post-scintigraphic study) | 18 (4.8) |
| Soft events | 120 (31.7) |
| Stroke (post-scintigraphic study) | 20 (5.3) |
| Hospitalization due to heart disorder (post-scintigraphic study) | 104 (27.5) |
| PTCA (post-scintigraphic study) | 46 (12.2) |
| CABG (post-scintigraphic study) | 8 (2.1) |
| Any cardiac event | 138 (36.5) |
| Method | Index | Mean (SD) | Median (IQR) |
|---|---|---|---|
| ECTb | SSS | 10.4 (5.9) | 10 (5–14) |
| SRS | 4.9 (3.2) | 4 (2–7) | |
| SDS | 5.6 (3.9) | 5 (2–8) | |
| MYO | SSS | 10.2 (5.6) | 10 (5–14) |
| SRS | 5.4 (3.4) | 5 (3–8) | |
| SDS | 4.8 (3.4) | 5 (2–7) | |
| QPS | SSS | 6.9 (3.9) | 7 (4–9) |
| SRS | 3 (2.2) | 2 (2–4) | |
| SDS | 3.8 (3) | 4 (1–6) | |
| Expert scoring | SSS | 5.4 (4) | 4 (2–9) |
| SRS | 1.4 (0.9) | 1 (1–2) | |
| SDS | 4 (3.5) | 3 (1–7) |
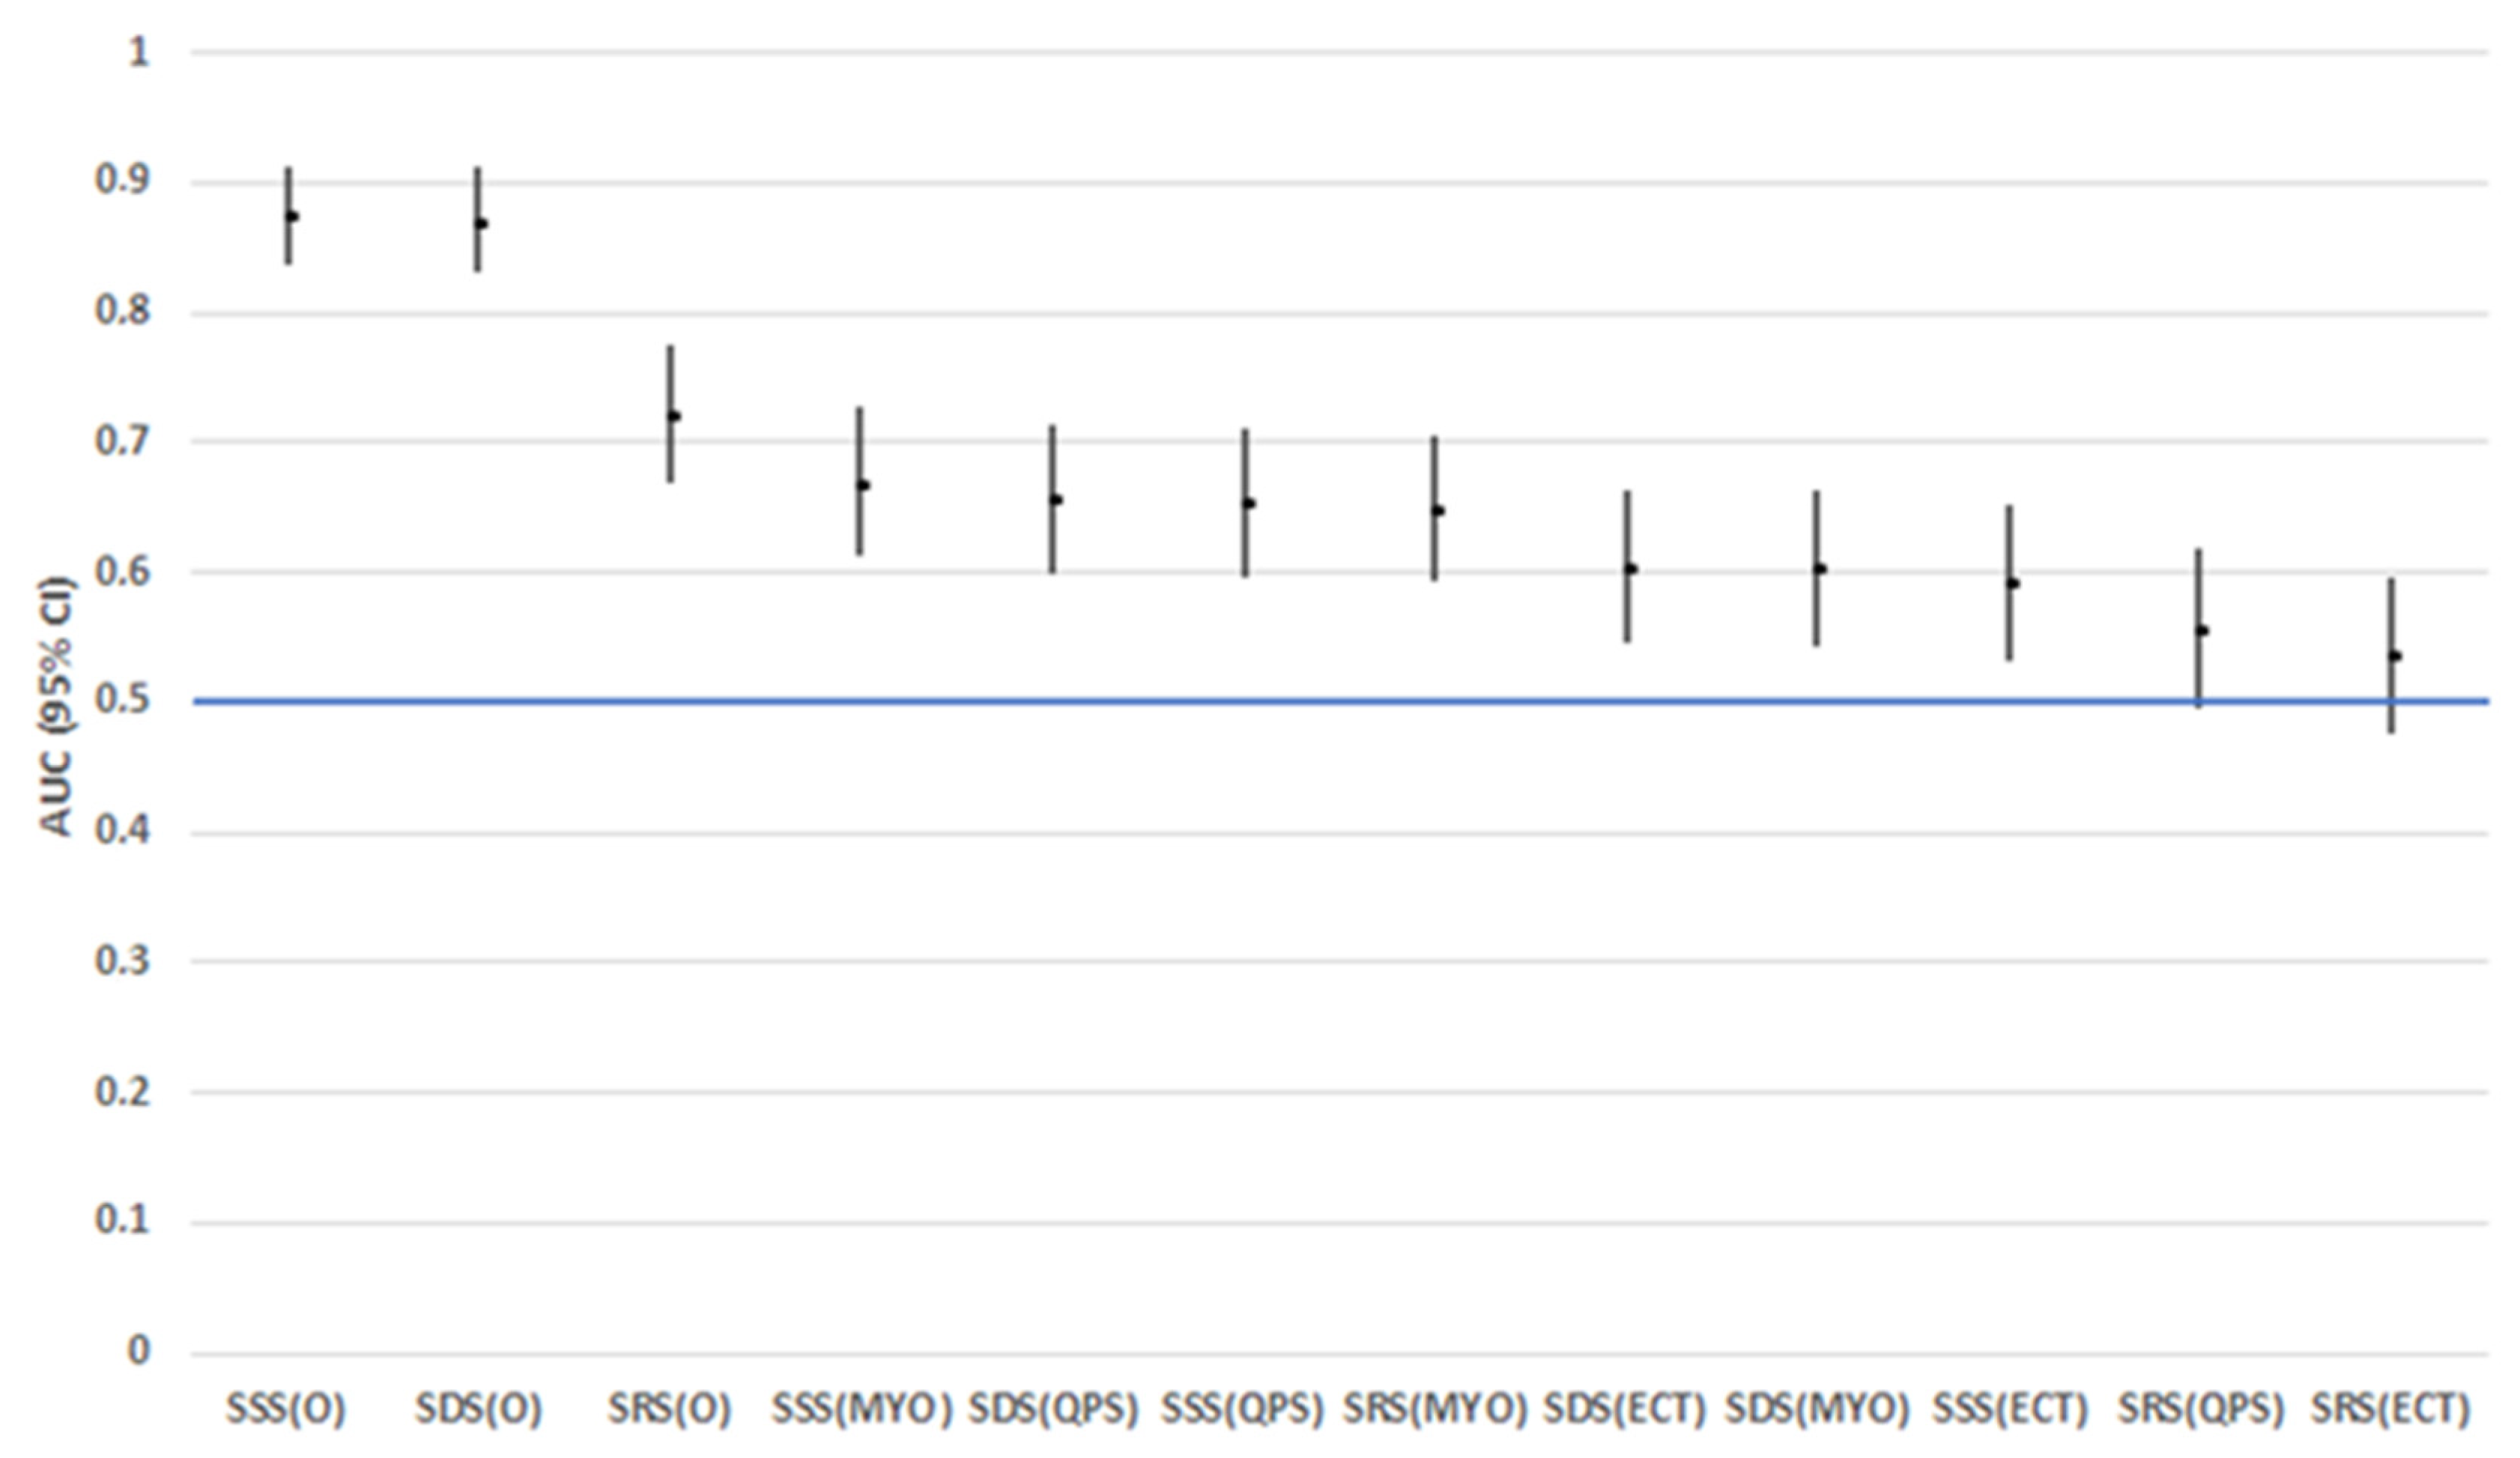
| Method | Index | AUC | 95% CI | p | Optimal Cut-Off | Sensitivity (%) | Specificity (%) |
|---|---|---|---|---|---|---|---|
| ECTb | SSS | 0.59 | 0.53–0.65 | 0.003 | 11.5 | 53.6 | 65.8 |
| SRS | 0.54 | 0.48–0.6 | 0.241 | - | - | - | |
| SDS | 0.60 | 0.55–0.66 | 0.001 | 5.5 | 63.8 | 58.3 | |
| MYO | SSS | 0.67 | 0.61–0.73 | <0.001 | 10.5 | 68.1 | 63.3 |
| SRS | 0.65 | 0.59–0.71 | <0.001 | 4.5 | 69.6 | 53.3 | |
| SDS | 0.60 | 0.54–0.66 | 0.001 | 4.5 | 62.3 | 54.2 | |
| QPS | SSS | 0.65 | 0.6–0.71 | <0.001 | 6.5 | 66.7 | 59.2 |
| SRS | 0.56 | 0.5–0.62 | 0.063 | - | - | - | |
| SDS | 0.66 | 0.6–0.71 | <0.001 | 2.5 | 75.4 | 54.2 | |
| Expert scoring | SSS | 0.88 | 0.84–0.91 | <0.001 | 4.5 | 89.9 | 75.8 |
| SRS | 0.72 | 0.67–0.77 | <0.001 | 1.5 | 60.9 | 75.8 | |
| SDS | 0.87 | 0.83–0.91 | <0.001 | 4.5 | 84.1 | 79.2 |
| Index | HR (95% CI) + | p | |
|---|---|---|---|
| ECTb | SSS | 1.03 (1.01–1.06) | 0.044 |
| SRS | 1.02 (0.97–1.07) | 0.423 | |
| SDS | 1.06 (1.01–1.10) | 0.015 | |
| MYO | SSS | 1.06 (1.03–1.09) | <0.001 |
| SRS | 1.11 (1.05–1.16) | <0.001 | |
| SDS | 1.06 (1.01–1.11) | 0.030 | |
| QPS | SSS | 1.08 (1.04–1.13) | <0.001 |
| SRS | 1.07 (0.99–1.15) | 0.084 | |
| SDS | 1.12 (1.06–1.19) | <0.001 | |
| Expert scoring | SSS | 1.32 (1.27–1.38) | <0.001 |
| SRS | 1.67 (1.42–1.97) | <0.001 | |
| SDS | 1.37 (1.31–1.44) | <0.001 |
Disclaimer/Publisher’s Note: The statements, opinions and data contained in all publications are solely those of the individual author(s) and contributor(s) and not of MDPI and/or the editor(s). MDPI and/or the editor(s) disclaim responsibility for any injury to people or property resulting from any ideas, methods, instructions or products referred to in the content. |
© 2023 by the authors. Licensee MDPI, Basel, Switzerland. This article is an open access article distributed under the terms and conditions of the Creative Commons Attribution (CC BY) license (https://creativecommons.org/licenses/by/4.0/).
Share and Cite
Angelidis, G.; Giannakou, S.; Valotassiou, V.; Tsougos, I.; Tzavara, C.; Psimadas, D.; Theodorou, E.; Ziaka, A.; Ziangas, C.; Skoularigis, J.; et al. Long-Term Prognostic Value of Automated Measurements in Nuclear Cardiology: Comparisons with Expert Scoring. Medicina 2023, 59, 1738. https://doi.org/10.3390/medicina59101738
Angelidis G, Giannakou S, Valotassiou V, Tsougos I, Tzavara C, Psimadas D, Theodorou E, Ziaka A, Ziangas C, Skoularigis J, et al. Long-Term Prognostic Value of Automated Measurements in Nuclear Cardiology: Comparisons with Expert Scoring. Medicina. 2023; 59(10):1738. https://doi.org/10.3390/medicina59101738
Chicago/Turabian StyleAngelidis, George, Stavroula Giannakou, Varvara Valotassiou, Ioannis Tsougos, Chara Tzavara, Dimitrios Psimadas, Evdoxia Theodorou, Anastasia Ziaka, Charalampos Ziangas, John Skoularigis, and et al. 2023. "Long-Term Prognostic Value of Automated Measurements in Nuclear Cardiology: Comparisons with Expert Scoring" Medicina 59, no. 10: 1738. https://doi.org/10.3390/medicina59101738