Abstract
Background and Objectives: Calcium-binding protein 39-like (CAB39L) has been reported to be downregulated and possessed diagnostic and prognostic values in several types of cancer. However, the clinical value and mechanism of CAB39L in kidney renal clear cell carcinoma (KIRC) remain unclear. Materials and Methods: Bioinformatics analysis was conducted using different databases including TCGA, UALCAN, GEPIA, LinkedOmics, STRING, and TIMER. One-way variance analysis and t-test were chosen to investigate the statistical differences of CAB39L expression in KIRC tissues with different clinical characteristics. The receiver operating characteristic (ROC) curve was chosen to assess the discriminatory capacity of CAB39L. Kaplan–Meier curves were employed for assessing the influence of CAB39L on the progression-free survival (PFS), disease-specific survival (DSS), and overall survival (OS) of KIRC patients. The independent prognostic significance of clinical parameters for OS such as CAB39L expression in KIRC patients was estimated by Cox analysis. A series of in vitro functional experiments and Western blot (WB) and immunohistochemistry (IHC) were used to validate the relative protein expression and function of CAB39L. Results: The mRNA and protein levels of CAB39L were relatively downregulated in KIRC samples. Meanwhile, hypermethylation of the CAB39L promoter region was possibly associated with its low expression in KIRC. The ROC curve showed that the mRNA expression of CAB39L had a strong diagnostic value for both early and late KIRC. Kaplan–Meier survival curves indicated that a higher mRNA level of CAB39L predicted good PFS, DSS, and OS. The mRNA expression of CAB39L was an independent prognostic factor (hazard ratio = 0.6, p = 0.034) identified by multivariate Cox regression analysis. The Kyoto Encyclopedia of Genes and Genomes (KEGG) and Gene Ontology (GO) analysis exhibited that CAB39L was mainly associated with substance and energy metabolism. Finally, overexpression of CAB39L impaired the proliferation and metastasis of KIRC cells in vitro. Conclusions: CAB39L possesses prognostic and diagnostic capacity in KIRC.
1. Introduction
Renal cell carcinoma (RCC) is known as one of the most common malignant cancers worldwide, ranking as the sixth most common cancer in males and the ninth in females [1]. Patients with kidney renal clear cell carcinoma (KIRC) account for nearly 80% of RCC patients; therefore, it is regarded as the most common histological subtype [1,2]. As KIRC symptoms in the early stage are insidious, approximately 30% of patients with KIRC are diagnosed in the late stage [3]. Moreover, most patients with KIRC are resistant to chemotherapy and radiotherapy, and surgery becomes the optimal treatment for KIRC [2,4,5]. Although the treatment of KIRC has been enriched by immunotherapy and targeted therapy, patients with advanced and metastatic KIRC who have lost the opportunity to have surgery still have dismal outcomes [6,7,8]. Hence, there is an urgent demand for discovering new sensitive biomarkers and therapeutic targets to predict and enhance the prognosis of KIRC.
Calcium-binding protein 39-like (CAB39L) is a β-isoform of CAB39 and a scaffold protein that combines and stabilizes the liver kinase B1 (LKB1) protein in an activated conformation necessary for the phosphorylation of substrates [9,10]. More and more evidence is emerging to indicate that CAB39L plays an anti-tumor role in many cancers, such as breast cancer and gastric cancer [11,12], but the clinical significance and function of CAB39L in KIRC have not been reported.
In this study, bioinformatics analysis was executed to identify the effect of CAB39L in KIRC tumorigenesis and prognosis. The results found that KIRC tissues had significantly lower CAB39L expression than normal kidney tissues, which was associated with poor prognosis and advanced clinical stage. It was also noticed that CAB39L had a strong diagnostic value regardless of early or late KIRC. In addition, the overexpression of CAB39L in KIRC had an impact on its proliferation, migration, and invasion. To sum up, CAB39L may be applied as a promising diagnostic and prognostic biomarker in KIRC.
2. Materials and Methods
2.1. Data Resource and Processing
Level 3 gene expression profiles (workflow type: HTSeq-FPKM) were downloaded from the KIRC dataset on The Cancer Genome Atlas (TCGA) portal (https://portal.gdc.cancer.gov/, accessed on 3 March 2022), including 539 KIRC specimens and 72 corresponding tumor-adjacent tissues. HTSeq-FPKM values were transformed into TPM values for further analysis. Meanwhile, the corresponding clinicopathological data of KIRC patients were extracted from TCGA. For the pan-cancer analysis, UCSC Xena (https://xenabrowser.net/, accessed on 3 March 2022) was used to download RNA-Seq data containing 33 cancer types from Genotype-Tissue Expression (GTEx) and TCGA database. The median mRNA expression of CAB39L was defined as a cut-off to sort KIRC patients.
2.2. Comprehensive Analysis
TIMER (https://cistrome.shinyapps.io/timer/, accessed on 3 March 2021) [13] was chosen to explore the mRNA expression of CAB39L in KIRC samples and normal adjacent samples.
GEPIA (http://gepia.cancer-pku.cn/, accessed on 3 March 2021) [14] is a comprehensive website that analyzes and visualizes the RNA data of different tumors and normal samples. On this basis, the mRNA expression of CAB39L was compared between KIRC and normal samples in this study. The mRNA expression of CAB39L at different pathologic stages was also evaluated.
UALCAN (http://ualcan.path.uab.edu/index.html/, accessed on 3 March 2021) [15] is a bioinformatics platform that provides easy access to investigate the relationship between gene expression (mRNA or protein) and clinicopathological data. In this study, the promoter methylation of CAB39L was also evaluated based on different clinicopathological features.
LinkedOmics (http://www.linkedomics.org/admin.php/, accessed on 4 March 2021) [16] is an online platform that processes multi-omics data from TCGA database. In this study, CAB39L co-expressed genes in KIRC were searched and examined by GO and KEGG pathway enrichment analysis.
HPA (https://www.proteinatlas.org/, accessed on 4 March 2021) [17] was applied to compare the CAB39L expression between KIRC specimens and normal kidney tissue samples.
MethSurv (https://biit.cs.ut.ee/methsurv/, accessed on 4 March 2021) [18] was applied to explore the methylation status of different CpG sites located at the CAB39L gene promoter region.
2.3. Screening of Differentially Expressed Genes (DEGs) and Functional Enrichment Analysis
The R package “DESeq2” [19] was run to filter DEGs between KIRC samples with high and low CAB39L expression. |logFC| ≥ 2 and p < 0.05 were defined as the filter criteria. The results of DEGs were displayed in a volcano plot using the R package “ggplot2”. The top 15 downregulated and upregulated CAB39L-related DEGs were further chosen to perform GO and KEGG analysis by running the “clusterProfiler” package [20].
2.4. Interaction Analysis
STRING (https://string-db.org/, accessed on 4 March 2021) [21] was applied to establish a protein–protein interaction (PPI) network of CAB39L. The prediction pathways of CAB39L and its associated proteins were also analyzed by GO and KEGG.
2.5. Cell Culture and Transfection
Human KIRC cells A-498 and 786-O were purchased from ATCC. All cells were cultured in MEM medium (Gibico, Waltham, MA, USA) containing 10% FBS (Sturgeon Bay, WI, USA). The CAB39L overexpression vector and the empty control vector were bought from RiboBio (Guangzhou, China), and corresponding vectors mixed with jetPRIME transfection reagent (Polyplus, Strasbourg, France) were applied to transfect cells according to the manufacturer’s instructions. Here, 30–40% confluence off cells in 6 cm dishes was cultured in 3 mL complete medium and transfection mixtures (2 μg pcDNA3.1 empty vectors/pcDNA3.1 CAB39L-overexpression vectors, transfection reagent A 300 μL, and transfection reagent B 4 μL) for 48 h before in vitro functional experiments.
2.6. In Vitro Functional Experiments
The cell proliferation capacity was evaluated using colony formation assay and cell counting kit 8 (CCK-8). Here, 2000 pretreated cells were seeded in each well of the 96-well plate for the CCK-8 assay. The absorbance value at 450 nm was determined after the addition of 10 μL CCK-8 reagent (MCE, NJ, USA) in each well for 1 h at 37 °C. As for the colony formation assay, 500 pretreated KIRC cells were seeded in each well of the six-well plate for 2 weeks. Relative colony rates were calculated after staining with 0.2% crystal violet and fixing in 4% paraformaldehyde. The cell migration and invasion abilities were measured using the transwell assay. Then, 200 μL serum-free DMEM medium with 2 × 10⁴ pretreated cells were injected into the upper transwell chamber (Corning, New York, NY, USA) for migration assay. Similarly, cells were seeded in the upper transwell chamber precoated with Matrigel (Corning, New York, NY, USA) for invasion assay. As an attractant, 700 μL DMEM medium (10% FBS) was injected into the lower chamber. Migration or invasion assays were also subsequently treated with 4% paraformaldehyde and 0.2% crystal violet after 48 h.
2.7. Western Blot (WB)
Cells were mixed with RIPA lysis buffer (Fdbio, Hangzhou, China) and underwent 6 s ultrasonic disruption for complete lysing. The concentration of protein following 12,000× g centrifugation was quantified by a BCA protein assay kit (Fdbio, Hangzhou, China). Proteins were subsequently divided by 10% SDS-polyacrylamide gel electrophoresis and shifted to the PVDF membrane (Millipore, Burlington, MA, USA). The cropped PVDF membrane according to protein marker (Vazyme, Nanjing, China) was blocked with 5% fat-free milk for 1 h and then cultured with primary antibodies at 4 °C overnight. Primary antibodies were prepared in 5% BSA solution. BSA was dissolved in TBST. After washing with premade TBST buffer (Fdbio, Hangzhou, China) three times per 15 min, the membranes were cultured with secondary antibody conjugated with HRP (1:4000, Fdbio, Hangzhou, China) at room temperature for 1 h. Finally, after washing with TBST buffer three times again, protein expression on the PVDF membranes was measured using the FDbio-Dura ECL Kit on the Bio-Rad CD touch detection system. Anti-α-Tubulin (1:1000, Beyotime, Shanghai, China) and anti-CAB39L (1:1000, Abclonal, Wuhan, China) were the antibodies used in this study.
2.8. KIRC Tissue Samples and Immunohistochemistry (IHC)
KIRC and paired paracancerous samples were gathered from patients who received radical total nephrectomy at the First Affiliated Hospital, Zhejiang University School of Medicine. The Ethics Committee of the First Affiliated Hospital, Zhejiang University School of Medicine authorized this procedure. Patients enrolled in this experiment all signed written informed consent. Immunohistochemical staining was applied to measure the CAB39L protein level in KIRC and paired paracancerous samples using an anti-CAB39L antibody (1:200, Proteintech, Wuhan, China). The details of this experiment were described in our previous study in detail [22].
2.9. Statistical Analysis
R software (version 4.1.1, Microsoft, Washington, DC, USA) and GraphPad Prism 9.0 software (GraphPad Software, Boston, MA, USA) were both used for statistical analysis. Statistical differences were analyzed using one-way variance analysis and student’s t-test. The association between CAB39L expression and clinicopathological data was analyzed using Pearson’s chi-square test. The ROC curve by the pROC package [23] was applied to assess the potential diagnostic value of CAB39L expression and acquire the area under the curve (AUC). AUC > 0.7 displayed good diagnostic accuracy. Kaplan–Meier curves were employed for analyzing the association between CAB39L expression and OS, DSS, and PFS of KIRC patients. Survival advantages were calculated by log-rank (Mantel–Cox) test. The independent prognostic significance of clinical parameters for OS such as CAB39L in KIRC patients was estimated by univariate and multivariate Cox analysis. On this basis, a nomogram was established for predicting OS of KIRC patients at 1, 3, and 5 years. The efficiency of the nomogram for OS was validated using a calibration plot. The nomogram and calibration plot were conducted by the R package “rms”. Continuous data were exhibited in the style of “mean ± SD”. p < 0.05 represents statistical significance.
3. Results
3.1. Pan-Cancer Analysis of CAB39L Expression
The mRNA levels of CAB39L were determined in 33 types of cancer from independent databases. Firstly, the mRNA expression of CAB39L in TCGA database was investigated. CAB39L expression was markedly lower in tumor samples than normal kidney tissues, especially in kidney renal papillary cell carcinoma (KIRP), KIRC, and kidney chromophobe (KICH) (Figure 1a,b). The same expression trend was also observed in the TIMER database (Figure 1c). The above findings indicated that CAB39L may have a suppressive tumor-growth effect in most cancers.
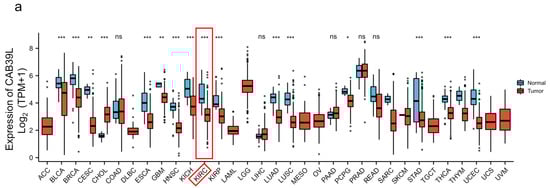
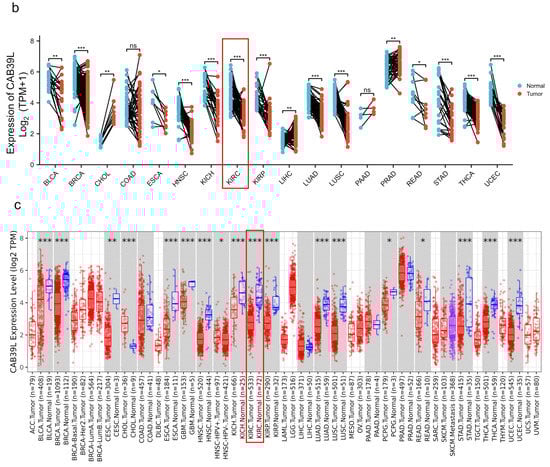
Figure 1.
The mRNA level of CAB39L in different types of cancer. (a) mRNA expression of CAB39L in 33 types of cancer (TCGA). (b) mRNA expression of CAB39L in tumor and paired paracancerous samples (TCGA). (c) mRNA expression of CAB39L in 33 types of cancer (TIMER). ACC: adrenocortical carcinoma; BLCA: bladder urothelial carcinoma; BRCA: breast invasive carcinoma; CESC: cervical squamous cell carcinoma and endocervical adenocarcinoma; CHOL: cholangiocarcinoma; COAD: colon adenocarcinoma; DLBC: lymphoid neoplasm diffuse large B-cell lymphoma; ESCA: esophageal carcinoma; GBM: glioblastoma multiforme; HNSC: head and neck squamous cell carcinoma; KICH: kidney chromophobe; KIRC: kidney renal clear cell carcinoma; KIRP: kidney renal papillary cell carcinoma; LAML: acute myeloid leukemia; LGG: brain lower grade glioma; LIHC: liver hepatocellular carcinoma; LUAD: lung adenocarcinoma; LUSC: lung squamous cell carcinoma; MESO: mesothelioma; OV: ovarian serous cystadenocarcinoma; PAAD: pancreatic adenocarcinoma; PCPG: pheochromocytoma and paraganglioma; PRAD: prostate adenocarcinoma; READ: rectum adenocarcinoma; SARC: sarcoma; SKCM: skin cutaneous melanoma; STAD: stomach adenocarcinoma; TGCT: testicular germ cell tumors; THCA: thyroid carcinoma; THYM: thymoma; UCEC: uterine corpus endometrial carcinoma; UCS: uterine carcinosarcoma; UVM: uveal melanoma. * p < 0.05, ** p < 0.01, *** p < 0.001, ns: no significance.
3.2. Transcriptional Level of CAB39L in KIRC and Its Relationship with Clinical Features of KIRC Patients
Although overwhelming evidence suggests that CAB39L is a novel tumor biomarker, there is little research on the transcriptional analysis of CAB39L in KIRC. Hence, different databases were used to explore the expression of CAB39L and its association with clinicopathological paraments of KIRC patients. The mRNA levels of CAB39L were markedly downregulated in KIRC samples compared with normal kidney samples in TCGA database (Figure 2a). Then, the mRNA expression of CAB39L was analyzed in the M stage, N stage, T stage, pathologic stage, and histologic grade, as well as its association with clinicopathological parameters of KIRC patients. It was discovered that transcriptional levels of CAB39L were much lower in tissues of KIRC patients with advanced and metastatic cancer stages (Figure 2b–f). Moreover, CAB39L expression had a significant association with histological grade, pathologic stage, M stage, and T stage (Table 1). Logistic regression analysis confirmed that CAB39L expression was negatively corelated with various clinicopathological parameters of poor prognosis, including T stage, M stage, histologic grade, and pathologic stage (Table 2). CAB39L expression in KIRC was further analyzed by GEPIA and UALCAN databases to make the findings more reliable. Consistent with previous analysis results in TCGA database, lower mRNA expression of CAB39L similarly occurred in patients with advanced KIRC (Figure 3a–f). The above findings indicated that lower CAB39L expression may predict worse prognosis.
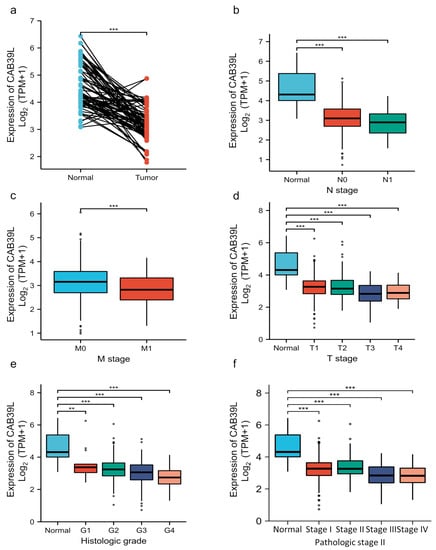
Figure 2.
Analysis of the transcriptional level of CAB39L and its association with clinical parameters of KIRC patients (TCGA). (a) mRNA expression of CAB39L in 72 KIRC samples and adjacent non-tumor samples. (b) Relationship between the mRNA expression of CAB39L and N stage. (c) Relationship between the mRNA expression of CAB39L and M stage. (d) Relationship between the mRNA expression of CAB39L and T stage. (e) Relationship between the mRNA expression of CAB39L and histologic grade. (f) Relationship between the mRNA expression of CAB39L and pathologic stage. T: tumor size; M: distant metastasis; N: lymphatic metastasis; ** p < 0.01, *** p < 0.001.

Table 1.
Association of CAB39L mRNA expression with clinical characteristics in KIRC patients.
Table 2.
Logistic analysis of the association between CAB39L mRNA expression and clinical characteristics of KIRC patients.
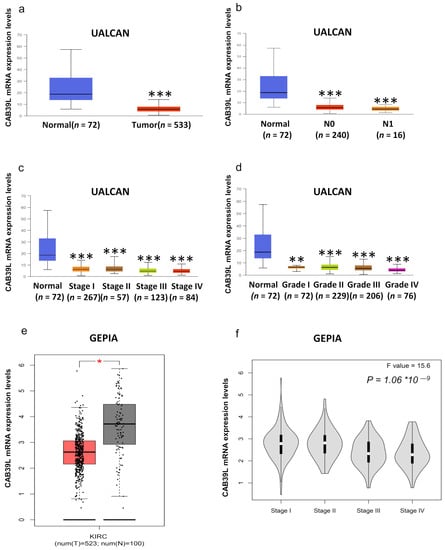
Figure 3.
Analysis of the transcriptional level of CAB39L and its association with clinical parameters of KIRC patients (UALCAN and GEPIA). (a) mRNA expression of CAB39L in 533 KIRC samples and 72 normal tissue samples (UALCAN). (b–d) Relationship between the transcriptional level of CAB39L and N stage, pathologic stage, and histologic grade (UALCAN). (e) The transcriptional level of CAB39L in 523 KIRC samples and 100 normal tissue samples (GEPIA). (f) Relationship between the transcriptional level of CAB39L and pathologic stage (GEPIA). * p < 0.05, ** p < 0.01, *** p < 0.001.
3.3. Diagnostic Value of CAB39L Expression in KIRC
The diagnostic value of CAB39L mRNA expression for various clinical characteristics of KIRC patients was evaluated using ROC curves. The AUC value was 0.9 for T1 stage, 0.889 for T2 stage, 0.959 for T3 stage, 0.949 for T4 stage, 0.921 for N0 stage, 0.957 for N1 stage, 0.916 for M0 stage, 0.955 for M1 stage, 0.894 for I and II stage, 0.958 for III and IV stage, 0.895 for G1 and G2 stage, and 0.947 for G3 and G4 stage (Figure 4a–c). The upper results showed that the transcriptional level of CAB39L was relatively specific and sensitive for KIRC diagnosis.
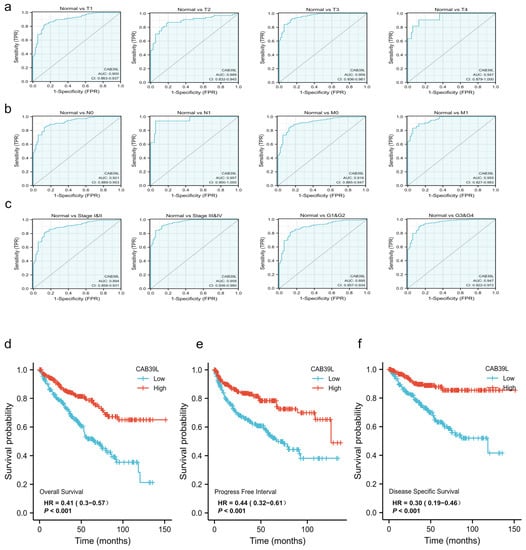
Figure 4.
Diagnostic and prognostic capacity of CAB39L in KIRC. (a) Diagnostic capacity of CAB39L expression in KIRC patients at T stage by ROC curves. (b) Diagnostic capacity of CAB39L expression in KIRC patients at M and N stages by ROC curves. (c) Diagnostic capacity of CAB39L expression in KIRC patients at different histologic grade and pathologic stage by ROC curves. (d) Association between CAB39L expression and OS (TCGA). (e) Association between CAB39L expression and PFS (TCGA). (f) Association between CAB39L expression and DSS (TCGA). Progression-free survival (PFS), disease-specific survival (DSS), overall survival (OS).
3.4. Prognostic Value of CAB39L Expression in KIRC
Kaplan–Meier curves were used to verify the prediction of CAB39L mRNA level for clinical outcomes. As shown in Figure 4d–f, OS (HR = 0.41, p < 0.001), PFS (HR = 0.44, p < 0.001), and DSS (HR = 0.30, p < 0.001) for KIRC patients with relatively low CAB39L expression were all significantly worse than those with high CAB39L expression. The effect of CAB39L expression on OS in KIRC patients with various stages and clinical parameters was also evaluated (Figure 5a). Univariate and multivariate Cox regression analyses were further applied to explore the independent prognostic value of CAB39L (Table 3). The results showed that the lower mRNA expression of CAB39L was independently related to a significantly shorter OS (HR = 0.6, 95% CI: 0.375–0.962, p = 0.034). On this basis, the OS of KIRC patients at 1, 3, and 5 years was predicted using the nomogram model (Figure 5b), and the efficiency of the nomogram for OS was validated by calibration curves (Figure 5c). The nomogram included age, M stage, and CAB39L, with a C-index of 0.725. The above results demonstrated that the transcriptional level of CAB39L had a strong prognostic value.
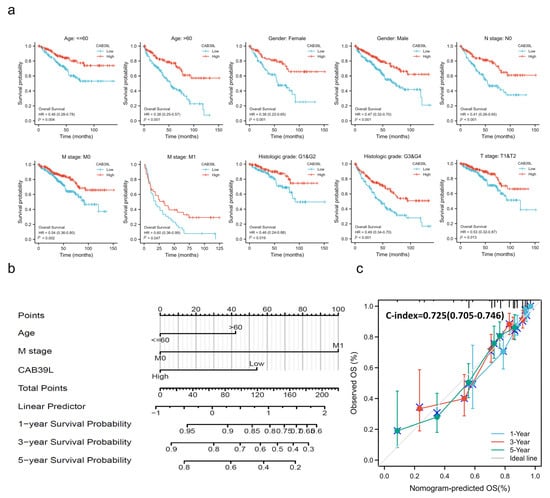
Figure 5.
Prognostic value of CAB39L in subgroups of KIRC patients and construction and validation of the nomogram based on CAB39L mRNA expression. (a) The relationship between CAB39L expression and OS in different subgroups, including age ≤ 60, age > 60, female, male, N0 stage, M0 stage, M1 stage, T1 and T2 stage, G1 and G2 stage, and G3 and G4 stage. (b) The OS of KIRC patients at 1, 3, and 5 years was predicted by the nomogram model. (c) The efficiency of the nomogram for OS was validated by calibration curves.
Table 3.
Cox regression analysis of variables for OS in KIRC patients.
3.5. Construction of the PPI Network and Enrichment Analysis of CAB39L-Related Genes and DEGs
The PPI network of CAB39L and its associated genes with similar functions was constructed to elucidate the potential interaction using the STRING tool (Figure 6a). CAB39L-related genes included STK11, STRADA, SREADB, STK24, CAB39, PRKAA1, PRKAA2, PRKAB2, and PRKAG2. Combined with GO and KEGG analysis of CAB39L-related genes (Figure 6b), it was found that CAB39L and its related genes were primarily associated with protein kinase activity, protein kinase complex, protein serine/threonine kinase activity, and the AMPK signaling pathway. Furthermore, to investigate the potential mechanism of CAB39L in the progression of KIRC, KIRC samples were divided into low and high CAB39L groups to identify CAB39L-related DEGs (Figure 6c). The top 15 upregulated and downregulated DEGs (Table S1) were chosen to perform GO and KEGG analysis (Figure 6d). The results indicated that CAB39L-related DEGs were enriched in oxidative phosphorylation, ATPase activity, and proton-exporting ATPase complex.
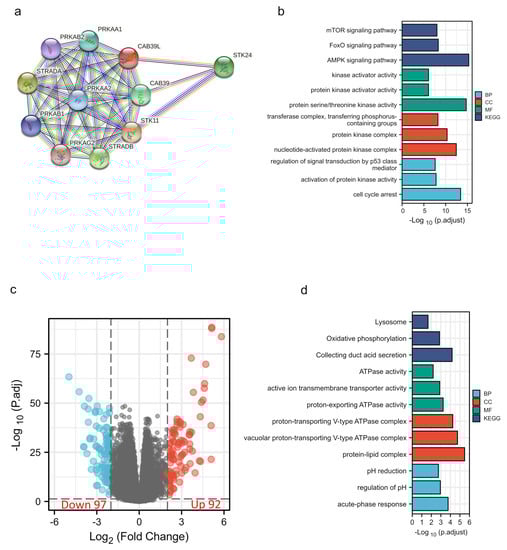
Figure 6.
PPI construction and enrichment analysis of CAB39L. (a) A web of CAB39L and its potential co-expressed genes constructed using STRING. (b) GO and KEGG enrichment analysis performed on CAB39L-related genes. (c) Volcano plot of DEGs between the expression of high and low CAB39L in KIRC (|log2fold change| > 2 and adjusted p < 0.05). (d) GO and KEGG enrichment analysis of CAB39L-related DEGs.
3.6. CAB39L Co-Expression Network in KIRC
Co-expressed genes with CAB39L were searched from LinkedOmics and exhibited using volcano maps (Figure 7a). The top 50 genes negatively and positively corelated with CAB39L were displayed using heatmaps (Figure 7b,c). GO analysis indicated that CAB39L co-expressed genes were enriched in the tricarboxylic acid metabolic process, NADH dehydrogenase complex assembly, and mitochondrial respiratory chain complex assembly (Figure 7d). KEGG analysis indicated the enrichment of oxidative phosphorylation, propanoate metabolism, and the TCA cycle (Figure 7e). Combined with the previous analysis of CAB39L-related genes and DEGs, it was speculated that the function of CAB39L could be correlated with substance and energy metabolism in KIRC.
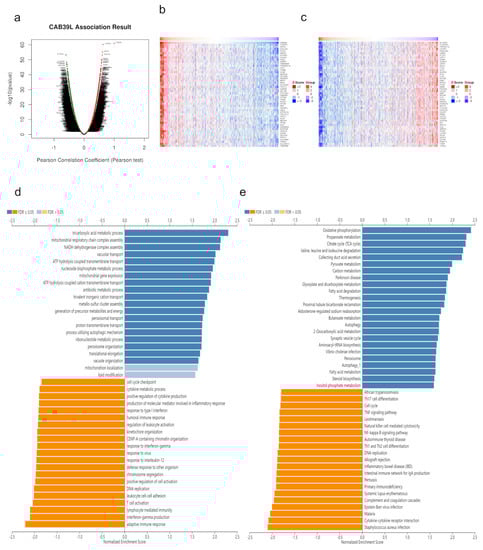
Figure 7.
CAB39L co-expressed genes and functional enrichment analysis (LinkedOmics). (a) Volcano map of CAB39L co-expressed genes in KIRC. (b) Fifty genes positively associated with CAB39L. (c) Fifty genes negatively associated with CAB39L. (d) GO enrichment analysis of CAB39L co-expressed genes. (e) KEGG enrichment analysis of CAB39L co-expressed genes.
3.7. Methylation Level of CAB39L Gene Promoter Region in KIRC
DNA methylation modification is one of the most important components of epigenetics and can regulate gene expression. To investigate the cause of low CAB39L expression in KIRC, the methylation level of CAB39L was analyzed through the UALCAN database. Compared with normal tissues, CAB39L was hypermethylated in KIRC tissues (Figure 8a). The level of CAB39L gene methylation increased with the progression of tumor grade and stage (Figure 8b,c). In addition, the methylation level of different CpG sites located at the CAB39L gene promoter region was analyzed using the MethSurv web tool (Figure 8d). Consistent with our previous results, almost all cpG sites had a high methylation level. The above results demonstrated that the downregulation of CAB39L in KIRC was possibly due to promoter hypermethylation, which was positively correlated with tumor grade and stage.
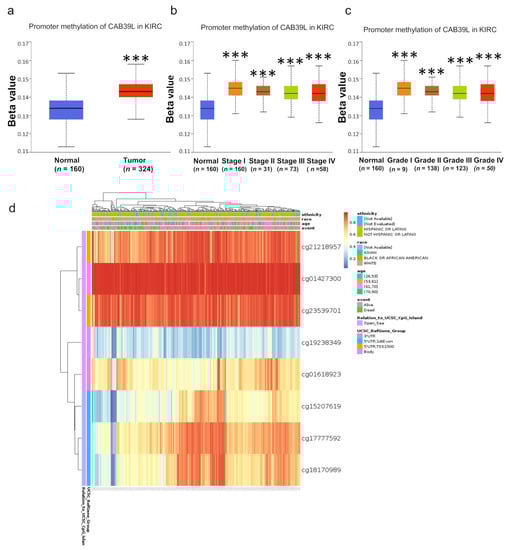
Figure 8.
Analysis of methylation level in the CAB39L gene promoter region. (a) Analysis of methylation level of the CAB39L gene promoter region for KIRC compared with normal tissues (UALCAN). (b,c) Analysis of the relationship between methylation level of the CAB39L promoter region and pathologic stages (UALCAN). (c) Analysis of the relationship between methylation level of the CAB39L promoter region and histologic grades (UALCAN). (d) Analysis of methylation level of the CAB39L promoter region at CpG sites (MethSurv). *** p < 0.001.
3.8. CAB39L Protein Expression in Paired KIRC Samples
WB was chosen to detect CAB39L protein expression in KIRC tissues for validating the results of TCGA, GEPIA, and UALCAN databases (Figure 9a). Compared with paracancerous tissues, the protein level of CAB39L was markedly downregulated in KIRC tissues. The protein level of CAB39L in clinical KIRC tissues and the HPA database was also detected by IHC, and the results of IHC were in accordance with those of Western blot (Figure 9b,c).
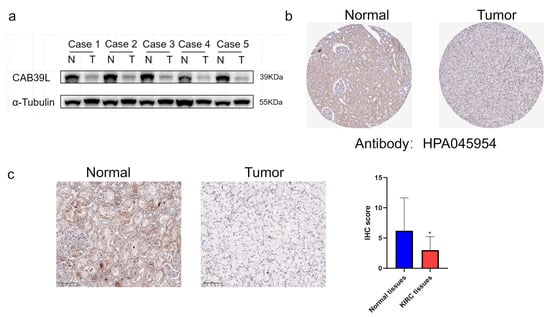
Figure 9.
The protein level of CAB39L in paired KIRC samples. (a) Western blot detection of CAB39L expression in five paired KIRC samples. (b) IHC staining outcomes of CAB39L in KIRC and adjacent non-tumor tissues (HPA). (c) IHC staining outcomes of CAB39L in KIRC and adjacent non-tumor tissues (clinical paired KIRC tissues). * p < 0.05.
3.9. Overexpression of CAB39L Inhibited Tumorigenicity and Metastasis of KIRC Cells In Vitro
The expression of CAB39L was overexpressed using plasmid to explore the impact of CAB39L on the proliferation of KIRC cells. The overexpression of CAB39L significantly impaired the proliferative capability of A498 and 786-O cells, which was confirmed by CCK-8 and colony formation assays (Figure 10a–c). Furthermore, transwell migration and invasion assays revealed that CAB39L restrained the metastatic capacity of A498 and 786-O cells (Figure 10d). In conclusion, the above results suggested that CAB39L impaired the tumorigenesis of KIRC.
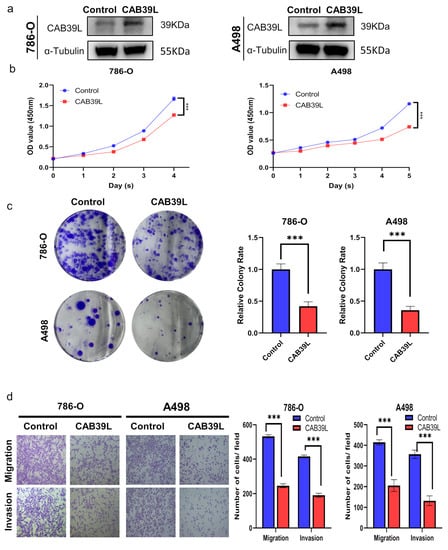
Figure 10.
Overexpression of CAB39L inhibited the tumorigenicity and metastasis of KIRC cells in vitro. (a) Western blot detection of CAB39L expression after transfection of CAB39L overexpression plasmid in 786-O and A498 cells. (b) Impact of CAB39L overexpression on cell proliferation detected by CCK-8 assay. (c) Impact of CAB39L overexpression on cell proliferation detected by colony formation assay. (d) Impact of CAB39L overexpression on migration and invasion capacity of 786-O and A498 cells detected by transwell assays. *** p < 0.001.
4. Discussion
KIRC is the most common pathological subtype of RCC [1]. Most patients with KIRC remain asymptomatic at an early stage, and more than 60% of patients with KIRC are incidentally detected by imaging examinations for other reasons [1,2]. However, the survival prognosis of patients with advanced KIRC is far from satisfactory, despite the landmark improvement in diagnosis and treatment [2,4]. Thus, there is an urgent need to discover a sensitive and effective biomarker for KIRC.
CAB39L is a scaffold protein that can interact with STRAD pseudokinase to activate LKB1 tumor suppressive kinase activity [10,24]. Recently, several studies have reported that downregulated CAB39L expression is significantly correlated to poor prognosis and genesis and development of malignant cancers [11,12,25]. In breast cancer and gastric carcinoma, silencing CAB39L facilitated G1/S phase transition and reduced cell apoptosis and thus promoted tumor progression, while overexpression of CAB39L exerted opposite effects [11,12]. However, the exact function of CAB39L in KIRC is still unclear. Hence, the expression profile, diagnostic and prognostic significance, interactive network, and potential mechanism of CAB39L in KIRC were systematically analyzed in this study.
The transcriptional level of CAB39L and KIRC across independent databases (TCGA, TIMER, GEPIA, and UALCAN) was investigated, indicating that CAB39L expression was lower in KIRC than in paracancerous samples. This finding was also confirmed by a decrease in the protein expression level of CAB39L detected by WB and IHC. Interestingly, the results also revealed that the mRNA level of CAB39L was downregulated in most cancers, including breast cancer, gastric cancer, and bladder cancer. Subsequently, the cause of the downregulation of CAB39L in KIRC was explored to discover that the methylation level of the CAB39L gene promoter region was significantly elevated. Taken together, CAB39L may play a potential suppressive role in tumor development.
In addition, the correlation between CAB39L expression and the clinical features of KIRC patients was further examined in this experiment. The results revealed that CAB39L expression was closely associated with tumor stage and histologic grade. Logistic regression analysis further demonstrated that CAB39L expression was negatively correlated with pathologic stage, histologic grade, and M and T stage. The Kaplan–Meier curves exhibited that low CAB39L expression suggested unfavorable OS, PFS, and DSS in KIRC patients. Moreover, a low CAB39L mRNA level was an independent undesirable prognostic parameter for OS in KIRC, according to univariate and multivariate regression analyses. The ROC curve showed that CAB39L expression had a strong diagnostic value, regardless of early or late KIRC. Owing to the significant prognostic and diagnostic value of the mRNA level of CAB39L, a nomogram based on CAB39L expression and some clinical characteristics was constructed to assist in predicting the mortality risk and optimizing the clinical decision.
To figure out the potential mechanism of CAB39L in KIRC, a PPI network analysis of co-regulatory proteins of CAB39L was first performed, finding that CAB39L-related genes were mainly associated with the AMPK signaling pathway and protein kinase activity. AMPK is a crucial metabolic checkpoint for maintaining cellular energy balance and regulating tumor growth according to energy signals [26,27]. Some studies reported that activated AMPK could promote oxidative phosphorylation in mitochondria and restrain aerobic glycolysis (Warburg effect) to repress tumorigenesis [26,28,29]. Interestingly, it was further discovered that CAB39L-related DEGs were significantly related to oxidative phosphorylation and ATP production. Moreover, the enrichment analysis of CAB39L co-expression genes indicated that CAB39L participated in regulating oxidative phosphorylation, mitochondrial respiratory chain, and the tricarboxylic acid cycle. Metabolic dysregulation exists in many cancers, which is mainly characterized by the Warburg effect [30,31,32,33]. The majority of cancer cells still choose a high glycolytic metabolism to meet the requirement of uncontrolled cell proliferation, even in the presence of adequate oxygen [33]. Taken together, it can be assumed that CAB39L may shift aerobic glycolysis to oxidative phosphorylation through the AMPK signal pathway to limit tumor growth.
Moreover, the effect of CAB39L expression on the malignant phenotype of KIRC cells was explored in vitro. The results indicated that the overexpression of CAB39L significantly impaired the proliferative and metastatic capacity of 786-O and A498 cells. These above results further suggested that CAB39L was positively involved in repressing the genesis and development of KIRC cells. Whether CAB39L regulates tumor growth by influencing the cell cycle in KIRC needs further experimental verification. However, there were some limitations in this study. First, the function of CAB39L was not confirmed in vivo. Second, the prognostic and diagnostic value of CAB39L was only investigated and validated in cancer databases, requiring more clinical research support. Finally, although the potential downstream mechanism of CAB39L was analyzed through bioinformatics, its underlying molecular mechanism was not verified both in vitro and in vivo. Therefore, it is necessary to investigate the possible mechanism of CAB39L in KIRC in subsequent studies.
5. Conclusions
CAB39L is a critical indicator for diagnosing and predicting the prognosis of KIRC patients. Moreover, CAB39L is downregulated in both the protein and mRNA level of KIRC and plays an indispensable role in restraining tumor progression. This study may provide new insights into improving the diagnosis, prognosis, and clinical decisions of KIRC patients.
Supplementary Materials
The following are available online at https://www.mdpi.com/article/10.3390/medicina59040716/s1, Table S1: Top 15 upregulated and downregulated DEGs.
Author Contributions
Z.X. and Y.W. have full access to all data in the study and take responsibility for the integrity of the data and the accuracy of the data analysis. Study concept and design: B.J., Z.X. and Y.W. Analysis and interpretation of data: X.C. and Y.W. Experiment performance and clinical data acquisition: G.F., J.S., J.T. and Y.S. Drafting of the manuscript: Y.W. Critical revision of the manuscript for clinical implication: B.J. Statistical analysis: J.T., Y.W., Y.S. and X.C. All authors have read and agreed to the published version of the manuscript.
Funding
The work was supported by the following grant: Key Project of Science and Technology Program of Zhejiang Province (grant no. 2020C03026).
Institutional Review Board Statement
The study was conducted in accordance with the Declaration of Helsinki (1964). The study was approved by the Ethics Committee of the First Affiliated Hospital, Zhejiang University School of Medicine (ID: IIT20200733A) and written consent was obtained from all individual participants. The Ethic Committee approval date was 24 September 2020.
Informed Consent Statement
Informed consent was obtained from all subjects involved in the study. Written informed consent has been obtained from the patient(s) to publish this paper.
Data Availability Statement
The data that support the findings of this study are available from the corresponding author upon request.
Acknowledgments
We would like to thank The Key Laboratory of Combined Multi-Organ Transplantation, Ministry of Public Health (Hangzhou, China) for the use of the facilities and assistance from the technicians.
Conflicts of Interest
The authors declare that there are no conflict of interest.
References
- Siegel, R.L.; Miller, K.D.; Fuchs, H.E.; Jemal, A. Cancer statistics, 2022. CA Cancer J. Clin. 2022, 72, 7–33. [Google Scholar] [CrossRef] [PubMed]
- Ljungberg, B.; Albiges, L.; Abu-Ghanem, Y.; Bensalah, K.; Dabestani, S.; Fernández-Pello, S.; Giles, R.H.; Hofmann, F.; Hora, M.; Kuczyk, M.A.; et al. European Association of Urology Guidelines on Renal Cell Carcinoma: The 2019 Update. Eur. Urol. 2019, 75, 799–810. [Google Scholar] [CrossRef] [PubMed]
- Mendoza-Alvarez, A.; Guillen-Guio, B.; Baez-Ortega, A.; Hernandez-Perez, C.; Lakhwani-Lakhwani, S.; Maeso, M.-D.-C.; Lorenzo-Salazar, J.M.; Morales, M.; Flores, C. Whole-Exome Sequencing Identifies Somatic Mutations Associated With Mortality in Metastatic Clear Cell Kidney Carcinoma. Front. Genet. 2019, 10, 439. [Google Scholar] [CrossRef] [PubMed]
- Hutson, T.E.; Figlin, R.A. Renal cell cancer. Cancer J. 2007, 13, 282–286. [Google Scholar] [CrossRef] [PubMed]
- Hsieh, J.J.; Purdue, M.P.; Signoretti, S.; Swanton, C.; Albiges, L.; Schmidinger, M.; Heng, D.Y.; Larkin, J.; Ficarra, V. Renal cell carcinoma. Nat. Rev. Dis. Prim. 2017, 3, 17009. [Google Scholar] [CrossRef]
- Garje, R.; An, J.; Greco, A.; Vaddepally, R.K.; Zakharia, Y. The Future of Immunotherapy-Based Combination Therapy in Metastatic Renal Cell Carcinoma. Cancers 2020, 12, 143. [Google Scholar] [CrossRef]
- Park, K.; Lee, J.-L.; Park, I.; Park, S.; Ahn, Y.; Ahn, J.-H.; Ahn, S.; Song, C.; Hong, J.H.; Kim, C.-S.; et al. Comparative efficacy of vascular endothelial growth factor (VEGF) tyrosine kinase inhibitor (TKI) and mammalian target of rapamycin (mTOR) inhibitor as second-line therapy in patients with metastatic renal cell carcinoma after the failure of first-line VEGF TKI. Med. Oncol. 2012, 29, 3291–3297. [Google Scholar] [CrossRef]
- Ascierto, M.L.; McMiller, T.L.; Berger, A.E.; Danilova, L.; Anders, R.A.; Netto, G.J.; Xu, H.; Pritchard, T.S.; Fan, J.; Cheadle, C.; et al. The Intratumoral Balance between Metabolic and Immunologic Gene Expression Is Associated with Anti-PD-1 Response in Patients with Renal Cell Carcinoma. Cancer Immunol. Res. 2016, 4, 726–733. [Google Scholar] [CrossRef]
- Hawley, S.A.; Boudeau, J.; Reid, J.L.; Mustard, K.J.; Udd, L.; Mäkelä, T.P.; Alessi, D.R.; Hardie, D.G. Complexes between the LKB1 tumor suppressor, STRAD alpha/beta and MO25 alpha/beta are upstream kinases in the AMP-activated protein kinase cascade. J. Biol. 2003, 2, 28. [Google Scholar] [CrossRef]
- Boudeau, J.; Baas, A.F.; Deak, M.; Morrice, N.A.; Kieloch, A.; Schutkowski, M.; Prescott, A.R.; Clevers, H.C.; Alessi, D.R. MO25alpha/beta interact with STRADalpha/beta enhancing their ability to bind, activate and localize LKB1 in the cytoplasm. EMBO J. 2003, 22, 5102–5114. [Google Scholar] [CrossRef]
- Li, W.; Wong, C.C.; Zhang, X.; Kang, W.; Nakatsu, G.; Zhao, Q.; Chen, H.; Go, M.Y.Y.; Chiu, P.W.Y.; Wang, X.; et al. CAB39L elicited an anti-Warburg effect via a LKB1-AMPK-PGC1α axis to inhibit gastric tumorigenesis. Oncogene 2018, 37, 6383–6398. [Google Scholar] [CrossRef] [PubMed]
- Pulito, C.; Mori, F.; Sacconi, A.; Goeman, F.; Ferraiuolo, M.; Pasanisi, P.; Campagnoli, C.; Berrino, F.; Fanciulli, M.; Ford, R.J.; et al. Metformin-induced ablation of microRNA 21-5p releases Sestrin-1 and CAB39L antitumoral activities. Cell Discov. 2017, 3, 17022. [Google Scholar] [CrossRef]
- Li, T.; Fan, J.; Wang, B.; Traugh, N.; Chen, Q.; Liu, J.S.; Li, B.; Liu, X.S. TIMER: A Web Server for Comprehensive Analysis of Tumor-Infiltrating Immune Cells. Cancer Res. 2017, 77, e108–e110. [Google Scholar] [CrossRef] [PubMed]
- Tang, Z.; Li, C.; Kang, B.; Gao, G.; Li, C.; Zhang, Z. GEPIA: A web server for cancer and normal gene expression profiling and interactive analyses. Nucleic Acids Res. 2017, 45, W98–W102. [Google Scholar] [CrossRef] [PubMed]
- Chandrashekar, D.S.; Bashel, B.; Balasubramanya, S.A.H.; Creighton, C.J.; Ponce-Rodriguez, I.; Chakravarthi, B.V.S.K.; Varambally, S. UALCAN: A Portal for Facilitating Tumor Subgroup Gene Expression and Survival Analyses. Neoplasia 2017, 19, 649–658. [Google Scholar] [CrossRef] [PubMed]
- Vasaikar, S.V.; Straub, P.; Wang, J.; Zhang, B. LinkedOmics: Analyzing multi-omics data within and across 32 cancer types. Nucleic Acids Res. 2018, 46, D956–D963. [Google Scholar] [CrossRef]
- Asplund, A.; Edqvist, P.-H.D.; Schwenk, J.M.; Pontén, F. Antibodies for profiling the human proteome-The Human Protein Atlas as a resource for cancer research. Proteomics 2012, 12, 2067–2077. [Google Scholar] [CrossRef]
- Modhukur, V.; Iljasenko, T.; Metsalu, T.; Lokk, K.; Laisk-Podar, T.; Vilo, J. MethSurv: A web tool to perform multivariable survival analysis using DNA methylation data. Epigenomics 2018, 10, 277–288. [Google Scholar] [CrossRef]
- Love, M.I.; Huber, W.; Anders, S. Moderated estimation of fold change and dispersion for RNA-seq data with DESeq2. Genome Biol. 2014, 15, 550. [Google Scholar] [CrossRef]
- Yu, G.; Wang, L.-G.; Han, Y.; He, Q.-Y. ClusterProfiler: An R package for comparing biological themes among gene clusters. OMICS J. Integr. Biol. 2012, 16, 284–287. [Google Scholar] [CrossRef]
- Szklarczyk, D.; Gable, A.L.; Lyon, D.; Junge, A.; Wyder, S.; Huerta-Cepas, J.; Simonovic, M.; Doncheva, N.T.; Morris, J.H.; Bork, P.; et al. STRING v11: Protein-protein association networks with increased coverage, supporting functional discovery in genome-wide experimental datasets. Nucleic Acids Res. 2019, 47, D607–D613. [Google Scholar] [CrossRef] [PubMed]
- Fu, G.; Xu, Z.; Chen, X.; Pan, H.; Wang, Y.; Jin, B. CDCA5 functions as a tumor promoter in bladder cancer by dysregulating mitochondria-mediated apoptosis, cell cycle regulation and PI3k/AKT/mTOR pathway activation. J. Cancer 2020, 11, 2408–2420. [Google Scholar] [CrossRef] [PubMed]
- Robin, X.; Turck, N.; Hainard, A.; Tiberti, N.; Lisacek, F.; Sanchez, J.-C.; Müller, M. pROC: An open-source package for R and S+ to analyze and compare ROC curves. BMC Bioinform. 2011, 12, 77. [Google Scholar] [CrossRef] [PubMed]
- Filippi, B.M.; de los Heros, P.; Mehellou, Y.; Navratilova, I.; Gourlay, R.; Deak, M.; Plater, L.; Toth, R.; Zeqiraj, E.; Alessi, D.R. MO25 is a master regulator of SPAK/OSR1 and MST3/MST4/YSK1 protein kinases. EMBO J. 2011, 30, 1730–1741. [Google Scholar] [CrossRef] [PubMed]
- Wu, J.; Huang, Y.; Yu, C.; Li, X.; Wang, L.; Hong, J.; Lin, D.; Han, X.; Guo, G.; Hu, T.; et al. The Key Gene Expression Patterns and Prognostic Factors in Malignant Transformation from Enchondroma to Chondrosarcoma. Front. Oncol. 2021, 11, 693034. [Google Scholar] [CrossRef]
- Shackelford, D.B.; Shaw, R.J. The LKB1-AMPK pathway: Metabolism and growth control in tumour suppression. Nat. Rev. Cancer 2009, 9, 563–575. [Google Scholar] [CrossRef] [PubMed]
- Hardie, D.G.; Ross, F.A.; Hawley, S.A. AMPK: A nutrient and energy sensor that maintains energy homeostasis. Nat. Rev. Mol. Cell Biol. 2012, 13, 251–262. [Google Scholar] [CrossRef]
- Xing, F.; Luan, Y.; Cai, J.; Wu, S.; Mai, J.; Gu, J.; Zhang, H.; Li, K.; Lin, Y.; Xiao, X.; et al. The Anti-Warburg Effect Elicited by the cAMP-PGC1α Pathway Drives Differentiation of Glioblastoma Cells into Astrocytes. Cell Rep. 2017, 18, 468–481. [Google Scholar] [CrossRef]
- Faubert, B.; Boily, G.; Izreig, S.; Griss, T.; Samborska, B.; Dong, Z.; Dupuy, F.; Chambers, C.; Fuerth, B.J.; Viollet, B.; et al. AMPK is a negative regulator of the Warburg effect and suppresses tumor growth in vivo. Cell Metab. 2013, 17, 113–124. [Google Scholar] [CrossRef]
- Wettersten, H.I.; Aboud, O.A.; Lara, P.N.; Weiss, R.H. Metabolic reprogramming in clear cell renal cell carcinoma. Nat. Rev. Nephrol. 2017, 13, 410–419. [Google Scholar] [CrossRef]
- Lu, J.; Tan, M.; Cai, Q. The Warburg effect in tumor progression: Mitochondrial oxidative metabolism as an anti-metastasis mechanism. Cancer Lett. 2015, 356, 156–164. [Google Scholar] [CrossRef] [PubMed]
- Liberti, M.V.; Locasale, J.W. The Warburg Effect: How Does it Benefit Cancer Cells? Trends Biochem. Sci. 2016, 41, 211–218. [Google Scholar] [CrossRef] [PubMed]
- Vander Heiden, M.G.; Cantley, L.C.; Thompson, C.B. Understanding the Warburg effect: The metabolic requirements of cell proliferation. Science 2009, 324, 1029–1033. [Google Scholar] [CrossRef] [PubMed]


Disclaimer/Publisher’s Note: The statements, opinions and data contained in all publications are solely those of the individual author(s) and contributor(s) and not of MDPI and/or the editor(s). MDPI and/or the editor(s) disclaim responsibility for any injury to people or property resulting from any ideas, methods, instructions or products referred to in the content. |
© 2023 by the authors. Licensee MDPI, Basel, Switzerland. This article is an open access article distributed under the terms and conditions of the Creative Commons Attribution (CC BY) license (https://creativecommons.org/licenses/by/4.0/).