Article

A Nine-Gene Expression Signature Distinguished a Patient with Chronic Lymphocytic Leukemia Who Underwent Prolonged Periodic Fasting

by
Luca Emanuele Bossi
1,*,†,
Cassandra Palumbo
1,*,†,
Alessandra Trojani
1,
Agostina Melluso
1,
Barbara Di Camillo
2,3,
Alessandro Beghini
4,
Luca Maria Sarnataro
1 and
Roberto Cairoli
1
1
Department of Hematology and Oncology ASST Grande Ospedale Metropolitano Niguarda, 20162 Milan, Italy
2
Department of Information Engineering, University of Padova, 35020 Padua, Italy
3
Department of Comparative Biomedicine and Food Science, University of Padova, 35020 Padua, Italy
4
Department of Health Sciences, University of Milan, 20146 Milan, Italy
*
Authors to whom correspondence should be addressed.
These authors contributed equally to this work.
Medicina 2023, 59(8), 1405; https://doi.org/10.3390/medicina59081405
Submission received: 25 May 2023 / Revised: 27 July 2023 / Accepted: 28 July 2023 / Published: 31 July 2023
(This article belongs to the Special Issue Chronic Lymphocytic Leukemia: New Insights and Future Directions)

Abstract

:
Background and Objectives: This study aimed to investigate the causes of continuous deep fluctuations in the absolute lymphocyte count (ALC) in an untreated patient with Chronic Lymphocytic Leukemia (CLL), who has had a favorable prognosis since the time of diagnosis. Up until now, the patient has voluntarily chosen to adopt a predominantly vegetarian and fruitarian diet, along with prolonged periods of total fasting (ranging from 4 to 39 days) each year. Materials and Methods: For this purpose, we decided to analyze the whole transcriptome profiling of peripheral blood (PB) CD19+ cells from the patient (#1) at different time-points vs. the same cells of five other untreated CLL patients who followed a varied diet. Consequently, the CLL patients were categorized as follows: the 1st group comprised patient #1 at 20 different time-points (16 time-points during nutrition and 4 time-points during fasting), whereas the 2nd group included only one time point for each of the patients (#2, #3, #4, #5, and #6) as they followed a varied diet. We performed microarray experiments using a powerful tool, the Affymetrix Human Clariom™ D Pico Assay, to generate high-fidelity biomarker signatures. Statistical analysis was employed to identify differentially expressed genes and to perform sample clustering. Results: The lymphocytosis trend in patient #1 showed recurring fluctuations since the time of diagnosis. Interestingly, we observed that approximately 4–6 weeks after the conclusion of fasting periods, the absolute lymphocyte count was reduced by about half. The gene expression profiling analysis revealed that nine genes were statistically differently expressed between the 1st group and the 2nd group. Specifically, IGLC3, RPS26, CHPT1, and PCDH9 were under expressed in the 1st group compared to the 2nd group of CLL patients. Conversely, IGHV3-43, IGKV3D-20, PLEKHA1, CYBB, and GABRB2 were over-expressed in the 1st group when compared to the 2nd group of CLL patients. Furthermore, clustering analysis validated that all the samples from patient #1 clustered together, showing clear separation from the samples of the other CLL patients. Conclusions: This study unveiled a small gene expression signature consisting of nine genes that distinguished an untreated CLL patient who followed prolonged periods of total fasting, maintaining a gradual growth trend of lymphocytosis, compared to five untreated CLL patients with a varied diet. Future investigations focusing on patient #1 could potentially shed light on the role of prolonged periodic fasting and the implication of this specific gene signature in sustaining the lymphocytosis trend and the favorable course of the disease.

1. Introduction

Chronic Lymphocytic Leukemia (CLL) is a monoclonal disorder characterized by a progressive accumulation of functionally incompetent lymphocytes in blood, bone marrow, lymph nodes, and spleen. According to the Surveillance, Epidemiology, and End Results (SEER) database, the reported incidence rate of CLL is 4.9 cases per 100,000 individuals per year, making it one of the most prevalent forms of leukemia in the US and Europe. However, CLL is exceptionally uncommon in Asian populations [1]. The median age at the time of diagnosis is 70 years [2]. Approximately 10% of CLL patients are under the age of 45 [1]. In Europe, data indicates an annual incidence rate of 5.87 and 4.01 cases per 100,000 population among men and women, respectively [3]. CLL is sometimes incidentally discovered during routine blood cell count tests conducted for other reasons. The most common hematological characteristic of CLL is the absolute lymphocyte count (ALC) in the peripheral blood (PB) with median values ranging from 35 to 50 × 109/L, accompanied by a level of ≥5000 B-lymphocytes/μL sustained for a minimum of 3 months. [4]. The Rai and Binet systems are commonly utilized to classify the clinical staging of CLL, relying on parameters such as spleen and liver size, platelet count, hemoglobin values, and the number of involved lymph nodes [5,6,7]. Peripheral blood flow cytometry is the most frequently employed test to confirm the diagnosis, aiming to detect the presence of circulating clonal B-lymphocytes expressing CD5+, CD19+, CD20+, and CD23+ [1,4,8]. Subsequent physical examination or computed tomography scan may reveal enlarged lymph nodes, splenomegaly, and hepatomegaly. As the disease progresses, common symptoms may manifest, including weight loss, fever, drenching night sweats, fatigue, abdominal fullness with early satiety, and increased susceptibility to infections [4]. Based on the variable region gene of the heavy immunoglobulin chain (IGHV) genes, patients can be clinically divided into two main subgroups: those with unmutated IGHV (UM-IGHV) exhibiting an aggressive form of the disease, and those with mutated IGHV (MT-IGHV) with a more favorable prognosis [8]. Approximately 80% of all patients exhibit one of the following four most common chromosomal abnormalities: del(13q14.3) (present in 55% of patients with a favourable prognosis if not associated with any other aberrations), trisomy 12 (found in 10–20% of cases; when occurring alone, it is associated with intermediate risk), del(11q23) (detected in 18% of patients with an unfavourable prognosis), and del(17p13) (associated with high risk in <10% of patients at the time of diagnosis and up to 30% in relapse/refractory cases; linked to TP53 loss) [1,3]. Deletions and/or mutations of TP53 have both prognostic and therapeutic implications as they can influence the disease’s progression and affect the decision-making process regarding patient treatment [8,9].
Several previous studies have identified biological pathways associated with common mutations in CLL. These mutations involve DNA-damage and cell-cycle-control (TP53, ATM, and POT1), chromatin modification (HIST1H1E, HIST1H1B, CHD2, ZMYM3, BAZ2A, ASXL1, SYNE1, ARID1, KMT2D, and SETD2), and mRNA and ribosomal processing (SF3B1, XPO1, RPS15, DOX3X, ZNF292, MED12, CNOT3, U1, FUBP1, DDX3X, ZNF292, and NXF1) [3,10]. Furthermore, recent studies have highlighted the role of the following key pathways in CLL: WNT signalling and MYC-related (MGA and PTPN11), Notch signalling (NOTCH1 and FBXW7), and the inflammatory cascade (MYD88, NFKBIE, BIRC3, TRAF3, and SAMHD1) [3,10].
Additionally, mutations in BCR signalling (EGR2, PAX5, BCOR, IRF4, and IKZF3) and the MAPK–ERK pathway (PTPN11, BRAF, KRAS, MAP2K1, and NRAS) can influence cell-related B signalling and transcription mechanisms [2,3,10,11].
Gene expression profiling (GEP) studies have elucidated the pathophysiology of cells and offered valuable insights into the biomolecular mechanisms governing leukemia cell growth and survival, as well as predicting early progression in patients with CLL [12,13]. In our previous GEP study involving CLL patients (n = 112) we conducted the analysis based on the IGHV mutational status and ZAP-70 (Zeta-chain-associated protein kinase 70) expression.
The comparison between two cohorts of CLL patients, namely MTIGHV/ZAP70 and UMIGHV/ZAP70+, revealed significant dysregulation in the expression of genes encoding enzymes that regulated lipid metabolism, including CHPT1, ARSD, LPL, AGPAT2, MBOAT1, AGPAT4, PLD1, and APP [14]. Some authors have corroborated the crucial role of certain genes previously identified in our studies, such as LPL (lipoprotein lipase) and ZAP-70 (Zeta-chain-associated protein kinase 70) [15,16]. Indeed, LPL expression exhibited a strong correlation with IGHV mutational status and overall survival, underscoring the significance of LPL as a prognostic marker in CLL [15]. Our study commenced by observing an untreated patient (#1) with CLL, characterized by a favorable prognosis, who voluntarily adopted a predominantly vegetarian and fruitarian diet, along with prolonged periods of total fasting (ranging from 4 to 39 days) since the time of diagnosis.
Patient #1 received a CLL diagnosis in 2016, and since then, continuous deep fluctuations in the ALC have been observed. Consequently, we sought to delve into this phenomenon and conducted an investigation into the transcriptomic profiling of B cells from this patient in comparison to the same cells of five other CLL patients (#2, #3, #4, #5, and #6) who followed a varied diet. The deliberate selection of five untreated CLL patients was aimed at conducting a comparison with patient #1, thereby avoiding any pharmacological interferences that could impact gene expression profiling evaluations. The aim of this study was to determine whether the nutrition, combined with prolonged periodic fasting adopted by patient #1, could potentially play a role in the observed trends of lymphocytic fluctuations and the benign course of the disease through changes in gene expression identified in the transcriptome profiling.

2. Materials and Methods

2.1. Patients

We examined six patients with CLL (patient #1, #2, #3, #4, #5, and #6) who received their diagnosis at the Department of Hematology and Oncology (ASST Grande Ospedale Metropolitano Niguarda) based on standard morphological and immunophenotypical criteria. Written informed consent was obtained from all participants. Each of the six patients was of Caucasian ethnicity, and the clinical characteristics and molecular markers for each patient are summarised in Table 1.

2.2. Patient #1

In July 2016, patient #1, aged 50 years, underwent a routine blood chemistry examination, which revealed the following test results: ALC: 11.84 × 10⁹/L; WBC: 15.78 × 10⁹/L; platelets: 22.1 × 10⁹/L, and hemoglobin: 13.9 g/dL. To confirm the diagnosis of CLL, the patient was referred by the attending physician in the Department of Hematology and Oncology (ASST Grande Ospedale Metropolitano Niguarda). Prior to the diagnosis of CLL, the patient had a history of good health, with the exception of an appendectomy due to peritonitis at the age of 9. There was no known family history of CLL, although his father had been diagnosed with non-Hodgkin’s lymphoma. Currently, the patient does not take any drugs, does not frequently consume alcoholic beverages, and is an ex-smoker with regular lifestyle habits.

2.2.1. Diagnostic Assessment

The morphological examination of PB cells revealed the presence of Gumprecht shadow cells (smudge cells). Flow cytometry confirmed the presence of monoclonal K (low- intensity) B cell lymphocytosis and a phenotype of CD5+, CD19+, CD23+. FISH analysis detected an interstitial deletion (13q), mutated IGHV, and wild type TP53. The patient’s CLL was classified as stable Rai stage 0 and Binet stage A. Since the time of diagnosis until the present, the patient has remained asymptomatic, and there has been a slow-growth trend of lymphocytosis, but treatment has not been necessary.

2.2.2. Nutrition and Fasting Periods

Since 2016, in accordance with his attending physician, he has been undergoing annual follow-up, and blood chemistry assessments every four months, following a “watch and wait” approach [4]. Since the time of diagnosis, he has voluntarily opted for a predominantly fruit and raw vegetable-based diet, periodically engaging in prolonged total fasting (ranging from a minimum of 4 days to a maximum of 39 days) during which he consumes only water and herbal tea. The most recent fasting period took place from 26 December 2022, to 4 January 2023 (9 days) (Figure 1).

2.2.3. Lymphocytosis

Since 2016, we have been monitoring the blood tests of patient #1 to assess the absolute lymphocytes values and to observe the fluctuations and the trend of lymphocytosis.

2.3. Patients #2, #3, #4, #5, and #6

Patients #2, #3, #4, #5, and #6 were diagnosed in 2019, 2018, 2018, 2009, and 2009, respectively. All of them underwent a maximum of 3 evaluations per year, following the standard good clinical practice for Chronic Lymphocytic Leukemia (Table 2). We selected the B cells from each patient simultaneously in 2021.

2.4. Selection of B Cells

We collected Peripheral Blood Mononuclear Cells (PBMCs) from all six patients with CLL. The patients were divided into two groups as follows: in the 1st group, we selected CD19+ cells from blood samples of patient #1 at 20 time-points (16 time-points during nutrition and 4 time-points during fasting). As for the 2nd group, we opted for only 1 time-point for each patient (#2, #3, #4, #5, and #6) due to their various nutritional regimens. PBMCs from all CLL patients were isolated using LymphoprepTM density gradient centrifugation (STEMCELL Technologies, Vancouver, BC, Canada) at 800 rpm for 20 min. Subsequently, CD19+ cells were purified from the PBMCs of all six patients using MACS CD19 Microbeads (Miltenyi Biotec, Bologna, Italy), following the manufacturer’s instructions. The CD19+ cells were then resuspended in 50 μL of RNA later (Thermo Fisher, Milano, Italy) and stored in a cell bank at −20 °C until RNA extraction was performed [14].

2.5. Total RNA Preparation

Gene expression profiling was conducted on total RNA extracted from CD19+ cells of the six patients using MagMAX 96 Total RNA Isolation Kit (Thermo Fisher Scientific), according to the manufacturer’s instructions. The quality and yield of the extracted RNA were assessed using the NanoDrop™ 2000 Spectrophotometers (Thermo Fisher Scientific).

2.6. Gene Expression Profiling Experiments

We performed microarray analyses on BM CD19+ cell samples (n = 20) from patient #1 (as described earlier) and BM CD19+ cell samples (n = 5) from each of patients #2, #3, #4, #5, and #6. The whole transcriptome analysis of isolated RNA was carried out on the CD19+ cells of all CLL patients using the human Clariom™ D Pico Assay (Affymetrix, Thermo Fisher Scientific). We decided to prepare 25 arrays: 20 for the 1st group and 1 array for each patient in the 2nd group. For each sample, 5 ng/µL of total RNA in 20 µL of nuclease-free water was retrotranscribed into single-stranded cDNA containing a T7 promoter sequence at the 5′ end. Subsequently, a 3′ adaptor was added to the single-stranded cDNA, serving as a template for double-stranded cDNA synthesis in a pre-IVT amplification reaction. The reaction involved the use of DNA polymerase and RNase H to simultaneously degrade RNA and synthesize single-stranded cDNA with the 3′ adaptor. Taq DNA polymerase and specific primer adapters were then added to the single-stranded cDNA to synthesize and pre-amplify the double-stranded. The pre-IVT amplification reaction was optimized with 9 cycles of amplification, as previously reported by Taq DNA polymerase [18]. To synthesize cRNA, the double-stranded cDNA was used as a template, and the amplification reaction was carried out for 16 h at 40 °C, followed by cooling to 4 °C. The RT-IVT method was performed following the technique developed by Van Gelder et al. [19]. Subsequently, 20 µg of purified cRNA was resuspended in 24 µL nuclease-free water to obtain sense-strand cDNA, followed by RNase H digestion for single-stranded cDNA synthesis. After hydrolysis, 5.5 µg of single-stranded cDNA was resuspended in 46 µL of nuclease-free water in preparation for the next step of fragmentation and labeling. Fragmentation of single-stranded cDNA was achieved using uracil-DNA glycosylase (UDG) and apurinic/apyrimidinic endonuclease 1 (APE1); the labeling of single-stranded cDNA was performed by terminal Deoxynuocleotydil transferase (TdT). Next, 200 µL of the hybridization cocktail was injected into a single Whole Transcript 49-Format array and loaded into the Affymetrix GeneChip™ Hybridization Oven 645 with rotation at 60 rpm for 16 h at 45 °C. Finally, the arrays were washed and stained using an Affymetrix GeneChip™ Fluidics Station 450, following the fluidics protocol (FS450_0001), and scanned with an Affymetrix GeneChip™ Scanner.

2.7. Bioinformatic Analysis of GEP Data

The Microarray CEL files were subjected to background correction, normalization, and summarization using the robust multiarray average (RMA) method [20]. Significance Analysis of Microarrays (SAM, version 3.0) was employed to assess significant differentially expressed genes between the 1st group and 2nd group of CLL patients [21]. Control for multiple testing was carried out using false discovery rate (FDR), employing the implementation proposed by Storey and Tibshirani [22]. Control probes and probes with an average expression level or variance below the first quartile were filtered out preliminary to enhance statistical power. Hierarchical agglomerative clustering was performed on the samples using Ward distance, considering only the differentially expressed genes. Finally, to further examine the similarities and differences among samples, we calculated the Euclidean pair-wise distance between samples based on the genes selected as differentially expressed. Using this distance as weight, we constructed a minimum spanning tree (MST), which is an undirected graph that connects all the nodes, i.e., the samples, together, without any cycles and with the minimum possible total edge weight (where an edge weight represents the Euclidean distance between samples). All analyses were conducted using R Studio (version 2022.07.2+576) software.

3. Results

3.1. ALC and Lymphocytosis Trend of Patient #1

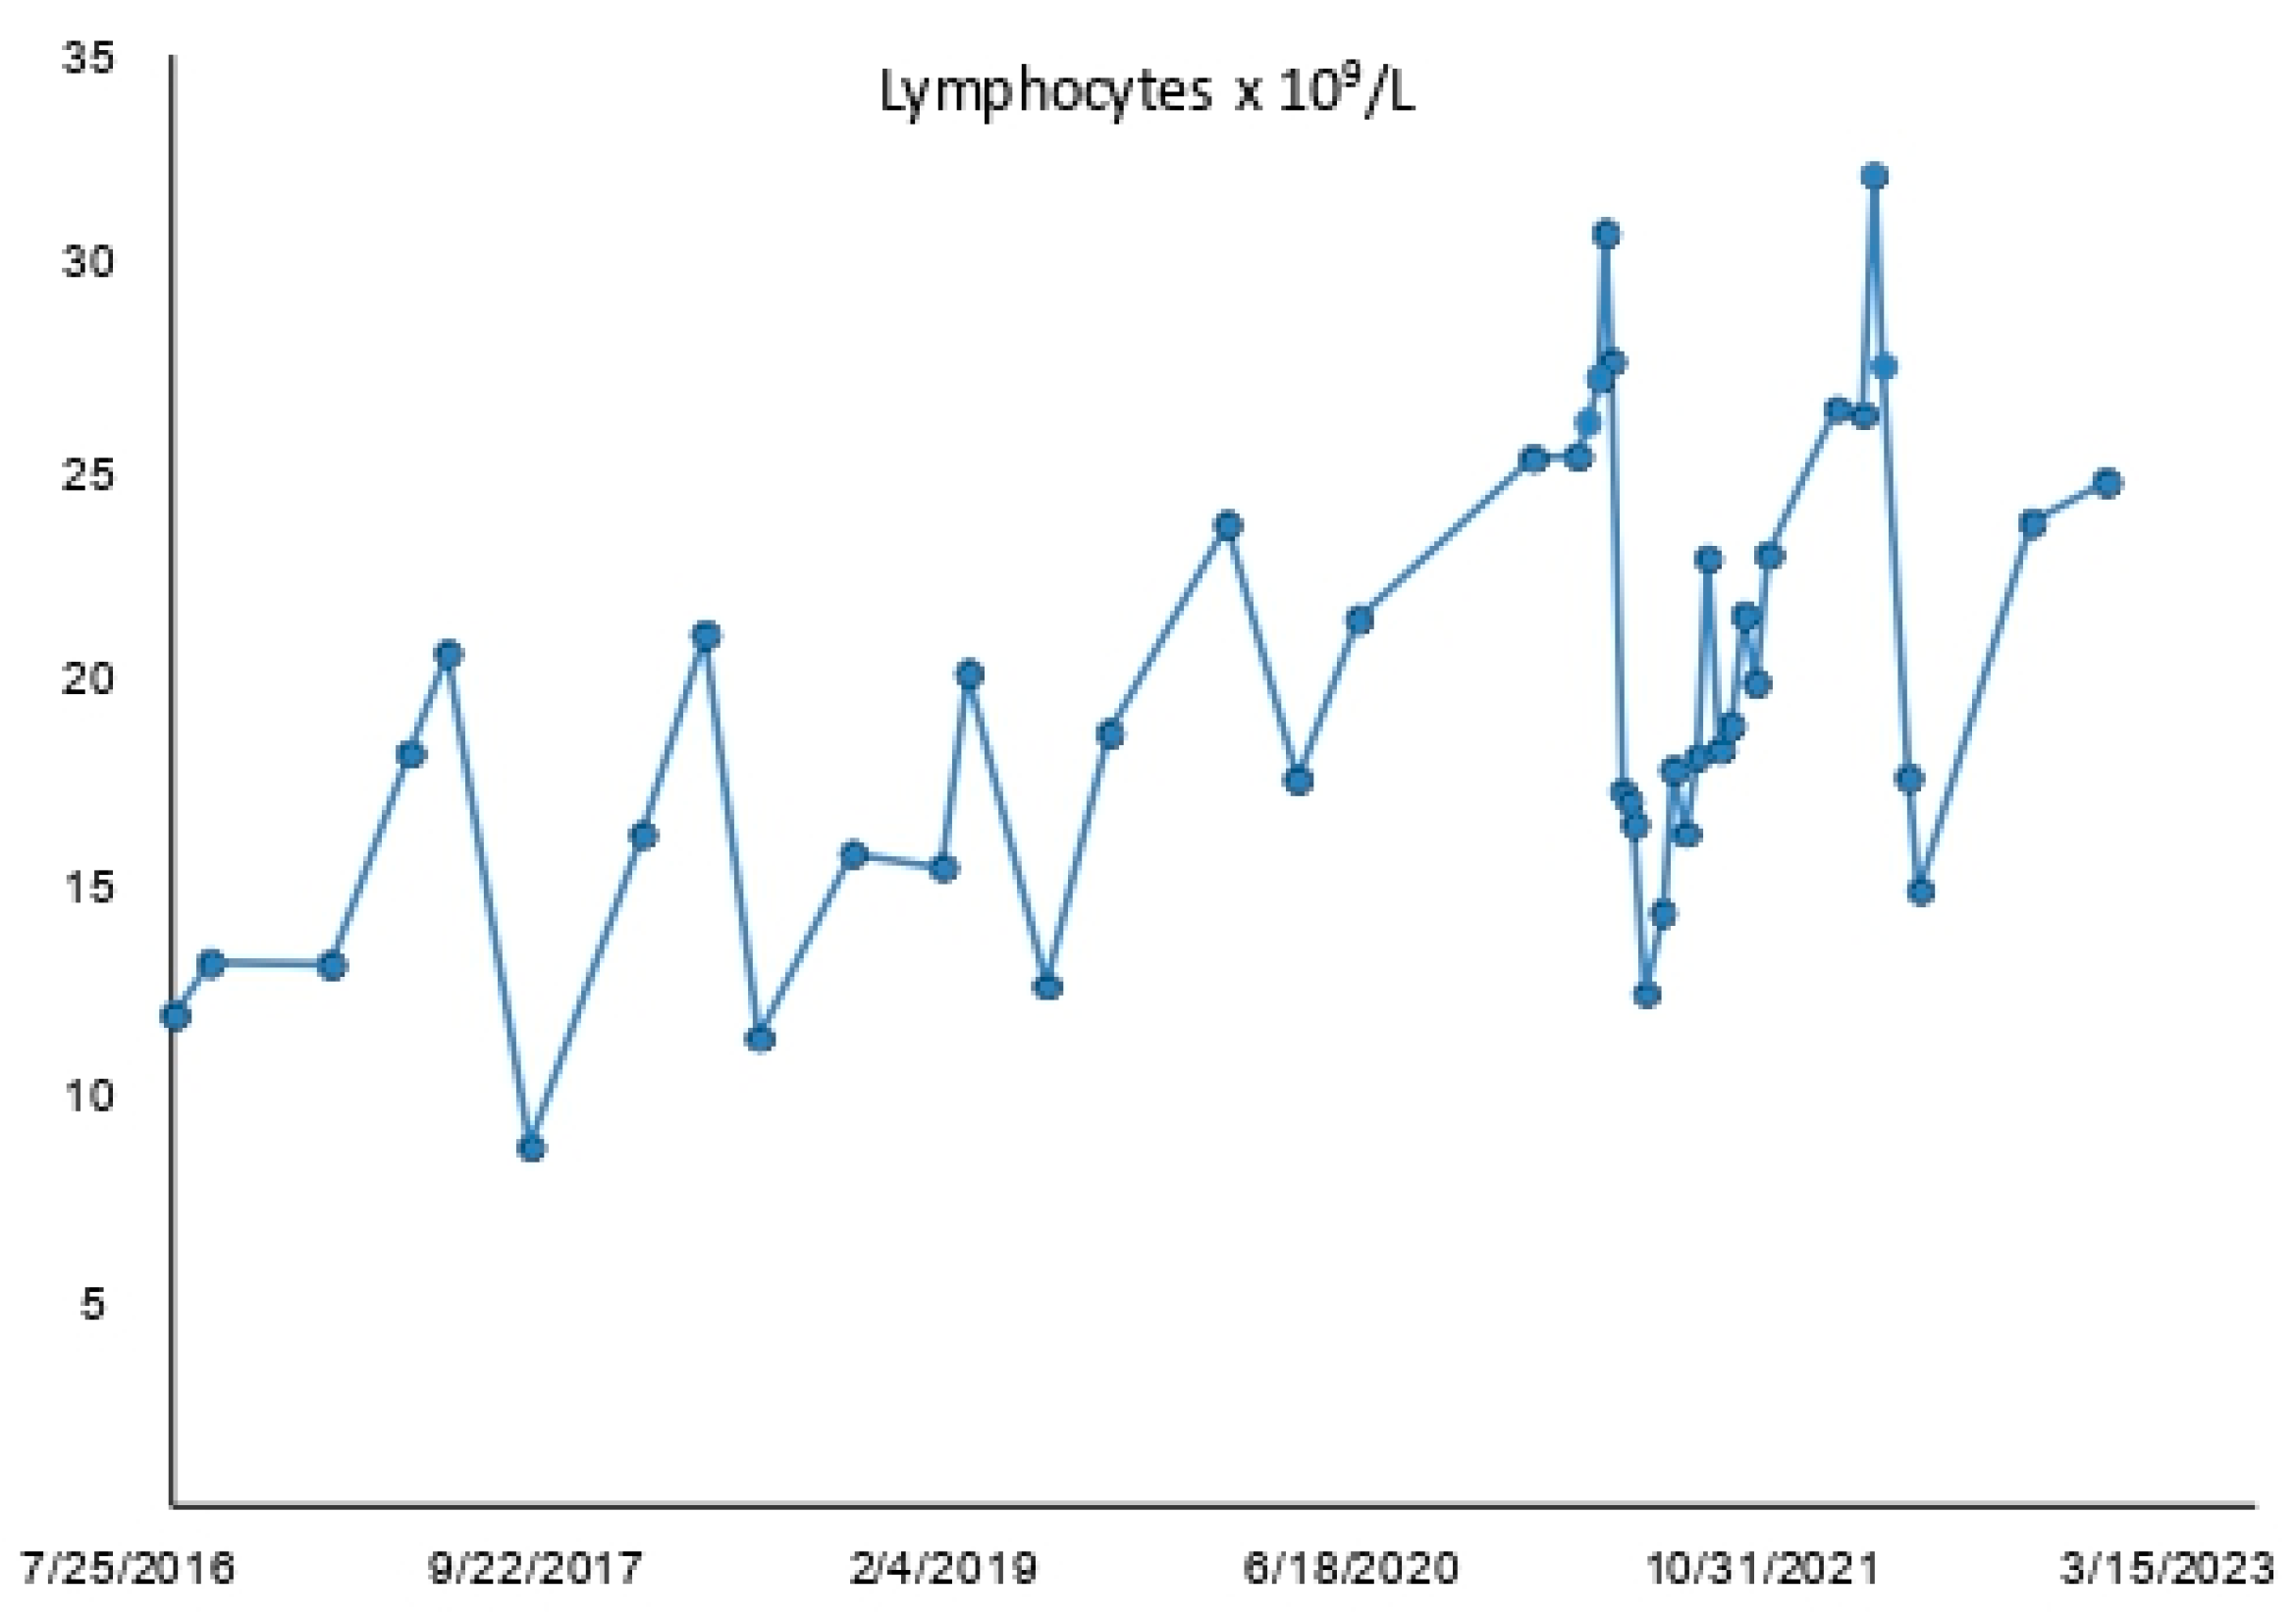
We monitored the absolute lymphocyte counts between 2016 and 2023, and we observed significant deep fluctuations of lymphocytosis during this period, as shown in Figure 2.
In 2021, we began to investigate this phenomenon further and observed that, between April and July 2021 (1–9) and between March and June 2022 (10–14), the ALC of patient #1 was approximately halved (Table 3). Particularly, during the period approximately 4 to 6 weeks post-fasting, the trend of lymphocytosis was on a decreasing trajectory, reaching minimal values.

3.2. ALC and Lymphocytosis of Patients #2, #3, #4, #5, and #6

As observed in Table 2, all patients in the 2nd group did not exhibit fluctuations in the absolute lymphocytes count but instead showed a growing trend of lymphocytes over time.

3.3. Cluster Dendrogram Patient #1 vs. Patients #2, #3, #4, #5, and #6

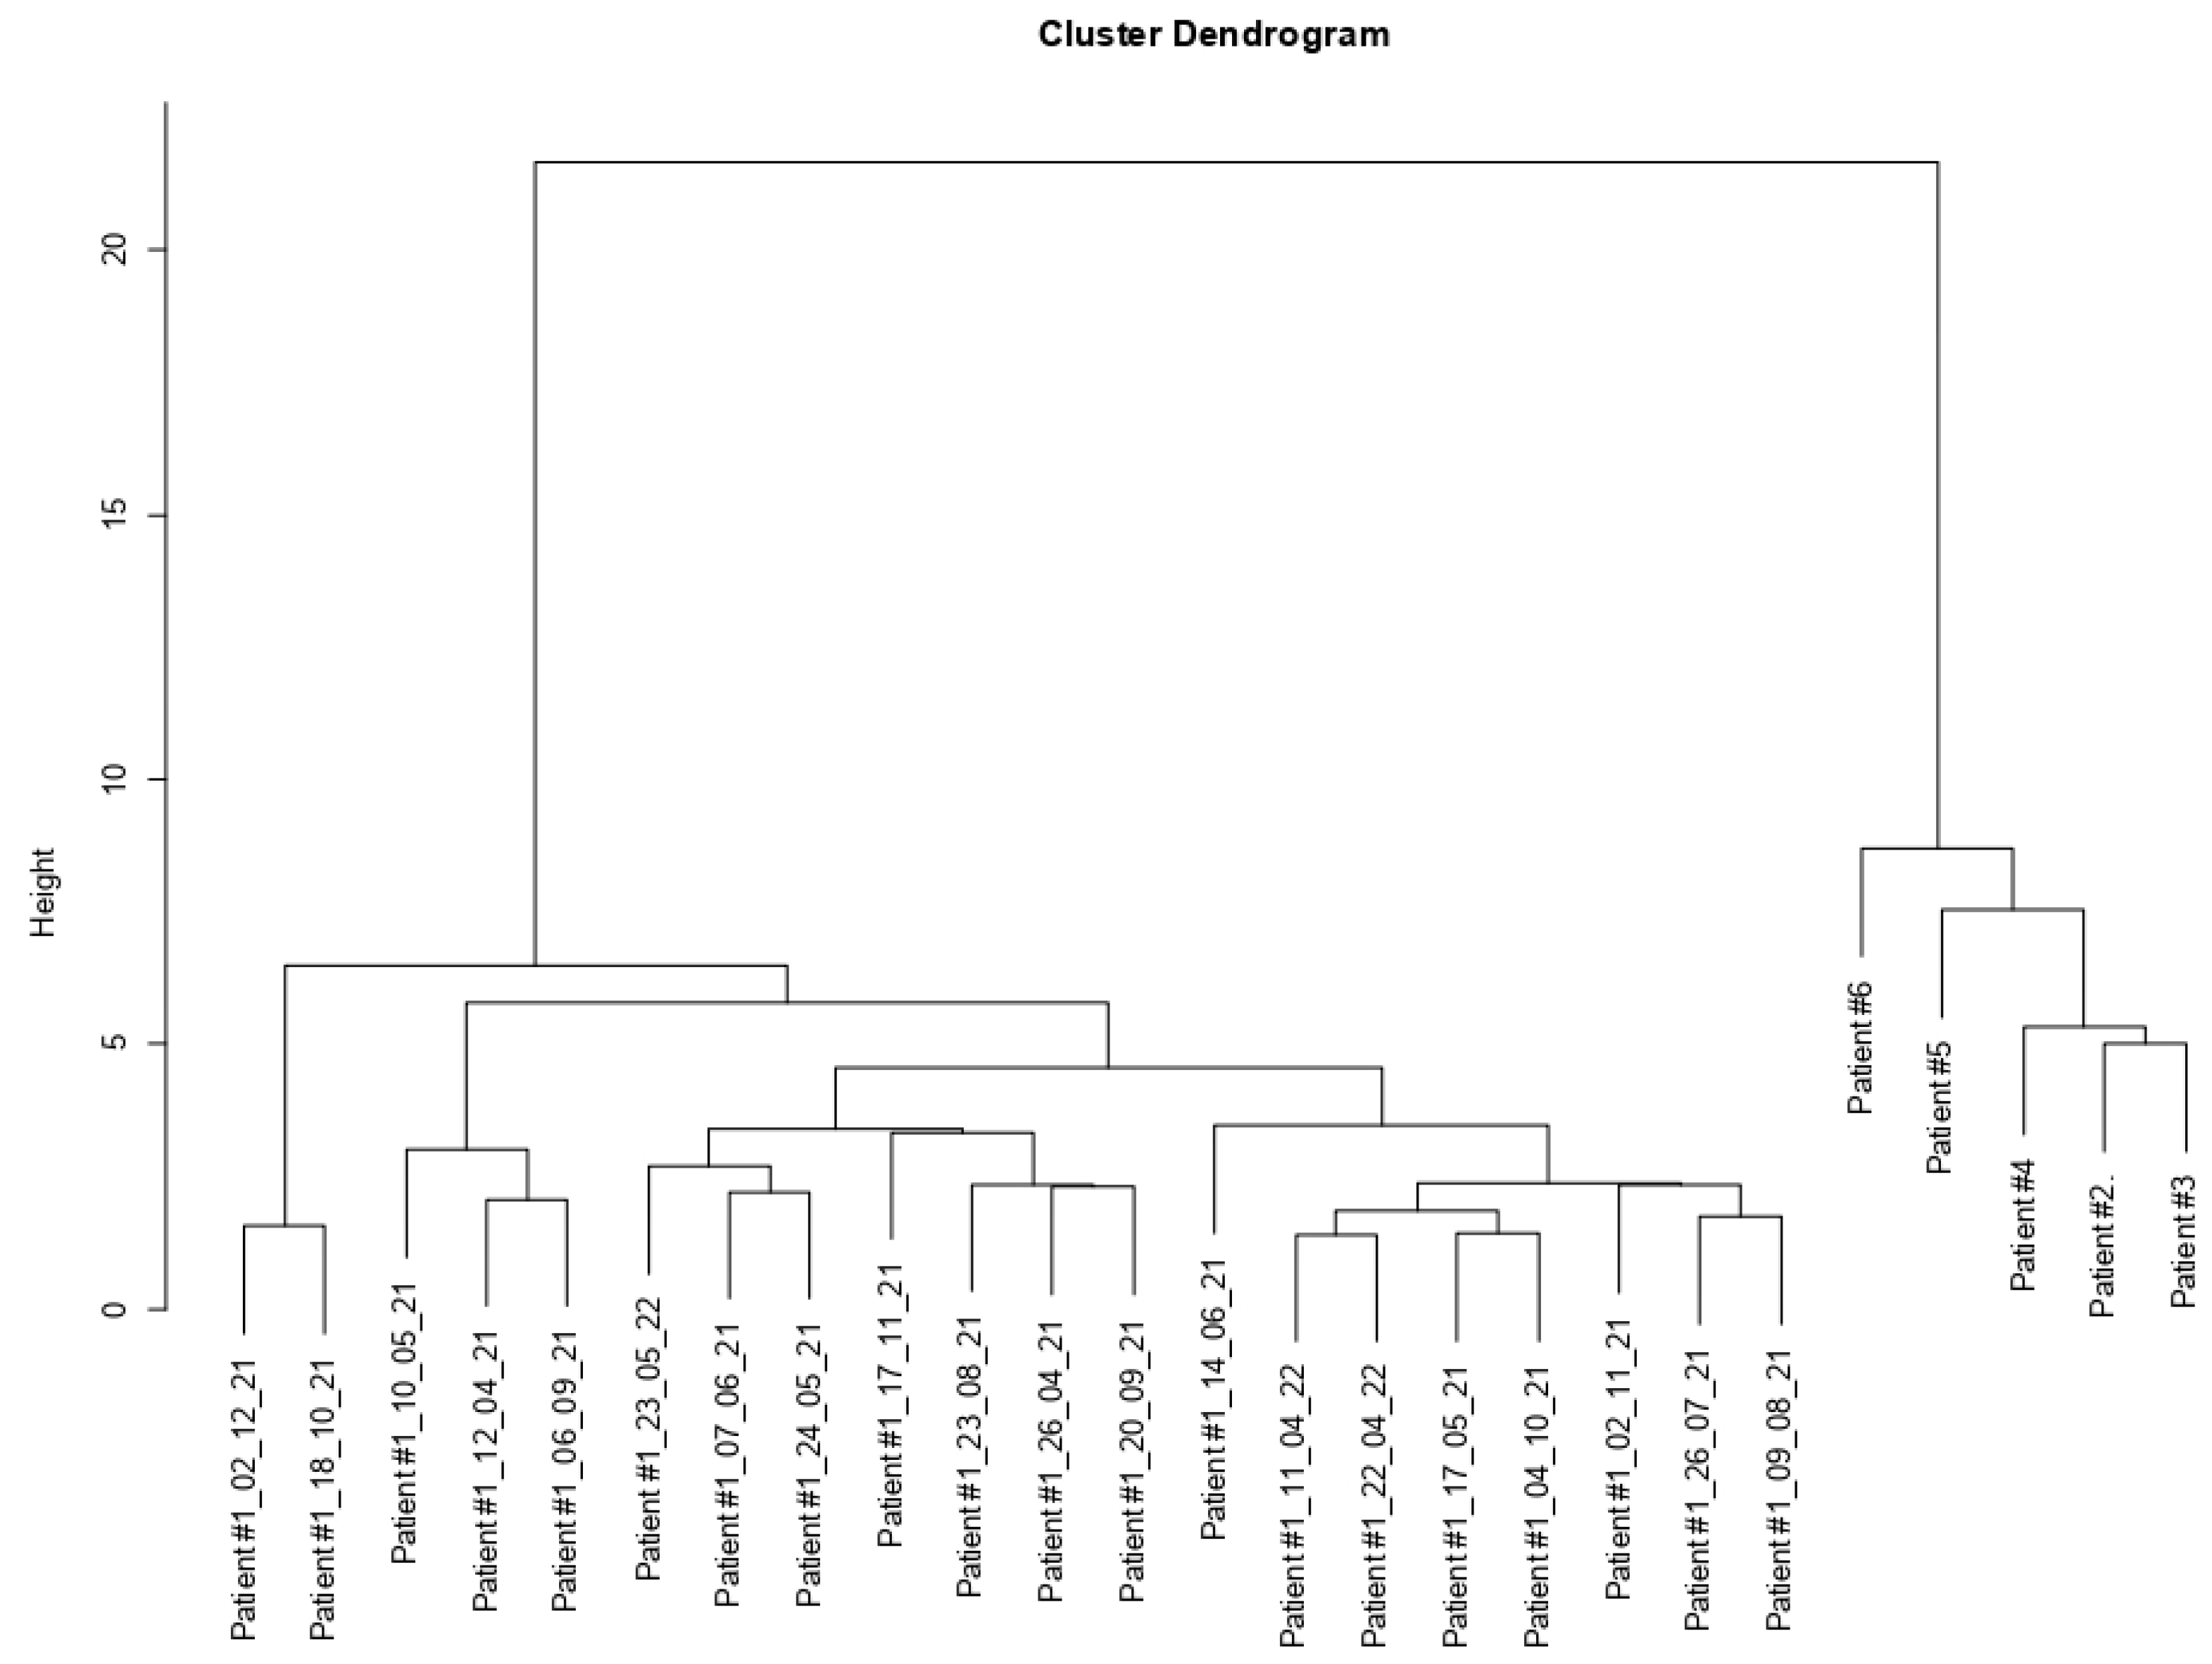
The results of hierarchical clustering are depicted using a tree-based representation known as a dendrogram in Figure 3. Patients #2, #3, #4, #5, and #6 clustered together, independently from patient #1.

3.4. Nine Genes Were Differently Expressed in the CLL Patient Who Followed Prolonged Periodic Fasting vs. CLL Patients with a Varied Diet

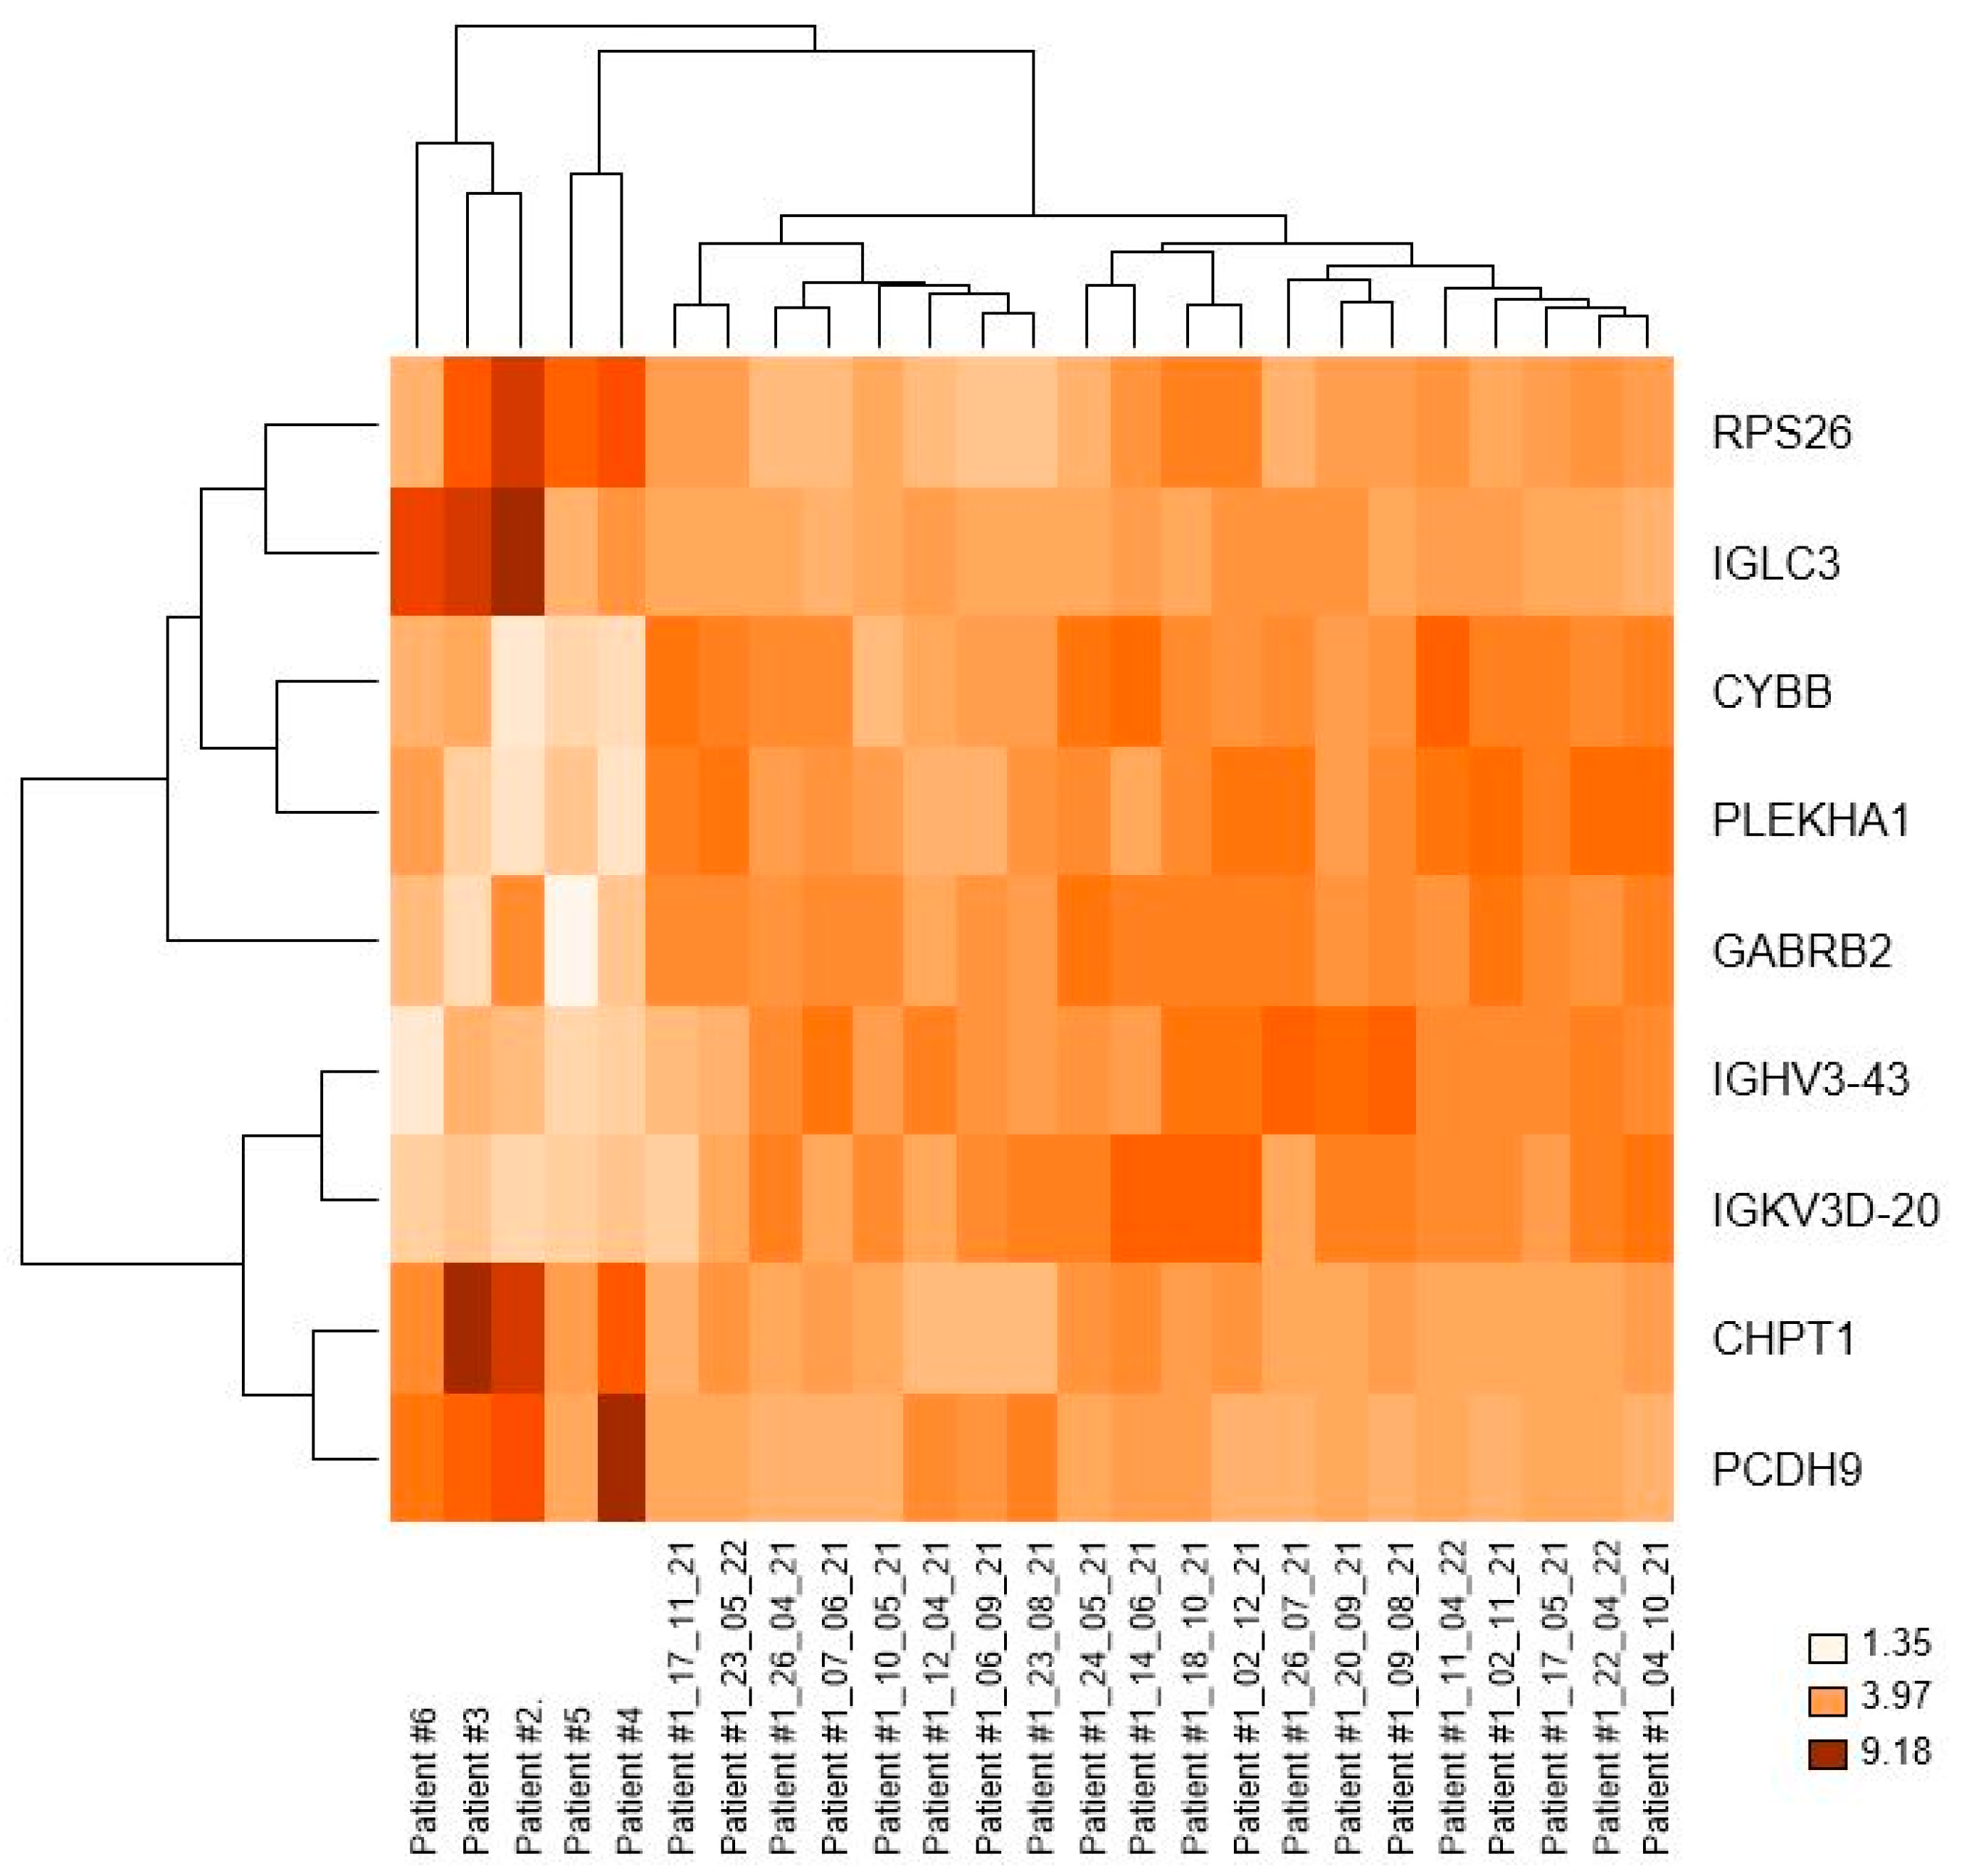
Differential expression analysis, revealed, after correction for multiple testing, 18 differentially expressed genes (DEGs) in the comparison between CD19+ cells of patient #1 and patients #2, #3, #4, #5, and #6. Among them, we focused on nine genes with functional annotation: four genes were downregulated (IGLC3, RPS26, CHPT1, and PCDH9), and five genes were upregulated (IGHV3-43, IGKV3D-20, PLEKHA1, CYBB, and GABRB2) in the 1st group (patient #1) vs. the 2nd group of patients (#2, #3, #4, #5, and #6 (Table 4). In particular, IGLC3, RPS26, PLEKHA1, CYBB, and GABRB2 exhibited a high fold change (FC) > 3. Among them, RPS26, CHPT1, CYBB, and GABRB2 were found to be associated with KEGG pathways, as shown in Table 5. Additionally, we generated a heat map on log2 expression of the nine differentially expressed genes across different patients/conditions (Figure 4). False discovery rate (FDR) (q-value) and FC values are provided in Table 4.

3.5. Minimun Spanning Tree (MST) of Patient #1 vs. Patients #2, #3, #4, #5, and #6

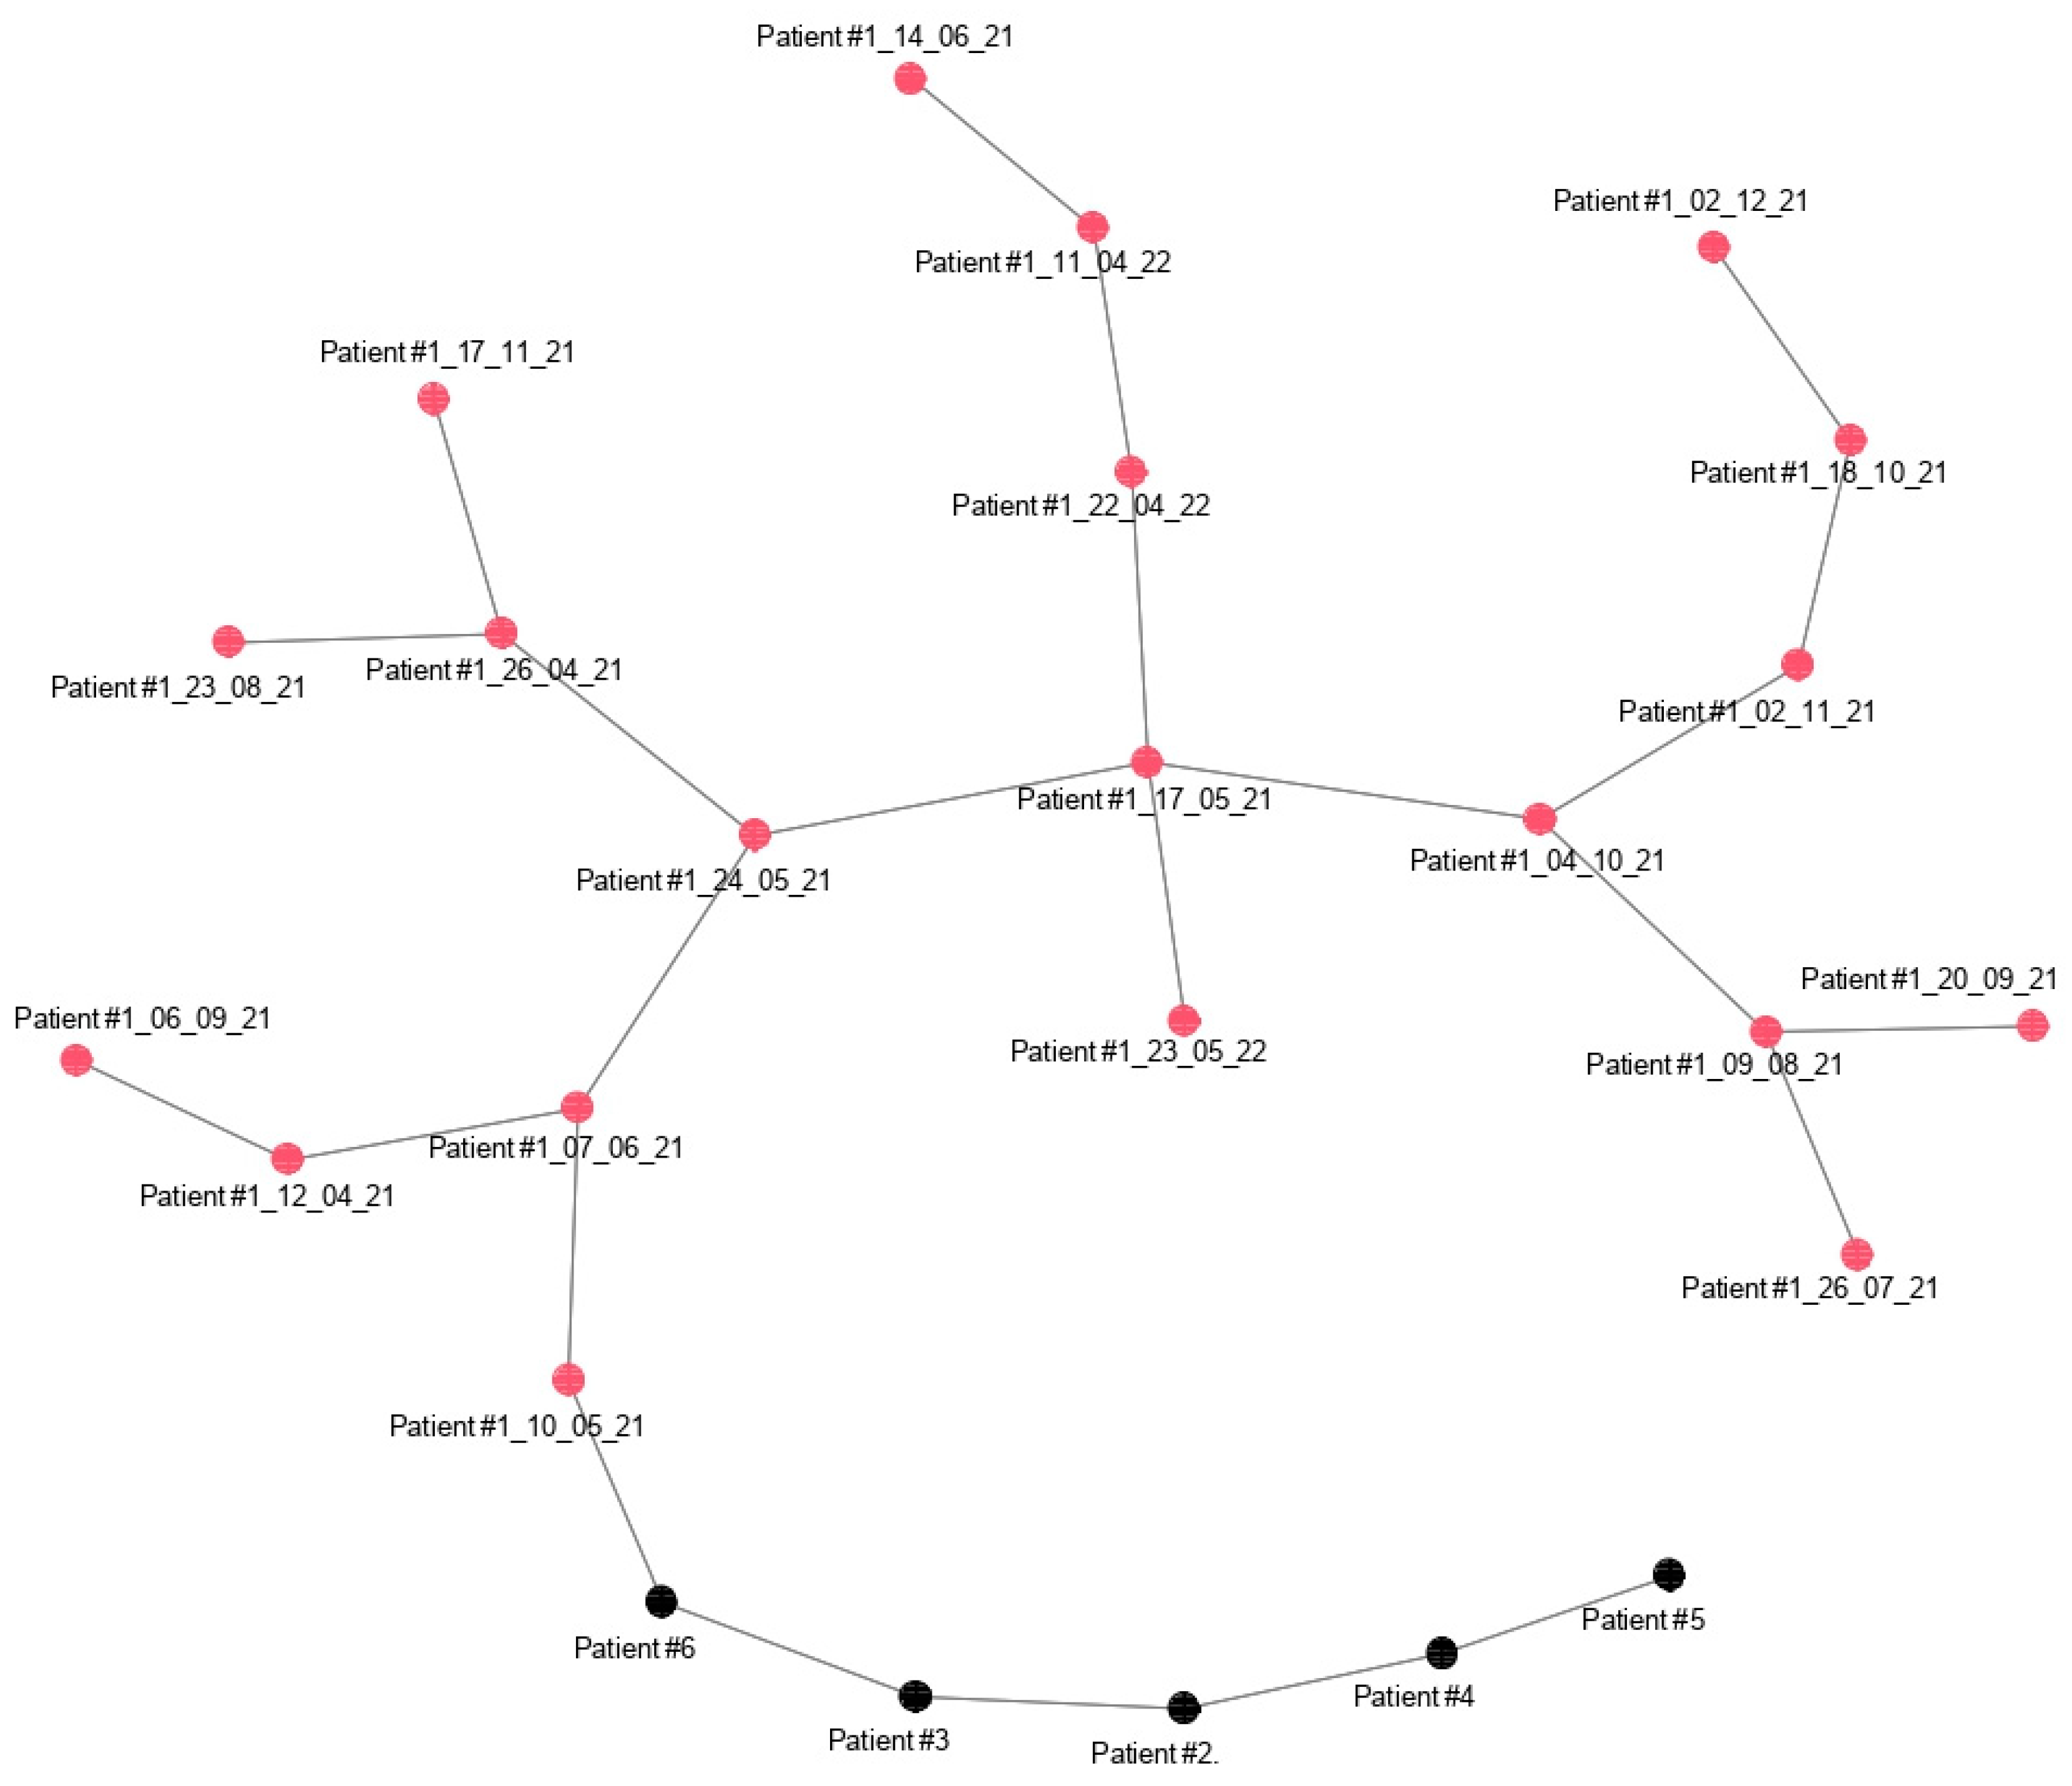
As explained in the methods, we also computed the Euclidean pair-wise distance between samples of patient #1 (during nutrition and fasting) and samples of patient #2, #3, #4, #5, and #6 (following a varied diet), using this distance as the weight. Consequently, we constructed a minimum spanning tree (MST) that displays, within the same graph, the subjects as colored nodes and the pairs of closest subjects connected by edges. Black and red dots represent the samples from the 2nd group and the 1st group, respectively (Figure 5). Once again, patients #2, #3, #4, #5, and #6 are closer to each other than to any other sample belonging to patient #1.

4. Discussion

Here, we present a patient with CLL who self-referred to the Department of Hematology and Oncology at the ASST Grande Ospedale Metropolitano Niguarda since the time of diagnosis in 2016. Up until now, he has not required treatment and he voluntarily follows a mainly fruitarian and vegetarian diet, incorporating long periods of absolute fasting since 2016. Specifically, he observed periods of absolute fasting, consuming only water and herbal tea, as follows: 2017 (39 days), 2018 (17 days), 2019 (21 days), 2020 (27 days), 2021 (33, 4, 4, and 6 days), 2022 (26, 19, and 5 days), and in 2023 (4 days). We directed our attention to the lymphocytosis, which revealed repetitive fluctuations in the absolute lymphocyte counts since diagnosis (Figure 2). Interestingly, we observed that approximately 4 to 6 weeks after the end of fasting, the absolute lymphocyte count was reduced by about half, as shown in Table 3.
Our study aimed to explore whether these significant deep fluctuations in the absolute lymphocyte count could be attributed to the periods of fasting. To achieve this goal, we opted to conduct a highly detailed examination of the whole transcriptome profiling using microarray analysis with the human Clariom™ D Pico Assay, one of the most recent and powerful tools for generating high-fidelity biomarker signatures. We conducted a whole transcriptome analysis on CD19+ cells obtained from patient #1 under different nutritional conditions (nutrition and fasting) vs. the same cells from five untreated CLL patients who followed a varied nutrition regimen without fasting at a single time point, as detailed in the materials and methods section.
A potential limitation of our study is the small sample size, as well as the absence of trend analyses for the absolute lymphocyte count in both groups. These factors could restrict the establishment of a cause–effect relationship and the generalizability of our findings. However, we plan to conduct GEP experiments on a larger cohort of patients with CLL to evaluate the molecular signature that distinguishes group 1 from group 2. Currently, we are unable to investigate other CLL patients with the same unique characteristics as patient #1, but we will continue to monitor and collect B cell samples from him as he maintains prolonged fasting periods.
Hierarchical clustering analysis revealed that patient #1, during nutrition and fasting, (1st group) clustered separately from all CLL patients (2nd group), indicating a gene expression signature that differentiated patient #1 from patients #2, #3, #4, #5, and #6 as depicted in Figure 3. GEP results showed that nine genes were significantly differently expressed between patient #1 (1st group) and patients #2, #3, #4, #5, and #6 (2nd group). Among these genes, four genes were downregulated (IGLC3, RPS26, CHPT1, and PCDH9) and five were upregulated (IGHV3-43, IGKV3D-20, PLEKHA1, CYBB, and GABRB2) in the 1st group compared to the 2nd group. Consequently, we explored the potential role of these genes in CLL and cancer.
The ribosomal protein S26 (RPS26) functions as a checkpoint for T lymphocyte survival and homeostasis in a p53-dependent manner, as reported by Chen et al. [23], and Zhao et al. [24], who demonstrated its upregulation in acute lymphoblastic leukemia (ALL) through qRT-qPCR analysis. In our study, we observed an overexpression of RPS26 in CLL patients belonging to the 2nd group compared to the 1st group.
In our previous GEP study involving 112 CLL patients, we found that UMZAP70+ subjects exhibited upregulation of genes encoding enzymes involved in lipid metabolism, including CHPT1 [14]. Additionally, we established that the downregulation of CHPT1 in CLL correlated with a favorable prognosis [14]. In this study, we confirmed our previous GEP findings by demonstrating that CHPT1 expression was significantly under expressed in the 1st group compared to the 2nd group of CLL patients. On the other hand, some studies have shown that the downregulation of CHPT1 is associated with an unfavorable prognosis in certain types of solid tumors, such as breast cancer [25] and lung cancer [26]. As for lipid metabolism in CLL, several authors have reported a high incidence of hypercholesterolemia in CLL patients, and the use of statins may have an impact on the clinical course of the disease [27]. Furthermore, a study utilizing an in vitro model of the pseudofollicles from which CLL cells originate, demonstrated that low-density lipoproteins (LDLs) increased plasma membrane cholesterol and promoted CLL cell proliferation. The findings of this study suggested a potential survival benefit from cholesterol-lowering statin drugs in CLL patients [28].
Some authors have indicated that the downregulation, loss of expression, and deletion of PCDH9 were associated with the progression of prostate cancer [29], epithelial ovarian cancer [30], glioma [31,32], and gastric cancer [33]. In our study, we showed the downregulation of PCDH9 in the 1st group vs. the 2nd group of CLL patients, and further investigations will shed light on the potential role of PCDH9 in CLL. As for CYBB, it has been relatively less studied. Some authors found that CYBB was upregulated in Chronic Myeloid Leukemia (CML) [34], while it served as a prognostic and diagnostic marker in myeloproliferative neoplasms (MPN) [35]. In our GEP study, we observed the upregulation of CYBB in the 1st group compared to the 2nd group of CLL patients. CYBB is involved in KEGG pathways related to cell death, such as ferroptosis and necroptosis, as presented in Table 5.
GABRB2 plays a crucial role in the formation of the GABAA receptor in the mammalian brain, and its expression can vary in solid tumors. It has been found to be upregulated in salivary gland cancer [36], adrenocortical carcinoma [37], and lymph node metastases of papillary thyroid carcinoma [38]. Conversely, GABRB2 was downregulated in colorectal cancer [39], brain tumors [40,41], and kidney tumors [42]. To the best of our knowledge, this is the first study to highlight changes in GABRB2 expression in CLL, demonstrating that this gene was overexpressed in the 1st compared to the 2nd group of CLL patients. Numerous research studies have shown that fasting can confer various benefits, including regulation of metabolism (lipid, glucose, protein, and neuroendocrine), reduction in inflammation, and, concerning cancer, the inhibition of signals promoting cellular growth and survival [43,44]. Furthermore, some authors have proposed a potential role for prolonged periodic fasting during conventional cancer treatment, aiming to enhance therapeutic efficacy and limit side effects in cancer patients [44].

5. Conclusions

To the best of our knowledge, this is the first transcriptome study analyzing a patient with CLL who has followed a nutrition primarily based on vegetables and fruits, combined with long-term periodic fasting since diagnosis, and exhibited significant deep fluctuations in lymphocytosis. We presented a novel gene expression signature that distinguished patient #1 from five CLL patients who followed a varied diet. Future investigations should be conducted to elucidate the potential role of fasting in maintaining the absolute lymphocyte counts in patient #1. Additionally, we will explore whether this small signature could be valuable for future studies related to CLL prognostication.

Author Contributions

Conceptualization, L.E.B., C.P., A.T. and R.C.; methodology, L.E.B., C.P., A.T. and R.C.; validation, A.T. and R.C.; formal analysis, B.D.C.; investigation, L.E.B., C.P. and A.M.; resources, A.T. and R.C.; data curation, B.D.C.; writing—original draft preparation, L.E.B., C.P. and A.T.; writing—review and editing, L.E.B., C.P., A.M., L.M.S., A.T., A.B. and R.C.; visualization, L.E.B., C.P., A.T. and B.D.C.; supervision, R.C.; project administration, A.T. and R.C.; funding acquisition, R.C. All authors have read and agreed to the published version of the manuscript.

Funding

This study was financially supported, exclusively for reagents to perform the microarray experiments, by Fondazione Malattie del Sangue (FMS) Onlus and Villaggio Amico S.r.l. The funding source had no role in study design, data collection, data analysis, data interpretation, writing of the report, or submission of the report as an article for publication.

Institutional Review Board Statement

Not applicable.

Informed Consent Statement

Informed consent was obtained from all subjects.

Data Availability Statement

All data involved in this work will be made available by the corresponding authors upon request ([email protected] or [email protected]).

Acknowledgments

We would like to thank Fondazione Malattie del Sangue (FMS) Onlus and Villaggio Amico S.r.l. for their financial support.

Conflicts of Interest

The authors have no conflict of interest to disclose.

References

  1. Hallek, M.; Al-Sawaf, O. Chronic lymphocytic leukemia: 2022 update on diagnostic and therapeutic procedures. Am. J. Hematol. 2021, 96, 1679–1705. [Google Scholar] [CrossRef] [PubMed]
  2. Kipps, T.J.; Stevenson, F.K.; Wu, C.J.; Croce, C.M.; Packham, G.; Wierda, W.G.; O’Brien, S.; Gribben, J.; Rai, K. Chronic lymphocytic leukaemia. Nat. Rev. Dis. Primers 2017, 3, 16096. [Google Scholar] [CrossRef] [PubMed] [Green Version]
  3. Montague, A.M.; Pathak, S. Chronic Lymphocytic Leukemia with Variant Genetics. In StatPearls; StatPearls Publishing: Treasure Island, FL, USA, 2022. [Google Scholar]
  4. Hallek, M.; Cheson, B.D.; Catovsky, D.; Caligaris-Cappio, F.; Dighiero, G.; Döhner, H.; Hillmen, P.; Keating, M.; Montserrat, E.; Chiorazzi, N.; et al. iwCLL guidelines for diagnosis, indications for treatment, response assessment, and supportive management of CLL. Blood 2018, 131, 2745–2760. [Google Scholar] [CrossRef] [PubMed] [Green Version]
  5. Schroers, R.; Griesinger, F.; Trümper, L.; Haase, D.; Kulle, B.; Klein-Hitpass, L.; Sellmann, L.; Dührsen, U.; Dürig, J. Combined analysis of ZAP-70 and CD38 expression as a predictor of disease progression in B-cell chronic lymphocytic leukemia. Leukemia 2005, 19, 750–758. [Google Scholar] [CrossRef] [PubMed]
  6. Rai, K.R.; Sawitsky, A.; Cronkite, E.P.; Chanana, A.D.; Levy, R.N.; Pasternack, B.S. Clinical staging of chronic lymphocytic leukemia. Blood 1975, 46, 219–234. [Google Scholar] [CrossRef] [Green Version]
  7. Binet, J.L.; Auquier, A.; Dighiero, G.; Chastang, C.; Piguet, H.; Goasguen, J.; Vaugier, G.; Potron, G.; Colona, P.; Oberling, F.; et al. A new prognostic classification of chronic lymphocytic leukemia derived from a multivariate survival analysis. Cancer 1981, 48, 198–206. [Google Scholar] [CrossRef]
  8. Kay, N.E.; Hampel, P.J.; Van Dyke, D.L.; Parikh, S.A. CLL update 2022: A continuing evolution in care. Blood Rev. 2022, 54, 100930. [Google Scholar] [CrossRef]
  9. Catherwood, M.A.; Gonzalez, D.; Donaldson, D.; Clifford, R.; Mills, K.; Thornton, P. Relevance of TP53 for CLL diagnostics. J. Clin. Pathol. 2019, 72, 343–346. [Google Scholar] [CrossRef]
  10. Chiorazzi, N.; Chen, S.S.; Rai, K.R. Chronic Lymphocytic Leukemia. Cold Spring Harb. Perspect. Med. 2021, 11, a035220. [Google Scholar] [CrossRef] [Green Version]
  11. Mansouri, L.; Thorvaldsdottir, B.; Sutton, L.A.; Karakatsoulis, G.; Meggendorfer, M.; Parker, H.; Nadeu, F.; Brieghel, C.; Laidou, S.; Moia, R.; et al. Different prognostic impact of recurrent gene mutations in chronic lymphocytic leukemia depending on IGHV gene somatic hypermutation status: A study by ERIC in HARMONY. Leukemia 2023, 37, 339–347. [Google Scholar] [CrossRef]
  12. Zhang, S.; Kipps, T.J. The pathogenesis of chronic lymphocytic leukemia. Annu. Rev. Pathol. 2014, 9, 103–118. [Google Scholar] [CrossRef] [PubMed] [Green Version]
  13. Abrisqueta, P.; Medina, D.; Villacampa, G.; Lu, J.; Alcoceba, M.; Carabia, J.; Boix, J.; Tazón-Vega, B.; Iacoboni, G.; Bobillo, S.; et al. A gene expression assay based on chronic lymphocytic leukemia activation in the microenvironment to predict progression. Blood Adv. 2022, 6, 5763–5773. [Google Scholar] [CrossRef] [PubMed]
  14. Trojani, A.; Di Camillo, B.; Tedeschi, A.; Lodola, M.; Montesano, S.; Ricci, F.; Vismara, E.; Greco, A.; Veronese, S.; Orlacchio, A.; et al. Gene expression profiling identifies ARSD as a new marker of disease progression and the sphingolipid metabolism as a potential novel metabolism in chronic lymphocytic leukemia. Cancer Biomark. 2011, 11, 15–28. [Google Scholar] [CrossRef] [PubMed]
  15. Bilous, N.; Abramenko, I.; Chumak, A.; Dyagil, I.; Martina, Z. Analysis of LPL gene expression in patients with chronic lymphocytic leukemia. Exp. Oncol. 2019, 41, 39–45. [Google Scholar] [CrossRef] [PubMed]
  16. Chen, J.; Sathiaseelan, V.; Moore, A.; Tan, S.; Chilamakuri, C.S.R.; Roamio Franklin, V.N.; Shahsavari, A.; Jakwerth, C.A.; Hake, S.B.; Warren, A.J.; et al. ZAP-70 constitutively regulates gene expression and protein synthesis in chronic lymphocytic leukemia. Blood 2021, 137, 3629–3640. [Google Scholar] [CrossRef]
  17. Döhner, H.; Stilgenbauer, S.; Benner, A.; Leupolt, E.; Kröber, A.; Bullinger, L.; Döhner, K.; Bentz, M.; Lichter, P. Genomic aberrations and survival in chronic lymphocytic leukemia. N. Engl. J. Med. 2000, 343, 1910–1916. [Google Scholar] [CrossRef] [Green Version]
  18. Di Mauro, S.; Scamporrino, A.; Petta, S.; Urbano, F.; Filippello, A.; Ragusa, M.; Di Martino, M.T.; Scionti, F.; Grimaudo, S.; Pipitone, R.M.; et al. Serum coding and non-coding RNAs as biomarkers of NAFLD and fibrosis severity. Liver Int. 2019, 39, 1742–1754. [Google Scholar] [CrossRef] [Green Version]
  19. Van Gelder, R.N.; von Zastrow, M.E.; Yool, A.; Dement, W.C.; Barchas, J.D.; Eberwine, J.H. Amplified RNA synthesized from limited quantities of heterogeneous cDNA. Proc. Natl. Acad. Sci. USA 1990, 87, 1663–1667. [Google Scholar] [CrossRef]
  20. Irizarry, R.A.; Bolstad, B.M.; Collin, F.; Cope, L.M.; Hobbs, B.; Speed, T.P. Summaries of Affymetrix GeneChip probe level data. Nucleic Acids Res. 2003, 31, e15. [Google Scholar] [CrossRef]
  21. Tusher, V.G.; Tibshirani, R.; Chu, G. Significance analysis of microarrays applied to the ionizing radiation response. Proc. Natl. Acad. Sci. USA 2001, 98, 5116–5121. [Google Scholar] [CrossRef]
  22. Storey, J.D.; Tibshirani, R. Statistical significance for genomewide studies. Proc. Natl. Acad. Sci. USA 2003, 100, 9440–9445. [Google Scholar] [CrossRef] [PubMed]
  23. Chen, C.; Peng, J.; Ma, S.; Ding, Y.; Huang, T.; Zhao, S.; Gao, L.; Liang, X.; Li, C.; Ma, C. Ribosomal protein S26 serves as a checkpoint of T-cell survival and homeostasis in a p53-dependent manner. Cell. Mol. Immunol. 2021, 18, 1844–1846. [Google Scholar] [CrossRef] [PubMed]
  24. Zhao, M.Y.; Yu, Y.; Xie, M.; Yang, M.H.; Zhu, S.; Yang, L.C.; Kang, R.; Tang, D.L.; Zhao, L.L.; Cao, L.Z. Digital gene expression profiling analysis of childhood acute lymphoblastic leukemia. Mol. Med. Rep. 2016, 13, 4321–4328. [Google Scholar] [CrossRef] [PubMed]
  25. Gong, M.; Liu, X.; Yang, W.; Song, H.; Zhao, X.; Ai, X.; Wang, S.; Wang, H. Identification of a Lipid Metabolism-Associated Gene Signature Predicting Survival in Breast Cancer. Int. J. Gen. Med. 2021, 14, 9503–9513. [Google Scholar] [CrossRef]
  26. Lesko, J.; Triebl, A.; Stacher-Priehse, E.; Fink-Neuböck, N.; Lindenmann, J.; Smolle-Jüttner, F.M.; Köfeler, H.C.; Hrzenjak, A.; Olschewski, H.; Leithner, K. Phospholipid dynamics in ex vivo lung cancer and normal lung explants. Exp. Mol. Med. 2021, 53, 81–90. [Google Scholar] [CrossRef]
  27. Chow, S.; Buckstein, R.; Spaner, D.E. A link between hypercholesterolemia and chronic lymphocytic leukemia. Leuk. Lymphoma 2016, 57, 797–802. [Google Scholar] [CrossRef]
  28. McCaw, L.; Shi, Y.; Wang, G.; Li, Y.J.; Spaner, D.E. Low Density Lipoproteins Amplify Cytokine-signaling in Chronic Lymphocytic Leukemia Cells. eBioMedicine 2017, 15, 24–35. [Google Scholar] [CrossRef] [Green Version]
  29. Ren, S.; Wei, G.H.; Liu, D.; Wang, L.; Hou, Y.; Zhu, S.; Peng, L.; Zhang, Q.; Cheng, Y.; Su, H.; et al. Whole-genome and Transcriptome Sequencing of Prostate Cancer Identify New Genetic Alterations Driving Disease Progression. Eur. Urol. 2018, 73, 322–339. [Google Scholar] [CrossRef]
  30. Shi, C.; Zhang, Z. Screening of potentially crucial genes and regulatory factors involved in epithelial ovarian cancer using microarray analysis. Oncol. Lett. 2017, 14, 725–732. [Google Scholar] [CrossRef] [Green Version]
  31. Wang, C.; Yu, G.; Liu, J.; Wang, J.; Zhang, Y.; Zhang, X.; Zhou, Z.; Huang, Z. Downregulation of PCDH9 predicts prognosis for patients with glioma. J. Clin. Neurosci. 2012, 19, 541–545. [Google Scholar] [CrossRef]
  32. Wang, C.; Chen, Q.; Li, S.; Li, S.; Zhao, Z.; Gao, H.; Wang, X.; Li, B.; Zhang, W.; Yuan, Y.; et al. Dual inhibition of PCDH9 expression by miR-215-5p up-regulation in gliomas. Oncotarget 2017, 8, 10287–10297. [Google Scholar] [CrossRef] [PubMed] [Green Version]
  33. Chen, Y.; Xiang, H.; Zhang, Y.; Wang, J.; Yu, G. Loss of PCDH9 is associated with the differentiation of tumor cells and metastasis and predicts poor survival in gastric cancer. Clin. Exp. Metastasis 2015, 32, 417–428. [Google Scholar] [CrossRef] [PubMed]
  34. Youn, M.; Smith, S.M.; Lee, A.G.; Chae, H.D.; Spiteri, E.; Erdmann, J.; Galperin, I.; Jones, L.M.; Donato, M.; Abidi, P.; et al. Comparison of the Transcriptomic Signatures in Pediatric and Adult CML. Cancers 2021, 13, 6263. [Google Scholar] [CrossRef] [PubMed]
  35. Baumeister, J.; Maié, T.; Chatain, N.; Gan, L.; Weinbergerova, B.; de Toledo, M.A.S.; Eschweiler, J.; Maurer, A.; Mayer, J.; Kubesova, B.; et al. Early and late stage MPN patients show distinct gene expression profiles in CD34+ cells. Ann. Hematol. 2021, 100, 2943–2956. [Google Scholar] [CrossRef] [PubMed]
  36. Chen, W.; Liu, B.Y.; Zhang, X.; Zhao, X.G.; Cao, G.; Dong, Z.; Zhang, S.L. Identification of differentially expressed genes in salivary adenoid cystic carcinoma cells associated with metastasis. Arch. Med. Sci. 2016, 12, 881–888. [Google Scholar] [CrossRef] [PubMed] [Green Version]
  37. Knott, E.L.; Leidenheimer, N.J. A Targeted Bioinformatics Assessment of Adrenocortical Carcinoma Reveals Prognostic Implications of GABA System Gene Expression. Int. J. Mol. Sci. 2020, 21, 8485. [Google Scholar] [CrossRef]
  38. Jin, Y.; Jin, W.; Zheng, Z.; Chen, E.; Wang, Q.; Wang, Y.; Wang, O.; Zhang, X. GABRB2 plays an important role in the lymph node metastasis of papillary thyroid cancer. Biochem. Biophys. Res. Commun. 2017, 492, 323–330. [Google Scholar] [CrossRef]
  39. Yan, L.; Gong, Y.Z.; Shao, M.N.; Ruan, G.T.; Xie, H.L.; Liao, X.W.; Wang, X.K.; Han, Q.F.; Zhou, X.; Zhu, L.C.; et al. Distinct diagnostic and prognostic values of γ-aminobutyric acid type A receptor family genes in patients with colon adenocarcinoma. Oncol. Lett. 2020, 20, 275–291. [Google Scholar] [CrossRef]
  40. Liu, A.; Zhao, H.; Sun, B.; Han, X.; Zhou, D.; Cui, Z.; Ma, X.; Zhang, J.; Yuan, L. A predictive analysis approach for paediatric and adult high-grade glioma: miRNAs and network insight. Ann. Transl. Med. 2020, 8, 242. [Google Scholar] [CrossRef]
  41. Belotti, Y.; Tolomeo, S.; Yu, R.; Lim, W.T.; Lim, C.T. Prognostic Neurotransmitter Receptors Genes Are Associated with Immune Response, Inflammation and Cancer Hallmarks in Brain Tumors. Cancers 2022, 14, 2544. [Google Scholar] [CrossRef] [PubMed]
  42. Gross, A.M.; Kreisberg, J.F.; Ideker, T. Analysis of Matched Tumor and Normal Profiles Reveals Common Transcriptional and Epigenetic Signals Shared across Cancer Types. PLoS ONE 2015, 10, e0142618. [Google Scholar] [CrossRef] [PubMed] [Green Version]
  43. Wang, Y.; Wu, R. The Effect of Fasting on Human Metabolism and Psychological Health. Dis. Markers 2022, 2022, 5653739. [Google Scholar] [CrossRef] [PubMed]
  44. Tiwari, S.; Sapkota, N.; Han, Z. Effect of fasting on cancer: A narrative review of scientific evidence. Cancer Sci. 2022, 113, 3291–3302. [Google Scholar] [CrossRef] [PubMed]
Figure 1. Fasting timeline of patient #1. He followed a strict fasting regime as follows: 39 days (2017), 17 days (2018), 21 days (2019), and 27 days (2020). In 2021, he fasted four times: 33, 4, 4, and 6 days, respectively. From 2022 to 2023, he fasted for a total of 9 days (*5 days in 2022 and *4 days in 2023, respectively).
Medicina 59 01405 g001
Figure 2. Fluctuations of absolute lymphocytosis in patient #1 since diagnosis. The lymphocyte levels exhibited varying trends between July 2016 and January 2023.
Medicina 59 01405 g002
Figure 3. Clustering results. The figure illustrates the outcomes of clustering (hierarchical agglomerative clustering) achieved by grouping samples according to the similarities in gene expression of the differentially expressed genes.
Medicina 59 01405 g003
Figure 4. Heatplot generated based on the log2 expression of the nine differentially expressed genes across different patients/conditions.
Medicina 59 01405 g004
Figure 5. Minimum spanning tree that connects all the nodes, i.e., the samples together, without any cycles and with the minimum possible total edge weight (where an edge weight represents the Euclidean distance between samples).
Medicina 59 01405 g005
Table 1. Clinical features and molecular markers of the six patients with CLL.
PatientAge
at
Diagnosis (y)
Time from Diagnosis to B Cell Selection (y)SexBinet StageRai StageIGVH GeneTP53 Mutation StatusFISH *
#1505MA0MTUMdel(13q)
#2642MCIVUMUMnegative
#3643MCIVUMUMtrisomy 12; del(11q)
#4703MBIIUMUMtrisomy 12
#55112MBIIMTUMnegative
#67012FBIIMTUMmonosomy 13q14
Abbreviations: M, male; F, female; MT, mutated; UM, unmutated. * According to the Döhner classification [17].
Table 2. The absolute values of the lymphocyte counts for patients #2, #3, #4, #5, and #6 from the time of diagnosis to the time of B cell selection.
PatientTime-PointsDateLymphocyte Count × 109/L
#21June 2019 *8.00
#22December 201919.0
#23May 202039.34
#31February 2018 *10.50
#32October 201812.36
#33April 201911.91
#34October 2021106.68
#41November 2018 *14.05
#42December 201825.31
#43June 201997.70
#44August 2021234.94
#45October 2021279.44
#51May 2009 *9.6
#52August 200911.4
#53November 200912.6
#54June 201013.58
#55February 201115.1
#56October 201116.6
#57May 201219.92
#58January 201323.37
#59May 201321
#510December 201326.7
#511May 201424.6
#512June 201535.2
#513November 201551.10
#514December 201652.3
#515June 201762.0
#516June 2021141.6
#61May 2009 *12.0
#62August 201111.38
#63January 201212.7
#64June 201212.0
#65January 201310.89
#66June 201314.78
#67December 201319.2
#68June 201419.29
#69December 201421.85
#610June 201520.92
#611December 201634.36
#612January 201854.8
#613June 201871.2
#614February 201967.0
#615September 201938.9
#616April 202143.4
#617October 2021112.46
* Time of Diagnosis.
Table 3. The absolute values of the lymphocyte counts for patient #1 in relation to 2021 and 2022 during periods of fasting and nutrition.
Time-PointsDateNutrition and FastingLymphocyte Count × 109/L
112 April 2021nutrition25.32
226 April 2021fasting26.12
310 May 2021fasting27.21
417 May 2021nutrition30.71
524 May 2021nutrition27.59
67 June 2021nutrition17.24
714 June 2021nutrition17.01
821 June 2021nutrition16.44
95 July 2021nutrition12.35
1028 March 2022nutrition26.3
1111 April 2022fasting32.07
1222 April 2022fasting27.47
1323 May 2022nutrition17.55
146 June 2022nutrition14.82
Table 4. List of annotated differentially expressed genes in the 1st group (samples from patient #1) vs. 2nd group of patients (#2, #3, #4, #5, and #6). The table presents the gene symbol and name, the average expression value in logarithmic scale (base 2) for the 1st and 2nd group, the fold change (FC) in the 1st group with respect to the 2nd group, the p-value, and the q-value (p-value corrected based on the false discovery rate definition).
Gene
Symbol
Gene Namelog-Mean Group 2log-Mean Group 1FC 1st Group vs. 2nd Groupp Valueq Value
IGLC3immunoglobulin lambda constant 3 (Kern-Oz+ marker)6.924.18−6.670.00001360.04493
RPS26ribosomal protein S266.714.83−3.670.00002350.04926
CHPT1choline phosphotransferase 13.722.29−2.690.00001490.04396
PCDH9protocadherin 92.881.73−2.200.00001770.04219
IGHV3-43immunoglobulin heavy variable 3-432.193.462.410.00001420.04362
IGKV3D-20immunoglobulin kappa variable 3D-201.663.102.710.00001920.04460
PLEKHA1pleckstrin homology domain containing, family A (phosphoinositide binding specific) member 12.724.363.130.00001730.04360
CYBBcytochrome b-245, beta polypeptide3.775.483.270.00001310.04505
GABRB2gamma-aminobutyric acid (GABA) A receptor, beta 24.066.555.630.00001250.04876
Table 5. RPS26, CHPT1, CYBB, and GABRB2 and KEGG pathways.
Gene SymbolKEGG Pathway
RPS26hsa03010 Ribosome
CHPT1hsa00440 Phosphonate and phosphinate metabolism
hsa00564 Glycerophospholipid metabolism
hsa00565 Ether lipid metabolism
hsa01100 Metabolic pathways
hsa05231 Choline metabolism in cancer
CYBBhsa04066 HIF-1 signaling pathway
hsa04145 Phagosome
hsa04216 Ferroptosis
hsa04217 Necroptosis
hsa04621 NOD-like receptor signaling pathway
hsa04670 Leukocyte transendothelial migration
GABRB2hsa04080 Neuroactive ligand–receptor interaction
hsa04726 Serotonergic synapse
hsa04727 GABAergic synapse
Disclaimer/Publisher’s Note: The statements, opinions and data contained in all publications are solely those of the individual author(s) and contributor(s) and not of MDPI and/or the editor(s). MDPI and/or the editor(s) disclaim responsibility for any injury to people or property resulting from any ideas, methods, instructions or products referred to in the content.