Abstract
Background and Objectives: The purpose of this study to investigate if the early variations in the hematological profile could be a useful tool in the prediction and evaluation of intraventricular hemorrhage. Materials and Methods: It is a retrospective study conducted between 1 January 2017 and 31 December 2022, in a tertiary academic center. In-born infants ≤ 28 weeks of gestation (n = 134) were enrolled. The study group of infants with all grades of IVH was further divided into mild IVH subgroups (grades 1 and 2) and severe IVH subgroups (grades 3 and 4); the control group included infants without IVH. Results: The prevalence of IVH was 35.8% (n = 48 of 134 infants—study group). We identified significantly lower median values of HGB (p = 0.0312) and HCT (p = 0.0172) in all grades of the IVH group at birth as compared with control, followed by a significantly higher drop in MCV (p = 0.0146) and MCH (p = 0.0002) in the fourth day of life. Conclusions: Extremely preterm infants with IVH may have lower HTC and HGB values at birth, together with a decrease in MCH and MCHC and increase in MPV. The predictive model based on logistic regression analysis could predict the probability of the occurrence of IVH according to their values.
1. Introduction
Intraventricular hemorrhage (IVH) is one of the most common life-threatening early complications of prematurity, particularly in infants born with a gestational age (GA) of 28 weeks or less. The incidence of IVH in extremely premature (EP) infants has been reported to be as high as 45%, leading to increased morbidity, mortality, and neurodevelopmental problems [1,2,3]. Most cases of IVH (50–90%) occur within the first 72 h of life (known as early IVH) [4,5,6]. The pathogenesis of IVH is multifactorial and involves rapid fluctuations in cerebral blood flow (CBF) as well as innate fragility of the germinal matrix [7].
The complete blood count (CBC) is an essential part of the diagnostic assessment for newborn infants. While many studies have reported on the changes in hematological parameters during the neonatal period, few of them have focused on EP, who are the most vulnerable infants [8,9,10,11]. Due to the immaturity and severity of complications, individuals in this high-risk population are vulnerable to hemorrhagic accidents, sepsis, and iatrogenic blood loss. These can significantly impact hematological values and clinical outcomes. Hematocrit (HCT) at birth can be used as a marker for intravascular volume status [12,13], while the hemoglobin (HGB) level is a guide for liberal or restrictive red blood cell (RBC) transfusion decisions [14,15]. Several studies have focused on the correlation between Hct levels and IVH incidence. A low Hct level at birth in EP infants can significantly increase cerebral blood flow (CBF) to compensate for cerebral hypoperfusion and low cerebral oxygenation, thereby leading to IVH [12,13].
Delayed cord clamping (DCC) has been found to improve HCT and HGB levels, reducing the incidence of significant IVH and the need for blood transfusion [16].
The main objective of this study was to analyze the correlation between blood parameters at birth and the occurrence of IVH in a group of EP infants. The secondary objective was to identify the neonatal risk factors associated with IVH.
2. Materials and Methods
A retrospective case-control single-center study was conducted at a tertiary referral center (Clinical County Emergency Hospital, Targu Mureș, Romania) from 1 January 2017 to 31 December 2022. The study aimed to evaluate the changes in hematological parameters associated with IVH in EP infants during the first four days of life. Clinical and laboratory data were analyzed.
2.1. Study Group: Inclusion and Exclusion Criteria
A total of 159 preterm infants (1.53% of 10,392 births) born between 22–28 weeks of gestation (inclusion criteria) were admitted to the neonatal intensive care unit (NICU) during the study period. The exclusion criteria were as follows: outborn EP infants, death within the first three days of life, infants with chromosomal abnormalities, or with a history that could influence blood counts in the first days of life (e.g., significant peripartum blood loss, early-onset sepsis, and red blood cell (RBC) transfusion in the first 72 h). Therefore, 134 EP infants of 159 were enrolled in this study (Figure 1).
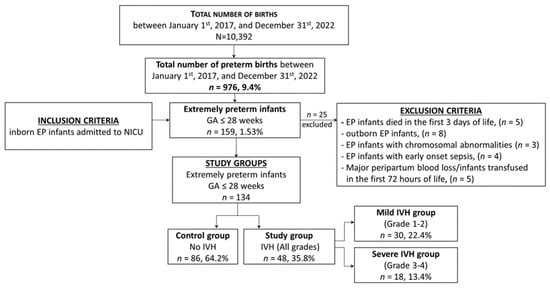
Figure 1.
Selection of the study groups—flow chart.
The study group consisted of infants born extremely preterm with all grades of IVH, which was further divided into two subgroups: the mild IVH group (those with grades 1 and 2) and severe IVH group (those with grades 3 and 4). EP infants without IVH were assigned to the control group. This classification allowed for a comparison of the hematological profile of infants with IVH irrespective of the severity of the condition, as well as a comparison of the profiles of those with mild and severe IVH.
We compared neonatal data between two groups, the study group (with any grade of IVH) and the control group (without IVH), as well as between two subgroups within the study group (mild IVH and severe IVH).
2.2. Data Collection
Clinical and laboratory data were collected by the research team over six years.
The patient underwent clinical and ultrasound evaluations, as well as blood sample collection, following the NICU protocol for the diagnosis and treatment of IVH. These assessments are part of the standard clinical procedure for managing EP infants. The mother provided written consent for this study. The GA was assessed using gestational ultrasound measurements and the new Ballard scoring system [17].
The medical record of each eligible EP infant was reviewed. Relevant data of prenatal and perinatal variables were extracted: gender, GA (in weeks), birth weight (BW, in grams), antenatal corticosteroids therapy (ACT: four doses of 6 mg dexamethasone every 12 h), mode of delivery (vaginal delivery vs. cesarean section), APGAR score (at 1 and 5 min), cord blood gases (pH, BE, lactate), presence and severity of respiratory distress syndrome RDS (mild, moderate, and severe), surfactant administration, nasal continuous positive airway pressure (nCPAP) support, invasive respiratory support (ventilation mode), presence of hypercapnia in the first days of life (pCO2 > 55 mmHg), hypotension (defined as a mean arterial blood pressure less than the infant’s GA, or < 30 mmHg), inotropic medication exposure (dopamine, dobutamine, and milrinone), patent ductus arteriosus (PDA), a need for RBC transfusion in days 4–7 after birth, NICU hospitalization (days), age at discharge (days), and survival. The delayed cord clamping (DCC—after at least 30–60 s) protocol was not applied to infants who were unstable at birth and required immediate extensive resuscitation. Physiologic-based cord clamping (PBCC—sectioning the umbilical cord after the cessation of pulsations) or immediate cord clamping (ICC—under 30 s) protocols were applied at birth to EP infants.
2.3. Clinical Suspicion of IVH
Although most IVH is clinically silent, the diagnosis was suspected in EP infants with subtle changes in the level of consciousness and tone, abnormal eye and limb movements, the presence of seizures, cardiorespiratory instability, or sudden clinical deterioration [18].
2.4. Cranial Ultrasound (CUS)
Intraventricular hemorrhage was diagnosed using standard cranial ultrasound with 7.5–12 MHz transducers of a LOGIQ e9 ultrasound machine (General Electric Medical Systems Co.’s, Bucuresti, Romania). Trained neonatologists routinely performed the scan. According to the NICU protocol, the initial CUS examination was performed immediately after stabilization to rule out prenatal IVH. Serial CUS exams were performed daily for the first week of life, followed by weekly exams until discharge or as needed. Intraventricular hemorrhage was classified by the modified Papile’s grading system using cranial ultrasonography. Grade 1: Hemorrhage restricted to the germinal matrix. Grade 2: Hemorrhage in the germinal matrix and extended to the ventricles without dilatation of the ventricles. Grade 3: Hemorrhage in the germinal matrix and extended to the ventricles with dilatation of the ventricles. Grade 4: Intraventricular hemorrhage with parenchymal hemorrhage [19,20,21].
2.5. Blood Sample Collection (Laboratory Data)
2.5.1. Blood Gases
According to the hospital’s protocol, blood gases were collected from each patient’s umbilical cord artery at birth. We recorded the pH, base excess (BE), and lactate levels. Afterward, arterial blood gases were collected as required. We defined hypercapnia as pCO2 ≥ 60 mmHg, where pCO2 between 55–60 mmHg was considered permissive hypercapnia [22].
2.5.2. Complete Blood Count
All patients must undergo a CBC test on admission to the NICU as per hospital protocol. The test is performed within the first hour of birth for EP infants born in the hospital. The following CBC is collected on the fourth day of life or as needed to minimize iatrogenic blood loss. The study analyzed both initial and fourth-day CBC values.
Blood samples (1 mL) were collected from central or peripheral venous blood before any erythrocyte transfusions and were processed using the same automated analyzer (Sysmex XT-4000). The following blood parameters were recorded: erythrocyte count (×106/µL), HGB concentration (g/dL), HCT (%), mean corpuscular volume (MCV, µm3), mean corpuscular hemoglobin (MCH, pg), mean corpuscular hemoglobin concentration (MCHC, mg/dL), total leukocyte count (WBC, ×103/µL), differential leukocyte count (×103/µL), neutrophil count (×103/µL), platelet count (PLT, ×103/µL), mean platelet volume (MPV, µm3), and plateletcrit PCT (%).
2.6. Ethics Approval
The study was approved by the medical ethics committee of Targu Mures County Emergency Hospital, Romania (No. Ad. 35519/13.12.2019).
2.7. Statistical Analysis
The statistical analysis was performed using SPSS version 29 (Inc., Chicago, IL, USA) for Windows. Descriptive statistics such as means, medians, quartiles, and standard deviations were used to describe the study groups’ baseline, demographic, clinical characteristics, and hematological parameters. Continuous variables were presented as the mean (standard deviation—SD) if the distribution was normal and median and quartiles if the variable did not have a normal distribution. Categorical data (qualitative variables) were compared using Pearson’s Chi-square and Fisher’s exact tests. The independent t-test was used to analyze continuous data for comparisons. The odds ratio (OR) and 95% confidence interval (CI) were calculated.
Both univariate and multivariate analyses of the parameters were performed to evaluate the predictive neonatal factors for IVH. Statistical significance was defined as a p-value < 0.05.
3. Results
The prevalence of IVH in EP infants was 35.82%, with 48 out of 134 infants affected. Most IVH cases occurred in the first three days of life (DOL), accounting for 79.2% of cases, while 20.8% of IVH cases occurred between the fourth and fifth DOL (Table 1 and Figure 2).

Table 1.
Distribution of IVH cases based on the day of occurrence.

Figure 2.
Distribution of IVH cases according to severity and the day of appearance.
The baseline, demographic, and clinical characteristics of EP infants were compared based on IVH severity. The median values for GA and BW were comparable between the study group and the control group, even though the median BW was slightly lower in the study group. However, the severe IVH group had significantly lower BW median values than the mild IVH group (p = 0.019), as shown in Table 2.
Table 2.
Comparison of the baseline, demographic, and clinical characteristics of EP infants according to IVH severity.
A significant correlation has been found between the IVH group (all grades) and several factors like male gender (p = 0.004), lack of antenatal corticosteroid therapy (p = 0.041), vaginal delivery (p = 0.001), low Apgar score at 1 min (p = 0.043), lack of delayed cord clamping (DCC; p = 0.0023), immediate cord clamping (ICC; p = 0.0267), moderate and severe respiratory distress syndrome (RDS; p = 0.014; p = 0.003), the requirement of mechanical ventilation (MV; p = 0.006) and high-frequency oscillatory ventilation (HFOV; p = 0.014), hypercapnia (p < 0.001), hypotension with inotropic support in the first 4 days of life (p < 0.001), and the need for red blood cell transfusion (RCT) between days 4–7 of life (p < 0.001). There was no significant increase in the prevalence of IVH in infants who were born small for gestational age (SGA), had low Apgar scores at 5 min, received exogenous surfactant, or had PDA. Moreover, the IVH group (all grades) and controls had comparable NICU days of hospitalization.
In comparing EP infants with mild IVH to those with severe IVH, we found several factors that were significantly associated with severe IVH. These factors included a lack of antenatal corticosteroid therapy (p = 0.002), lower Apgar scores at 1 and 5 min (p = 0.007; p = 0.004), ICC (p = 0.001), moderate and severe RDS (p = 0.021; p = 0.025), hypercapnia (p < 0.001), and hypotension requiring inotropic support in the first four days of life (p < 0.001). In addition, infants with severe IVH were more likely to have been exposed to mechanical ventilation (MV) and high-frequency oscillatory ventilation (HFOV). However, there were no significant differences between the two groups regarding SGA, vaginal delivery, surfactant administration, and the presence of PDA (Table 2).
The median day of discharge was significantly lower in the IVH group (all grades) compared to the control group (36 vs. 50; p = 0.008). Additionally, patients with severe IVH had a shorter median length of stay in the hospital compared to those with mild IVH (23 vs. 52, p = 0.011), which may be due to higher mortality rates. Compared to the control group, mortality was significantly higher in the presence of any grade of IVH (4.7% vs. 20.8%; p = 0.003). The severe IVH subgroup had a higher mortality rate than the mild IVH subgroup (6.7% vs. 44.4%; p = 0.001) (Table 2).
We compared the cord blood gases and changes in hematological parameters between the IVH group (all grades) and the control group from birth to DOL4. We also compared the hematological parameters between different grades of IVH severity within the study group, specifically mild IVH versus severe IVH subgroups, as shown in Table 3.
Table 3.
Comparison of blood gases at birth and hematological parameters on the first and fourth day of life.
3.1. Blood Gases at Birth
According to the research findings, the IVH group (all grades) had significantly lower pH levels (median value: 7.21 vs. 7.28; p = 0.0008), higher BE levels (median value: −8.15 mmol/L vs. −4.9 mmol/L; p = 0.0066), and higher lactate levels (median value: 4.7 mmol/L vs. 2.6 mmol/L; p = 0.0003) than the control group. These factors were found to be significantly associated with the occurrence of any grade of IVH. Severe IVH was particularly associated with lower pH (median value: 7.15 vs. 7.26; p = 0.0072), higher base excess (median value: −10.6 mmol/L vs. −6 mmol/L; p = 0.0032), and higher lactate levels (median value: 5.3 mmol/L vs. 3 mmol/L; p = 0.0187) when comparing mild and severe IVH subgroups.
3.2. Red Blood Cell Lineage
- Comparison between EP infants without IVH and those with IVH, irrespective of severity
On the day of birth (DOL1), the IVH group (all grades) had significantly lower median values of HGB (14.1 g/dL vs. 15.9 g/dL; p = 0.0312), HCT (42.8% vs. 51.2%; p = 0.0172), and ERY (3.99 × 10⁶ vs. 4.91 × 10⁶; p = 0.0251) when compared to the control group. On DOL4, the IVH group had a significant decrease in the median values of HGB (11.7 g/dL vs. 14.2 g/dL; p < 0.001), HCT (34.3% vs. 42.1%; p < 0.001), and ERY (3.02 × 10⁶/µL vs. 3.83 × 10⁶/µL; p < 0.001) when compared to the controls.
Regarding erythrocytes indices, on DOL1, the median MCV (mean corpuscular volume, μm3), MCH (mean corpuscular hemoglobin, pg), and MCHC (mean corpuscular hemoglobin concentration g/dL) did not show any significant differences between the IVH group and control group. However, MCHC was slightly lower in the IVH group. On the other hand, on DOL4, we found significant differences between MCV (102.9 μm3 vs. 105.4 μm3; p = 0.0278) and MCH (34.2 pg vs. 36.7 pg; p < 0.001) parameters in the IVH group. The group with IVH also showed a significantly higher drop in MCV (8.35 µm3 vs. 7.5 µm3; p = 0.0146) and MCH (3.7 pg vs. 1.4 pg; p = 0.0002) compared to the control group.
- Comparison between preterm infants with mild IVH and those with severe IVH
At birth (DOL 1), there were no significant differences in HGB, HCT, and ERY count between mild and severe IVH subgroups but lower median values were observed in the severe IVH subgroup. Significant changes were noted on DOL4. Infants with severe IVH had significantly lower median levels of HGB (7.3 g/dL vs. 12.4 g/dL; p < 0.001), HCT (28.5% vs. 36.4%; p < 0.001), and ERY (2.73 × 10⁶/µL vs. 3.09 × 10⁶/µL; p = 0.0093) than infants with mild IVH.
Additionally, infants from the severe IVH subgroup exhibited a significant reduction in HGB levels (5.8 g/dL vs. 2.3 g/dL; p = 0.0029), HCT levels (9.9% vs. 8.1%; p = 0.0239), and ERY count (1.11 × 10⁶ vs. 0.92 × 10⁶; p = 0.0216).
The severe IVH subgroup on DOL1 exhibited a significantly lower MCH (35.6 pg vs. 39.2 pg; p < 0.001) and MCHC (32.4 g/dL vs. 34.3 g/dL; p = 0.0041) compared to the mild IVH subgroup and this difference remained consistent on DOL4 as well.
3.3. White Blood Cell Lineage
No significant differences were found between the IVH group (all grades) and the control group in terms of the median number of leukocytes and absolute neutrophil count (ANC), neither in DOL1 nor in DOL4. However, ANC was significantly lower in the severe IVH subgroup than the mild IVH subgroup in both DOL1 and DOL4. Only the I/T ratio was significantly lower in DOLI in the IVH group (all grades) compared to the controls (0.14 vs 0.18; p = 0.0007).
3.4. Platelet Lineage
There were no significant differences in median PLT, MPV, or PCT between the IVH group and the control group, as well as between the severe IVH subgroup and the mild IVH subgroup on DOL1. However, on DOL4, median PLT significantly decreased in the IVH group (201 × 103/µL vs. 258 × 103/µL; p = 0.0098) when compared to the control group and in the severe IVH subgroup (166 × 103/µL vs. 256 × 103/µL; p = 0.0106) when compared to the mild IVH subgroup.
The differences between DOL1 and DOL4 regarding platelet count were statistically significant in the IVH group (p = 0.0004) vs. controls but not between the severe IVH subgroup vs. the mild IVH subgroup. The median MPV (11.3 μm3 vs. 10.7 μm3; p = 0.0009) was significantly higher in the IVH group compared to controls on DOL4.
3.5. Univariate Analysis for AUC Evaluation of Hematological Parameters and Other Neonatal Factors Associated with IVH Risk in Extremely Preterm Infants
Intraventricular hemorrhage in EP infants has a multifactorial determination. The research analyzed multiple factors including GA, Apgar scores after 1 and 5 min of birth, cord pH, BE, lactate levels at birth, pCO2 exceeding 55 mmHg (hypercapnia), treated hypotension, the requirement for MV and HFOV, HGB, HTC levels, and ERY count on the first day after birth. The aim was to determine the potential of these factors in predicting the occurrence of IVH. The findings are presented in Table 4 and Figure 3.
Table 4.
IVH risk assessment in EP infants—neonatal factors.
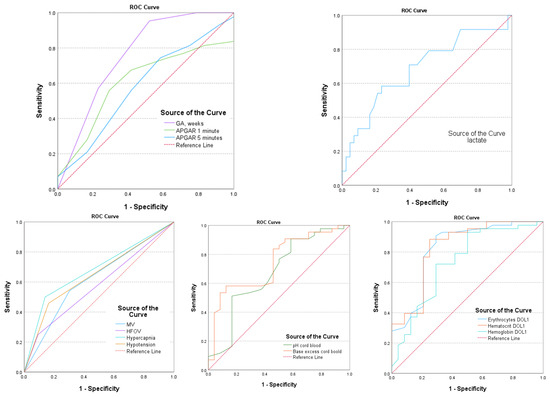
Figure 3.
AUC—area under the curve for postnatal parameters associated with IVH.
The gestational age and MV are strong predictors of IVH, with AUC values of 0.760 (95% CI: 0.669–0.851; p = 0.001) and 0.620 (95% CI: 0.519–0.720; p = 0.022), respectively. Hypercapnia and hypotension also have predictive IVH values, with AUC values of 0.680 (95% CI: 0.581–0.780; p = 0.001) and 0.648 (95% CI: 0.547–0.749; p = 0.05), respectively. Additionally, hematological parameters such as HGB, HCT, and ERY levels in DOL1 were found to be significant predictors (p < 0.005) for IVH, with AUC values of 0.806 (95% CI: 0.841–0.985), 0.922 (95% CI: 0.841–0.985), and 0.895 (95% CI: 0.796–0.963), respectively (as shown in Table 4 and Figure 3).
If the HGB level is below 13.9 g/dL, it is highly likely that IVH may occur, with a sensitivity of 89.6% and specificity of 88.6%. Similarly, if the HCT level is lower than 42.6% or the ERY count is less than 3.82 × 10⁶, the chances of IVH significantly increase, with a sensitivity of 88.4% and 89.6% and specificity of 91.3% and 90.4%, respectively.
3.6. Multivariate Analysis to Evaluate the Chance of IVH Occurrence
Independent variables for this analysis were selected based on the results of univariate analysis for AUC evaluation. Variables with a significance level lower than 0.05 (p < 0.05) in the univariate analysis (Table 5) were considered as independent variables: GA, MV, hypercapnia, hypotension, pH, BE, cord lactate, and initial HCT (allocation of variables in Table 5). The regression process adopted the gradual regression method (backward stepwise—Wald) by which the variables for which the p-values were higher than 0.05 were excluded. Multivariate analysis by logistic regression allowed the assessment of the probability of IVH occurrence based on the corresponding β coefficients (Table 5). The prediction model expression was
Table 5.
Multivariate analysis (multiple regression—logistic regression model) of the association of neonatal parameters with IVH.
Based on this analysis, a profile of the EP infant with IVH can be created. Multiple logistic regression analysis revealed that IVH is associated with several factors, including lower GA and cord BE, lower initial HCT, hypercapnia, and hypotension that requires treatment during the first few days of life.
4. Discussion
In our study, IVH prevalence (all grades) was 35.8% and severe IVH occurred in 13.4% of the EP patients. Most cases of IVH were diagnosed within the first three days of life. A 2021 literature review found global IVH incidence ranging from 7–72% for all grades and 6–22% for severe IVH [23]. The survival rate of EP infants in our study was 89.55%, higher than in other reports (62.3–89%) [24,25,26,27]. However, it must be interpreted considering that infants with early sepsis, congenital malformations, and deaths in the first three days of life were excluded from the initial cohort.
For patients with GA of 28 weeks or less, the HCT and HGB levels in the first few hours after delivery are lower compared to those in late preterm and term neonates. HCT is about 10 points lower and the HGB value is 3.3 g/dL lower [8]. In our study, the median HGB value at birth was 14.1 g/dL in the IVH group, 14.7 g/dL in the mild IVH subgroup, and 13.1 g/dL in the severe IVH subgroup. Initial HCT and ERY counts were also significantly lower in the IVH group than in controls. HGB levels lower than 13.9 g/dL and HCT levels lower than 42.6% significantly increased the chance of IVH in our study. Similarly, Hosono and colleagues reported that premature infants with an HGB level below 15 g/dL at birth had a higher incidence of IVH [28]. Another study conducted on extremely low birth weight infants showed that if the initial HCT level is lower than 45%, the risk of IVH is more than doubled (OR = 2.38, 95% CI: 1.19–4.76) [13].
On the other side, the EP infants with low initial HGB and HCT values had lower Apgar scores and required more extensive resuscitation measures during stabilization. Consequently, only 6.3% of IVH group patients were able to receive delayed umbilical cord clamping and placental transfusion. It is possible that this situation could be the reason behind the lower hematological values that were observed in this group.
The median values of initial HGB (15.9 g/dL), HCT (51.2%), and ERY (4.91 × 10⁶) were found to be higher in EP infants without IVH but 23.3% of these infants benefited from delayed cord clamping. In a study conducted by Fogarty et al., it was reported that DCC increased the peak of HCT by 2.73 percentage points (95% CI: 1.94–3.52; p < 0.001) [29]. Another study conducted by Strauss et al. found that DCC led to an increased circulating RBC volume/mass (p = 0.04) and higher weekly Hct values (p < 0.005) [30].
The HGB, HCT, and ERY values may fluctuate after birth due to physiological changes, blood loss, and postnatal diseases, leading to anemia and a need for RBC transfusions in EP infants [31,32]. All EP infants in our study showed a statistically significant decline in HGB, HCT, and ERY count between the first and fourth day of life, especially for infants who developed IVH and severe IVH. The decline in HGB was 1.7 g/dL in the control group, 2.45 g/dL in all IVH group, 5.8 g/dL in the mild IVH subgroup, and 2.3 g/dL in the severe IVH group. The HCT decreased by 6.1% in the control group, 8.6% in all IVH group, 8.1% in the mild IVH subgroup, and 9.9% in the severe IVH subgroup. A previous study by Jopling found that infants with a gestational age of less than 29 weeks experienced a 6.0 ± 0.3% decrease in HGB and HCT values in the first 4 h after birth. A linear reduction in HCT and HGB values was observed in the first four weeks of life [33].
There is limited information available about erythrocyte indices in EP infants. Directly-measured MCV estimates the average size (volume) of circulating erythrocytes. The normal range for red blood cell size in adults is between 80–100 µm3 (fL). The size of red blood cells in newborns, especially preterm infants, is larger (MCV > 110 fL) than in adults due to increased fetal erythropoietic activity in response to intrauterine hypoxia. As a result, many immature erythrocytes are released from the bone marrow into the bloodstream. Macrocythemia, the presence of abnormally large erythrocytes, usually subsides after the first week of life and adult-sized red blood cells appear until the ninth week [11,34,35,36]. In our study, macrocythemia was present in all groups at birth without significant differences between groups. MCV significantly decreased in the fourth day of life in infants with IVH. Our findings are consistent with another study where MCV in EP infants was 111.11 ± 6.84 fL on the first day of life, decreasing to 102.88 ± 5.76 fL by 4–7 days [11].
The explanation provided is unclear but it could be related to the immature response of the hematopoietic system to chronic antenatal bleeding, pre/ intra-natal intraventricular or gastrointestinal bleeding, or infection-induced hemolysis. Severe intrauterine hypoxia secondary to pre-eclampsia, maternal/fetal thrombophilia, and maternal thrombocytopenia may cause fetal hemorrhages but most cases have no identifiable risk factors [37]. There are other intrauterine causes of prolonged intraventricular bleeding due to vasculitis, umbilical cord thrombosis, alterations in maternal/fetal blood pressure, maternal coagulopathy/use of anticoagulants or cocaine or methamphetamine abuse, maternal anemia, cholestasis of pregnancy, and neonatal alloimmune thrombocytopenia. Genetic factors such as proinflammatory interleukin Il-1ß or tumor necrosis factor genes, variants factor V Leiden, or prothrombin G20210A are also factors that influence fetal/neonatal bleeding involving vascular organization, inflammation, and coagulation disorders [37,38]. Our study did not consider maternal/fetal factors as previously described. Additionally, EP infants have lower iron stores at birth [39], a shorter lifespan of fetal erythrocytes, and lower bone marrow erythropoietic activity, which may not immediately compensate for intraventricular bleeding. During the first three days of life, erythrocytes may experience higher levels of oxidative damage, which can lead to functional and flexibility changes [40].
The mean cell hemoglobin (MCH) is the average amount of HGB per erythrocyte in the blood. In premature infants, MCH is typically higher (around 27–41 pg) than in term newborns [11]. Our research shows that EP infants without IVH had an MCH of 38.6 pg at birth. In contrast, infants with severe IVH had a significant reduction in their MCH levels on day 4 of life (35.6 pg) compared to those with mild IVH. This decline was linked to a sudden drop in HGB and HCT levels.
The mean corpuscular hemoglobin concentration (MCHC) is a measure of the amount of hemoglobin in each unit volume of red blood cells (hemoglobin × 100/hematocrit) and is usually consistent across various stages of gestational age. The MCHC reported values are typically between 31–34 g/dL and can be used as an indicator of anemia resulting from chronic or acute blood loss [36,39]. Our research has revealed that patients with severe IVH had a significantly lower MCHC due to substantial acute and chronic blood loss.
In our study, IVH did not affect the white blood cell lineage but we observed differences in the platelet lineage. A decrease in platelet count was observed in EP infants with IVH and severe IVH, even in the absence of thrombocytopenia, due to a consumptive process on DOL4. Other studies have also shown that a drop in platelet count during the first 7 days of life can predict IVH. [41,42]. We observed a significant increase in mean platelet volume (MPV) in patients with IVH and severe IVH on day 4, which was closely related to the decrease in platelet count. Previous studies have suggested that an elevated mean platelet volume (MPV) could indicate a risk for IVH. MPV can be used as an indicator of both platelet production and consumption. Increased platelet size indicates increased production preceded by consumption [43,44].
The secondary objective of our research was to review the neonatal risk factors associated with IVH in EP infants. The frequency of severe IVH was found to increase in association with the lack of antenatal corticosteroid prophylaxis, which is consistent with previous studies [45,46]. Infants delivered vaginally had a higher chance of developing IVH. This was confirmed by Gamaleldin and Humberg et al. [47,48]. We observed that hypercapnia, hypotension requiring treatment on the first day of life, and mechanical ventilation in the first four days of life were more common in the IVH group and severe IVH group. These findings are consistent with previous studies that have also supported this correlation [49,50,51]. Factors such as hypotension and hypercapnia can increase the risk of intraventricular hemorrhage (IVH) by affecting cerebral blood flow [52]. In our study, univariate regression analysis showed that infants with a gestational age of less than 26 weeks, a cord base excess (BE) of less than −8.23, an initial HCT level of less than 42.6%, and those who experienced hypercapnia and hypotension requiring treatment within the first few days of life were more likely to develop IVH, particularly severe IVH. A study found that a drop in hematocrit on day 2 of life increases the chance of severe IVH among EP infants weighing less than 750 g. [53]. A lack of antenatal dexamethasone, persistent ductus arteriosus, neonatal hypotension, and low HCT within the first 3 days of life was associated with severe IVH in very low birth weight neonates, according to a 2021 study by Al-Mouqdad [54].
Research should prioritize identifying measurable biomarkers, such as urine Activin A, S100B, and UCH-L1, to determine the risk of perinatal brain damage and IVH. Preventing these conditions is crucial in avoiding potential long-term developmental issues [55,56,57].
We need to acknowledge that our study has some limitations. Firstly, it is a retrospective study conducted at a single center and secondly, it involves a small population of EP infants with and without IVH. The population of EP infants is generally tiny and therefore, the small number of cases involved in the study could impact the statistical significance of the results. However, we want to mention that the statistical power of the analysis was significant and we utilized specific statistical techniques for small study groups to overcome this limitation. Larger sample sizes in multicenter trials should be considered to validate these findings further.
5. Conclusions
Extremely preterm infants with IVH may have low HCT and HGB at birth, followed by a further decrease in HCT, HGB, and PLT count by day four of life, accompanied by decreasing MCH and MCHC and increasing MPV. Gestational age, hypercapnia, hypotension, cord BE, and initial low HCT are the main neonatal factors associated with IVH. The predictive model based on logistic regression analysis can predict the likelihood of IVH in EP infants.
Author Contributions
Conceptualization, M.C. and R.M.; methodology, M.M.; analysis, M.S.; investigation, M.L.O. and M.-I.M.; resources, M.C. and M.M.; writing—original draft preparation, M.C. and R.M.; writing—review and editing, M.-I.M., D.M.C., M.M., and M.L.O.; supervision, R.M.; project administration, R.M. and M.C.; funding acquisition, R.M. All authors have read and agreed to the published version of the manuscript.
Funding
This research was funded by the University of Medicine, Pharmacy, Sciences and Technology George Emil Palade of Targu Mureș, grant number 10126/3, 17.12.2020.
Institutional Review Board Statement
The study was conducted in accordance with the Declaration of Helsinki and approved by the Ethics Committee of Targu Mures County Emergency Hospital, Romania (No. Ad. 35519/13 December 2019).
Informed Consent Statement
Informed consent was obtained from all subjects involved in the study.
Data Availability Statement
The data presented in this study are available on request from the corresponding author.
Conflicts of Interest
The authors declare no conflict of interest.
References
- Rocha, G.; Pereira, S.; Antunes-Sarmento, J.; Flôr-de-Lima, F.; Soares, H.; Guimarães, H. Early anemia and neonatal morbidity in extremely low birth-weight preterm infants. J. Matern. Fetal Neonatal Med. 2021, 34, 3697–3703. [Google Scholar] [CrossRef] [PubMed]
- Howarth, C.; Banerjee, J.; Aladangady, N. Red Blood Cell Transfusion in Preterm Infants: Current Evidence and Controversies. Neonatology 2018, 114, 7–16. [Google Scholar] [CrossRef] [PubMed]
- Reduction of Infection in Chinese Neonatal Intensive Care Units Using the Evidence-based Practice for Improving Quality Study Group. Incidence and risk factors of severe intraventricular hemorrhage in very low and extremely low birth weight infants: A multi-center study. Zhonghua Er Ke Za Zhi 2019, 57, 258–264. [Google Scholar]
- Mukerji, A.; Shah, V.; Shah, P.S. Periventricular/intraventricular hemorrhage and neurodevelopmental outcomes: A meta-analysis. Pediatrics 2015, 136, 1132–1143. [Google Scholar] [CrossRef] [PubMed]
- Pascal, A.; Govaert, P.; Oostra, A.; Naulaers, G.; Ortibus, E.; Van den Broeck, C. Neurodevelopmental outcome in very preterm and very-low-birthweight infants born over the past decade: A meta-analytic review. Dev. Med. Child. Neurol. 2018, 60, 342–355. [Google Scholar] [CrossRef] [PubMed]
- Szpecht, D.; Nowak, I.; Kwiatkowska, P.; Szymankiewicz, M.; Gadzinowski, J. Intraventricular hemorrhage in neonates born from 23 to 26 weeks of gestation: Retrospective analysis of risk factors. Adv. Clin. Exp. Med. 2017, 26, 89–94. [Google Scholar] [CrossRef]
- Park, Y.S. Perspectives: Understanding the Pathophysiology of Intraventricular Hemorrhage in Preterm Infants and Considering of the Future Direction for Treatment. J. Korean Neurosurg. Soc. 2023, 66, 298–307. [Google Scholar] [CrossRef]
- Christensen, R.D.; Del Vecchio, A.; Henry, E. Expected erythrocyte, platelet and neutrophil values for term and preterm neonates. J. Matern. Fetal Neonatal Med. 2012, 25 (Suppl. S5), 77–79. [Google Scholar] [CrossRef]
- Christensen, R.D.; Henry, E.; Jopling, J.; Wiedmeier, S.E. The CBC: Reference ranges for neonates. Semin. Perinatol. 2009, 33, 3–11. [Google Scholar] [CrossRef]
- Henry, E.; Christensen, R.D. Reference Intervals in Neonatal Hematology. Clin. Perinatol. 2015, 42, 483–497. [Google Scholar] [CrossRef]
- Roudil, P.; Vasselon, C.; Trombert-Paviot, B.; Berger, C.; Patural, H. Blood parameters of preterm neonates: Postnatal evolution according to gestational age. Int. J. Lab. Hematol. 2017, 39, 317–328. [Google Scholar] [CrossRef]
- Karagol, B.S.; Calisici, E.; Zeybek, C.; Unay, B.; Yuksel, S. The impact of initial hematocrit values after birth on peri-/intraventricular hemorrhage in extremely low birth weight neonates. Childs Nerv. Syst. 2022, 38, 109–114. [Google Scholar] [CrossRef]
- Dekom, S.; Vachhani, A.; Patel, K.; Barton, L.; Ramanathan, R.; Noori, S. Initial hematocrit values after birth and peri/intraventricular hemorrhage in extremely low birth weight infants. J. Perinatol. 2018, 38, 1471–1475. [Google Scholar] [CrossRef] [PubMed]
- Meyer, M.P.; O’Connor, K.L.; Meyer, J.H. Thresholds for blood transfusion in extremely preterm infants: A review of the latest evidence from two large clinical trials. Front. Pediatr. 2022, 10, 957585. [Google Scholar] [CrossRef] [PubMed]
- Bell, E.F. Red cell transfusion thresholds for preterm infants: Finally some answers. Arch. Dis. Child. Fetal Neonatal Ed. 2022, 107, 126–130. [Google Scholar] [CrossRef]
- Hemmati, F.; Sharma, D.; Namavar Jahromi, B.; Salarian, L.; Farahbakhsh, N. Delayed cord clamping for prevention of intraventricular hemorrhage in preterm neonates: A randomized control trial. J. Matern. Fetal Neonatal Med. 2022, 35, 3633–3639. [Google Scholar] [CrossRef] [PubMed]
- Ballard, J.L.; Khoury, J.C.; Wedig, K.; Wang, L.; Eilers-Walsman, B.L.; Lipp, R. New Ballard Score, expanded to include extremely premature infants. J. Pediatr. 1991, 119, 417–423. [Google Scholar] [CrossRef]
- Parodi, A.; Govaert, P.; Horsch, S.; Bravo, M.C.; Ramenghi, L.A.; eurUS.brain Group. Cranial ultrasound findings in preterm germinal matrix haemorrhage, sequelae, and outcome. Pediatr. Res. 2020, 87 (Suppl. S1), 13–24. [Google Scholar] [CrossRef]
- Papile, L.A.; Burstein, J.; Burstein, R.; Koffler, H. Incidence and evolution of subependymal and intraventricular hemorrhage: A study of infants with birth weights less than 1500 gm. J. Pediatr. 1978, 92, 529–534. [Google Scholar] [CrossRef] [PubMed]
- D’Andrea, A.; Conte, M.; Scarafile, R.; Riegler, L.; Cocchia, R.; Pezzullo, E.; Cavallaro, M.; Carbone, A.; Natale, F.; Russo, M.G.; et al. Transcranial Doppler ultrasound: Physical principles and principal applications in neurocritical care unit. J. Cardiovasc. Echogr. 2016, 26, 28–41. [Google Scholar] [CrossRef]
- Mohammad, K.; Scott, J.N.; Leijser, L.M.; Zein, H.; Afifi, J.; Piedboeuf, B.; de Vries, L.S.; van Wezel-Meijler, G.; Lee, S.K.; Shah, P.S. Consensus Approach for Standardizing the Screening and Classification of Preterm Brain Injury Diagnosed with Cranial Ultrasound: A Canadian Perspective. Front. Pediatr. 2021, 9, 618236. [Google Scholar] [CrossRef] [PubMed]
- Räisänen, S.; Gissler, M.; Saari, J.; Kramer, M.; Heinonen, S. Contribution of risk factors to extremely, very, and moderately preterm births—Register-based analysis of 1,390,742 singleton births. PLoS ONE 2013, 8, e60660. [Google Scholar] [CrossRef] [PubMed]
- Siffel, C.; Kistler, K.; Sarda, S. Global incidence of intraventricular hemorrhage among extremely preterm infants: A systematic literature review. J. Perinat. Med. 2021, 49, 1017–1026. [Google Scholar] [CrossRef] [PubMed]
- Morgan, A.S.; Mendonça, M.; Thiele, N.; David, A.L. Management and outcomes of extreme preterm birth. BMJ 2022, 376, e055924. [Google Scholar] [CrossRef] [PubMed]
- Bell, E.F.; Hintz, S.R.; Hansen, N.I.; Bann, C.M.; Wyckoff, M.H.; DeMauro, S.B.; Walsh, M.C.; Vohr, B.R.; Stoll, B.J.; Carlo, W.A.; et al. Mortality, In-Hospital Morbidity, Care Practices, and 2-Year Outcomes for Extremely Preterm Infants in the US, 2013–2018. JAMA 2022, 327, 248–263. [Google Scholar] [CrossRef] [PubMed]
- Su, B.H.; Hsieh, W.S.; Hsu, C.H.; Chang, J.H.; Lien, R.; Lin, C.H.; Premature Baby Foundation of Taiwan (PBFT). Neonatal outcomes of extremely preterm infants from taiwan: Comparison with Canada, Japan, and the USA. Pediatr. Neonatol. 2015, 56, 46–52. [Google Scholar] [CrossRef] [PubMed]
- Zhu, Z.; Yuan, L.; Wang, J.; Li, Q.; Yang, C.; Gao, X.; Chen, S.; Han, S.; Liu, J.; Wu, H.; et al. Mortality and Morbidity of Infants Born Extremely Preterm at Tertiary Medical Centers in China From 2010 to 2019. JAMA Netw. Open 2021, 4, e219382. [Google Scholar] [CrossRef] [PubMed]
- Hosono, S.; Mugishima, H.; Kitamura, T.; Inami, I.; Fujita, H.; Hosono, A.; Minato, M.; Okada, T.; Takahashi, S.; Harada, K. Effect of hemoglobin on transfusion and neonatal adaptation in extremely low-birthweight infants. Pediatr. Int. 2008, 50, 306–311. [Google Scholar] [CrossRef]
- Fogarty, M.; Osborn, D.A.; Askie, L.; Seidler, A.L.; Hunter, K.; Lui, K.; Simes, J.; Tarnow-Mordi, W. Delayed vs early umbilical cord clamping for preterm infants: A systematic review and meta-analysis. Am. J. Obstet. Gynecol. 2018, 218, 1–18. [Google Scholar] [CrossRef]
- Strauss, R.G.; Mock, D.M.; Johnson, K.J.; Cress, G.A.; Burmeister, L.F.; Zimmerman, M.B.; Bell, E.F.; Rijhsinghani, A. A randomized clinical trial comparing immediate versus delayed clamping of the umblical cord in preterm infants: Short-term clinical and laboratory endpoints. Transfusion 2008, 48, 658–665. [Google Scholar] [CrossRef]
- Aboalqez, A.; Deindl, P.; Ebenebe, C.U.; Singer, D.; Blohm, M.E. Iatrogenic Blood Loss in Very Low Birth Weight Infants and Transfusion of Packed Red Blood Cells in a Tertiary Care Neonatal Intensive Care Unit. Children 2021, 8, 847. [Google Scholar] [CrossRef]
- Scholkmann, F.; Ostojic, D.; Isler, H.; Bassler, D.; Wolf, M.; Karen, T. Reference Ranges for Hemoglobin and Hematocrit Levels in Neonates as a Function of Gestational Age (22–42 Weeks) and Postnatal Age (0–29 Days): Mathematical Modeling. Children 2019, 6, 38. [Google Scholar] [CrossRef] [PubMed]
- Jopling, J.; Henry, E.; Wiedmeier, S.E.; Christensen, R.D. Reference ranges for hematocrit and blood hemoglobin concentration during the neonatal period: Data from a multihospital health care system. Pediatrics 2009, 123, e333–e337. [Google Scholar] [CrossRef] [PubMed]
- Esan, A.J. Hematological differences in newborn and aging: A review study. Hematol. Transfus. Int. J. 2016, 3, 178–190. [Google Scholar]
- Christensen, R.D.; Jopling, J.; Henry, E.; Wiedmeier, S.E. The erythrocyte indices of neonates defined using data from over 12,000 patients in a multihospital health care system. J. Perinatol. 2008, 28, 24–28. [Google Scholar] [CrossRef] [PubMed]
- Nunes, M.F.; Oliveira, A.M.; Conceicao, S.M.; Medrado, F.E. Erythrocyte Indices and Serum Ferritin in Newborns. Braz. J. Hematol. Hemother. 2010, 32, 365–370. [Google Scholar] [CrossRef]
- Putbrese, B.; Kennedy, A. Findings and differential diagnosis of fetal intracranial haemorrhage and fetal ischaemic brain injury: What is the role of fetal MRI? Br. J. Radiol. 2017, 90, 20160253. [Google Scholar] [CrossRef] [PubMed]
- Gilard, V.; Tebani, A.; Bekri, S.; Marret, S. Intraventricular Hemorrhage in Very Preterm Infants: A Comprehensive Review. J. Clin. Med. 2020, 9, 2447. [Google Scholar] [CrossRef] [PubMed]
- Moreno-Fernandez, J.; Ochoa, J.J.; Latunde-Dada, G.O.; Diaz-Castro, J. Iron Deficiency and Iron Homeostasis in Low Birth Weight Preterm Infants: A Systematic Review. Nutrients 2019, 11, 1090. [Google Scholar] [CrossRef]
- Ochoa, J.J.; Contreras-Chova, F.; Muñoz, S.; Araujo-Nepomuceno, E.; Bonillo, A.; Molina-Carballo, A.; Muñoz-Hoyos, A. Fluidity and oxidative stress in erythrocytes from very low birth weight infants during their first 7 days of life. Free Radic. Res. 2007, 41, 1035–1040. [Google Scholar] [CrossRef]
- Cavaliere, T. Red blood cell indices: Implications for practice. Newborn Infant Nurs. Rev. 2004, 4, 231–239. [Google Scholar] [CrossRef]
- Elmoneim, A.A.; Zolaly, M.; El-Moneim, E.A.; Sultan, E. Prognostic significance of early platelet count decline in preterm newborns. Indian. J. Crit. Care Med. 2015, 19, 456–461. [Google Scholar] [CrossRef] [PubMed]
- Rastogi, S.; Olmez, I.; Bhutada, A.; Rastogi, D. Drop in platelet counts in extremely preterm neonates and its association with clinical outcomes. J. Pediatr. Hematol. Oncol. 2011, 33, 580–584. [Google Scholar] [CrossRef] [PubMed]
- Go, H.; Ohto, H.; Nollet, K.E.; Takano, S.; Kashiwabara, N.; Chishiki, M.; Maeda, H.; Imamura, T.; Kawasaki, Y.; Momoi, N.; et al. Using Platelet Parameters to Anticipate Morbidity and Mortality Among Preterm Neonates: A Retrospective Study. Front. Pediatr. 2020, 8, 90. [Google Scholar] [CrossRef] [PubMed]
- Cekmez, F.; Tanju, I.A.; Canpolat, F.E.; Aydinoz, S.; Aydemir, G.; Karademir, F.; Sarici, S.U. Mean platelet volume in very preterm infants: A predictor of morbidities? Eur. Rev. Med. Pharmacol. Sci. 2013, 17, 134–137. [Google Scholar] [CrossRef] [PubMed]
- Wei, J.C.; Catalano, R.; Profit, J.; Gould, J.B.; Lee, H.C. Impact of antenatal steroids on intraventricular hemorrhage in very-low-birth weight infants. J. Perinatol. 2016, 36, 352e6. [Google Scholar] [CrossRef] [PubMed]
- Gamaleldin, I.; Harding, D.; Siassakos, D.; Draycott, T.; Odd, D. Significant intraventricular hemorrhage is more likely in very preterm infants born by vaginal delivery: A multi-centre retrospective cohort study. J. Matern. Fetal Neonatal Med. 2019, 32, 477–482. [Google Scholar] [CrossRef] [PubMed]
- Humberg, A.; Härtel, C.; Paul, P.; Hanke, K.; Bossung, V.; Hartz, A.; Fasel, L.; Rausch, T.K.; Rody, A.; Herting, E.; et al. Delivery mode and intraventricular hemorrhage risk in very-low-birth-weight infants: Observational data of the German Neonatal Network. Eur. J. Obstet. Gynecol. Reprod. Biol. 2017, 212, 144–149. [Google Scholar] [CrossRef] [PubMed]
- da Costa, C.S.; Czosnyka, M.; Smielewski, P.; Austin, T. Optimal mean arterial blood pressure in extremely preterm infants within the first 24 hours of life. J. Pediatr. 2018, 203, 242–248. [Google Scholar] [CrossRef]
- Eriksen, V.R.; Hahn, G.H.; Greisen, G. Dopamine therapy is associated with impaired cerebral autoregulation in preterm infants. Acta Paediatr. 2014, 103, 1221e6. [Google Scholar] [CrossRef]
- Sankaran, J.; Brandsma, E.; Kushnir, A. Effect of administration of normal saline bolus on intraventricular hemorrhage in preterm neonates. Pediatrics 2018, 14, 517. [Google Scholar] [CrossRef]
- Farag, M.M.; Gouda, M.H.; Almohsen, A.M.A.; Khalifa, M.A. Intraventricular hemorrhage prediction in premature neonates in the era of hemodynamics monitoring: A prospective cohort study. Eur. J. Pediatr. 2022, 181, 4067–4077. [Google Scholar] [CrossRef]
- Depala, K.S.; Chintala, S.; Joshi, S.; Budhani, S.; Paidipelly, N.; Patel, B.; Rastogi, A.; Madas, N.; Vejju, R.; Mydam, J. Clinical Variables Associated with Grade III and IV Intraventricular Hemorrhage (IVH) in Preterm Infants Weighing Less Than 750 Grams. Cureus 2023, 15, e40471. [Google Scholar] [CrossRef]
- Al-Mouqdad, M.M.; Abdelrahim, A.; Abdalgader, A.T.; Alyaseen, N.; Khalil, T.M.; Taha, M.Y.; Asfour, S.S. Risk factors for intraventricular hemorrhage in premature infants in the central region of Saudi Arabia. Int. J. Pediatr. Adolesc. Med. 2021, 8, 76–81. [Google Scholar] [CrossRef]
- Weinstein, R.M.; Parkinson, C.; Everett, A.D.; Graham, E.M.; Vaidya, D.; Northington, F.J. A predictive clinical model for moderate to severe intraventricular hemorrhage in very low birth weight infants. J. Perinatol. 2022, 42, 1374–1379. [Google Scholar] [CrossRef]
- Bersani, I.; Pluchinotta, F.; Dotta, A.; Savarese, I.; Campi, F.; Auriti, C.; Chuklantseva, N.; Piersigilli, F.; Gazzolo, F.; Varrica, A.; et al. Early predictors of perinatal brain damage: The role of neurobiomarkers. Clin. Chem. Lab. Med. 2020, 58, 471–486. [Google Scholar] [CrossRef] [PubMed]
- Berger, R.P.; Pak, B.J.; Kolesnikova, M.D.; Fromkin, J.; Saladino, R.; Herman, B.E.; Pierce, M.C.; Englert, D.; Smith, P.T.; Kochanek, P.M. Derivation and Validation of a Serum Biomarker Panel to Identify Infants with Acute Intracranial Hemorrhage. JAMA Pediatr. 2017, 171, e170429. [Google Scholar] [CrossRef] [PubMed]
Disclaimer/Publisher’s Note: The statements, opinions and data contained in all publications are solely those of the individual author(s) and contributor(s) and not of MDPI and/or the editor(s). MDPI and/or the editor(s) disclaim responsibility for any injury to people or property resulting from any ideas, methods, instructions or products referred to in the content. |
© 2024 by the authors. Licensee MDPI, Basel, Switzerland. This article is an open access article distributed under the terms and conditions of the Creative Commons Attribution (CC BY) license (https://creativecommons.org/licenses/by/4.0/).