Abstract
Background and Objective: This study aimed to identify the incidence of sarcopenia and disease risk factors in Korean adults and to provide data for sarcopenia prevention. Materials and Methods: Based on the Korea National Health and Nutrition Survey, 2008–2011, we selected 14,185 adults over the age of 20 who participated in sarcopenia diagnostic tests and health surveys. We analyzed sarcopenia risk factors using complex sample multi-logistic regression analysis. Results: The prevalence of sarcopenia in Korea was 31.3%, with 20.2% in men and 40.4% in women. In men, there was a higher risk of sarcopenia in those of older age, without a spouse, with a low body mass index (BMI), who never engage in resistance exercise, or who do mid-level intensity resistance exercises. In women, sarcopenia risk was higher in those in their 20s compared to those in their 60s, and risk factors included a low BMI, high-density lipoprotein cholesterol and waist circumference measurements, alcohol consumption, aerobic exercise, and resistance exercise. Conclusions: Interventions and lifestyle improvements will help prevent the onset of sarcopenia in elderly men and young women with risk factors such as a low BMI.
1. Introduction
Sarcopenia involves the loss of muscle mass, muscle strength, and physical performance due to a lack of exercise, aging, and hormonal changes, although a clear mechanism has not yet been identified [1]. The loss of muscle strength caused by sarcopenia leads to mobility limitations and decreased physical activity levels [2,3], and decreased muscle mass is associated with cardiopulmonary vascular disease, osteoporosis, metabolic syndrome, physical damage, and high mortality [4,5,6,7]. Furthermore, there is a 1–2% decrease in skeletal muscle per year after the age of 35 and a 3% decrease per year after the age of 65 [8].
Sarcopenia shows differences in prevalence between men and women, but mainly after their 40s, as muscle mass begins to decrease and shows a rapid decrease with age. Several previous studies have reported that the prevalence of sarcopenia in the elderly (over 65 years of age) is about 10% and increases to up to 50% or more after 80 years of age [9,10]. Sarcopenia can cause falls, limit daily activities, and reduce quality of life [10,11,12].
Factors related to sarcopenia include nutritional intake, physical activity, alcohol consumption, and smoking status [13,14], and high-quality nutritional status and exercise are known to be key factors in preventing sarcopenia [15]. Recently, as interest in sarcopenia has increased in Korea, active research has been conducted and the prevalence of sarcopenia in elderly men has been found at 9.7% and 11.8% in elderly women [16].
An early diagnosis of sarcopenia allows for prompt and effective treatment [17]. Delayed treatment deteriorates a patient’s quality of life, increases health problems, and raises treatment costs [18]. Identifying disease risk factors helps to prevent sarcopenia, which reduces this cost burden, and it is important to shift the paradigm to prevention rather than treatment.
Most sarcopenia studies in Korea focus on individual factors, such as the association between sarcopenia and certain diseases, physical activity, and walking, and few studies have analyzed multiple risk factors [19,20,21,22]. Moreover, studies on risk factors for sarcopenia are mostly limited to elderly participants [23,24]. Sarcopenia risk factors may differ in men and women, but the analysis of factors related to sarcopenia for overall age is limited by sex [19,21,22,23,24].
This study supports the development of sarcopenia prevention programs by monitoring sarcopenia prevalence and risk factors in Korean adults using national statistical data. It examines the role of sex in sarcopenia prevalence and risk factors.
2. Materials and Methods
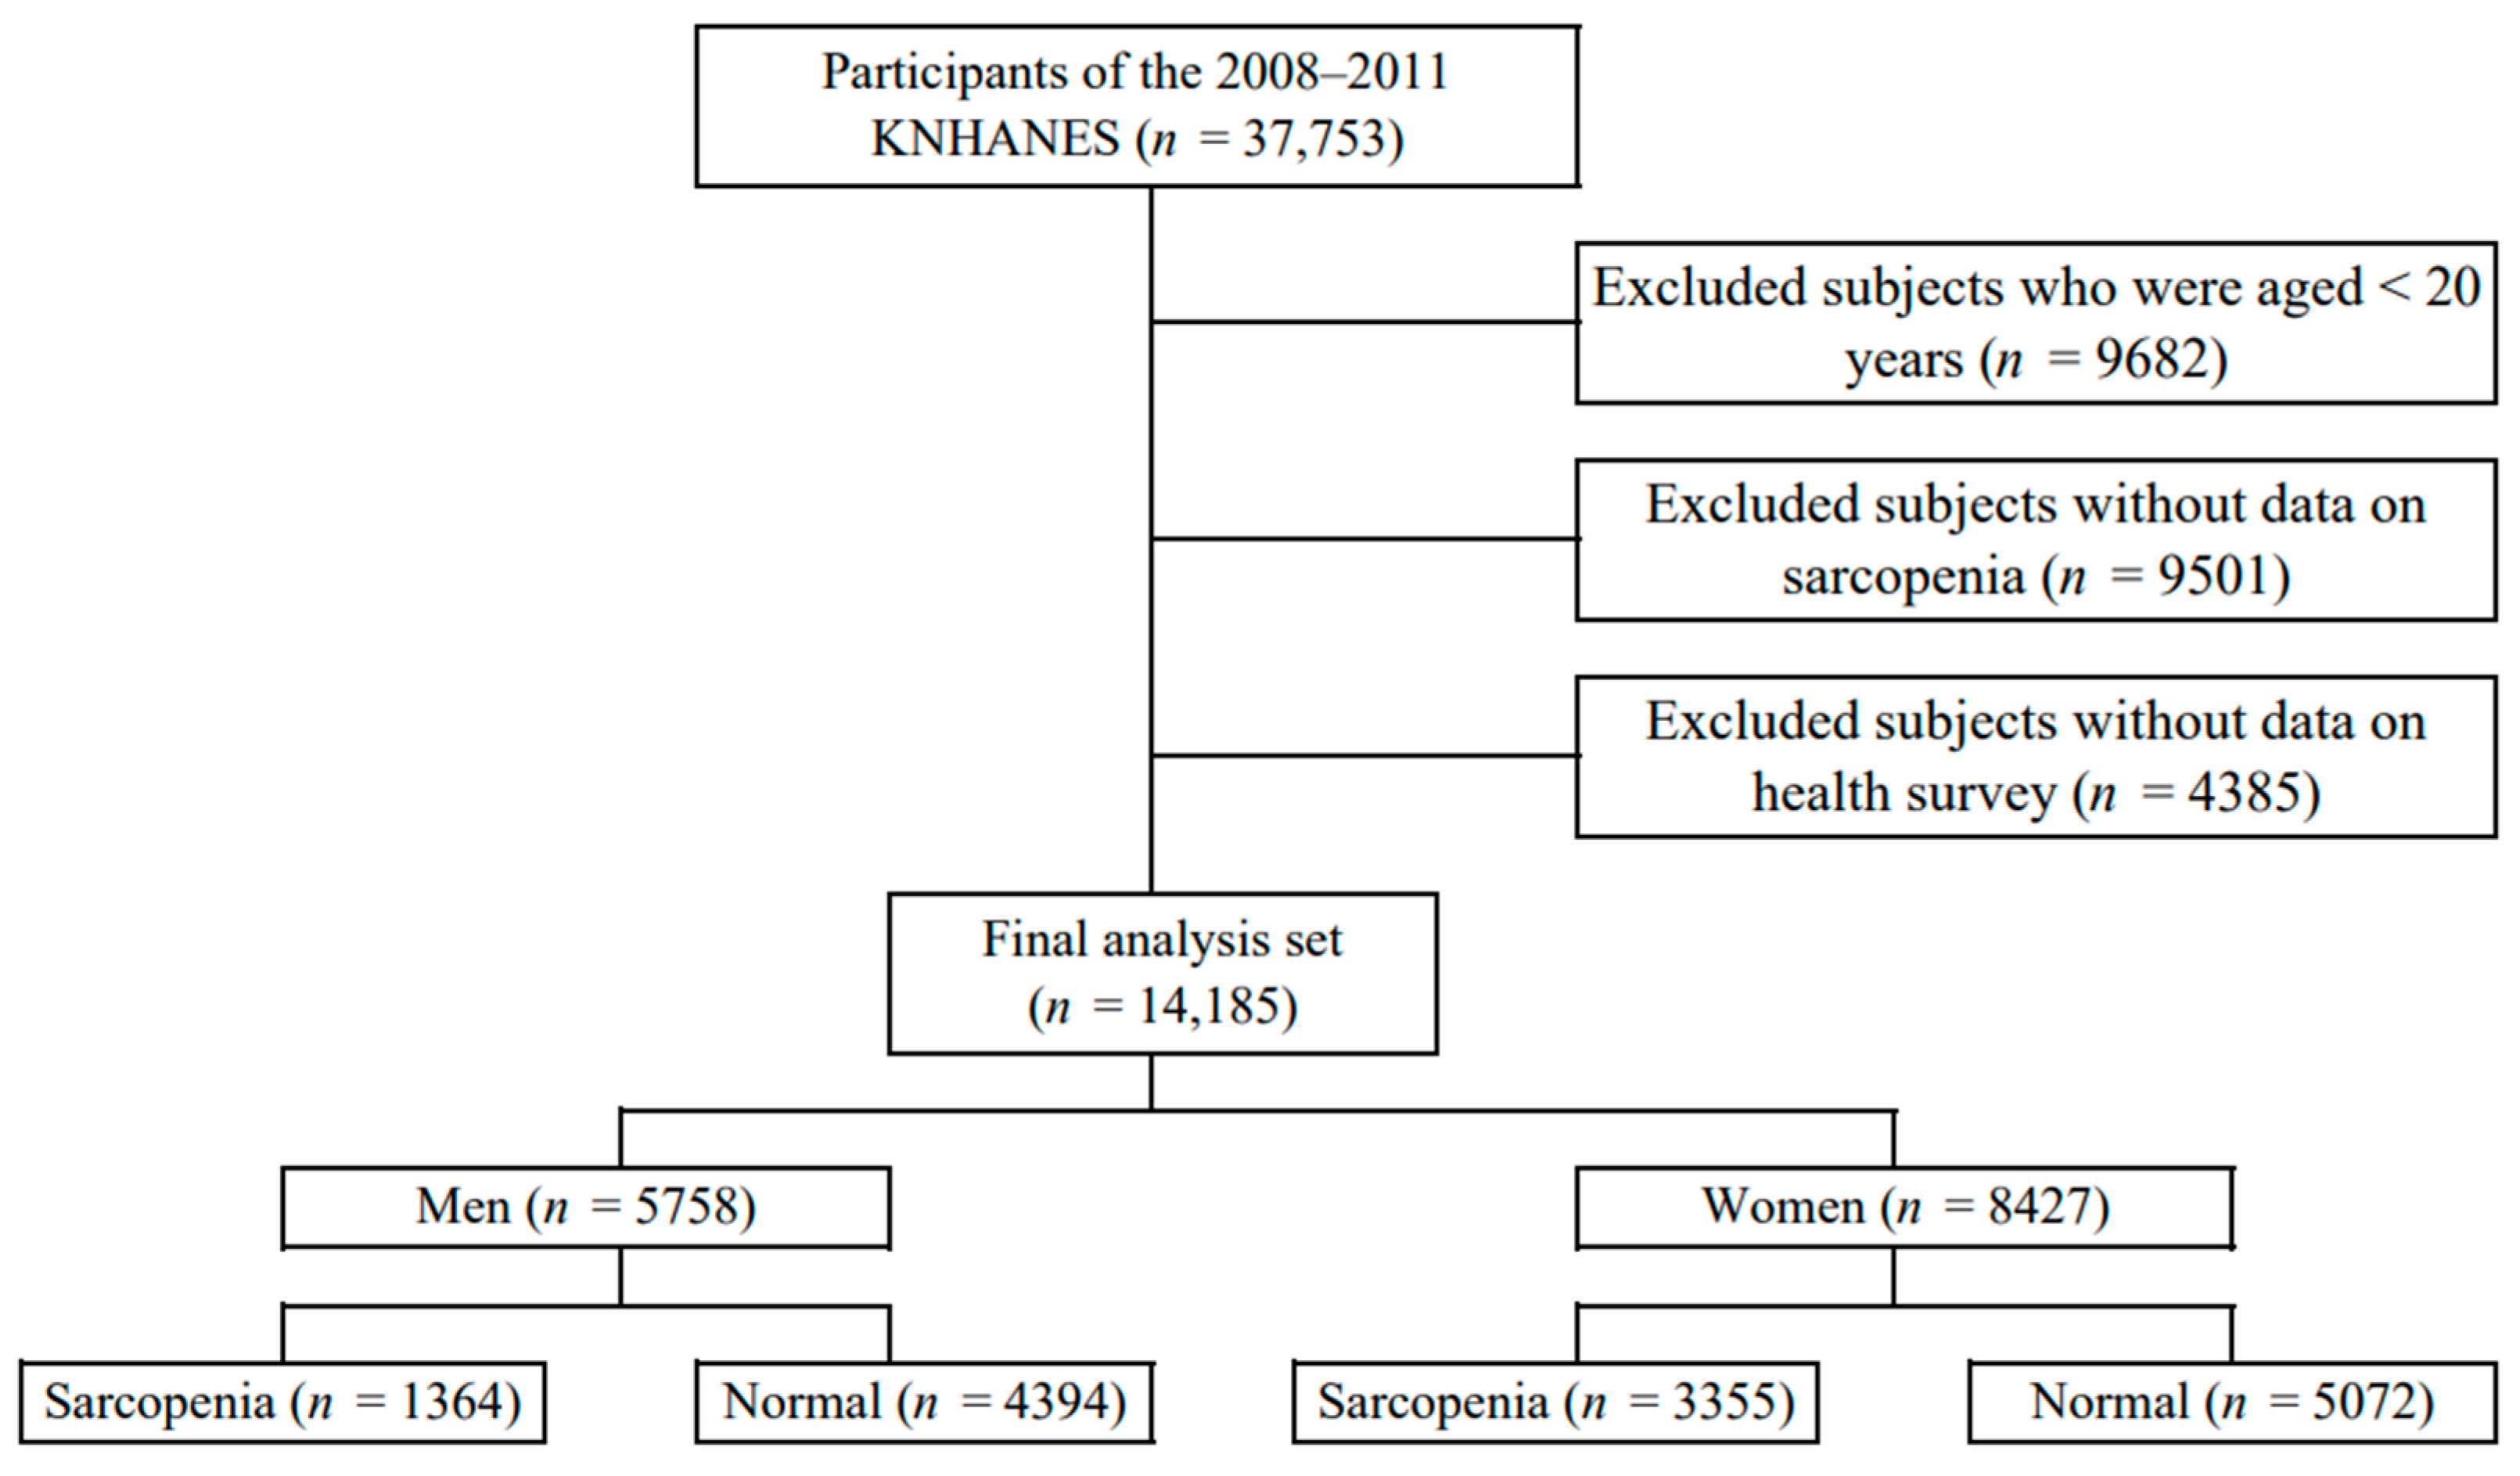
This study used data from 2008 to 2011 from the Korea National Health and Nutrition Examination Survey (KNHANES) conducted by the Korea Centers for Disease Control and Prevention. The subjects were selected as those who measured whole-body dual-energy X-ray absorptiometry (DXA) for the diagnosis of sarcopenia among adults over 20 years of age. Among them, subjects who participated in both the health survey and the physical measurement test were selected. Of the 37,753 subjects who participated in the survey, 9682 subjects under the age of 20, 9501 subjects without sarcopenia, and 4385 participants without the health survey and physical measurement test were excluded. Finally, 14,185 subjects were selected (Figure 1).
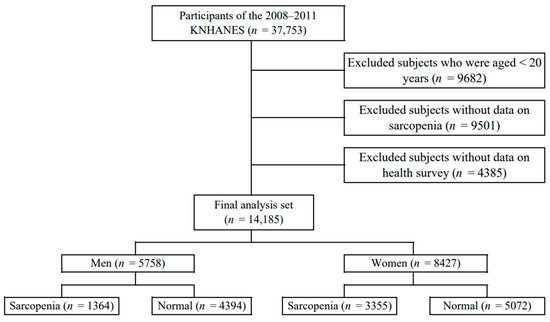
Figure 1.
Selection of participants from the Korea National Health and Nutrition Examination Survey 2008–2011.
2.1. Demographic and Sociological Factors
As for demographic and sociological variables, items such as gender, age, education level, marital status, and personal income level were collected. Age was divided into 50s, 60s, and 70s or older. Education level was divided into low or high based on high school graduation. Marriage status was classified according to whether the participant lived with their current spouse. The average monthly individual income was divided using a quartile.
2.2. Health and Disease-Related Factors
Health and disease-related variables were collected: height, weight, body mass index (BMI), blood pressure, blood sugar, triglyceride, HDL-C, waist circumference, smoking and drinking status, and aerobic and resistance exercise. BMI was calculated by dividing body weight (kg) by the square of height (m2). It was divided into low weight, normal, overweight, and obesity. Blood pressure was measured using a mercury hypertension meter, and after 5 min of rest using a cuff suitable for the arm circumference, it was measured three times at 30 s intervals. Hypertension was classified as systolic blood pressure of 130 mmHg or more, diastolic blood pressure of 85 mmHg or more, or if the participant was currently taking antihypertensive drugs. Blood tests were collected while maintaining an empty stomach for more than 8 h and analyzed within 24 h using a Hitachi Automatic Analyzer 7600 (Hitachi, Tokyo, Japan). Hyperglycemia was defined as the case of fasting blood glucose ≥ 100 mg/dL or the participant taking diabetic drugs. Hypertriglyceridemia was classified as triglyceride of 150 mg/dL or more. Low HDL-C was classified as less than 40 mg/dL in men and less than 50 mg/dL in women, and abdominal obesity was classified as more than 90 cm in men and 85 cm in women based on waist circumference (WC) [5].
Smoking status was classified as ‘daily smoking’ and ‘occasionally smoking’ as current smoking, ‘smoking in the past, but not now’ as past smoking, and ‘never smoked’ as non-smoking. Drinking status was classified as current drinking in response to ‘more than once a month’ and ‘less than once a month’ and non-drinking in response to ‘not drinking at all in the last year’.
Aerobic exercise was determined as the walking time, as follows. Number of days the subject walked ≥10 min at a time for the last 1 week was expressed. Walking was measured by total walking time in a week (TWT), calculated as follows: TWT = walking days (days/week) × walking minutes (minutes/day). Frequency of resistance exercise was assessed according to participants’ answers to the question “How many times do you do resistance exercise (push-ups, sit-ups, lifting dumbbells or barbells) a week?” If there was no resistance exercise at all, it was classified into a medium intensity group for 1 to 3 days of resistance exercise, and a high intensity group for more than 4 days.
2.3. Sarcopenia Measurement
Sarcopenia-related body composition was measured by licensed technicians using DXA (Discovery QDR 4500 W, Hologic Inc., Belford, MA, USA). Participants fasted prior to the assessment and were in the supine position during the assessment. All non-fat and non-bone tissue was assumed to be skeletal muscle.
Appendicular skeletal muscle mass (ASM) was calculated as the sum of skeletal muscle mass in both arms and legs, as measured by DXA. The subjects’ skeletal muscle mass index (SMI) was calculated as their ASM (kg) divided by their height in meters squared (m2). Sarcopenia was defined as SMI values <7.0 kg/m2 for men and <5.4 kg/m2 for women, as recommended by the Asian Working Group for Sarcopenia (AWGS) [25].
2.4. Data Analysis
The data were analyzed using SPSS 27.0 window version (IBM, Armonk, NY, USA). The responses were weighted by reference to the multistage, complex, probability sampling design. Data are expressed as absolute numbers and estimated percentages (with standard errors (SE)). The specific analysis method is as follows. First, the difference in characteristics between sarcopenia and the normal group was analyzed by t-test and complex sample cross-analysis (χ2-test). Second, complex sample multiple logistic regression analysis was used to analyze the risk factors affecting sarcopenia, and statistics were expressed as odds ratio (OR) and 95% confidence interval (CI).
3. Results
3.1. Prevalence of Sarcopenia and Demographic Sociological Characteristics According to Sex
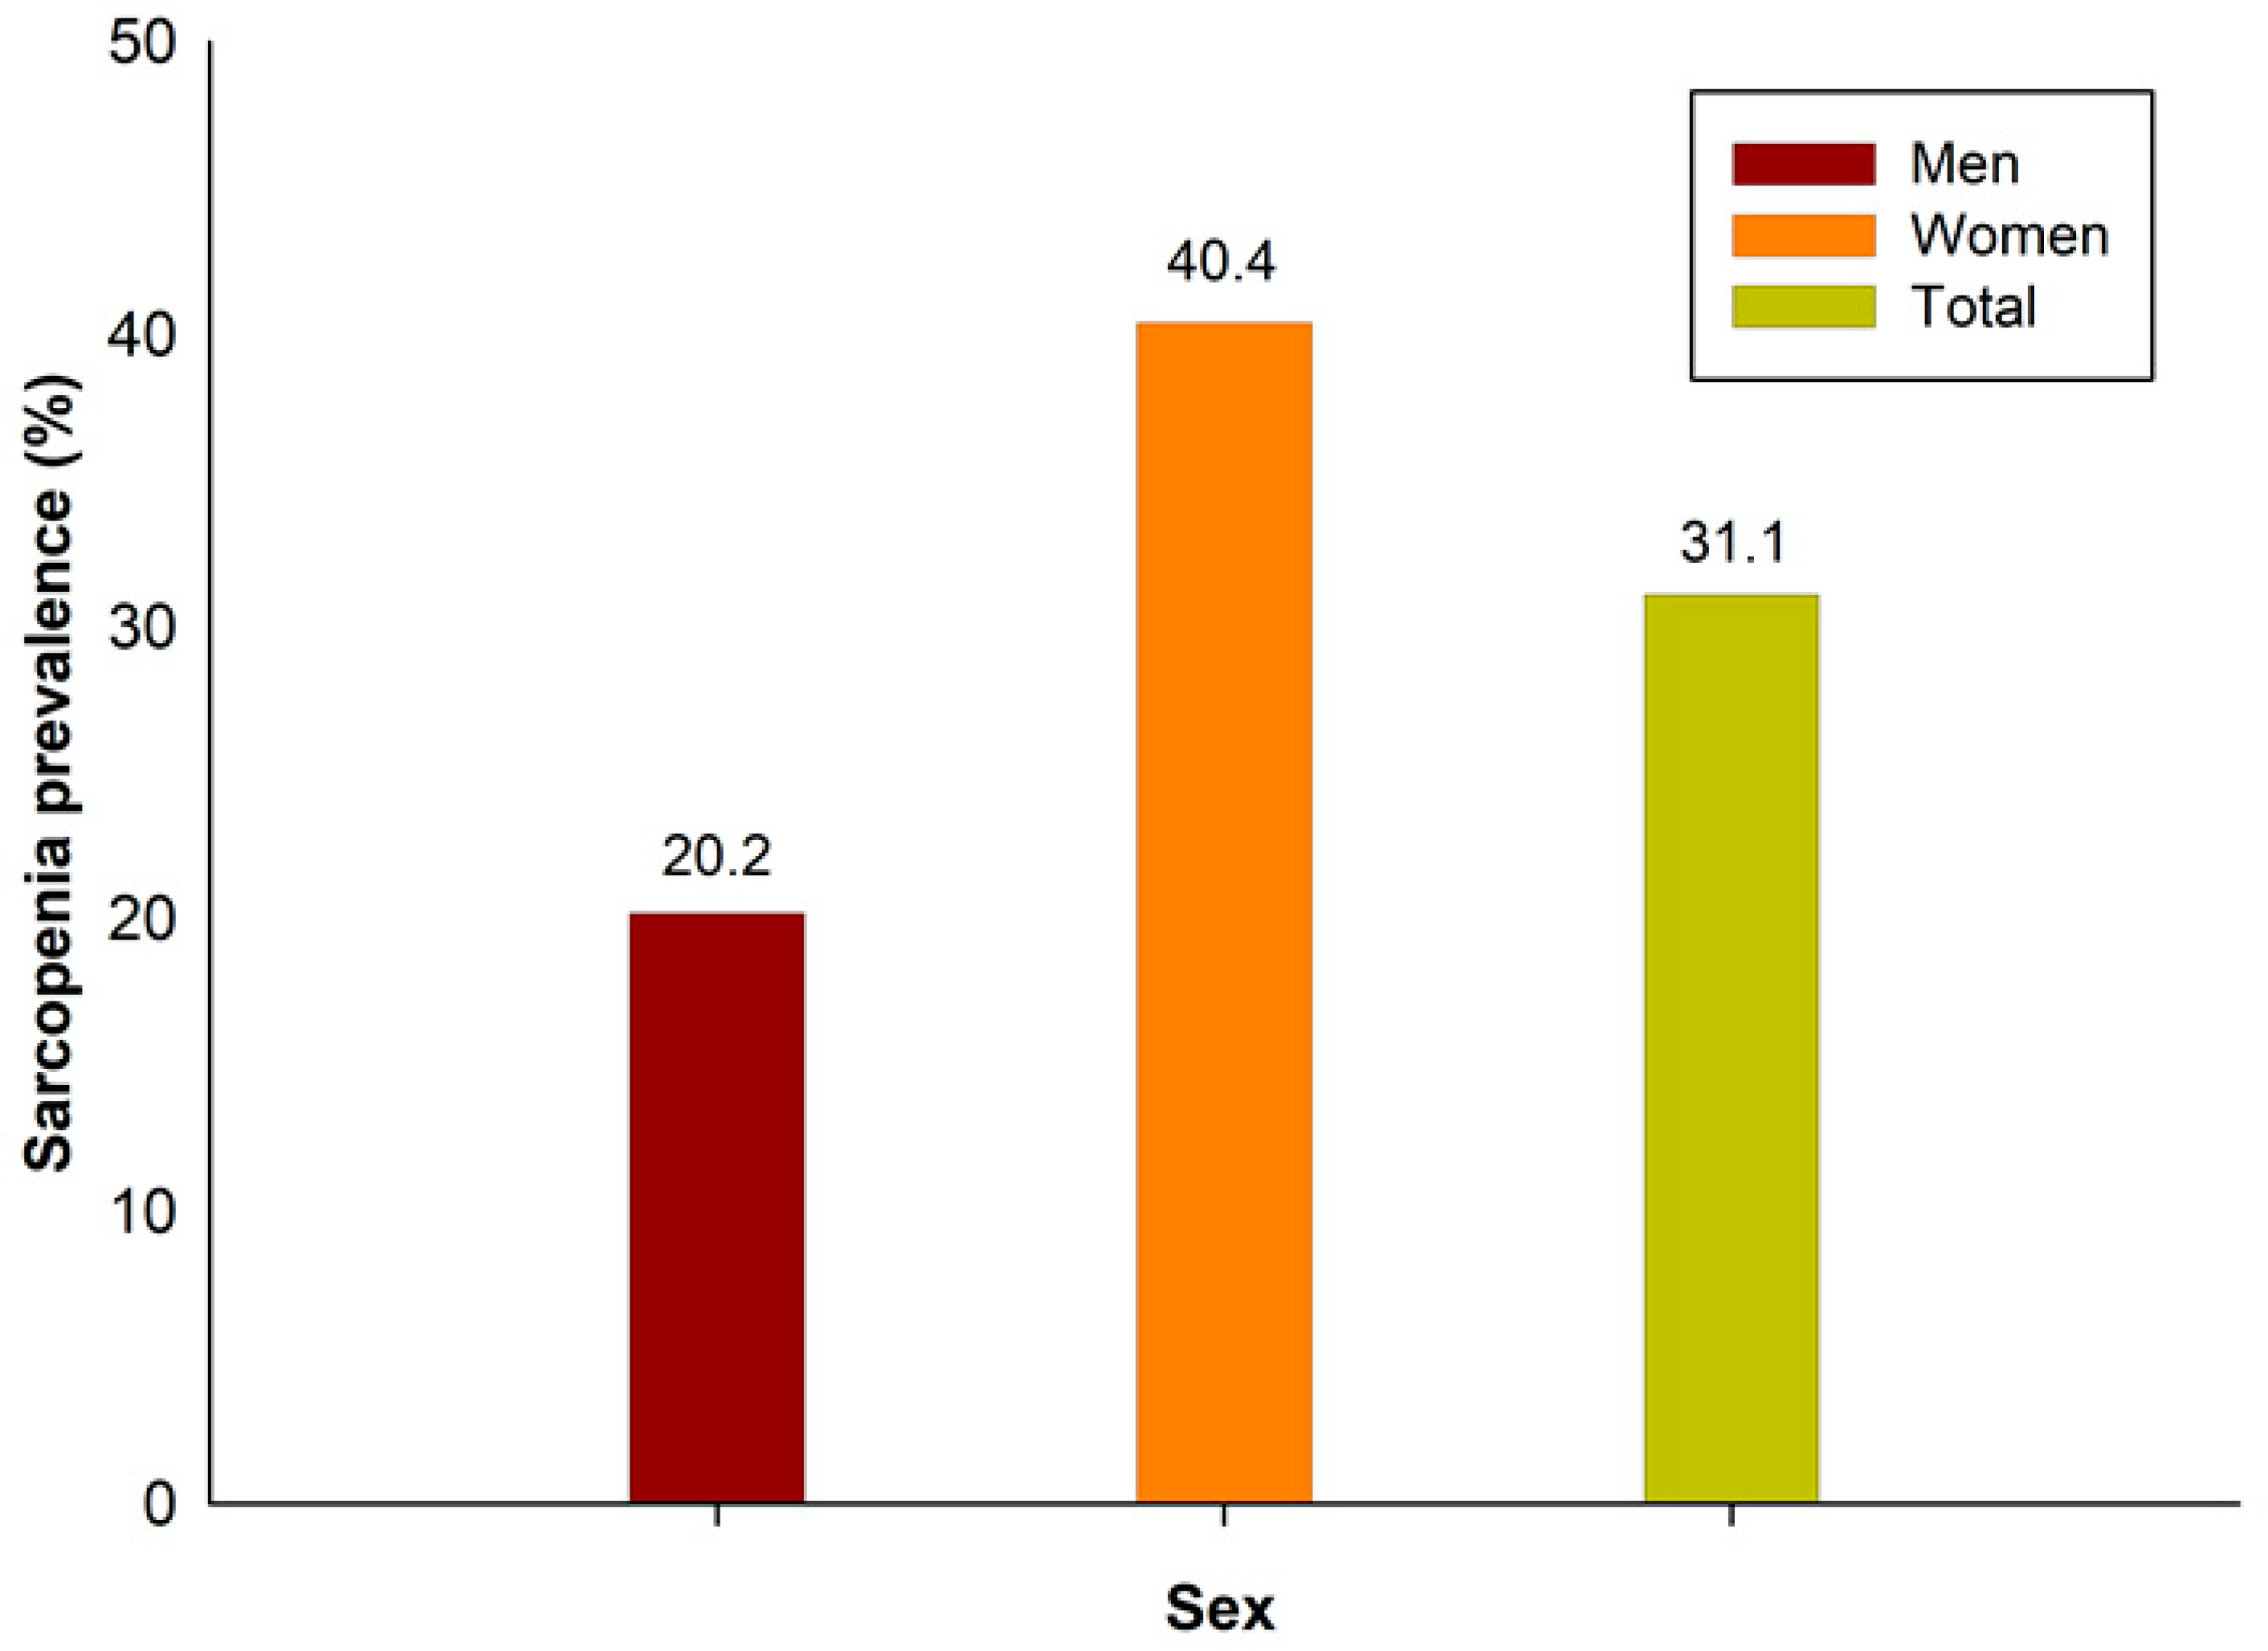
The prevalence of sarcopenia in this study was 31.1%: 20.2% in men and 40.4% in women (Figure 2). The demographic and sociological characteristics of the participants are presented in Table 1 and Table 2. In men, there were statistically significant differences between those with and without sarcopenia in all variables, except for marital status, individual income, smoking status, and aerobic exercise. In women, there were statistically significant differences in all variables except for marital status, height, smoking status, and alcohol status.

Figure 2.
Sarcopenia prevalence in Korea.

Table 1.
Characteristics in subjects according to sarcopenia in men.
Table 2.
Characteristics in subjects according to sarcopenia in women.
3.2. Multiple Logistic Regression Analysis for Sarcopenia Risk Factor
Table 3 and Table 4 show the sarcopenia risk factors according to sex. In Table 3, per simple logistic regression analysis, the factors affecting sarcopenia in men were age, individual income, BMI, blood pressure, blood glucose level, TG, HDL-C, WC, and aerobic and resistance exercises. In Table 3, the Nagelkerke R2 = 0.335 in the final multiple logistic regression analysis model. After adjusting for covariates in the multiple logistic regression analysis, the sarcopenia risk factors for men were age, individual income, BMI, HDL-C, WC, alcohol status, and levels of aerobic and resistance exercise. The ORs were 3.201 (95% CI 1.824–5.618) and 6.393 (95% CI 3.691–11.073), respectively, for individuals in their 60s and 70s compared to those in their 20s. For BMI and WC, which are obesity indicators, sarcopenia prevalence was higher in underweight individuals and lower in overweight or obese individuals. For resistance exercise, those who performed resistance exercise and those in the mid-intensity group had ORs of 1.808 (95% CI 1.404–2.329) and 1.664 (95% CI 1.178–2.251), respectively, compared to the high-intensity group. The results indicate that men in their 60s and 70s who are underweight and who do not perform resistance exercises have a higher prevalence of sarcopenia.
Table 3.
Multiple logistic regression analysis for sarcopenia risk factor in men.
Table 4.
Multiple logistic regression analysis for sarcopenia risk factor in women.
A simple logistic regression analysis (Table 4) shows that the factors affecting sarcopenia in women were age, educational level, BMI, blood pressure, blood glucose, TG, HDL-C, WC, and aerobic and resistance exercise levels. After adjusting for covariates, the sarcopenia risk factors in women were age, individual income, BMI, HDL-C, WC, alcohol status, and resistance exercise. Those in their 60s had an OR of 0.661 (95% CI 0.469–0.931) compared to women in their 20s. Regarding individual income, those in Q1 had an OR of 0.819 (95% CI 0.686–0.979) compared to those in the Q4 quartile. Sarcopenia prevalence was higher in those with high BMI and WC compared to underweight individuals. Those with a low HDL-C had an OR of 0.786 (95% CI 0.690–0.895) compared to those with a normal HDL-C level. Those who never performed resistance exercise had an OR of 1.644 (95% CI 1.252–2.159) compared to the high-intensity group. Sarcopenia prevalence was high in women in their 20s and those who were underweight, with high HDL-C levels, and who never performed resistance exercise.
4. Discussion
The purpose of this study was to investigate sarcopenia prevalence and risk factors by sex, as well as to promote sex-specific care and prevention techniques. In this study, the prevalence of sarcopenia among adults in Korea was 31.1%: 20.4% in men and 40.4% in women.
The results of this study indicate that men in their 60s and 70s who are underweight and who do not perform resistance exercises have a higher prevalence of sarcopenia. In men, the risk of sarcopenia was 3.201 times higher for those in their 60s and 6.393 times higher for those in their 70s compared to individuals in their 20s. This was similar to the results of a previous study, in which limb muscle mass significantly decreased in men with age [26].
In women, a univariate logistic analysis showed that sarcopenia prevalence was significantly higher in individuals in their 20s compared to any other age group. A multivariate analysis showed that the prevalence of sarcopenia for women in their 20s was significantly higher than for women in their 60s. This is contrary to several previous studies showing that sarcopenia prevalence is high in elderly populations [23,27,28].
There may be several reasons why sarcopenia is more common in women in their 20s compared to women in their 60s. The blatant stigma of obesity [29] and the influence of body dissatisfaction [30] through mass media has spread the culture of lookism [31]. Korean women often consume a strict diet regardless of their weight, especially those in their 20s [32,33]. The obesity rate of Korean men is 22.6% in their 20s and 31.1% in their 60s, while that of women is about 3.4 times different, 8.6% in their 20s and 29.0% in their 60s [34]. Due to this effect, it is thought that women have a greater risk of sarcopenia in their 20s.
Regardless of sex, the sarcopenia prevalence was significantly higher in underweight individuals and those who never engaged in resistance exercise. Several previous studies have shown that SMI and BMI are strongly correlated, and BMI tends to decrease in patients with sarcopenia [35,36,37]. Sarcopenia prevalence in women with obesity was lower than in non-obese women [38]. A low BMI can be said to be one of the risk factors for sarcopenia.
Several studies have shown that physical activity levels are highly correlated with sarcopenia, particularly resistance exercise [39,40,41]. A previous study found that the sarcopenia rate was significantly higher in subjects with long-term sedentary behavior, and sedentary behaviors lasting more than seven days result in a loss of 30% of the muscle mass [14,39,40]. The results of this study also show that men are 1.664 times more likely to have sarcopenia if they are in the mid-intensity exercise group and 1.808 times more likely if they never engage in resistance exercise compared to those in the high-intensity group, consistent with previous studies. In women, there was no significant difference in sarcopenia risk between those in the high- and mid-intensity groups, but the prevalence of sarcopenia was 1.644 times higher in those who never performed resistance exercise compared to those in the high-intensity group.
In the results of this study, HDL-C levels for men and women were higher in the sarcopenia group (at 47.83 ± 0.42 mg/dL and 52.22 ± 0.25 mg/dL, respectively) compared to the normal group, but this difference was significant only in women in the multiple regression analysis that considered various covariates. This is similar to the results of previous studies, which found a higher incidence of sarcopenia with higher HDL-C levels [42,43,44]. However, since these preceding studies did not separate male and female groups, it is confirmed that there is some difference from the results in this study. Therefore, the fact that HDL-C showed a significant difference only in women is considered to require further research in the future.
This study has several limitations. First, it is a cross-sectional study that identified sarcopenia prevalence and risk factors, so there are limits in establishing a causal relationship. Future studies are necessary to confirm a causal relationship. Second, in the subjects of the KNHANES survey, the non-participation of a small number of severe sarcopenia patients may affect the outcome analysis. However, since these data were obtained for the national population, it is thought that the disturbing factors for a small number of people did not significantly affect the results. Third, the study data were from 12 years ago, and may not reflect the current population. However, this study may serve as a meaningful foundation for subsequent studies. Despite these limitations, this study has research significance as primary evidence for health promotion projects for subjects with sarcopenia.
5. Conclusions
This study was conducted to provide data for sarcopenia prevention and management by identifying the prevalence and risk factors according to sex in Korean adults. In this study, the overall prevalence of sarcopenia was 31.3%: 20.2% in men and 40.4% in women. The incidence of sarcopenia was high in older men, those who did not live with a spouse, were underweight, never performed resistance exercises, or who performed mid-intensity resistance exercises. On the other hand, in women, the risk of developing sarcopenia in their 20s was high, and low BMI, HDL-C, WC, alcohol consumption, and aerobic and resistance exercise were found to be risk factors. Therefore, sarcopenia risk factors must consider these risk factors according to sex when developing health-related education programs.
Funding
This research received no external funding.
Institutional Review Board Statement
The Korea National Health and Nutrition Examination Survey does not require an ethics review and corresponds to the research conducted by the government for public welfare in accordance with Article 2, Paragraph 1 of the Bioethics Act and Article 2, Paragraph 1 of the Enforcement Rule of the same Act. conducted without deliberation by the committee. Hence, ethical review and approval for this study were waived.
Informed Consent Statement
Informed consent was obtained from all participants involved in the study.
Data Availability Statement
All data were anonymized and can be downloaded from the website (https://knhanes.kdca.go.kr/knhanes, accessed on 10 March 2024).
Conflicts of Interest
The authors declare no conflicts of interest.
References
- Bao, W.X.; Sun, Y.; Zhang, T.F.; Zou, L.L.; Wu, X.H.; Wang, D.M.; Chen, Z.B. Exercise Programs for Muscle Mass, Muscle Strength and Physical Performance in Older Adults with Sarcopenia: A Systematic Review and Meta-Analysis. Aging Dis. 2020, 11, 863–873. [Google Scholar] [CrossRef] [PubMed]
- Ferrucci, L.; Guralnik, J.M.; Buchner, D.; Kasper, J.; Lamb, S.E.; Simonsick, E.M.; Corti, M.C.; BandeenRoche, K.; Fried, L.P. Departures from linearity in the relationship between measures of muscular strength and physical performance of the lower extremities: The Women’s Health and Aging Study. J. Gerontol. Ser. A-Biol. Sci. Med. Sci. 1997, 52, M275–M285. [Google Scholar] [CrossRef] [PubMed]
- Lauretani, F.; Russo, C.R.; Bandinelli, S.; Bartali, B.; Cavazzini, C.; Di Iorio, A.; Corsi, A.M.; Rantanen, T.; Guralnik, J.M.; Ferrucci, L. Age-associated changes in skeletal muscles and their effect on mobility: An operational diagnosis of sarcopenia. J. Appl. Physiol. 2003, 95, 1851–1860. [Google Scholar] [CrossRef] [PubMed]
- Janssen, I. Influence of sarcopenia on the development of physical disability: The Cardiovascular Health Study. J. Am. Geriatr. Soc. 2006, 54, 56–62. [Google Scholar] [CrossRef] [PubMed]
- Lee, D.; Shin, S. Sarcopenia Is Associated with Metabolic Syndrome in Korean Adults Aged over 50 Years: A Cross-Sectional Study. Int. J. Environ. Res. Public Health 2022, 19, 1330. [Google Scholar] [CrossRef] [PubMed]
- Lee, D.; Shin, S. Association of Sarcopenia with Osteopenia and Osteoporosis in Community-Dwelling Older Korean Adults: A Cross-Sectional Study. J. Clin. Med. 2022, 11, 129. [Google Scholar] [CrossRef] [PubMed]
- Lee, D.Y. The Association between Sarcopenia and Pulmonary Function in Koreans: A Cross-Sectional Study. Int. J. Gerontol. 2021, 15, 319–323. [Google Scholar] [CrossRef] [PubMed]
- Nair, K.S. Age-related changes in muscle. In Mayo Clinic Proceedings; Elsevier: Amsterdam, The Netherlands, 2000; pp. S14–S18. [Google Scholar]
- Baumgartner, R.N.; Koehler, K.M.; Gallagher, D.; Romero, L.; Heymsfield, S.B.; Ross, R.R.; Garry, P.J.; Lindeman, R.D. Epidemiology of sarcopenia among the elderly in New Mexico. Am. J. Epidemiol. 1998, 147, 755–763. [Google Scholar] [CrossRef] [PubMed]
- Tanimoto, Y.; Watanabe, M.; Sun, W.; Sugiura, Y.; Tsuda, Y.; Kimura, M.; Hayashida, I.; Kusabiraki, T.; Kono, K. Association between sarcopenia and higher-level functional capacity in daily living in community-dwelling elderly subjects in Japan. Arch. Gerontol. Geriatr. 2012, 55, E9–E13. [Google Scholar] [CrossRef]
- Cheng, D.S.; Zhang, Q.; Wang, Z.; Li, J.H.; Jian, G.H.; Wang, N.A.S. Association Between Sarcopenia and Its Components and Dependency in Activities of Daily Living in Patients on Hemodialysis. J. Ren. Nutr. 2021, 31, 397–402. [Google Scholar] [CrossRef]
- Pham, V.K.; Yeung, S.S.Y.; Reijnierse, E.M.; Trappenburg, M.C.; Meskers, C.G.M.; Maier, A.B. Sarcopenia and its association with falls and fractures in older adults: A systematic review and meta-analysis. Australas. Ageing 2018, 37, 47. [Google Scholar]
- Locquet, M.; Bruyère, O.; Lengelé, L.; Reginster, J.Y.; Beaudart, C. Relationship between smoking and the incidence of sarcopenia: The SarcoPhAge cohort. Public Health 2021, 193, 101–108. [Google Scholar] [CrossRef] [PubMed]
- Rom, O.; Kaisari, S.; Aizenbud, D.; Reznick, A.Z. Lifestyle and sarcopenia—Etiology, prevention, and treatment. Rambam Maimonides Med. J. 2012, 3, e0024. [Google Scholar] [CrossRef] [PubMed]
- Naseeb, M.A.; Volpe, S.L. Protein and exercise in the prevention of sarcopenia and aging. Nutr. Res. 2017, 40, 1–20. [Google Scholar] [CrossRef] [PubMed]
- Kim, Y.S.; Lee, Y.; Chung, Y.S.; Lee, D.J.; Joo, N.S.; Hong, D.; Song, G.E.; Kim, H.J.; Choi, Y.J.; Kim, K.M. Prevalence of Sarcopenia and Sarcopenic Obesity in the Korean Population Based on the Fourth Korean National Health and Nutritional Examination Surveys. J. Gerontol. Ser. A-Biol. Sci. Med. Sci. 2012, 67, 1107–1113. [Google Scholar] [CrossRef] [PubMed]
- Xie, W.Q.; Xiao, G.L.; Hu, P.W.; He, Y.Q.; Lv, S.; Xiao, W.F. Possible sarcopenia: Early screening and intervention-narrative review. Ann. Pallliat. Med. 2020, 9, 4283–4293. [Google Scholar] [CrossRef] [PubMed]
- Antunes, A.C.; Araújo, D.A.; Veríssimo, M.T.; Amaral, T.F. Sarcopenia and hospitalisation costs in older adults: A cross-sectional study. Nutr. Diet. 2017, 74, 46–50. [Google Scholar] [CrossRef] [PubMed]
- Chin, S.O.; Rhee, S.Y.; Chon, S.; Hwang, Y.C.; Jeong, I.K.; Oh, S.; Ahn, K.J.; Chung, H.Y.; Woo, J.T.; Kim, S.W.; et al. Sarcopenia Is Independently Associated with Cardiovascular Disease in Older Korean Adults: The Korea National Health and Nutrition Examination Survey (KNHANES) from 2009. PLoS ONE 2013, 8, e60119. [Google Scholar] [CrossRef] [PubMed]
- Kim, S.H.; Kim, T.H.; Hwang, H.J. The relationship of physical activity (PA) and walking with sarcopenia in Korean males aged 60 years and older using the Fourth Korean National Health and Nutrition Examination Survey (KNHANES IV-2, 3), 2008–2009. Arch. Gerontol. Geriatr. 2013, 56, 472–477. [Google Scholar] [CrossRef]
- Kim, T.N.; Park, M.S.; Yang, S.J.; Yoo, H.J.; Kang, H.J.; Song, W.; Seo, J.A.; Kim, S.G.; Kim, N.H.; Baik, S.H.; et al. Prevalence and Determinant Factors of Sarcopenia in Patients with Type 2 Diabetes: The Korean Sarcopenic Obesity Study (KSOS). Diabetes Care 2010, 33, 1497–1499. [Google Scholar] [CrossRef]
- Lee, D.Y.; Shin, S. Sarcopenia and Anemia in Elderly Koreans: A Nationwide Population-Based Study. Healthcare 2023, 11, 2428. [Google Scholar] [CrossRef] [PubMed]
- Lau, E.M.C.; Lynn, H.S.H.; Woo, J.W.; Kwok, T.C.Y.; Melton, L.J. Prevalence of and risk factors for sarcopenia in elderly Chinese men and women. J. Gerontol. Ser. A-Biol. Sci. Med. Sci. 2005, 60, 213–216. [Google Scholar] [CrossRef] [PubMed]
- Therakomen, V.; Petchlorlian, A.; Lakananurak, N. Prevalence and risk factors of primary sarcopenia in community-dwelling outpatient elderly: A cross-sectional study. Sci. Rep. 2020, 10, 19551. [Google Scholar] [CrossRef] [PubMed]
- Chen, L.K.; Woo, J.; Assantachai, P.; Auyeung, T.W.; Chou, M.Y.; Iijima, K.; Jang, H.C.; Kang, L.; Kim, M.; Kim, S.; et al. Asian Working Group for Sarcopenia: 2019 Consensus Update on Sarcopenia Diagnosis and Treatment. J. Am. Med. Dir. Assoc. 2020, 21, 300–307. [Google Scholar] [CrossRef] [PubMed]
- Lee, J.S.W.; Auyeung, T.W.; Kwok, T.; Lau, E.M.C.; Leung, P.C.; Woo, J. Associated factors and health impact of sarcopenia in older Chinese men and women: A cross-sectional study. Gerontology 2007, 53, 404–410. [Google Scholar] [CrossRef] [PubMed]
- Yamada, M.; Nishiguchi, S.; Fukutani, N.; Tanigawa, T.; Yukutake, T.; Kayama, H.; Aoyama, T.; Arai, H. Prevalence of Sarcopenia in Community-Dwelling Japanese Older Adults. J. Am. Med. Dir. Assoc. 2013, 14, 911–915. [Google Scholar] [CrossRef]
- Yang, Y.C.; Zhang, Q.; He, C.H.; Chen, J.; Deng, D.F.; Lu, W.W.; Wang, Y.M. Prevalence of sarcopenia was higher in women than in men: A cross-sectional study from a rural area in eastern China. PeerJ 2022, 10, e13678. [Google Scholar] [CrossRef] [PubMed]
- Brewis, A.A.; Han, S.Y.; SturtzSreetharan, C.L. Weight, gender, and depressive symptoms in South Korea. Am. J. Hum. Biol. 2017, 29, e22972. [Google Scholar] [CrossRef] [PubMed]
- Pike, K.M.; Hoek, H.W.; Dunne, P.E. Cultural trends and eating disorders. Curr. Opin. Psychiatr. 2014, 27, 436–442. [Google Scholar] [CrossRef]
- Schwekendiek, D.; Yeo, M.; Ulijaszek, S. On slimming pills, growth hormones, and plastic surgery: The socioeconomic value of the body in South Korea. In When Culture Impacts Health; Elsevier: Amsterdam, The Netherlands, 2013; pp. 141–153. [Google Scholar]
- Han, M. Body image dissatisfaction and eating disturbance among Korean college female students: Relationships to media exposure, upward comparison, and perceived reality. Commun. Stud. 2003, 54, 65–78. [Google Scholar] [CrossRef]
- Jung, J.; Lee, S.H. Cross-cultural comparisons of appearance self-schema, body image, self-esteem, and dieting behavior between Korean and US women. Fam. Consum. Sci. Res. J. 2006, 34, 350–365. [Google Scholar] [CrossRef]
- Yang, Y.S.; Han, B.D.; Han, K.; Jung, J.H.; Son, J.W.; Korean Soc Study, O. Obesity Fact Sheet in Korea, 2021: Trends in Obesity Prevalence and Obesity-Related Comorbidity Incidence Stratified by Age from 2009 to 2019. J. Obes. Metab. Syndr. 2022, 31, 169–177. [Google Scholar] [CrossRef] [PubMed]
- Krause, K.E.; McIntosh, E.I.; Vallis, L.A. Sarcopenia and predictors of the fat free mass index in community-dwelling and assisted-living older men and women. Gait Posture 2012, 35, 180–185. [Google Scholar] [CrossRef] [PubMed]
- Landi, F.; Liperoti, R.; Fusco, D.; Mastropaolo, S.; Quattrociocchi, D.; Proia, A.; Russo, A.; Bernabei, R.; Onder, G. Prevalence and Risk Factors of Sarcopenia Among Nursing Home Older Residents. J. Gerontol. Ser. A-Biol. Sci. Med. Sci. 2012, 67, 48–55. [Google Scholar] [CrossRef]
- Stoever, K.; Heber, A.; Eichberg, S.; Brixius, K. Sarcopenia and predictors of skeletal muscle mass in elderly men with and without obesity. Gerontol. Geriatr. Med. 2017, 3, 1–8. [Google Scholar] [CrossRef] [PubMed]
- Kwon, Y.N.; Yoon, S.S.; Lee, K.-H. Sarcopenic obesity in elderly Korean women: A nationwide cross-sectional study. J. Bone Metab. 2018, 25, 53. [Google Scholar] [CrossRef] [PubMed]
- Lee, S.Y.; Tung, H.H.; Liu, C.Y.; Chen, L.K. Physical Activity and Sarcopenia in the Geriatric Population: A Systematic Review. J. Am. Med. Dir. Assoc. 2018, 19, 378–383. [Google Scholar] [CrossRef]
- Meier, N.F.; Lee, D.C. Physical activity and sarcopenia in older adults. Aging Clin. Exp. Res. 2020, 32, 1675–1687. [Google Scholar] [CrossRef]
- Steffl, M.; Bohannon, R.W.; Sontakova, L.; Tufano, J.J.; Shiells, K.; Holmerova, I. Relationship between sarcopenia and physical activity in older people: A systematic review and meta-analysis. Clin. Interv. Aging 2017, 12, 835–845. [Google Scholar] [CrossRef]
- Blakeley, C.E.; Van Rompay, M.I.; Schultz, N.S.; Sacheck, J.M. Relationship between muscle strength and dyslipidemia, serum 25(OH)D, and weight status among diverse schoolchildren: A cross-sectional analysis. BMC Pediatr. 2018, 18, 23. [Google Scholar] [CrossRef]
- Grontved, A.; Ried-Larsen, M.; Moller, N.C.; Kristensen, P.L.; Froberg, K.; Brage, S.; Andersen, L.B. Muscle strength in youth and cardiovascular risk in young adulthood (the European Youth Heart Study). Br. J. Sports Med. 2015, 49, 90–94. [Google Scholar] [CrossRef] [PubMed]
- Wang, N.; Chen, M.J.; Fang, D.H. Relationship between serum triglyceride to high-density lipoprotein cholesterol ratio and sarcopenia occurrence rate in community-dwelling Chinese adults. Lipids Health Dis. 2020, 19, 248. [Google Scholar] [CrossRef] [PubMed]
Disclaimer/Publisher’s Note: The statements, opinions and data contained in all publications are solely those of the individual author(s) and contributor(s) and not of MDPI and/or the editor(s). MDPI and/or the editor(s) disclaim responsibility for any injury to people or property resulting from any ideas, methods, instructions or products referred to in the content. |
© 2024 by the author. Licensee MDPI, Basel, Switzerland. This article is an open access article distributed under the terms and conditions of the Creative Commons Attribution (CC BY) license (https://creativecommons.org/licenses/by/4.0/).