
DXA Android-to-Gynoid Ratio and Cardiovascular Risk Assessment in Age and BMI Propensity-Matched Early Postmenopausal Women

 , , , , and
Abstract
:1. Introduction
2. Materials and Methods
3. Results
4. Discussion
5. Conclusions
Author Contributions
Funding
Institutional Review Board Statement
Informed Consent Statement
Data Availability Statement
Acknowledgments
Conflicts of Interest
Abbreviations
References
- Weir, C.B.; Jan, A. BMI Classification Percentile and Cut Off Points. In StatPearls; StatPearls Publishing: Treasure Island, FL, USA, 2023. [Google Scholar]
- Fenton, A. Weight, Shape, and Body Composition Changes at Menopause. J. Midlife Health 2021, 12, 187–192. [Google Scholar] [CrossRef] [PubMed]
- Ambikairajah, A.; Walsh, E.; Tabatabaei-Jafari, H.; Cherbuin, N. Fat mass changes during menopause: A metaanalysis. Am. J. Obstet. Gynecol. 2019, 221, 393–409.e50. [Google Scholar] [CrossRef]
- Karvonen-Gutierrez, C.; Kim, C. Association of Mid-Life Changes in Body Size, Body Composition and Obesity Status with the Menopausal Transition. Healthcare 2016, 4, 42. [Google Scholar] [CrossRef] [PubMed]
- Kuriyan, R. Body composition techniques. Indian J. Med. Res. 2018, 148, 648–658. [Google Scholar] [CrossRef] [PubMed]
- Shepherd, J.A.; Ng, B.K.; Sommer, M.J.; Heymsfield, S.B. Body composition by DXA. Bone 2017, 104, 101–105. [Google Scholar] [CrossRef] [PubMed]
- Lee, B.J.; Yim, M.H. Comparison of anthropometric and body composition indices in the identification of metabolic risk factors. Sci. Rep. 2021, 11, 9931. [Google Scholar] [CrossRef] [PubMed]
- Goldstein, S.R.; Hirsch, J.; Oh, C.; Nachtigall, L. DXA assessment of adiposity is a better predictor of metabolic risk than BMI. In The North American Menopause Society Annual Meeting; Poster P-80; Lippincott Williams & Wilkins: Las Vegas, NV, USA, 2015. [Google Scholar]
- Blouin, K.; Boivin, A.; Tchernof, A. Androgens and body fat distribution. J. Steroid Biochem. Mol. Biol. 2008, 108, 272–280. [Google Scholar] [CrossRef] [PubMed]
- Peppa, M.; Koliaki, C.; Hadjidakis, D.I.; Garoflos, E.; Papaefstathiou, A.; Katsilambros, N.; Raptis, S.A.; Dimitriadis, G.D. Regional fat distribution and cardiometabolic risk in healthy postmenopausal women. Eur. J. Intern. Med. 2013, 24, 824–831. [Google Scholar] [CrossRef]
- Okosun, I.S.; Seale, J.P.; Lyn, R. Commingling effect of gynoid and android fat patterns on cardiometabolic dysregulation in normal weight American adults. Nutr. Diabetes 2015, 5, e155. [Google Scholar] [CrossRef]
- Dehghan, A.; Vasan, S.K.; Fielding, B.A.; Karpe, F. A prospective study of the relationships between change in body composition and cardiovascular risk factors across the menopause. Menopause 2021, 28, 400–406. [Google Scholar] [CrossRef]
- Ward, L.C. Bioelectricasl impedance analysis for body composition assessment: Reflections on accuracy, clinical utility, and standardization. Eur. J. Clin. Nutr. 2019, 73, 194–199. [Google Scholar] [CrossRef] [PubMed]
- Czartoryski, P.; Garcia, J.; Manimaleth, R.; Napolitano, P.; Watters, H.; Weber, C.; Alvarez-Beaton, A.; Nieto, A.C.; Patel, A.; Peacock, C.; et al. Body composition assessment: A comparison of the DXA, InBody 270, and Omron. JEN 2020, 3, 1–6. [Google Scholar]
- Zhu, D.; Chung, H.F.; Pandeya, N.; Dobson, A.J.; Kuh, D.; Crawford, S.L.; Gold, E.B.; Avis, N.E.; Giles, G.G.; Bruinsma, F.; et al. Body mass index and age at natural menopause: An international pooled analysis of 11 propective studies. Eur. J. Epidemiol. 2018, 33, 699–710. [Google Scholar] [CrossRef] [PubMed]
- Erdélyi, A.; Pálfi, E.; Tűű, L.; Nas, K.; Szűcs, Z.; Török, M.; Jakab, A.; Várbíró, S. The importance of nutrition in menopause and perimenopause–a review. Nutrients 2023, 16, 27. [Google Scholar] [CrossRef] [PubMed]
- Trémollieres, F.A.; Pouilles, J.M.; Ribot, C.A. Relative influence of age and menopause on total and regional body composition changes in postmenopausal women. Am. J. Obstet. Gynecol. 1996, 175, 1594–1600. [Google Scholar] [CrossRef] [PubMed]
- Toth, M.J.; Tchernof, A.; Sites, C.K.; Poehlman, E.T. Menopause-related changes in body fat distribution. Ann. N. Y. Acad. Sci. 2000, 904, 502–506. [Google Scholar] [CrossRef]
- Douchi, T.; Yamamoto, S.; Yoshimitsu, N.; Andoh, T.; Matsuo, T.; Nagata, Y. Relative contribution of aging and menopause to changes in lean and fat mass in segmental regions. Maturitas 2002, 42, 301–306. [Google Scholar] [CrossRef]
- Goff, D.C.; Lloyd-Jones, D.M.; Bennett, G.; Coady, S.; D’Agostino, R.B.; Gibbons, R.; Greenland, P.; Lackland, D.T.; Levy, D.; O’Donnell, C.J.; et al. 2013 ACC/AHA guideline on the assessment of cardiovascular risk: A report of the American College of Cardiology/American Heart Association Task Force on Practice Guidelines. Circulation 2014, 129 (Suppl. S2), S49–S73, Erratum in Circulation. 2014, 129 (Suppl. S2), S74–S75. [Google Scholar] [CrossRef] [PubMed]
- Bibbins-Domingo, K.; Grossman, D.C.; Curry, S.J.; Davidson, K.W.; Epling, J.W.; García, F.A.; Gillman, M.W.; Kemper, A.R.; Krist, A.H.; Kurth, A.E.; et al. Statin Use for the Primary Prevention of Cardiovascular Disease in Adults: US Preventive Services Task Force Recommendation Statement [published correction appears in JAMA. JAMA 2016, 316, 1997–2007, Erratum in JAMA 2020, 323, 669–670. [Google Scholar] [CrossRef]
- ASCVD 2013 Risk Calculator from AHA/ACC. 2013. Available online: https://www.mdcalc.com/calc/3398/ascvd-atherosclerotic-cardiovascular-disease-2013-risk-calculator-aha-acc (accessed on 7 May 2024).
- Palacios, S.; Henderson, V.W.; Siseles, N.; Tan, D.; Villaseca, P. Age of menopause and impact of climacteric symptoms by geographical region. Climacteric 2010, 13, 419–428. [Google Scholar] [CrossRef]
- Kevenaar, M.E.; Themmen, A.P.; Rivadeneira, F.; Uitterlinden, A.G.; Laven, J.S.; van Schoor, N.M.; Lips, P.; Pols, H.A.; Visser, J.A. A polymorphism in the AMH type II receptor gene is associated with age at menopause in interaction with parity. Hum. Reprod. 2007, 22, 2382–2388. [Google Scholar] [CrossRef] [PubMed]
- Voorhuis, M.; Onland-Moret, N.C.; van der Schouw, Y.T.; Fauser, B.C.; Broekmans, F.J. Human studies on genetics of the age at natural menopause: A systematic review. Hum. Reprod. Update 2010, 16, 364–377. [Google Scholar] [CrossRef]
- Harlow, S.D.; Gass, M.; Hall, J.E.; Lobo, R.; Maki, P.; Rebar, R.W.; Sherman, S.; Sluss, P.M.; De Villiers, T.J.; STRAW+ 10 Collaborative Group. Executive summary of the Stages of Reproductive Aging Workshop +10: Addressing the unfinished agenda of staging reproductive aging. Climacteric 2012, 15, 105–114. [Google Scholar] [CrossRef]
- Dorjgochoo, T.; Kallianpur, A.; Gao, Y.T.; Cai, H.; Yang, G.; Li, H.; Zheng, W.; Shu, X.O. Dietary and lifestyle predictors of age at natural menopause and reproductive span in the Shanghai Women’s Health Study. Menopause 2008, 15, 924–933. [Google Scholar] [CrossRef]
- Schoenaker, D.A.; Jackson, C.A.; Rowlands, J.V.; Mishra, G.D. Socioeconomic position, lifestyle factors and age at natural menopause: A systematic review and meta-analyses of studies across six continents. Int. J. Epidemiol. 2014, 43, 1542–1562. [Google Scholar] [CrossRef] [PubMed]
- Leidy, L.E. Timing of menopause in relation to body size and weight change. Hum. Biol. 1996, 68, 967–982. [Google Scholar] [PubMed]
- Ciubean, A.D.; Ungur, R.A.; Irsay, L.; Ciortea, V.M.; Borda, I.M.; Onac, I.; Vesa, S.C.; Buzoianu, A.D. Health-related quality of life in Romanian postmenopausal women with osteoporosis and fragility fractures. Clin. Interv. Aging 2018, 13, 2465–2472. [Google Scholar] [CrossRef]
- Salpeter, S.R.; Walsh, J.M.; Ormiston, T.M.; Greyber, E.; Buckley, N.S.; Salpeter, E.E. Meta-analysis: Effect of hormone-replacement therapy on components of the metabolic syndrome in postmenopausal women. Diabetes Obes. Metab. 2006, 8, 538–554. [Google Scholar] [CrossRef]
- Bednarek-Tupikowska, G.; Filus, A.; Kuliczkowska-Płaksej, J.; Tupikowski, K.; Bohdanowicz-Pawlak, A.; Milewicz, A. Serum leptin concentrations in pre- and postmenopausal women on sex hormone therapy. Gynecol. Endocrinol. 2006, 22, 207–212. [Google Scholar] [CrossRef]
- Bell, R.J.; Davison, S.L.; Papalia, M.A.; McKenzie, D.P.; Davis, S.R. Endogenous androgen levels and cardiovascular risk profile in women across the adult life span. Menopause 2007, 14, 630–638. [Google Scholar] [CrossRef]
- Greendale, G.A.; Sternfeld, B.; Huang, M.; Han, W.; Karvonen-Gutierrez, C.; Ruppert, K.; Cauley, J.A.; Finkelstein, J.S.; Jiang, S.F.; Karlamangla, A.S. Changes in body composition and weight during the menopause transition. JCI Insight 2019, 4, e124865. [Google Scholar] [CrossRef] [PubMed]
- Cao, Y.; Zhang, S.; Zou, S.; Xia, X. The relationship between endogenous androgens and body fat distribution in early and late postmenopausal women. PLoS ONE 2013, 8, e58448, Erratum in PLoS ONE 2013, 8. [Google Scholar] [CrossRef] [PubMed]
- Kapoor, E.; Collazo-Clavell, M.L.; Faubion, S.S. Weight Gain in Women at Midlife: A Concise Review of the Pathophysiology and Strategies for Management. Mayo Clin. Proc. 2017, 92, 1552–1558. [Google Scholar] [CrossRef] [PubMed]
- Stamatelopoulos, K.; Apostolakis, M.; Augoulea, A.; Paschou, S.A.; Armeni, E.; Panoulis, K.; Bakas, P.; Georgiopoulos, G.; Kaparos, G.; Rizos, D.; et al. Predictors of incident hypertension in healthy non-diabetic postmenopausal women with normal renal function. Gynecol. Endocrinol. 2019, 35, 1063–1066. [Google Scholar] [CrossRef]
- Wietlisbach, V.; Marques-Vidal, P.; Kuulasmaa, K.; Karvanen, J.; Paccaud, F.; WHO MONICA Project. The relation of body mass index and abdominal adiposity with dyslipidemia in 27 general populations of the WHO MONICA Project. Nutr. Metab. Cardiovasc. Dis. 2013, 23, 432–442. [Google Scholar] [CrossRef] [PubMed]
- Ma, W.; Zhu, H.; Yu, X.; Zhai, X.; Li, S.; Huang, N.; Liu, K.; Shirai, K.; Sheerah, H.A.; Cao, J. Association between android fat mass, gynoid fat mass and cardiovascular and all-cause mortality in adults: NHANES 2003-2007. Front. Cardiovasc. Med. 2023, 10, 1055223. [Google Scholar] [CrossRef] [PubMed]
- Aggarwal, B.; Scaccia, S.; Davis, E.; Kodoth, V.; Liu, S.; Wummer, B.; Sun, Y. Associations Between Body Composition, Diet, And CVD Risk Markers Among Women During The Menopausal Transition: Findings From The AHA Research Goes Red Women’s Health Registry. Circulation 2022, 145 (Suppl. S1), AP061. [Google Scholar] [CrossRef]


| First 5 Years of MP (N = 90) | Years 5–10 of MP (N = 90) | Sig | |
|---|---|---|---|
| Age | 53.53 ± 2.56 | 53.44 ± 2.48 | 0.811 |
| Age at FMP | 50.06 ± 2.63 | 46.07 ± 2.86 | <0.001 |
| Years of Estrogen Exposure | 37 (3) | 32.5 (4) | <0.001 |
| Years of MP | 3.55 (1.8) | 7.15 (2.7) | <0.001 |
| BMI (kg/m2) | 27.79 ± 4.12 | 28.03 ± 3.83 | 0.692 |
| Total Body Fat % | 45.9 (6.4) | 47.25 (7.2) | 0.086 |
| Android Fat % | 47.8 (10.6) | 50 (7.4) | 0.180 |
| Gynoid Fat % | 46.5 (4.8) | 47.3 (6.3) | 0.371 |
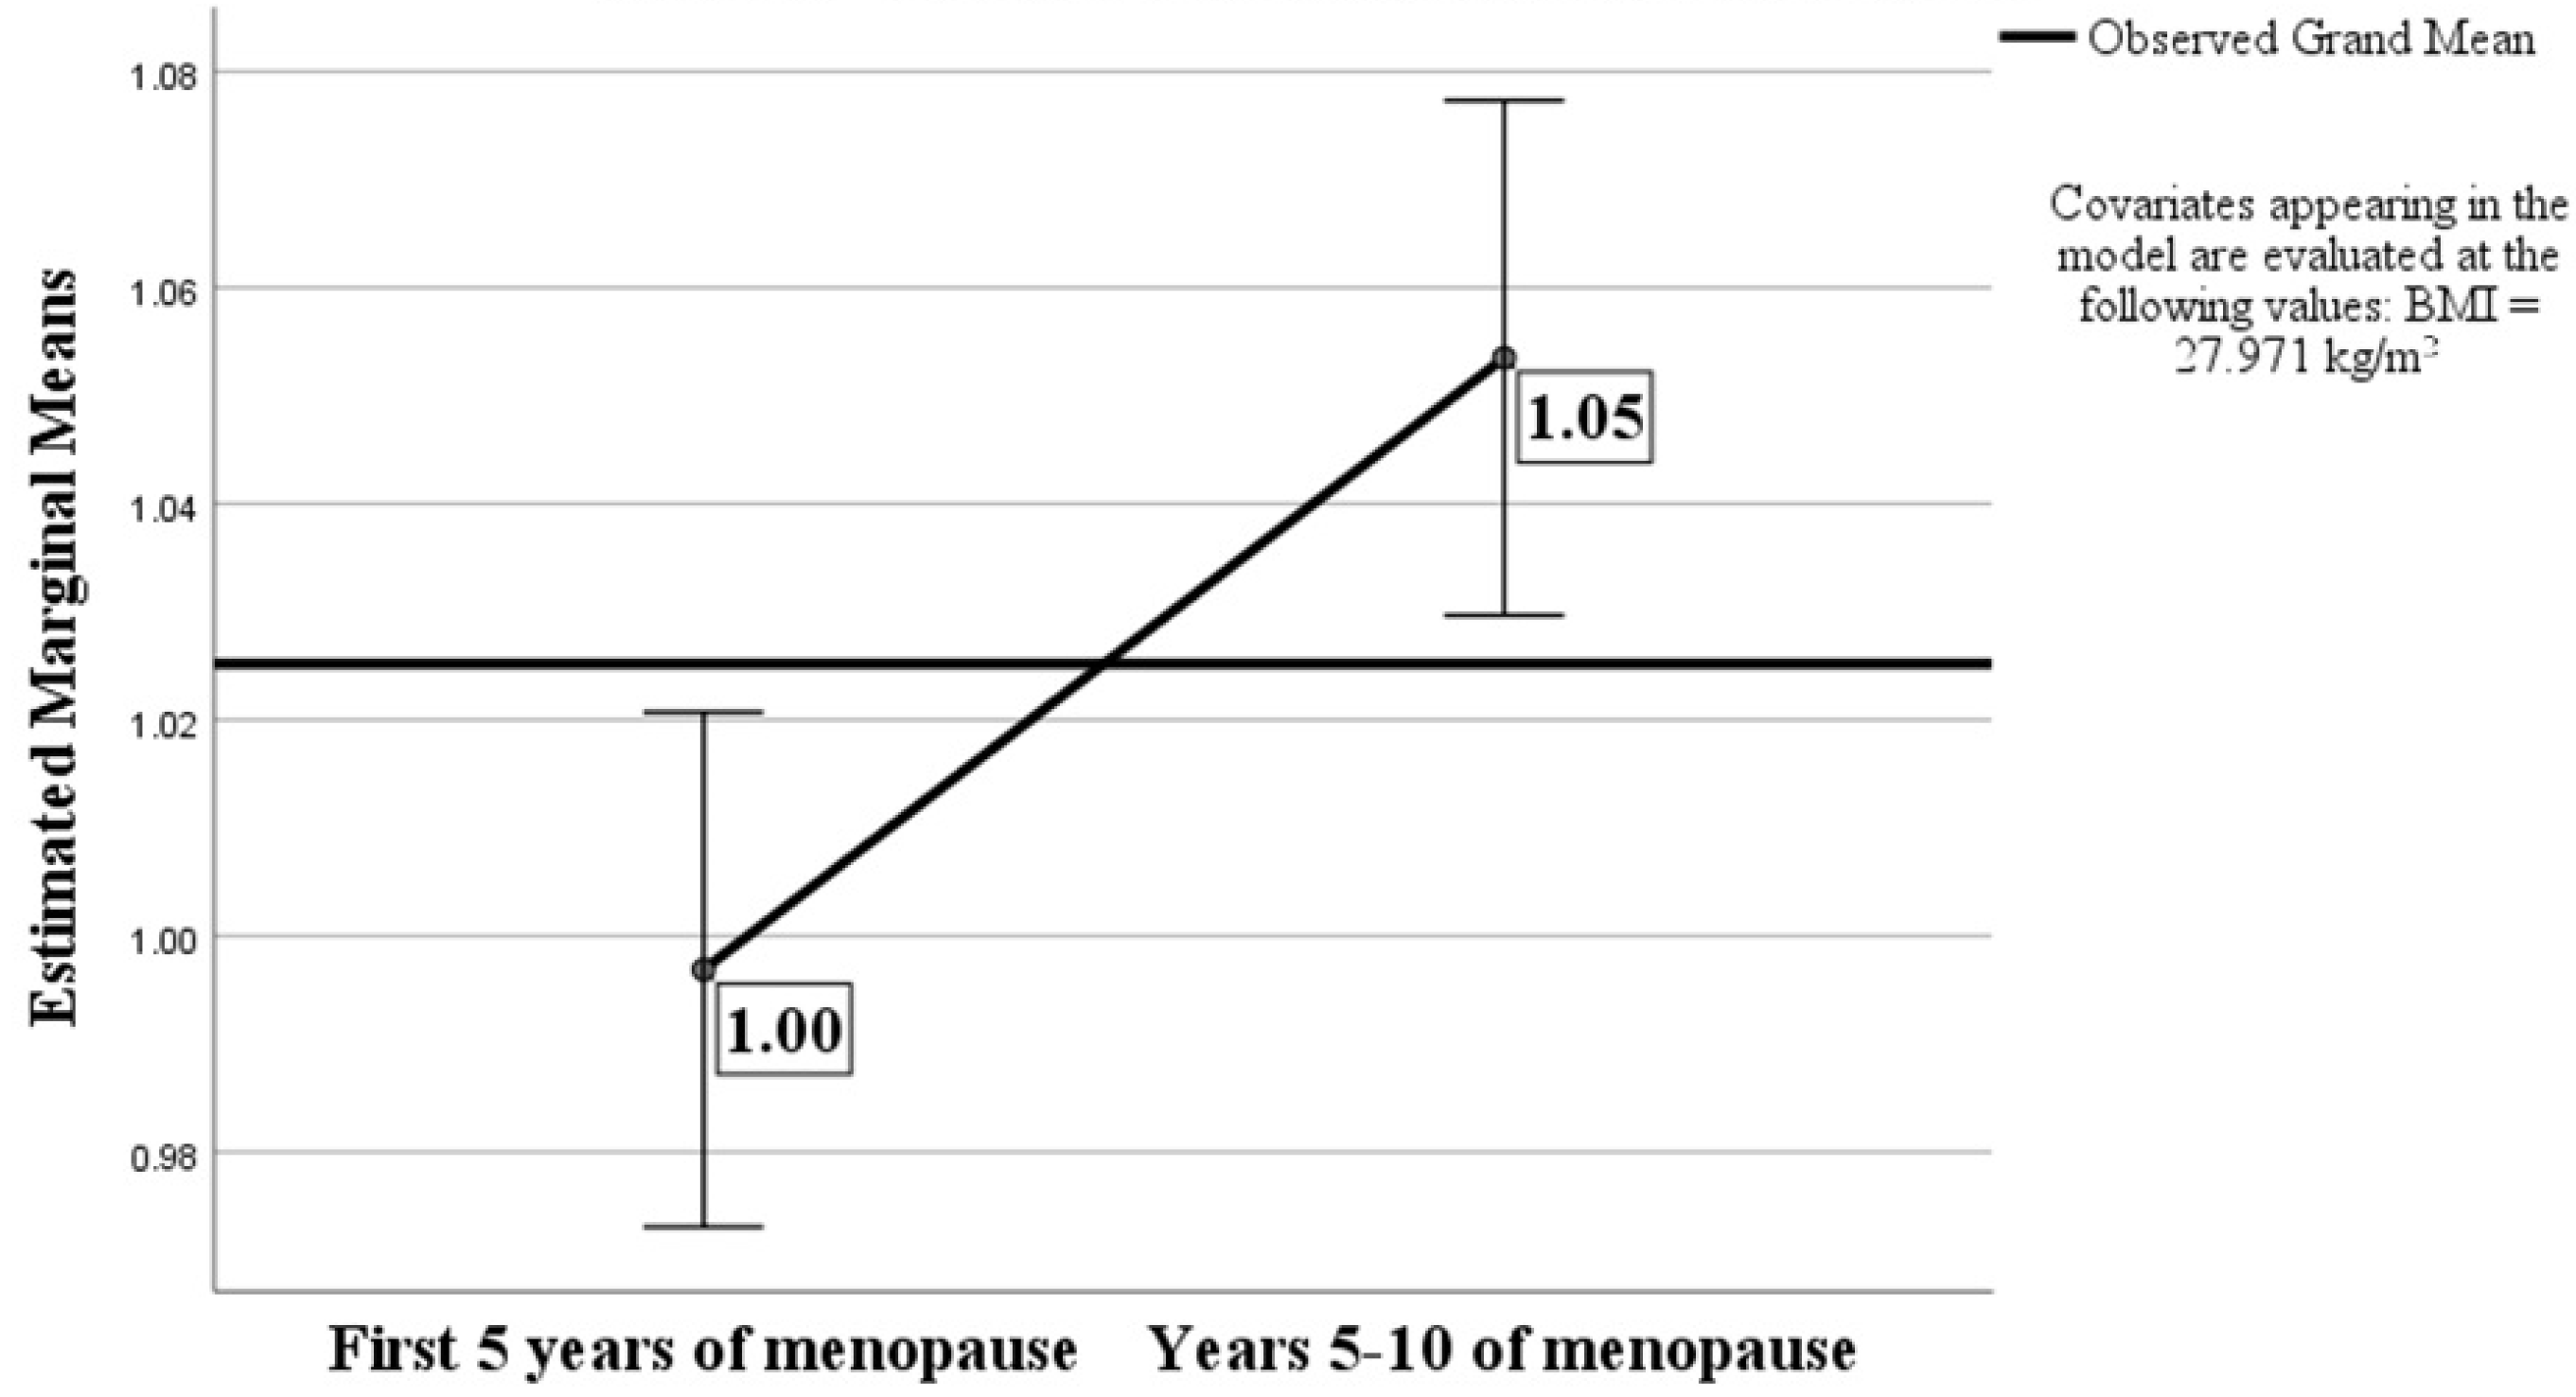
| A/G Ratio | 0.99 ± 0.13 | 1.05 ± 0.11 | 0.001 |
| First 5 Years of MP (N = 90) | Years 5–10 of MP (N = 90) | Sig | |
|---|---|---|---|
| HTN treatment (%) | 30/90 (33.3%) | 31/90 (35.5%) | 1.000 |
| Diagnosis of T2DM (%) | 8/90 (8.9%) | 6/90 (6.7%) | 0.650 |
| Statin treatment (%) | 24/90 (26.7%) | 20/90 (22.2%) | 0.603 |
| Serum total cholesterol (mg/dL) | 207 (54) | 226 (62) | 0.019 |
| Serum HDL cholesterol (mg/dL) | 57 (17) | 54.5 (15.25) | 0.527 |
| Serum LDL cholesterol (mg/dL) | 131.6 (46.8) | 140.4 (55.1) | 0.132 |
| Serum triglycerides (mg/dL) | 87 (58) | 97 (59.25) | 0.214 |
| 10-year ASCVD risk (%) | 2.95 (2.5) | 2.7 (2.41) | 0.340 |
| HTN treatment (%) | 30/90 (33.3%) | 31/90 (35.5%) | 1.000 |
Disclaimer/Publisher’s Note: The statements, opinions and data contained in all publications are solely those of the individual author(s) and contributor(s) and not of MDPI and/or the editor(s). MDPI and/or the editor(s) disclaim responsibility for any injury to people or property resulting from any ideas, methods, instructions or products referred to in the content. |
© 2024 by the authors. Licensee MDPI, Basel, Switzerland. This article is an open access article distributed under the terms and conditions of the Creative Commons Attribution (CC BY) license (https://creativecommons.org/licenses/by/4.0/).
Share and Cite
Nistor, I.M.; Fica, S.; Martin, S.C.; Mustata, T.; Oprea, T.E.; Sirbu, A.E.; Barbu, C.G. DXA Android-to-Gynoid Ratio and Cardiovascular Risk Assessment in Age and BMI Propensity-Matched Early Postmenopausal Women. Medicina 2024, 60, 1096. https://doi.org/10.3390/medicina60071096
Nistor IM, Fica S, Martin SC, Mustata T, Oprea TE, Sirbu AE, Barbu CG. DXA Android-to-Gynoid Ratio and Cardiovascular Risk Assessment in Age and BMI Propensity-Matched Early Postmenopausal Women. Medicina. 2024; 60(7):1096. https://doi.org/10.3390/medicina60071096
Chicago/Turabian StyleNistor, Irina Manuela, Simona Fica, Sorina Carmen Martin, Theodor Mustata, Theodor Eugen Oprea, Anca Elena Sirbu, and Carmen Gabriela Barbu. 2024. "DXA Android-to-Gynoid Ratio and Cardiovascular Risk Assessment in Age and BMI Propensity-Matched Early Postmenopausal Women" Medicina 60, no. 7: 1096. https://doi.org/10.3390/medicina60071096