
Intracoronary Imaging for Changing Therapeutic Decisions in Patients with Multivascular Coronary Artery Disease


Abstract
1. Introduction
2. Materials and Methods
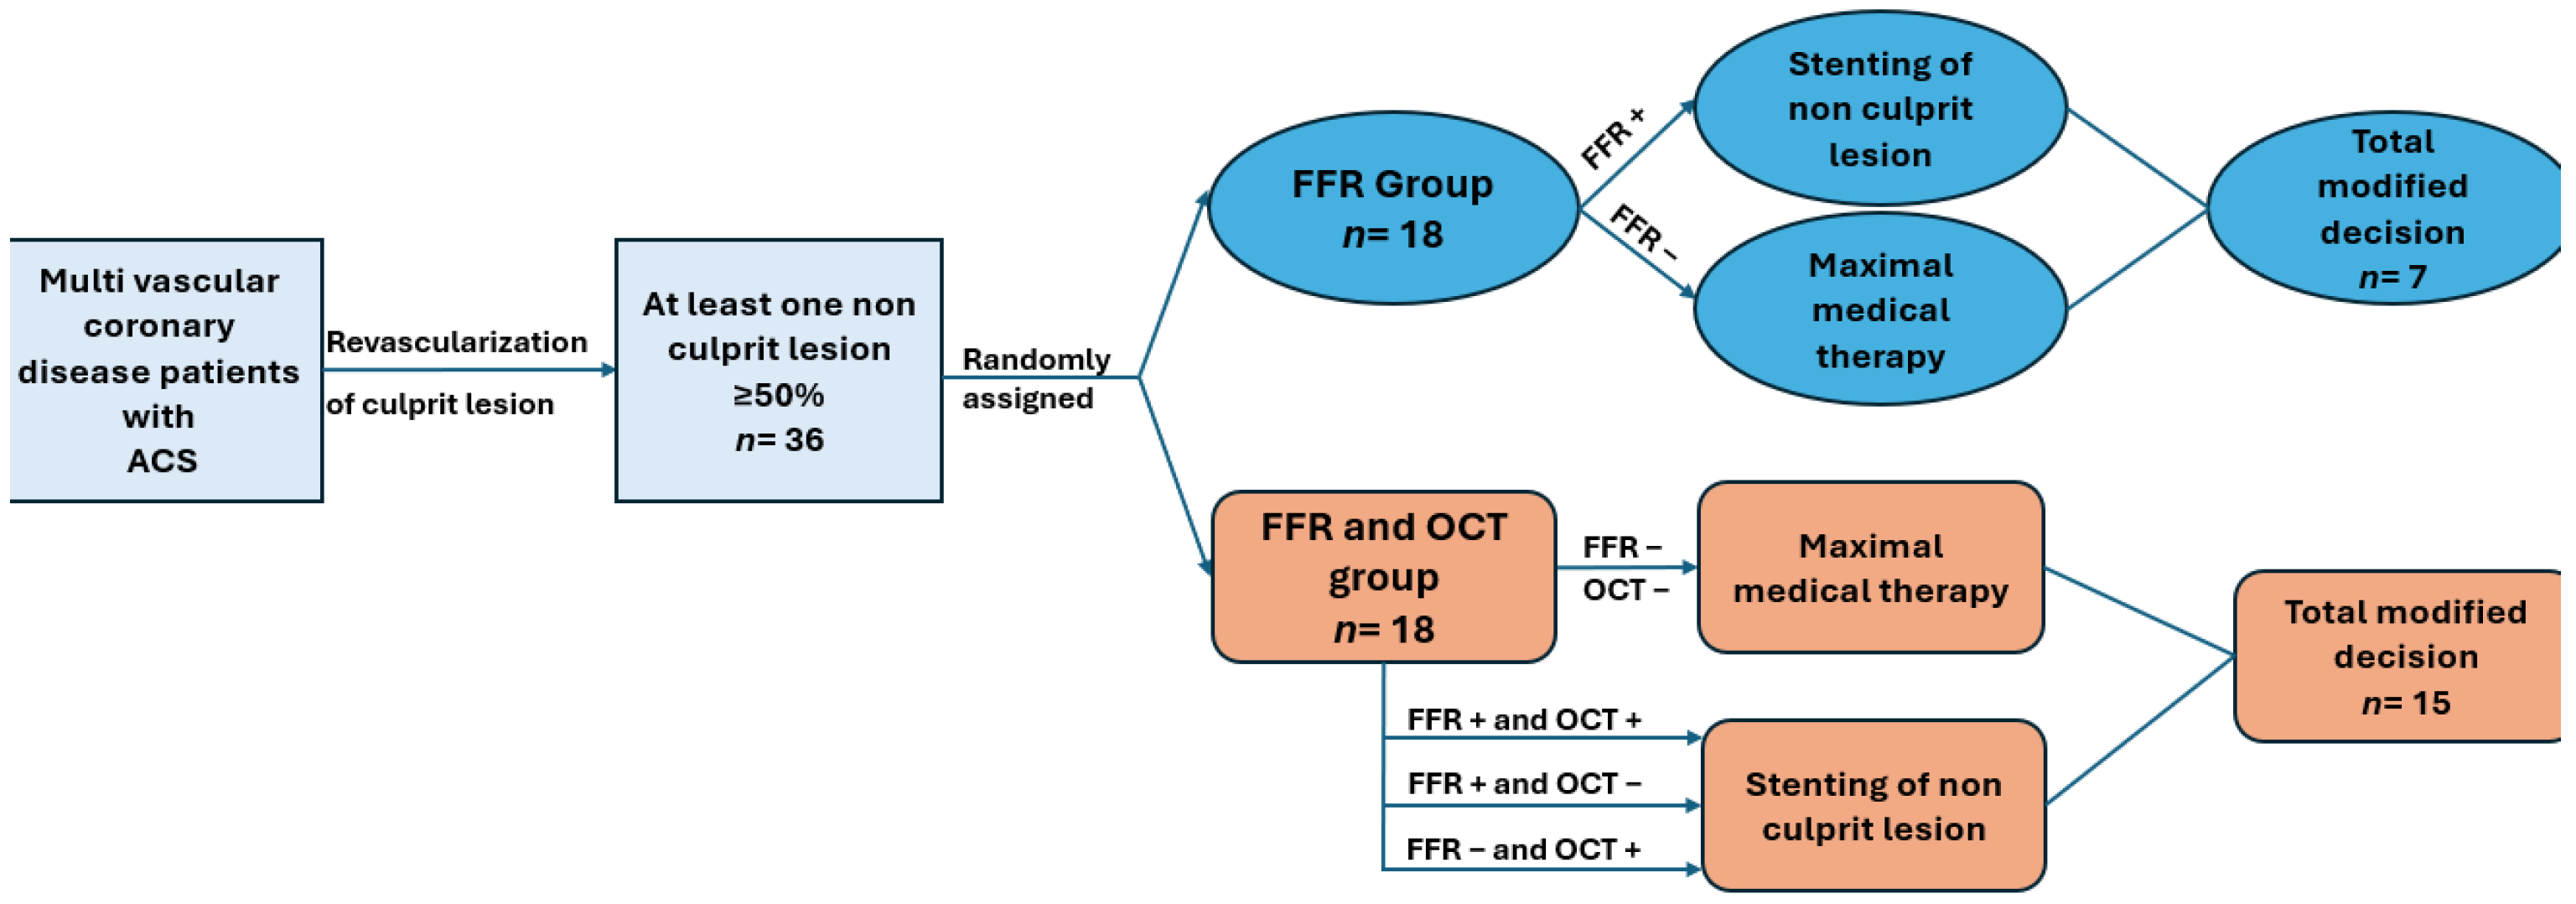
2.1. Study Population
2.2. Methodology
2.3. Procedures
2.4. Urgent Coronary Angiography
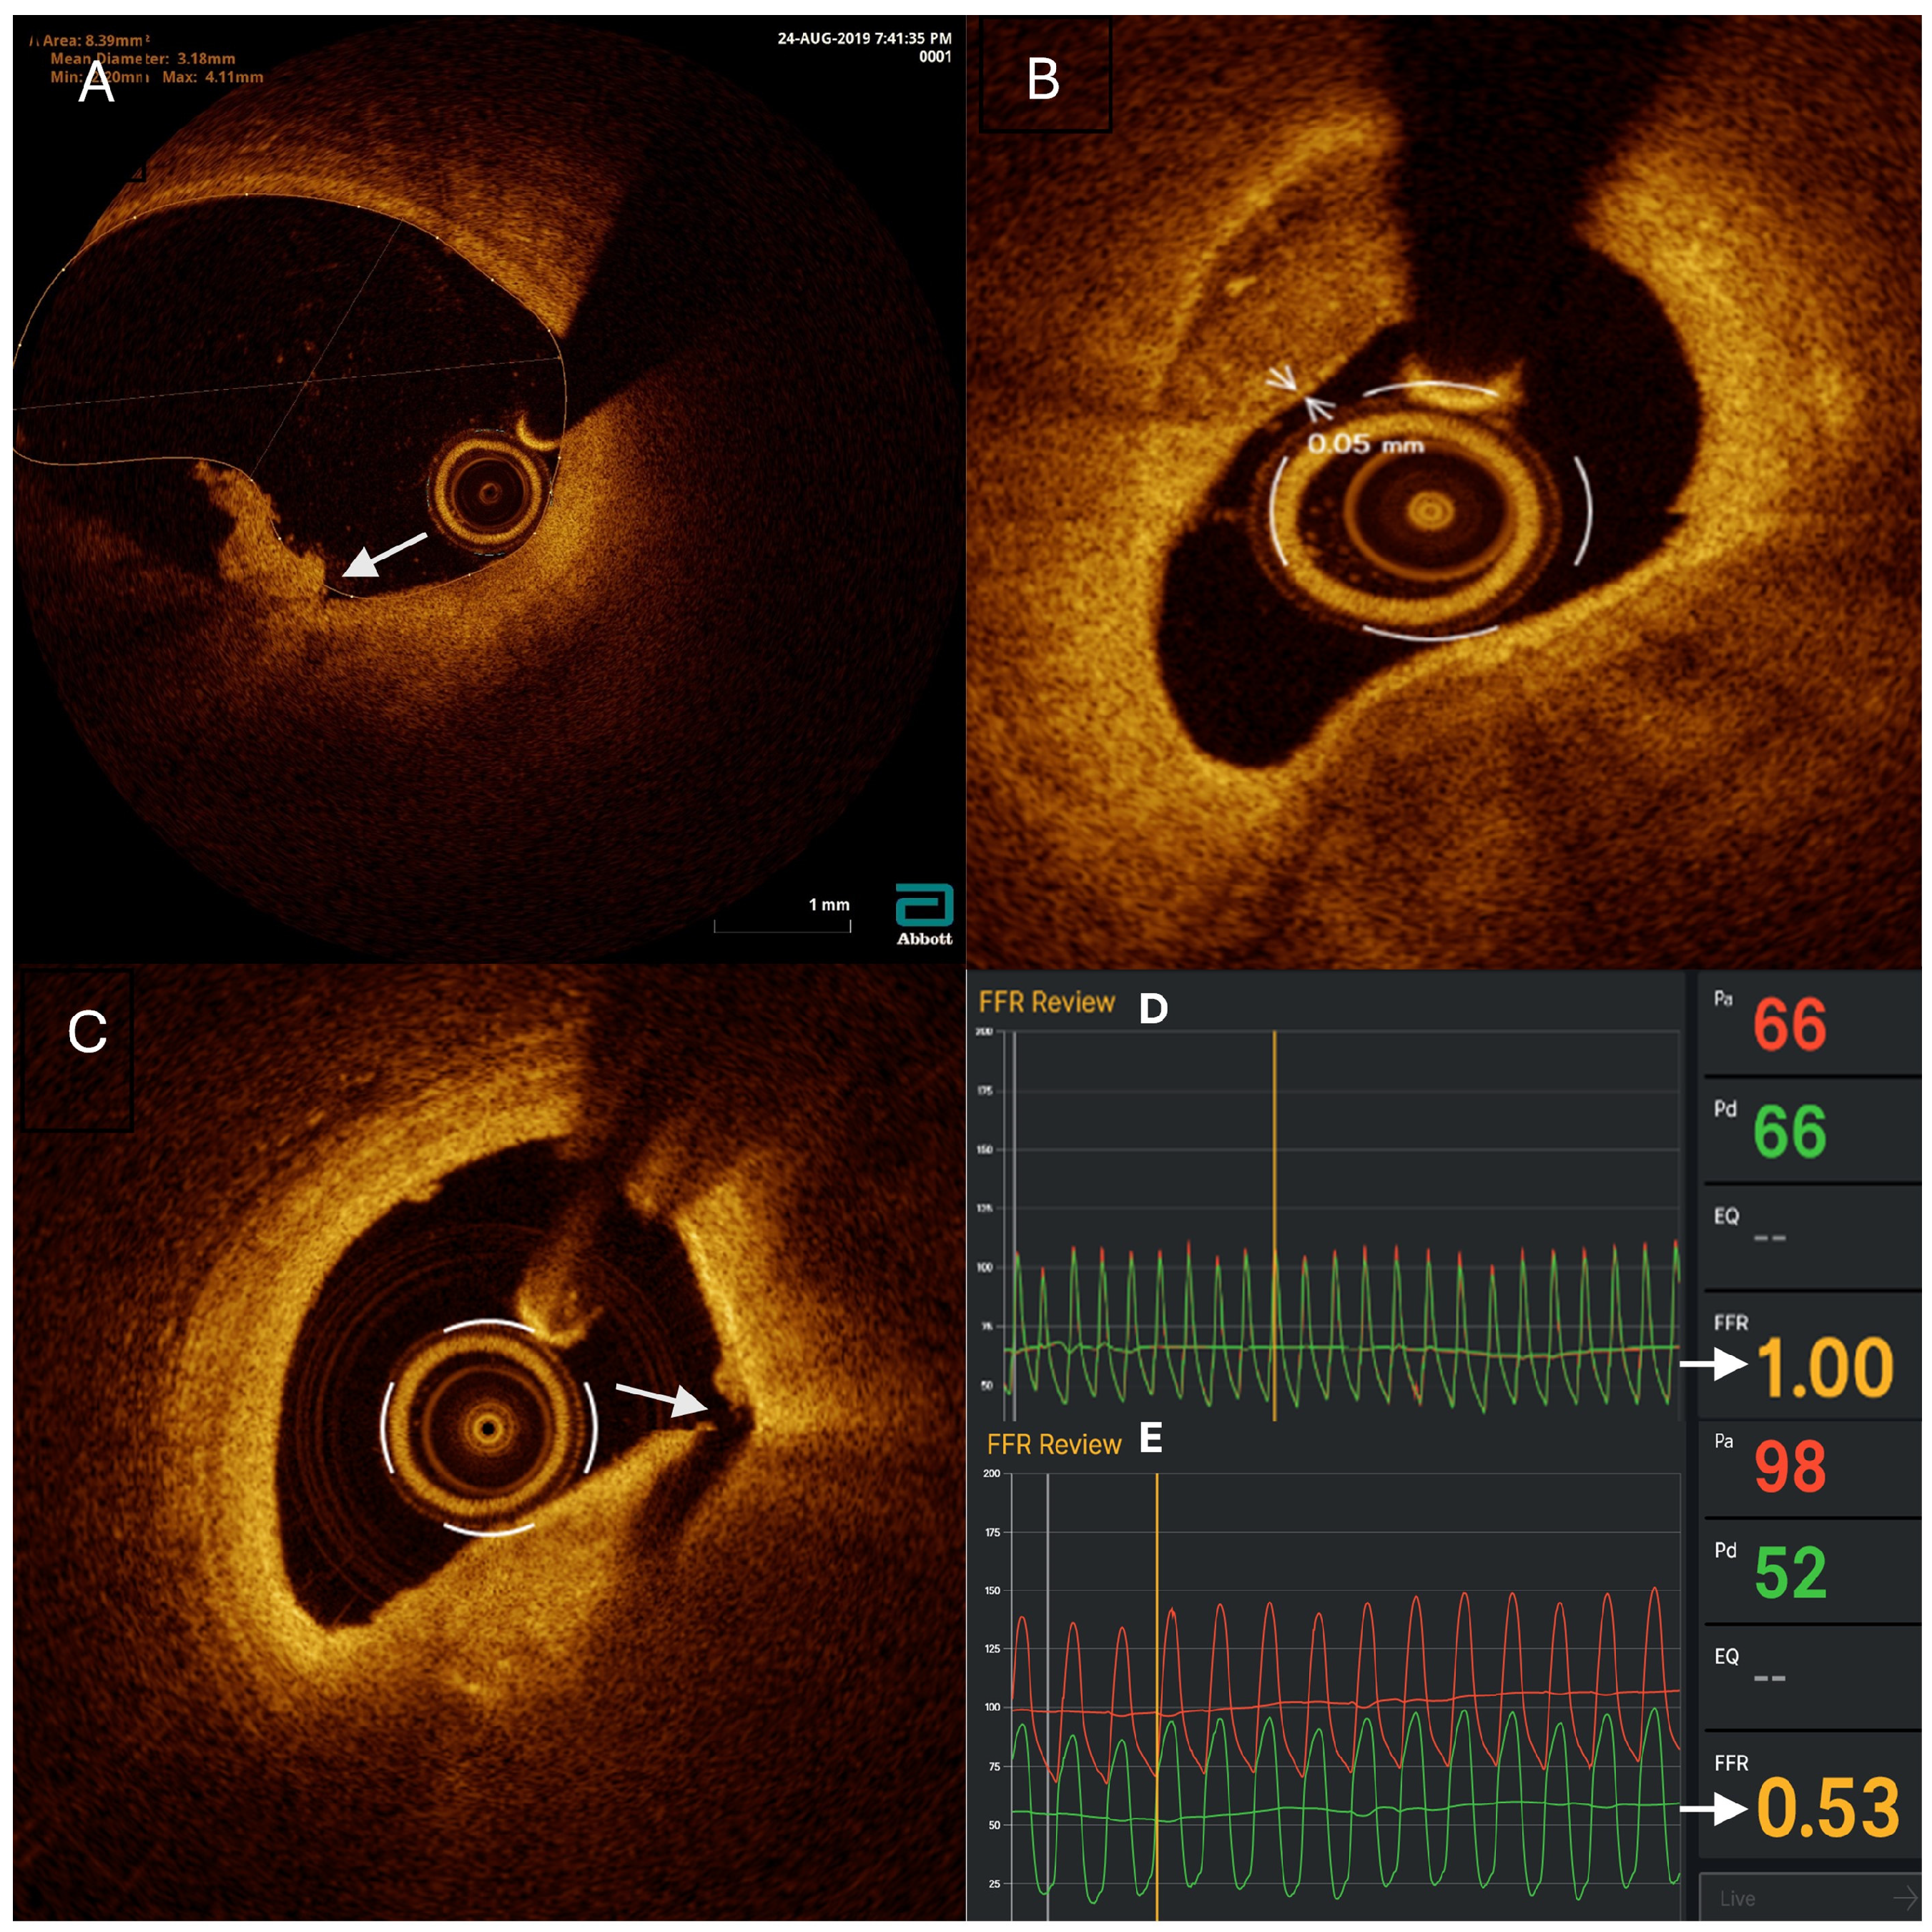
2.5. FFR Measurements
2.6. OCT Imaging
2.7. The Decision for Revascularization
2.8. Postrevascularization Procedures
2.9. Statistical Analysis
2.10. Ethics
3. Results
3.1. Plaque Characteristics of Non-Culprit Lesions
3.2. Figures, Tables, and Schemes
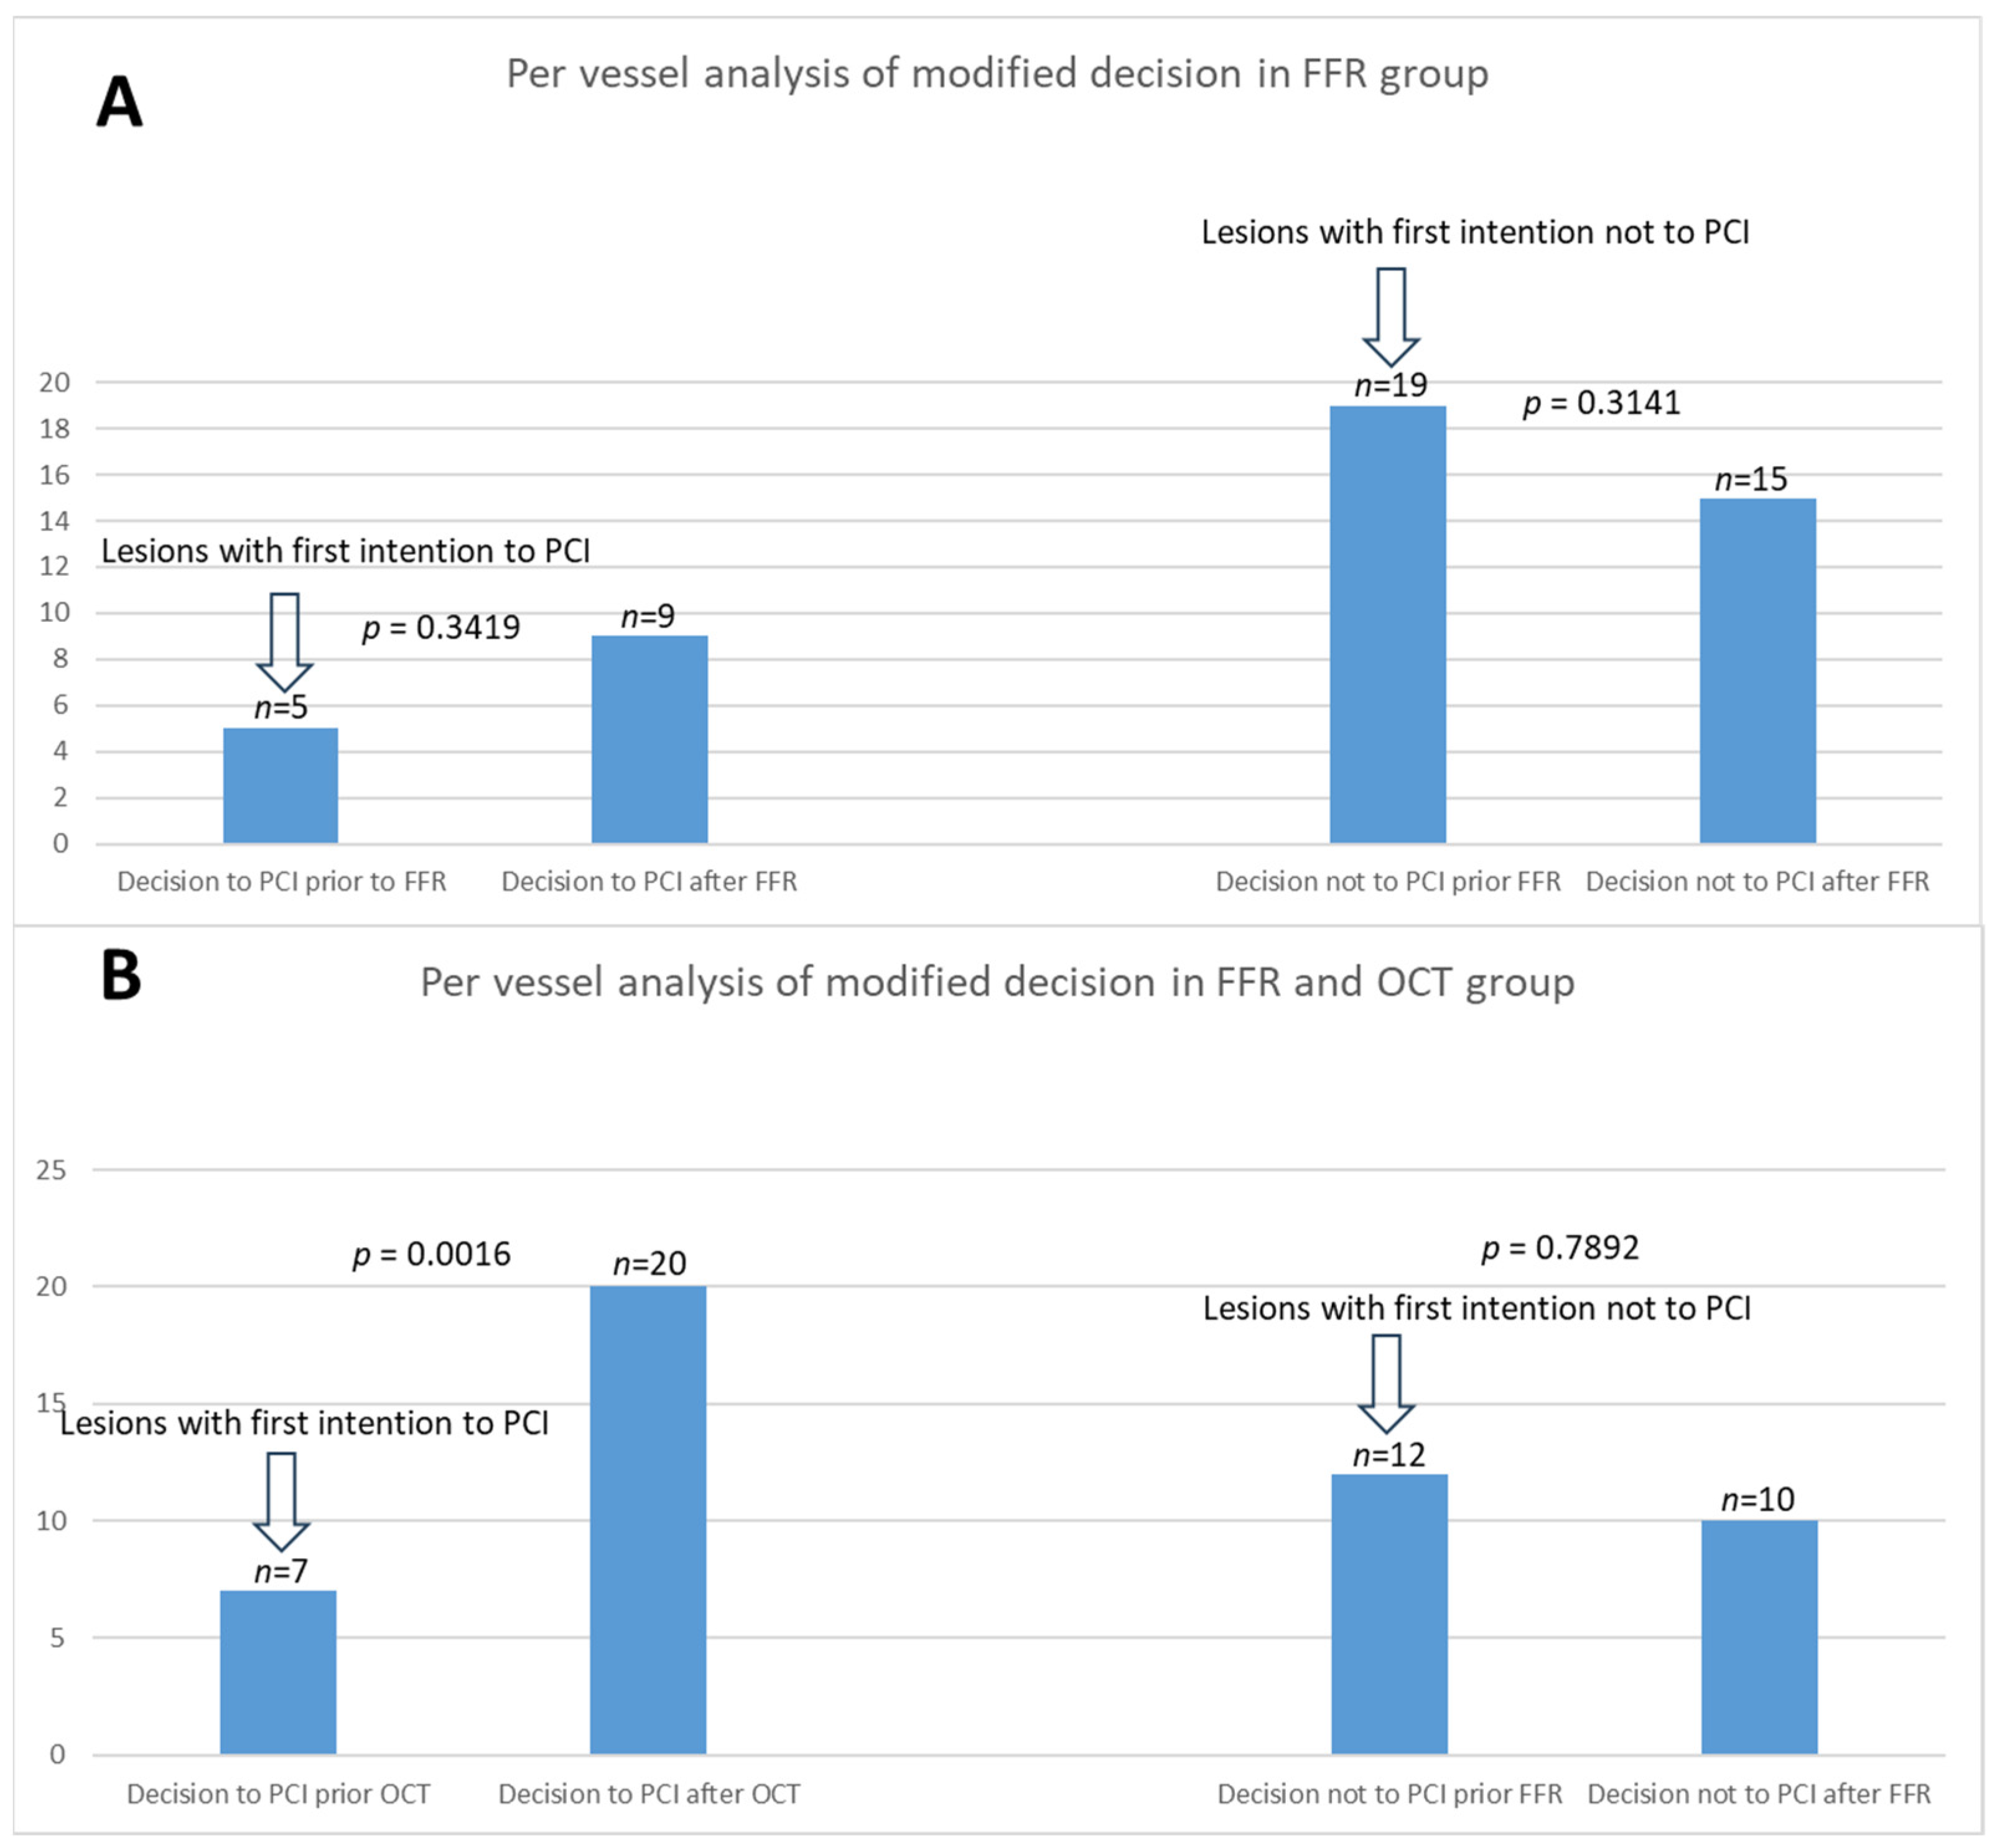
3.3. Per-Vessel Analysis
4. Discussion
4.1. Integration of OCT in Clinical Decision-Making and Its Impact on Patient Outcomes
4.2. Importance of Plaque Vulnerability Assessment
4.3. Study Limitations
5. Conclusions
Author Contributions
Funding
Institutional Review Board Statement
Informed Consent Statement
Data Availability Statement
Conflicts of Interest
List of Symbols
| ACS | Acute coronary syndrome |
| CABG | Coronary artery bypass grafting |
| CAD | Coronary artery disease |
| ECG | Electrocardiogram |
| FFR | Fractional flow reserve |
| IVUS | Intravascular ultrasound |
| LAD | Anterior descending coronary artery |
| LCX | Circumflex artery |
| NS | Non-significant |
| MVD | Multivessel disease |
| NSTEMI | Non-ST-segment elevation myocardial infarction |
| OCT | Optical coherence tomography |
| Pa | Aortic pressure |
| PCI | Percutaneous coronary intervention |
| Pd | Pressure distal to a coronary stenosis |
| Pd/Pa | Ratio of the pressure distal to coronary stenosis to the aortic pressure |
| PR | Plaque rupture |
| RCA | Right coronary artery |
| RFR | Resting Full-cycle Ratio |
| STEMI | ST-segment elevation myocardial infarction |
| TCFA | Thin-cap fibroatheroma |
| UA | Unstable angina |
| VP | Vulnerable plaques |
References
- Mátyás, B.B.; Blîndu, E.; Rat, N.; Kovács, I.; Buicu, C.F.; Benedek, T. A Race Against Time: Coronary Computed Tomography Angiography Discovers a Highly Inflamed Plaque in 49-Year-Old Right Before STEMI. J. Cardiol. Cardiovasc. Ther. 2023, 10, 123–130. [Google Scholar] [CrossRef]
- Kennedy, M.W.; Fabris, E.; Ijsselmuiden, A.J.; Nef, H.; Reith, S.; Escaned, J.; Alfonso, F.; van Royen, N.; Wojakowski, W.; Witkowski, A.; et al. Combined optical coherence tomography morphologic and fractional flow reserve hemodynamic assessment of non- culprit lesions to better predict adverse event outcomes in diabetes mellitus patients: COMBINE (OCT-FFR) prospective study. Rationale and design. Cardiovasc. Diabetol. 2016, 15, 144. [Google Scholar] [CrossRef] [PubMed] [PubMed Central]
- Kedhi, E.; Berta, B.; Roleder, T.; Hermanides, R.S.; Fabris, E.; IJsselmuiden, A.J.; Kauer, F.; Alfonso, F.; von Birgelen, C.; Escaned, J.; et al. Thin-cap fibroatheroma predicts clinical events in diabetic patients with normal fractional flow reserve: The COMBINE OCT–FFR trial. Eur. Heart J. 2021, 42, 4671–4679. [Google Scholar] [CrossRef] [PubMed]
- Sinclair, H.; Bourantas, C.; Bagnall, A.; Mintz, G.S.; Kunadian, V. OCT for the Identification of Vulnerable Plaque in Acute Coronary Syndrome. J. Am. Coll. Cardiol. Img. 2015, 8, 198–209. [Google Scholar] [CrossRef] [PubMed]
- Blîndu, E.; Benedek, I.; Rodean, I.P.; Halațiu, V.B.; Raț, N.; Țolescu, C.; Mihăilă, T.; Roșca, A.; Mátyás, B.B.; Szabó, E.; et al. Regional Differences in the Level of Inflammation Between the Right and Left Coronary Arteries—A Coronary Computed Tomography Angiography Study of Epicardial Fat Attenuation Index in Four Scenarios of Cardiovascular Emergencies. J. Cardiol. Cardiovasc. Ther. 2023, 11, 45–54. [Google Scholar] [CrossRef]
- Bech, G.J.W.; De Bruyne, B.; Pijls, N.H.; De Muinck, E.D.; Hoorntje, J.C.; Escaned, J.; Stella, P.R.; Boersma, E.; Bartunek, J.; Koolen, J.J.; et al. Fractional flow reserve to determine the appropriateness of angioplasty in moderate coronary stenosis: A randomized trial. Circulation 2001, 103, 2928–2934. [Google Scholar] [CrossRef] [PubMed]
- Tonino, P.A.; De Bruyne, B.; Pijls, N.H.; Siebert, U.; Ikeno, F.; vant Veer, M.; Klauss, V.; Manoharan, G.; Engstrøm, T.; Oldroyd, K.G.; et al. Fractional flow reserve versus angiography for guiding percutaneous coronary intervention. N. Engl. J. Med. 2009, 360, 213–224. [Google Scholar] [CrossRef] [PubMed]
- De Bruyne, B.; Pijls, N.H.; Kalesan, B.; Barbato, E.; Tonino, P.A.; Piroth, Z.; Jagic, N.; Möbius-Winkler, S.; Rioufol, G.; Witt, N.; et al. Fractional flow reserve-guided PCI versus medical therapy in stable coronary disease. N. Engl. J. Med. 2012, 367, 991–1001. [Google Scholar] [CrossRef] [PubMed]
- Davies, J.E.; Sen, S.; Dehbi, H.M.; Al-Lamee, R.; Petraco, R.; Nijjer, S.S.; Bhindi, R.; Lehman, S.J.; Walters, D.; Sapontis, J.; et al. Use of the instantaneous wave-free ratio or fractional flow reserve in PCI. N. Engl. J. Med. 2017, 376, 1824–1834. [Google Scholar] [CrossRef] [PubMed]
- Jang, I.K.; Bouma, B.E.; Kang, D.H.; Park, S.J.; Park, S.W.; Seung, K.B.; Choi, K.B.; Shishkov, M.; Schlendorf, K.; Pomerantsev, E.; et al. Visualization of coronary atherosclerotic plaques in patients using optical coherence tomography: Comparison with intravascular ultrasound. J. Am. Coll. Cardiol. Cardiovasc. Imaging 2010, 3, 317–327. [Google Scholar] [CrossRef] [PubMed]
- Stone, G.W.; Maehara, A.; Lansky, A.J.; De Bruyne, B.; Cristea, E.; Mintz, G.S.; Mehran, R.; McPherson, J.; Farhat, N.; Marso, S.P.; et al. A prospective natural-history study of coronary atherosclerosis. N. Engl. J. Med. 2011, 364, 226–235. [Google Scholar] [CrossRef] [PubMed]
- Tearney, G.J.; Regar, E.; Akasaka, T.; Adriaenssens, T.; Barlis, P.; Bezerra, H.G.; Bouma, B.; Bruining, N.; Cho, J.M.; Chowdhary, S.; et al. Consensus standards for acquisition, measurement, and reporting of intravascular optical coherence tomography studies: A report from the International Working Group for Intravascular Optical Coherence Tomography Standardization and Validation. JACC Cardiovasc. Imaging 2019, 12, 458–472. [Google Scholar]
- Prati, F.; Regar, E.; Mintz, G.S.; Arbustini, E.; Di Mario, C.; Jang, I.K.; Akasaka, T.; Costa, M.; Guagliumi, G.; Grube, E.; et al. Expert review document on methodology, terminology, and clinical applications of optical coherence tomography: Physical principles, methodology of image acquisition, and clinical application for assessment of coronary arteries and atherosclerosis. Eur. Heart J. 2011, 32, 334–342. [Google Scholar] [CrossRef] [PubMed]
- Mol, J.Q.; Volleberg, R.H.; Belkacemi, A.; Hermanides, R.S.; Meuwissen, M.; Protopopov, A.V.; Laanmets, P.; Krestyaninov, O.V.; Dennert, R.; Oemrawsingh, R.M.; et al. Fractional Flow Reserve-Negative High-Risk Plaques and Clinical Outcomes After Myocardial Infarction. JAMA Cardiol. 2023, 8, 1013–1021. [Google Scholar] [CrossRef] [PubMed] [PubMed Central]
- Bergmark, B.; Dallan, L.A.P.; Pereira, G.T.R.; Kuder, J.F.; Murphy, S.A.; Buccola, J.; Wollmuth, J.; Lopez, J.; Spinelli, J.; Meinen, J.; et al. LightLab Initiative Investigators. Decision-Making During Percutaneous Coronary Intervention Guided by Optical Coherence Tomography: Insights From the LightLab Initiative. Circ. Cardiovasc. Interv. 2022, 15, 872–881. [Google Scholar] [CrossRef] [PubMed] [PubMed Central]

| Group 1 (FFR) (N = 18) | Group 2 (FFR&OCT) (N = 18) | p-Value | |
|---|---|---|---|
| Age, mean ± SD | 60.70 ± 10.71 | 59.76 ± 9.89 | ns |
| Sex, male, n (%) | 17 (94.44%) | 14 (77.77%) | ns |
| Diabetes mellitus n (%) | 4 (22.22%) | 5 (27.77%) | ns |
| Smoker * n (%) | 7 (38%) | 4 (22.22%) | ns |
| Hypercholesterolemia n (%) | 10 (55.55%) | 6 (33.33%) | ns |
| Hypertension n (%) | 14 (77.77%) | 12 (66.66%) | ns |
| Family history of heart disease n (%) | 6 (33.33%) | 5 (27.77%) | ns |
| History of ACS n (%) | 3 (16.66%) | 2 (11.11%) | ns |
| Prior PCI n (%) | 2 (11.11%) | 2 (11.11%) | ns |
| Type of ACS | |||
| STEMI n (%) | 6 (33.33%) | 11 (61.11%) | ns |
| N-STEMI n (%) | 8 (44.44%) | 2 (11.11%) | ns |
| UA n (%) | 4 (22.22%) | 5 (27.77%) | ns |
| Number of Non-Culprit Lesions | Group 1 (FFR) N = 23 | Group 2 (FFR&OCT) N = 30 | p Value |
|---|---|---|---|
| Location | |||
| RCA n (%) | 9 (39.12%) | 8 (26.66%) | ns |
| LAD n (%) | 9 (39.12%) | 12 (40%) | ns |
| LCX n (%) | 5 (21.73%) | 10 (33.33%) | ns |
| Total number of balloon predilatation | 5 (21.73%) | 5 (16.66%) | ns |
| RCA n (%) | 3 (13.04%) | 0 (00.00%) | ns |
| ADA n (%) | 1 (4.34%) | 2 (6.66%) | ns |
| ACX n (%) | 1 (4.34%) | 3 (10%) | ns |
| Total number of stent placement | 11 (47.82%) | 22 (73.33%) | ns |
| RCA n (%) | 4 (17.39%) | 5 (16.66%) | ns |
| ADA n (%) | 5 (21.73%) | 10 (33.33%) | ns |
| ACX n (%) | 2 (8.69%) | 7 (23.33%) | ns |
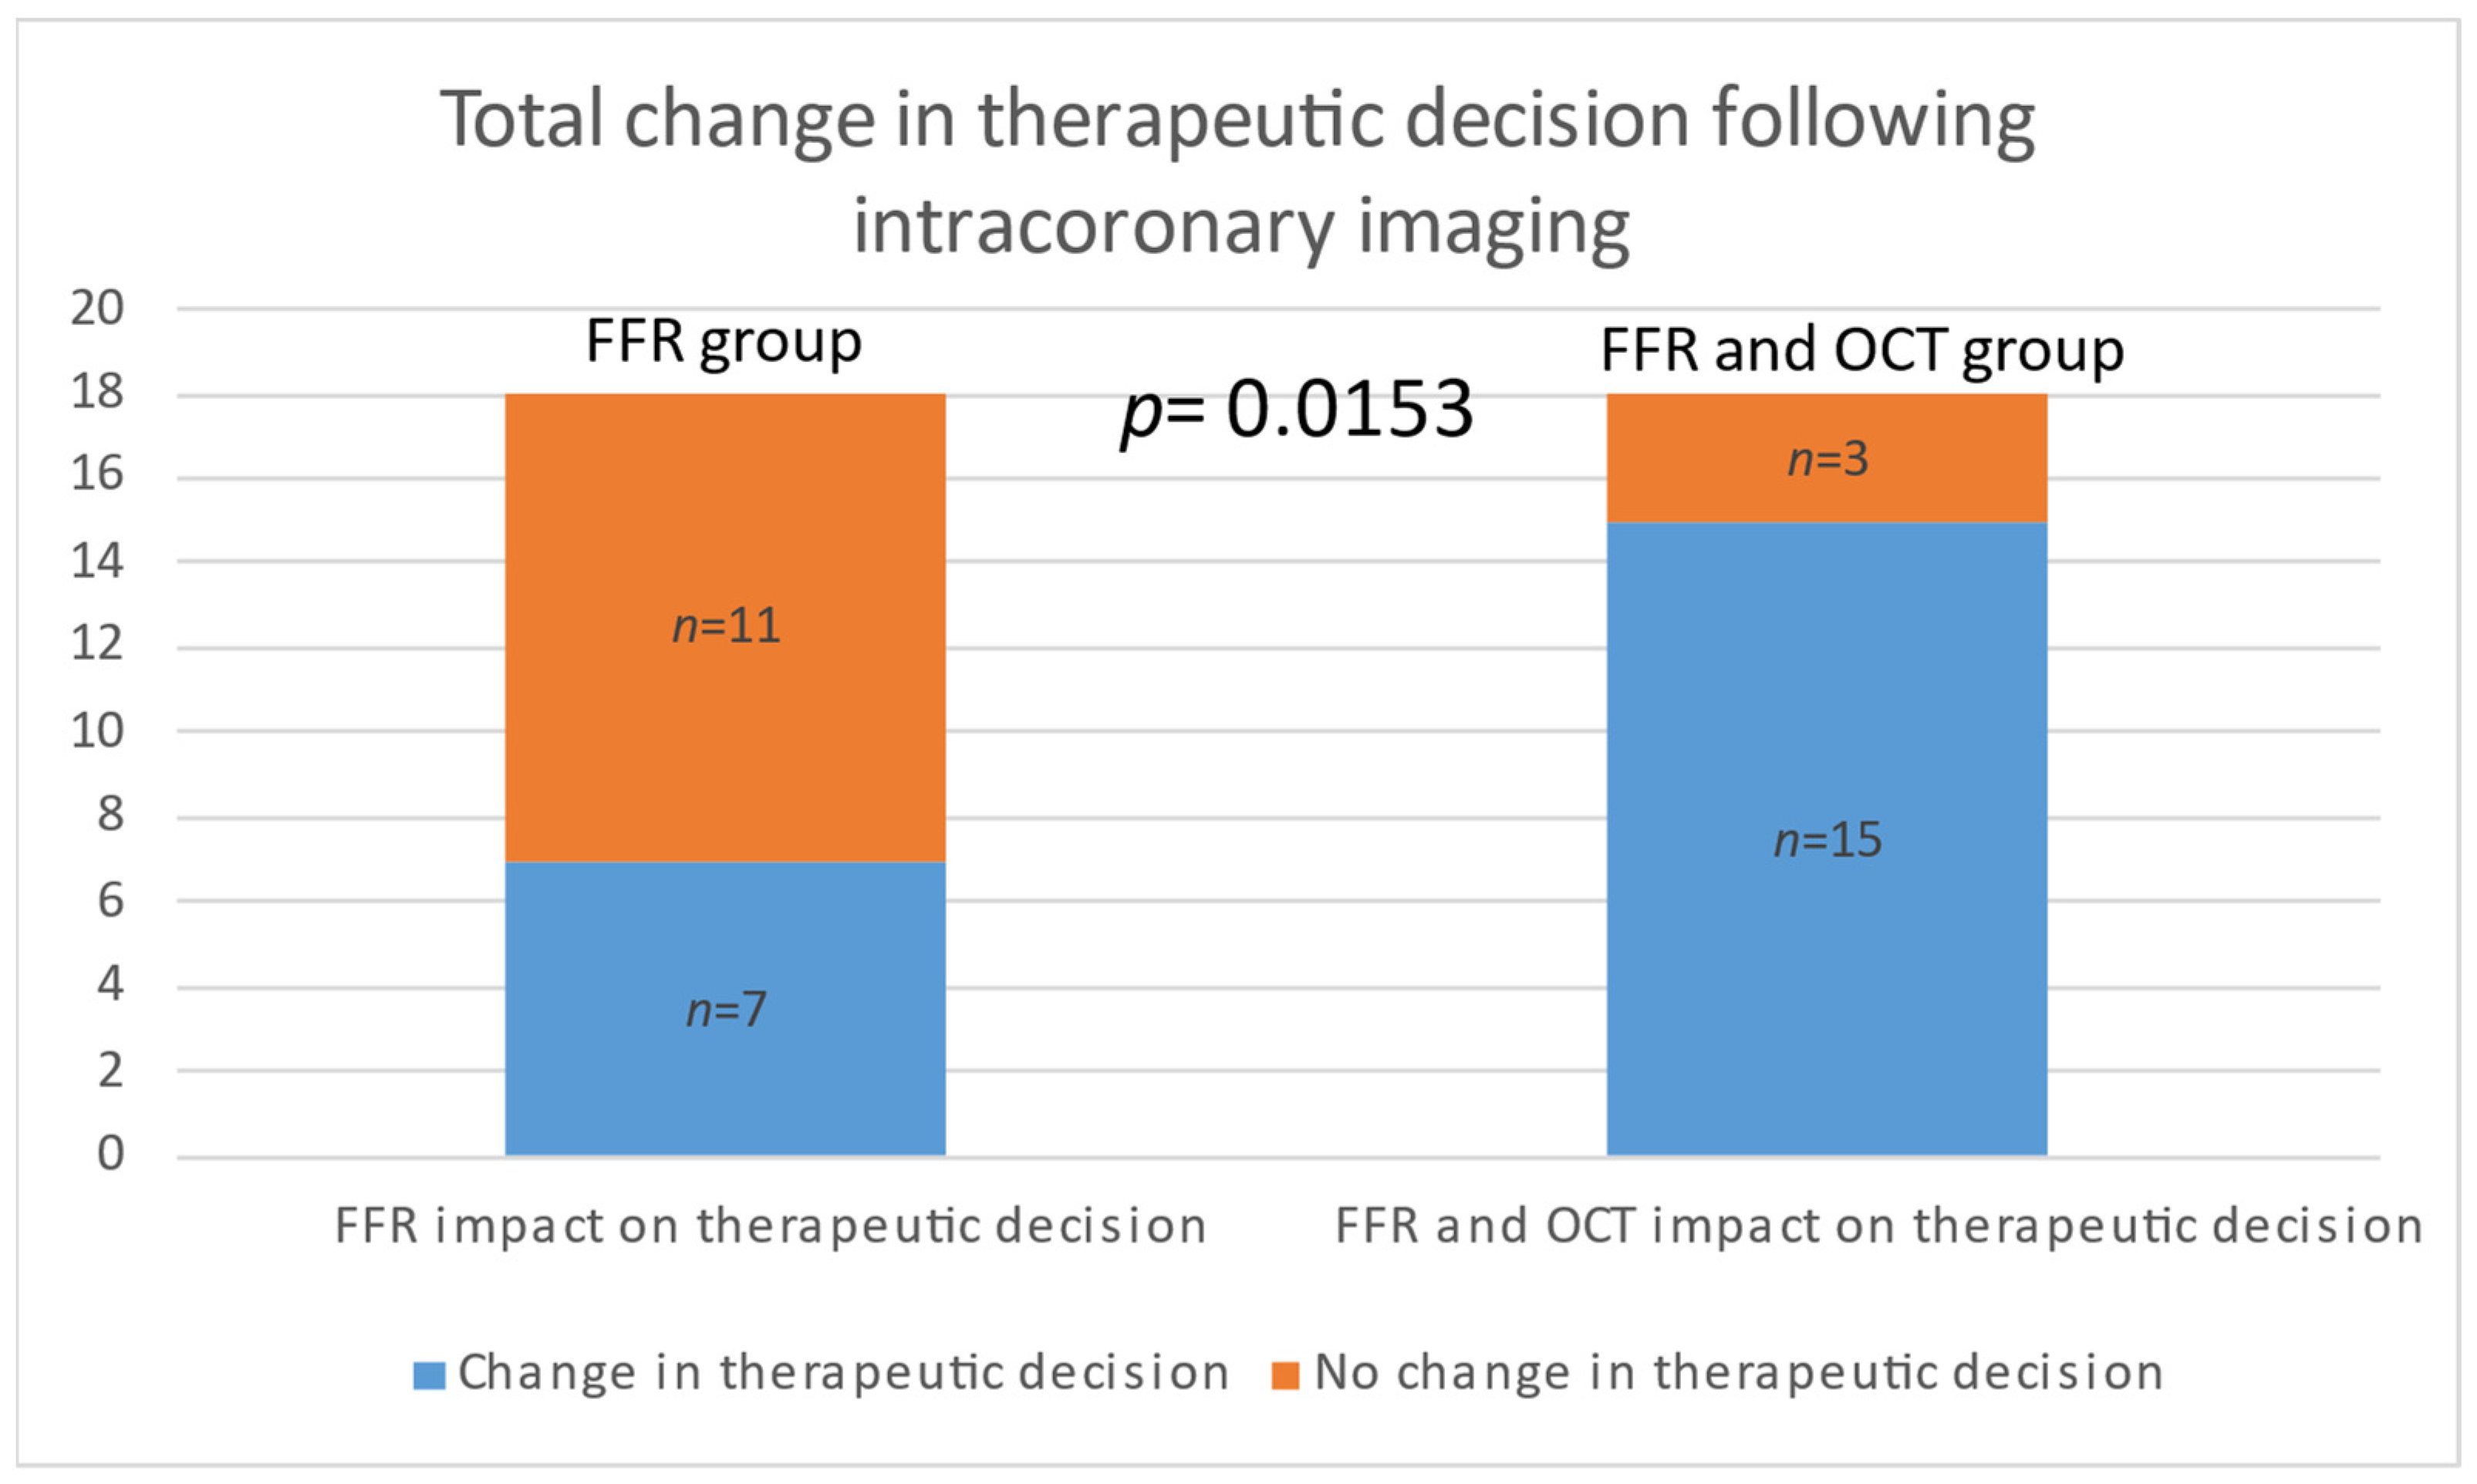
| Modified Decision | Group 1 (FFR) N = 18 | Group 2 (FFR&OCT) N = 18 | p Value |
|---|---|---|---|
| To stent based on FFR n (%) | 4 (22.22%) | 4 (22.22%) | ns |
| To stent based on OCT n (%) | 11 (66.66%) | ||
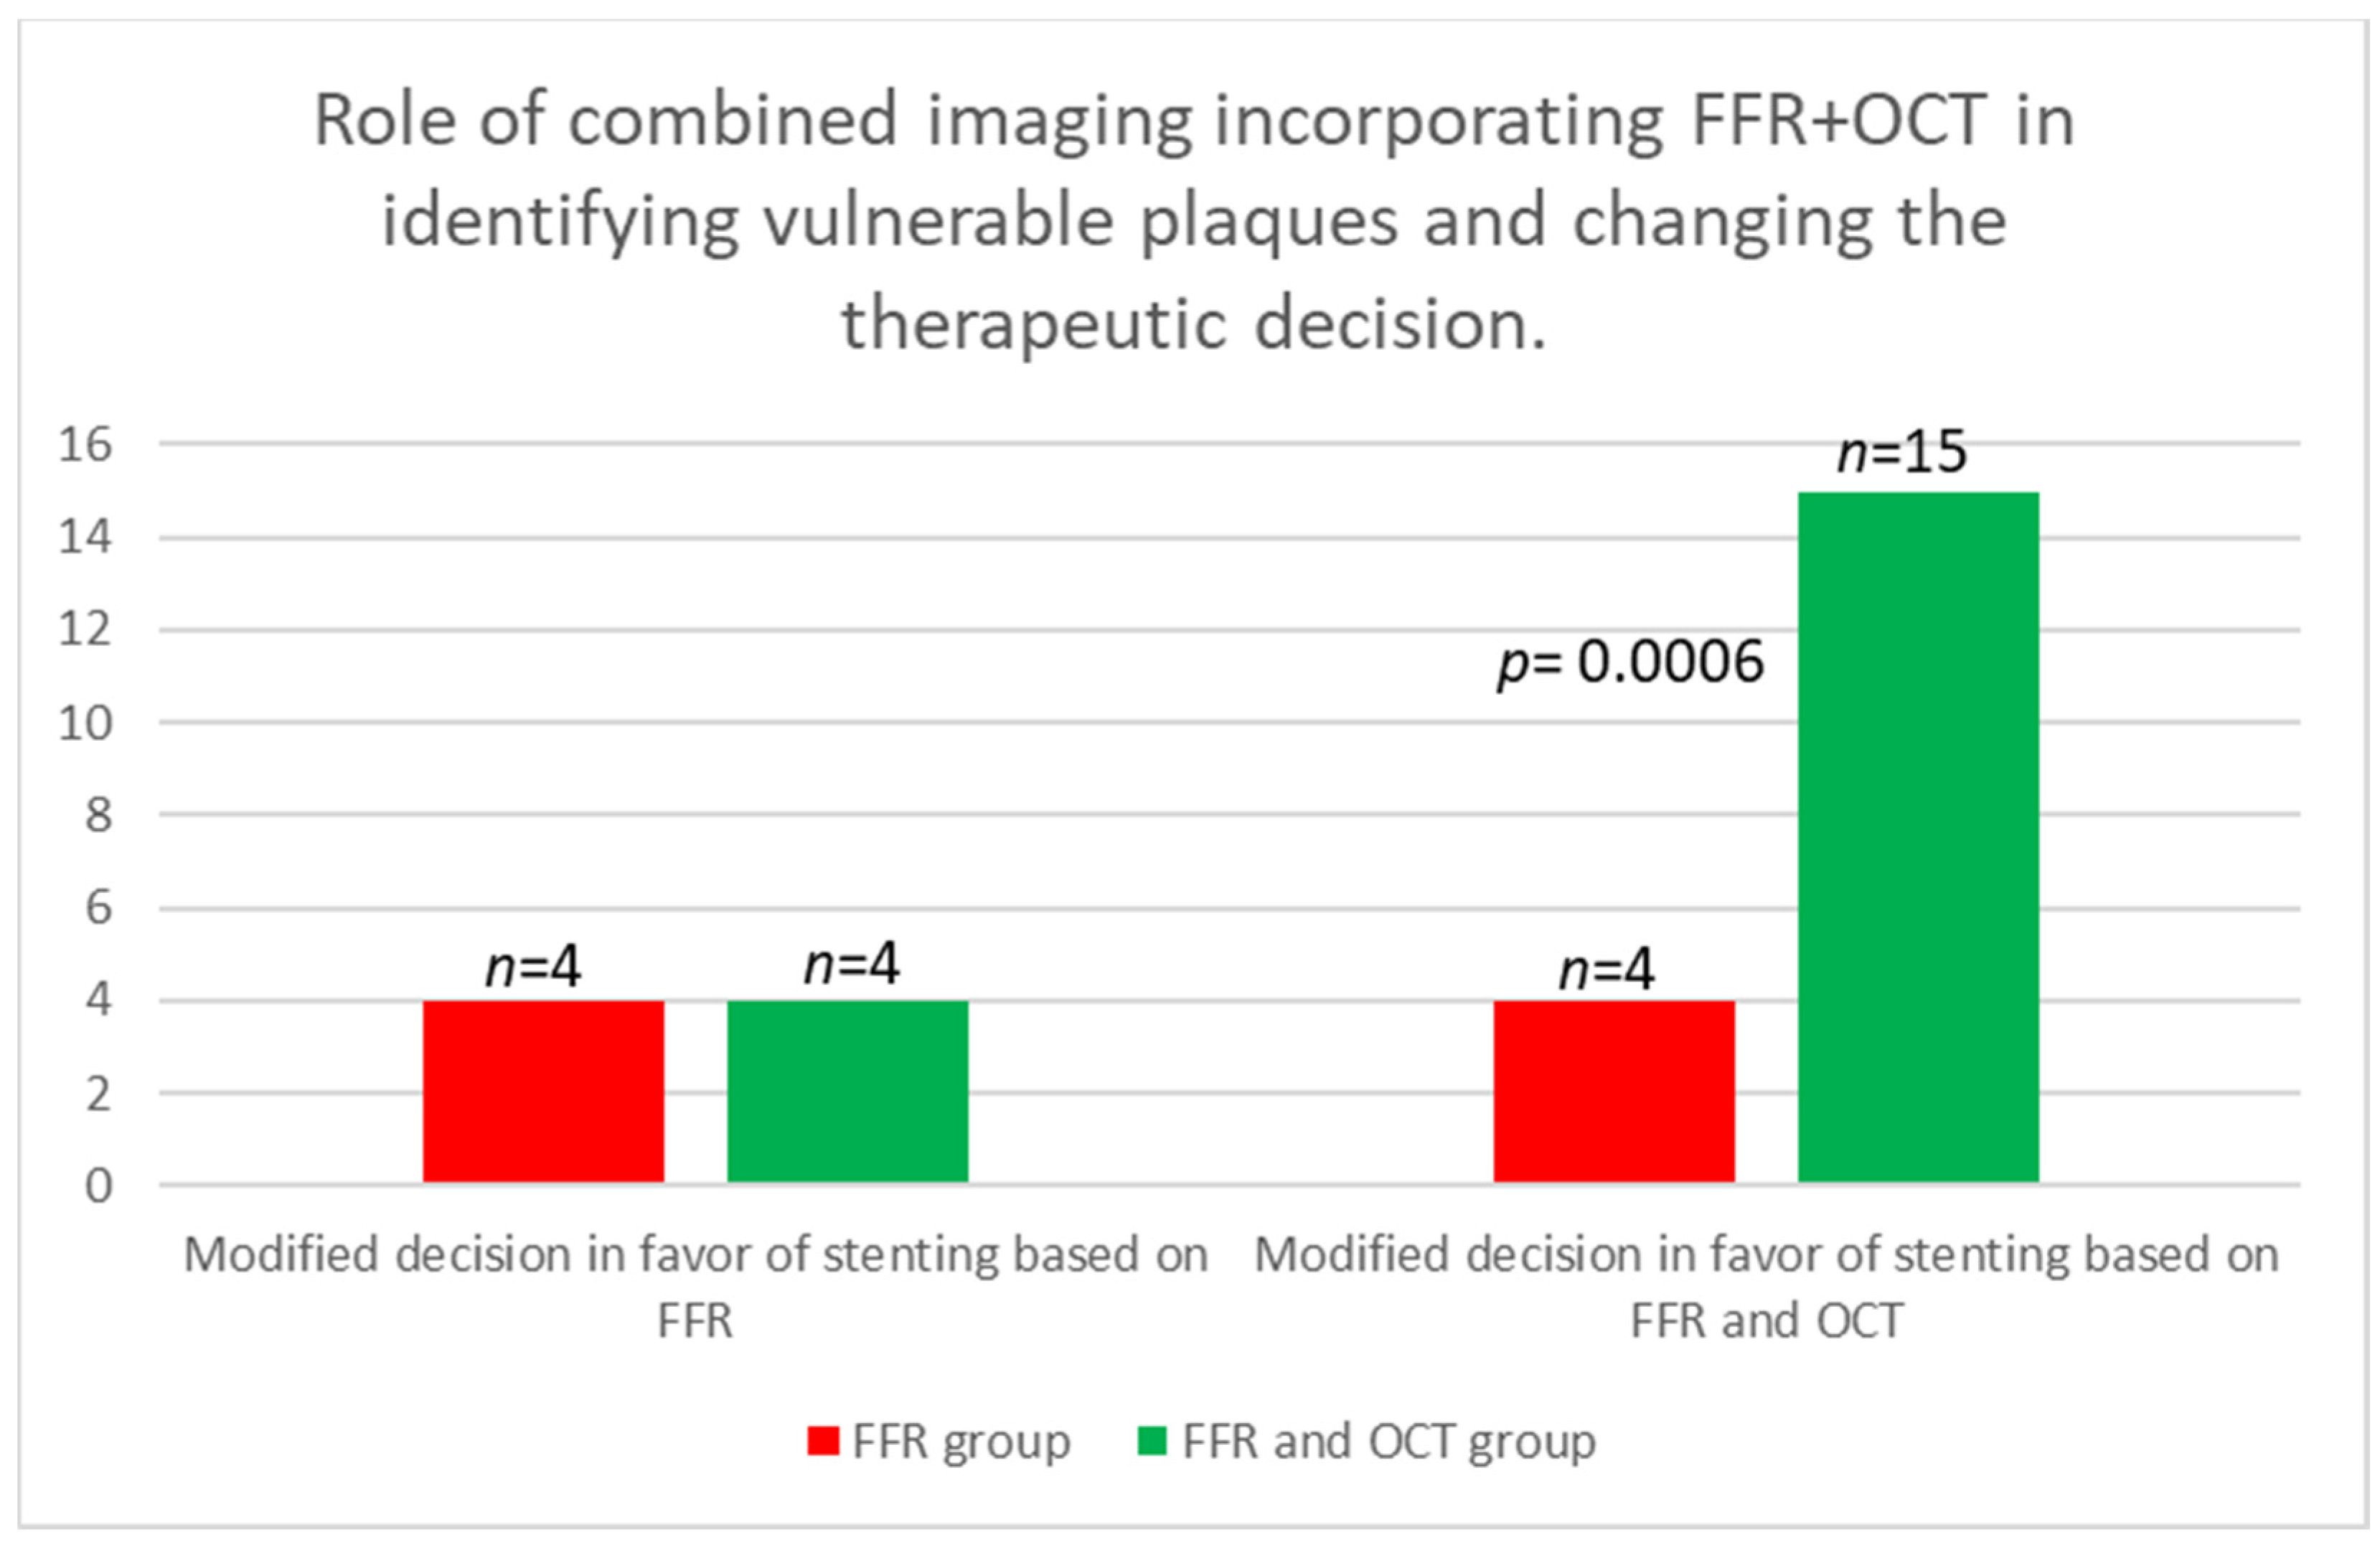
| Total modified decision to stent | 4 (22.22%) | 15 (88.88%) | 0.0006 |
| Not to stent based on FFR n (%) | 3 (16.66%) | 0 (00.00%) | ns |
| Total modified decisions n (%) | 7 (38.88%) | 15 (88.88%) | 0.0153 |
| Location | N = 13 |
|---|---|
| RCA n% | 4 (30.76%) |
| ADA n% | 5 (38.46%) |
| ACX n% | 4 (30.76) |
| Vulnerability criteria | |
| TCFA | 11 |
| Plaque rupture | 4 |
| Plaque erosion | 4 |
| FFR values | |
| RCA, mean ± SD | 0.88 ± 0.07 |
| ADA, mean ± SD | 0.85 ± 0.04 |
| ACX, mean ± SD | 0.89 ± 0.08 |
Disclaimer/Publisher’s Note: The statements, opinions and data contained in all publications are solely those of the individual author(s) and contributor(s) and not of MDPI and/or the editor(s). MDPI and/or the editor(s) disclaim responsibility for any injury to people or property resulting from any ideas, methods, instructions or products referred to in the content. |
© 2024 by the authors. Licensee MDPI, Basel, Switzerland. This article is an open access article distributed under the terms and conditions of the Creative Commons Attribution (CC BY) license (https://creativecommons.org/licenses/by/4.0/).
Share and Cite
Pasaroiu, D.; Benedek, I.; Popa, T.; Tolescu, C.; Chitu, M.; Benedek, T. Intracoronary Imaging for Changing Therapeutic Decisions in Patients with Multivascular Coronary Artery Disease. Medicina 2024, 60, 1320. https://doi.org/10.3390/medicina60081320
Pasaroiu D, Benedek I, Popa T, Tolescu C, Chitu M, Benedek T. Intracoronary Imaging for Changing Therapeutic Decisions in Patients with Multivascular Coronary Artery Disease. Medicina. 2024; 60(8):1320. https://doi.org/10.3390/medicina60081320
Chicago/Turabian StylePasaroiu, Dan, Imre Benedek, Teodora Popa, Constantin Tolescu, Monica Chitu, and Theodora Benedek. 2024. "Intracoronary Imaging for Changing Therapeutic Decisions in Patients with Multivascular Coronary Artery Disease" Medicina 60, no. 8: 1320. https://doi.org/10.3390/medicina60081320
APA StylePasaroiu, D., Benedek, I., Popa, T., Tolescu, C., Chitu, M., & Benedek, T. (2024). Intracoronary Imaging for Changing Therapeutic Decisions in Patients with Multivascular Coronary Artery Disease. Medicina, 60(8), 1320. https://doi.org/10.3390/medicina60081320