
A Multimodal Magnetic Resonance Imaging Study on Myalgic Encephalomyelitis/Chronic Fatigue Syndrome: Feasibility and Clinical Correlation

 , , , ,
Abstract
1. Introduction
2. Materials and Methods
2.1. Participants
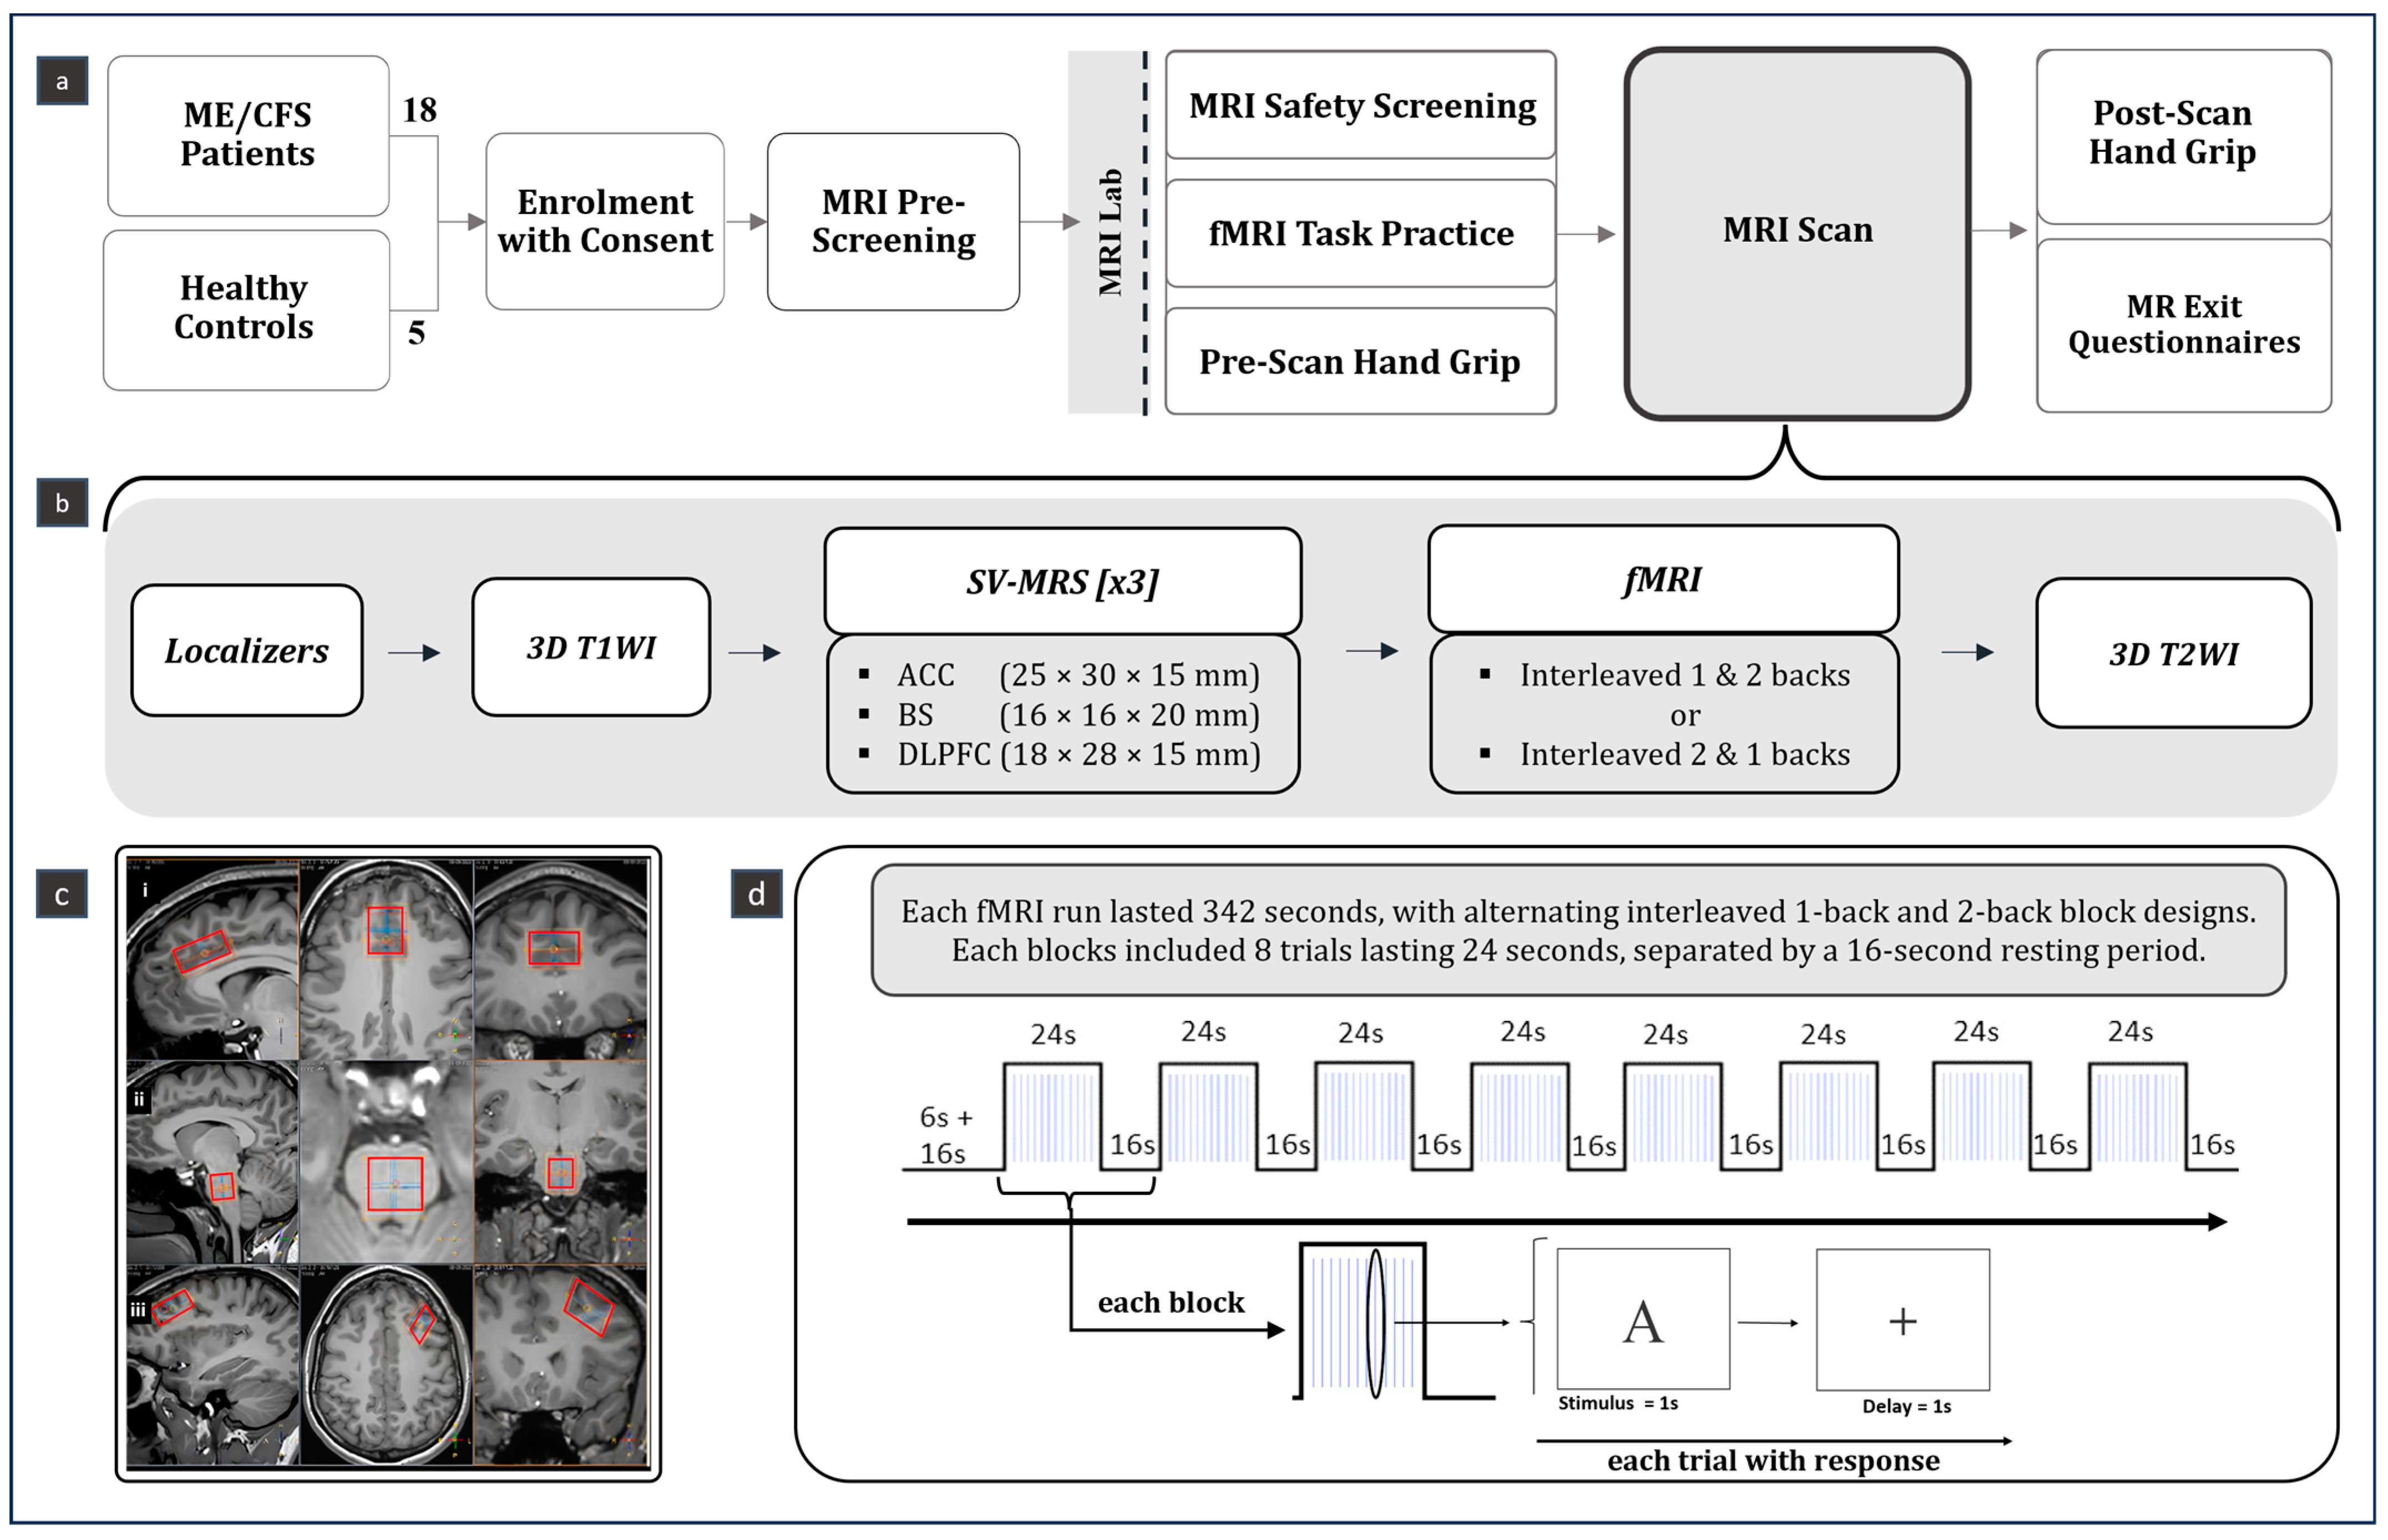
2.2. Study Design
2.3. SV-MRS Data
2.4. fMRI Data
2.5. Behavioral Data
2.6. Handgrip Strength
2.7. Clinical Data
2.8. Statistics
3. Results
4. Discussion
4.1. Summary of Key Findings
4.2. Interpretation
4.3. Limitations
4.4. Significance and Clinical Implication
5. Conclusions
Supplementary Materials
Author Contributions
Funding
Institutional Review Board Statement
Informed Consent Statement
Data Availability Statement
Acknowledgments
Conflicts of Interest
References
- Bested, A.C.; Marshall, L.M. Review of Myalgic Encephalomyelitis/Chronic Fatigue Syndrome: An evidence-based approach to diagnosis and management by clinicians. Rev. Environ. Health 2015, 30, 223–249. [Google Scholar] [CrossRef] [PubMed]
- Cortes Rivera, M.; Mastronardi, C.; Silva-Aldana, C.T.; Arcos-Burgos, M.; Lidbury, B.A. Myalgic Encephalomyelitis/Chronic Fatigue Syndrome: A Comprehensive Review. Diagnostics 2019, 9, 91. [Google Scholar] [CrossRef] [PubMed]
- Wirth, K.J.; Scheibenbogen, C.; Paul, F. An attempt to explain the neurological symptoms of Myalgic Encephalomyelitis/Chronic Fatigue Syndrome. J. Transl. Med. 2021, 19, 471. [Google Scholar] [CrossRef]
- Lim, E.J.; Ahn, Y.C.; Jang, E.S.; Lee, S.W.; Lee, S.H.; Son, C.G. Systematic review and meta-analysis of the prevalence of chronic fatigue syndrome/myalgic encephalomyelitis (CFS/ME). J. Transl. Med. 2020, 18, 100. [Google Scholar] [CrossRef] [PubMed]
- Canadian Institutes of Health Research. A Conversation about Myalgic Encephalomyelitis with Dr. Nina Muirhead [Internet]. 2021. Available online: https://cihr-irsc.gc.ca/e/52474.html (accessed on 8 August 2024).
- Chuluunbaatar-Lussier, E.; Tsai, M.; Boulter, T.; Muñoz, C.; Kerr, K.; Nacul, L. Epidemiology of Myalgic Encephalomyelitis among Individuals with Self-Reported Chronic Fatigue Syndrome in British Columbia, Canada, and Their Health-Related Quality of Life. 24307437. Available online: https://www.medrxiv.org/content/10.1101/2024.05.16.24307437v1 (accessed on 8 August 2024).
- Brittain, E.; Muirhead, N.; Finlay, A.; Vyas, J. Myalgic Encephalomyelitis/Chronic Fatigue Syndrome (ME/CFS): Major Impact on Lives of Both Patients and Family Members. Med. J. 2021, 57, 43. [Google Scholar] [CrossRef]
- Nacul, L.; O’Boyle, S.; Palla, L.; Nacul, F.E.; Mudie, K.; Kingdon, C.C.; Cliff, J.M.; Clark, T.G.; Dockrell, H.M.; Lacerda, E.M. How Myalgic Encephalomyelitis/Chronic Fatigue Syndrome (ME/CFS) Progresses: The Natural History of ME/CFS. Front. Neurol. 2020, 11, 826. [Google Scholar] [CrossRef]
- Gandasegui, I.M.; Laka, L.A.; Gargiulo, P.Á.; Gómez-Esteban, J.C.; Sánchez, J.V.L. Myalgic Encephalomyelitis/Chronic Fatigue Syndrome: A Neurological Entity? Medicina 2021, 57, 1030. [Google Scholar] [CrossRef]
- Murga, I.; Aranburu, L.; Gargiulo, P.A.; Gómez Esteban, J.C.; Lafuente, J.V. Clinical Heterogeneity in ME/CFS. A Way to Understand Long-COVID19 Fatigue. Front. Psychiatry 2021, 12, 735784. [Google Scholar] [CrossRef]
- Shan, Z.Y.; Barnden, L.R.; Kwiatek, R.A.; Bhuta, S.; Hermens, D.F.; Lagopoulos, J. Neuroimaging characteristics of myalgic enceph-alomyelitis/chronic fatigue syndrome (ME/CFS): A systematic review. J. Transl. Med. 2020, 18, 335. [Google Scholar] [CrossRef]
- Almutairi, B.; Langley, C.; Crawley, E.; Thai, N.J. Using structural and functional MRI as a neuroimaging technique to investigate chronic fatigue syndrome/myalgic encephalopathy: A systematic review. BMJ Open 2020, 10, e031672. [Google Scholar] [CrossRef]
- Maksoud, R.; Preez S du Eaton-Fitch, N.; Thapaliya, K.; Barnden, L.; Cabanas, H.; Staines, D.; Marshall-Gradisnik, S. A systematic review of neurological im-pairments in myalgic encephalomyelitis/chronic fatigue syndrome using neuroimaging techniques. PLoS ONE 2020, 15, e0232475. [Google Scholar] [CrossRef] [PubMed]
- Mueller, C.; Lin, J.C.; Sheriff, S.; Maudsley, A.A.; Younger, J.W. Evidence of widespread metabolite abnormalities in Myalgic En-cephalomyelitis/Chronic Fatigue Syndrome: Assessment with whole-brain Magnetic Resonance Spectroscopy. Brain Imaging Behav. 2019, 14, 562–572. [Google Scholar] [CrossRef]
- Godlewska, B.R.; Williams, S.; Emir, U.E.; Chen, C.; Sharpley, A.L.; Goncalves, A.J.; Andersson, M.I.; Clarke, W.; Angus, B.; Cowen, P.J. Neurochemical abnormalities in chronic fatigue syndrome: A pilot magnetic resonance spectroscopy study at 7 Tesla. Psychopharmacology 2022, 239, 163–171. [Google Scholar] [CrossRef] [PubMed]
- Buonocore, M.H.; Maddock, R.J. Magnetic resonance spectroscopy of the brain: A review of physical principles and technical methods. Rev. Neurosci. 2015, 26, 609–632. [Google Scholar] [CrossRef]
- Wilson, M.; Andronesi, O.; Barker, P.B.; Bartha, R.; Bizzi, A.; Bolan, P.J.; Brindle, K.M.; Choi, I.-Y.; Cudalbu, C.; Dydak, U.; et al. Methodological consensus on clinical proton MRS of the brain: Review and recommendations. Magn. Reson. Med. 2019, 82, 527–550. [Google Scholar] [CrossRef]
- Walitt, B.; Singh, K.; LaMunion, S.R.; Hallett, M.; Jacobson, S.; Chen, K.; Kreskow, J.D.; Levin, M.; Lyons, J.J.; Madian, N.; et al. Deep phenotyping of post-infectious myalgic enceph-alomyelitis/chronic fatigue syndrome. Nat. Commun. 2024, 15, 907. [Google Scholar] [CrossRef] [PubMed]
- Matthews, P.; Jezzard, P. Functional magnetic resonance imaging. J. Neurol. Neurosurg. Psychiatry. 2004, 75, 6–12. [Google Scholar] [PubMed]
- Roalf, D.R.; Gur, R.C. Functional Brain Imaging in Neuropsychology over the past 25 years. Neuropsychology 2017, 31, 954–971. [Google Scholar] [CrossRef]
- Schaaf, M.E.; van der Lange, F.P.D.; Schmits, I.C.; Geurts, D.E.M.; Roelofs, K.; van der Meer, J.W.M.; Toni, I.; Knoop, H. Prefrontal Structure Varies as a Function of Pain Symptoms in Chronic Fatigue Syndrome. Biol. Psychiatry 2017, 81, 358–365. [Google Scholar] [CrossRef]
- Nelson, T.; Zhang, L.X.; Guo, H.; Nacul, L.; Song, X. Brainstem Abnormalities in Myalgic Encephalomyelitis/Chronic Fatigue Syn-drome: A Scoping Review and Evaluation of Magnetic Resonance Imaging Findings. Front. Neurol. 2021, 12, 769511. [Google Scholar] [CrossRef]
- Caseras, X.; Mataix-Cols, D.; Giampietro, V.; Rimes, K.A.; Brammer, M.; Zelaya, F.; Chalder, T.; Godfrey, E.L. Probing the working memory system in chronic fatigue syndrome: A functional magnetic resonance imaging study using the n-back task. Psychosom. Med. 2006, 68, 947–955. [Google Scholar] [CrossRef]
- Manca, R.; Khan, K.; Mitolo, M.; De Marco, M.; Grieveson, L.; Varley, R.; Wilkinson, I.D.; Venneri, A. Modulatory effects of cognitive exertion on regional functional connectivity of the salience network in women with ME/CFS: A pilot study. J. Neurol. Sci. 2021, 422, 117326. [Google Scholar] [CrossRef]
- Committee on the Diagnostic Criteria for Myalgic Encephalomyelitis/ChronicFatigue Syndrome, Board on the Health of Select Populations, Institute of Medicine. Beyond Myalgic Encephalomyelitis/Chronic Fatigue Syndrome: Redefining an Illness; The National Academies Collection: Reports funded by National Institutes of Health; National Academies Press (US): Washington, DC, USA, 2015. Available online: http://www.ncbi.nlm.nih.gov/books/NBK274235/ (accessed on 8 August 2024).
- Carruthers, B.M. Definitions and aetiology of myalgic encephalomyelitis: How the Canadian consensus clinical definition of myalgic encephalomyelitis works. J. Clin. Pathol. 2007, 60, 117–119. [Google Scholar] [CrossRef]
- Simpson, R.; Devenyi, G.A.; Jezzard, P.; Hennessy, T.J.; Near, J. Advanced processing and simulation of MRS data using the FID appliance (FID-A)-An open source, MATLAB-based toolkit. Magn. Reson. Med. 2017, 77, 23–33. [Google Scholar] [CrossRef] [PubMed]
- Near, J.; Harris, A.D.; Juchem, C.; Kreis, R.; Marjańska, M.; Öz, G.; Slotboom, J.; Wilson, M.; Gasparovic, C. Preprocessing, analysis and quantification in single-voxel magnetic resonance spectroscopy: Experts’ consensus recommendations. NMR Biomed. 2021, 34, e4257. [Google Scholar] [CrossRef] [PubMed]
- Provencher, S.W. Estimation of metabolite concentrations from localized in vivo proton NMR spectra. Magn. Reson. Med. 1993, 30, 672–679. [Google Scholar] [CrossRef] [PubMed]
- Clarke, W.T.; Stagg, C.J.; Jbabdi, S. FSL-MRS: An end-to-end spectroscopy analysis package. Magn. Reson. Med. 2021, 85, 2950–2964. [Google Scholar] [CrossRef]
- Griffanti, L.; Salimi-Khorshidi, G.; Beckmann, C.F.; Auerbach, E.J.; Douaud, G.; Sexton, C.E.; Zsoldos, E.; Ebmeier, K.P.; Filippini, N.; Mackay, C.E.; et al. ICA-based artefact removal and accelerated fMRI acquisition for improved resting state network imaging. NeuroImage 2014, 95, 232–247. [Google Scholar] [CrossRef]
- Koo, T.K.; Li, M.Y. A Guideline of Selecting and Reporting Intraclass Correlation Coefficients for Reliability Research. J. Chiropr. Med. 2016, 15, 155–163. [Google Scholar] [CrossRef]
- Woolrich, M.W.; Behrens, T.E.J.; Smith, S.M. Constrained linear basis sets for HRF modelling using Variational Bayes. NeuroImage 2004, 21, 1748–1761. [Google Scholar] [CrossRef]
- Woolrich, M.W.; Behrens, T.E.J.; Beckmann, C.F.; Jenkinson, M.; Smith, S.M. Multilevel linear modelling for FMRI group analysis using Bayesian inference. NeuroImage 2004, 21, 1732–1747. [Google Scholar] [CrossRef] [PubMed]
- Harvard Oxford Atlas. Nilearn. Available online: https://nilearn.github.io/dev/modules/description/harvard_oxford.html (accessed on 8 August 2024).
- Nacul, L.C.; Mudie, K.; Kingdon, C.C.; Clark, T.G.; Lacerda, E.M. Hand Grip Strength as a Clinical Biomarker for ME/CFS and Disease Severity. Front. Neurol. 2018, 9, 992. [Google Scholar] [CrossRef] [PubMed]
- Naik, H.; Cooke, E.; Boulter, T.; Dyer, R.; Bone, J.N.; Tsai, M.; Cristobal, J.; McKay, R.J.; Song, X.; Nacul, L. Low-dose naltrexone for post-COVID fatigue syndrome: A study protocol for a double-blind, randomised trial in British Columbia. BMJ Open 2024, 14, e085272. [Google Scholar] [CrossRef] [PubMed]
- Rebelos, E.; Daniele, G.; Campi, B.; Saba, A.; Koskensalo, K.; Ihalainen, J.; Saukko, E.; Nuutila, P.; Backes, W.H.; Jansen, J.F.A.; et al. Circulating N-Acetylaspartate does not track brain NAA concentrations, cognitive function or features of small vessel disease in humans. Sci. Rep. 2022, 12, 11530. [Google Scholar] [CrossRef]
- Morris, G.; Maes, M. Oxidative and Nitrosative Stress and Immune-Inflammatory Pathways in Patients with Myalgic En-cephalomyelitis (ME)/Chronic Fatigue Syndrome (CFS). Curr. Neuropharmacol. 2014, 12, 168–185. [Google Scholar] [CrossRef]
- Vanelzakker, M.; Brumfield, S.; Mejia, P. Neuroinflammation and Cytokines in Myalgic Encephalomyelitis/Chronic Fatigue Syndrome (ME/CFS): A Critical Review of Research Methods. Front. Neurol. 2019, 10, 9. [Google Scholar] [CrossRef]
- Brooks, J.C.; Roberts, N.; Whitehouse, G.; Majeed, T. Proton magnetic resonance spectroscopy and morphometry of the hippo-campus in chronic fatigue syndrome. Br. J. Radiol. 2000, 73, 1206–1208. [Google Scholar] [CrossRef]
- Thapaliya, K.; Marshall-Gradisnik, S.; Staines, D.; Barnden, L. Mapping of pathological change in chronic fatigue syndrome using the ratio of T1- and T2-weighted MRI scans. NeuroImage Clin. 2020, 28, 102366. [Google Scholar] [CrossRef]
- Stern, Y.; Arenaza-Urquijo, E.M.; Bartrés-Faz, D.; Belleville, S.; Cantilon, M.; Chetelat, G.; Ewers, M.; Franzmeier, N.; Kempermann, G.; Kremen, W.S. Whitepaper: Defining and investi-gating cognitive reserve, brain reserve, and brain maintenance. Alzheimers Dement. 2020, 16, 1305–1311. [Google Scholar] [CrossRef]
- Lee, J.S.; Sato, W.; Son, C.G. Brain-regional characteristics and neuroinflammation in ME/CFS patients from neuroimaging: A systematic review and meta-analysis. Autoimmun. Rev. 2024, 23, 103484. [Google Scholar] [CrossRef]
- Clague-Baker, N.; Tyson, S.; Leslie, K.; Dawes, H.; Bull, M.; Hilliard, N. Home-based testing protocol to measure physiological responses to everyday activities in ME: A feasibility study. Fatigue Biomed. Health Behav. 2023, 11, 142–156. [Google Scholar] [CrossRef]
- Carruthers, B.M.; van de Sande, M.I.; De Meirleir, K.L.; Klimas, N.G.; Broderick, G.; Mitchell, T.; Staines, D.; Powles, A.C.; Speight, N.; Vallings, R.; et al. Myalgic encephalomyelitis: International Consensus Criteria. J. Intern. Med. 2011, 270, 327–338. [Google Scholar] [CrossRef] [PubMed]

| Characteristic | HCs [n = 5] | ME/CFS [n = 18] | p-Value |
|---|---|---|---|
| Age | 45.6 (14.5) | 39.7 (12.0) | 0.471 |
| Quality of sleep | 13.0 (14.0) | 69.4 (22.6) | 0.002 ‡ |
| Fatigue Severity Scale | 16.0 (4.9) | 59.6 (5.0) | 0.001 ‡ |
| Visual Analogue Fatigue Scale | 29.3 (25.3) | 76.0 (9.1) | 0.033 |
| Visual Analogue Pain Scale | 6.8 (7.0) | 45.9 (24.2) | <0.001 |
| Generalized Anxiety Disorder 2-item | 0.0 (0.0) | 1.4 (1.0) | 0.004 ‡ |
| Patient Health Questionnaire-2 | 0.4 (0.5) | 1.8 (0.9) | 0.009 ‡ |
| Averaged hand grip strength in Kg | 31.2 (6.0) | 25.6 (6.7) | 0.050 β |
| Average hand grip strength-COV | 0.05 (0.03) | 0.07 (0.06) | 0.014 |
| Voxel of Interest | Metabolite | HCs Mean (SD) | ME/CFS Mean (SD) | Odds Ratio | Z-Value | p-Value |
|---|---|---|---|---|---|---|
| Anterior cingulate cortex | Cr | 2.29 (0.39) | 2.67 (0.67) | 3.22 | 1.19 | 0.232 |
| GABA | 0.47 (0.37) | 0.64 (0.31) | 29.41 | 1.49 | 0.136 | |
| GSH | 0.64 (0.06) | 0.67 (0.19) | 2.37 | 0.29 | 0.772 | |
| Gln | 0.70 (0.32) | 0.92 (0.27) | 15.61 | 1.42 | 0.157 | |
| Glu | 3.20 (0.34) | 3.39 (0.55) | 2.19 | 0.75 | 0.451 | |
| Ins | 3.46 (0.37) | 3.76 (0.43) | 7.28 | 1.35 | 0.176 | |
| NAA | 4.33 (0.59) | 4.58 (0.51) | 2.7 | 0.93 | 0.353 | |
| NAAG | 0.24 (0.15) | 0.27 (0.15) | 2.19 | 0.22 | 0.824 | |
| PCh | 1.00 (0.18) | 1.01 (0.17) | 1.79 | 0.19 | 0.851 | |
| PCr | 2.75 (0.59) | 2.39 (0.73) | 0.45 | −1.00 | 0.315 | |
| Brainstem | Cr | 3.43 (1.37) | 3.00 (1.48) | 0.97 | −0.09 | 0.928 |
| GABA | 1.54 (0.91) | 1.56 (0.98) | 0.93 | −0.13 | 0.898 | |
| GSH | 0.75 (0.30) | 0.86 (0.50) | 0.88 | −0.12 | 0.901 | |
| Gln | 0.94 (0.93) | 0.99 (0.91) | 0.87 | −0.25 | 0.799 | |
| Glu | 3.06 (1.17) | 3.22 (1.37) | 1.1 | 0.25 | 0.801 | |
| Ins | 5.31 (1.48) | 5.12 (1.26) | 0.88 | −0.3 | 0.764 | |
| NAA | 6.64 (5.95) | 1.04 (0.94) | 0.39 | −1.32 | 0.186 | |
| NAAG | 1.45 (0.94) | 2.04 (0.65) | 3.7 | 1.51 | 0.131 | |
| PCh | 2.32 (0.19) | 2.33 (0.37) | 1.07 | 0.04 | 0.965 | |
| PCr | 3.74 (1.70) | 3.41 (1.59) | 0.96 | −0.16 | 0.872 | |
| Dorsolateral prefrontal cortex | Cr | 2.43 (0.98) | 2.54 (0.89) | 1.16 | 0.25 | 0.803 |
| GABA | 0.89 (0.38) | 0.82 (0.44) | 0.63 | −0.38 | 0.702 | |
| GSH | 0.44 (0.37) | 0.73 (0.15) | 23.11 | 1.65 | 0.100 | |
| Gln | 0.89 (0.30) | 0.88 (0.45) | 2.41 | 0.72 | 0.469 | |
| Glu | 3.19 (0.79) | 3.20 (0.77) | 1.02 | 0.03 | 0.976 | |
| Ins | 3.42 (0.78) | 3.48 (0.55) | 1.19 | 0.2 | 0.840 | |
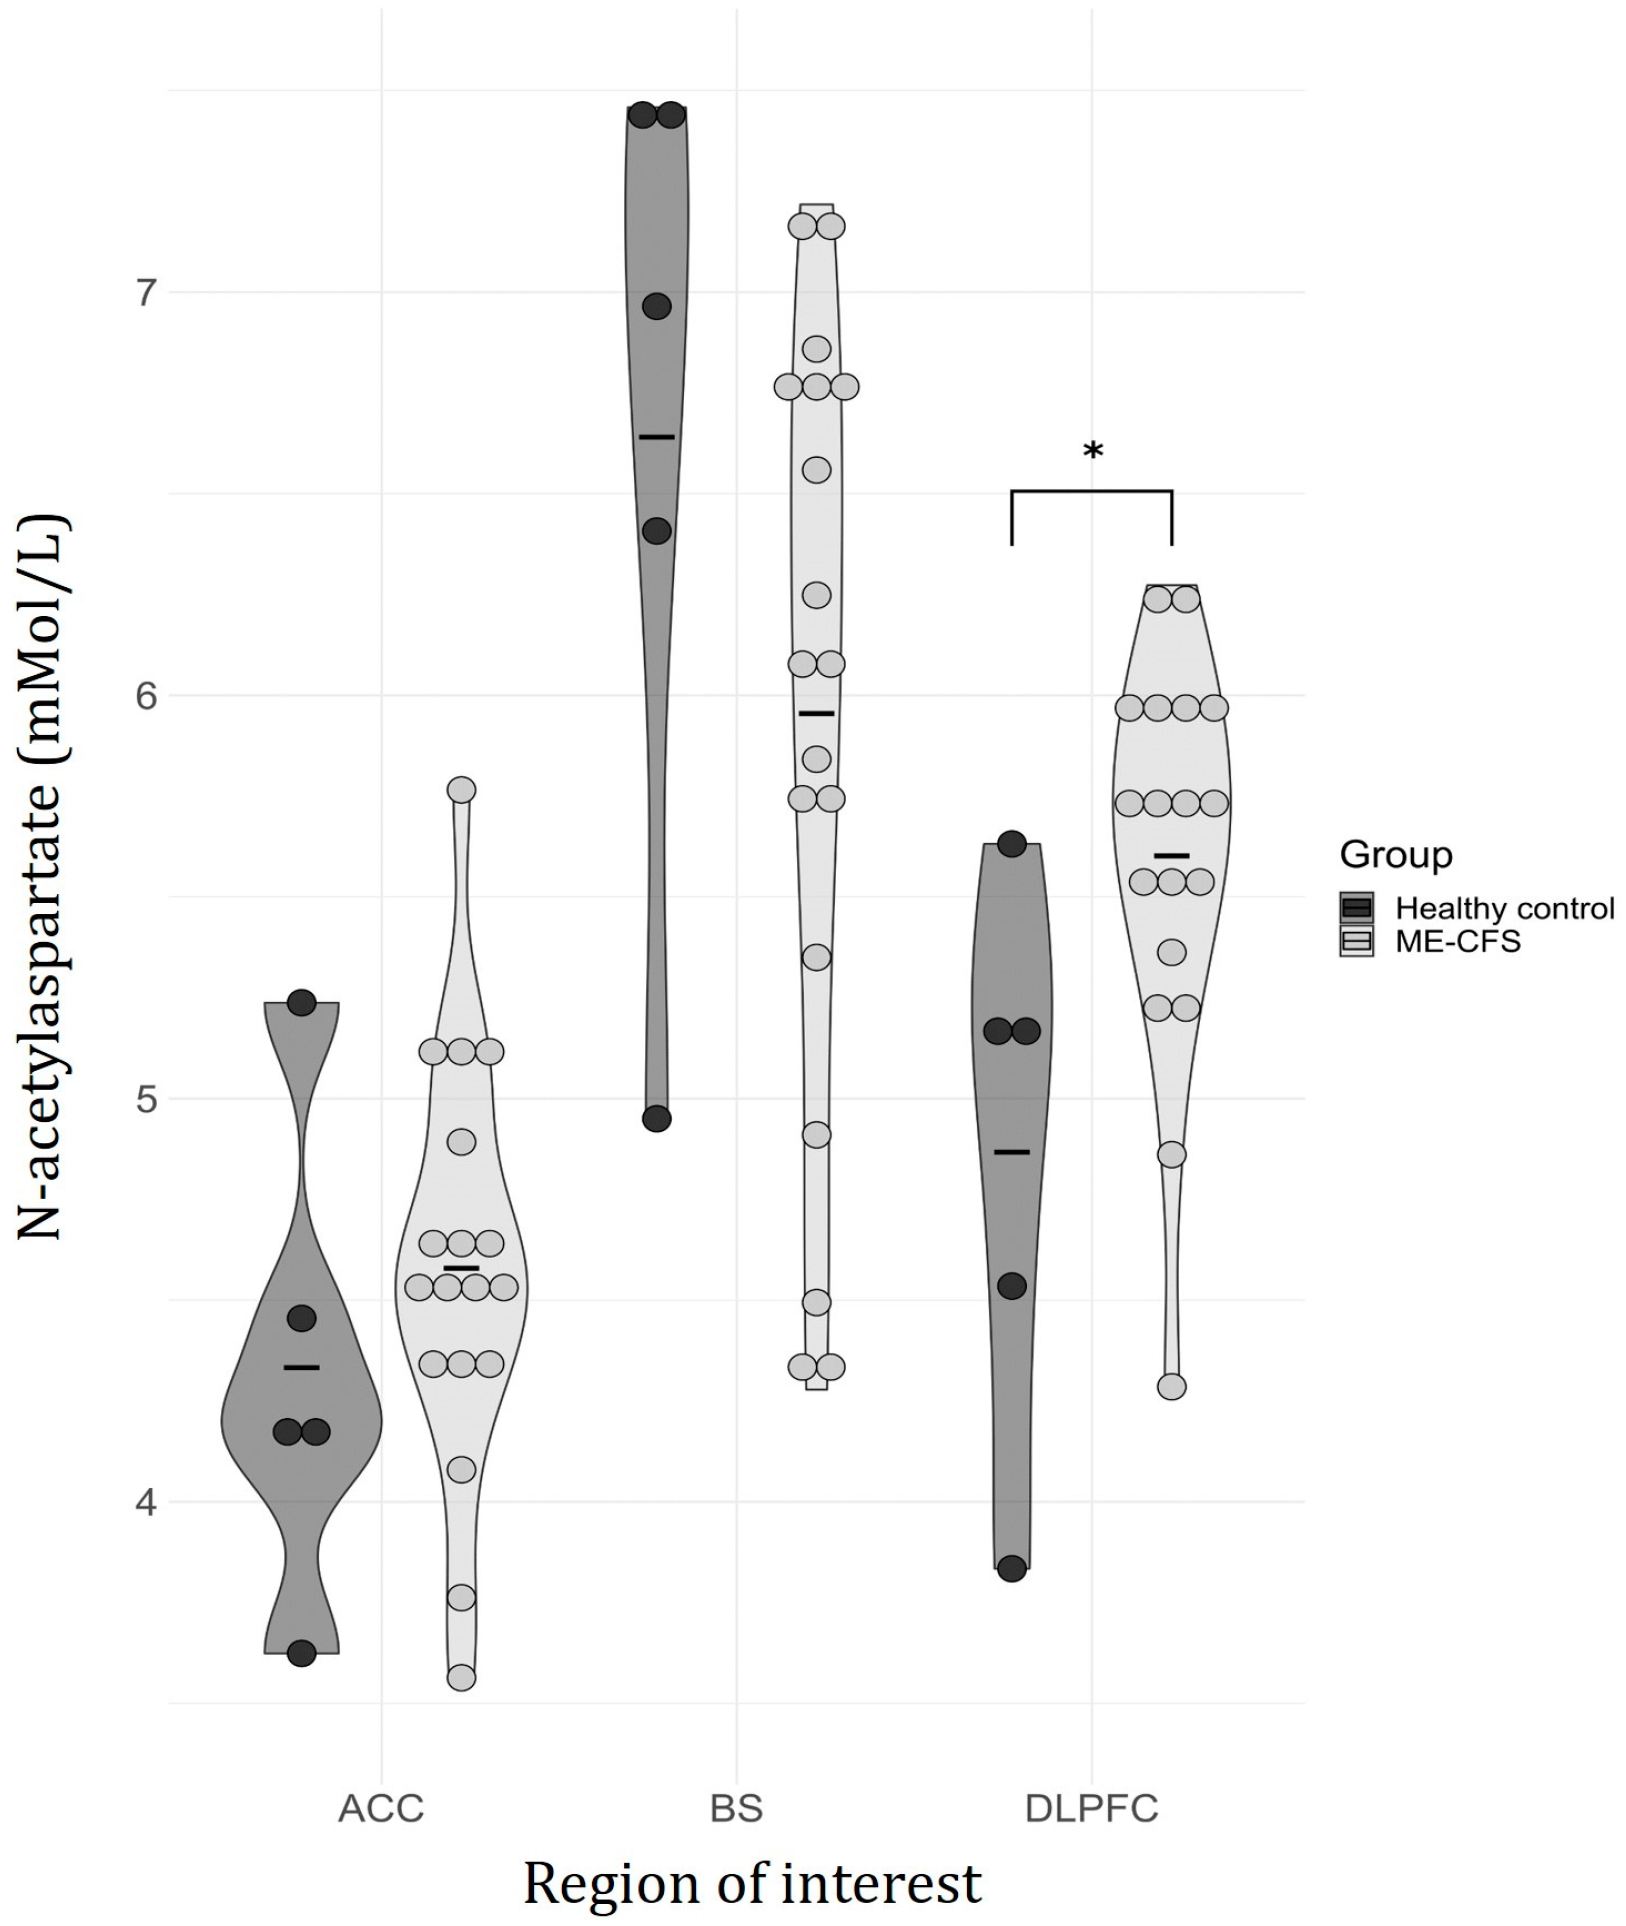
| NAA | 4.87 (0.70) | 5.60 (0.49) | 8.49 | 2.03 | 0.042 | |
| NAAG | 0.49 (0.26) | 0.38 (0.20) | 0.04 | −1.22 | 0.224 | |
| PCh | 0.86 (0.19) | 0.90 (0.21) | 2.68 | 0.37 | 0.713 | |
| PCr | 2.31 (1.06) | 2.70 (0.81) | 1.76 | 0.9 | 0.368 |
| Reaction time (s) | ||||
| Task difficulty | 1-back (Mean ± SD) | 2-back (Mean ± SD) | Main Effect (Task) | |
| Group | HCs | 0.58 ± 0.13 | 0.65 ± 0.16 | rmANOVA: |
| ME | 0.63 ± 0.14 | 0.68 ± 0.15 | F(1, 21) = 12.61; p < 0.001 | |
| Main Effect (Group) | rmANOVA: F (1, 21) = 0.17; p = 0.69 | Interaction (Task-Group) | ||
| rmANOVA: | ||||
| F(2, 21) = 1.24; p = 0.280 | ||||
| Accuracy (%) | ||||
| Task difficulty | 1-back (Mean±SD) | 2-back (Mean±SD) | Main Effect (Task) | |
| Group | HCs | 89.17 ± 12.32 | 85.00 ± 13.14 | Wilcoxon Signed-Ranks: |
| ME | 92.48 ± 13.14 | 89.82 ± 14.10 | Z = −2.18; p = 0.030 | |
| Main Effect (Group) | Mann–Whitney U: Z = −0.45; p = 0.69 | Interaction (Task-Group) | ||
| n/a | ||||
| r, Spearman’s Correlation Coefficient with p Values | Quality of Sleep | Fatigue Severity Scale | Visual Analog Fatigue Scale | Visual Analog Pain Scale | Generalized Anxiety Disorder 2-Item | Patient Health Questionnaire-2 | |
|---|---|---|---|---|---|---|---|
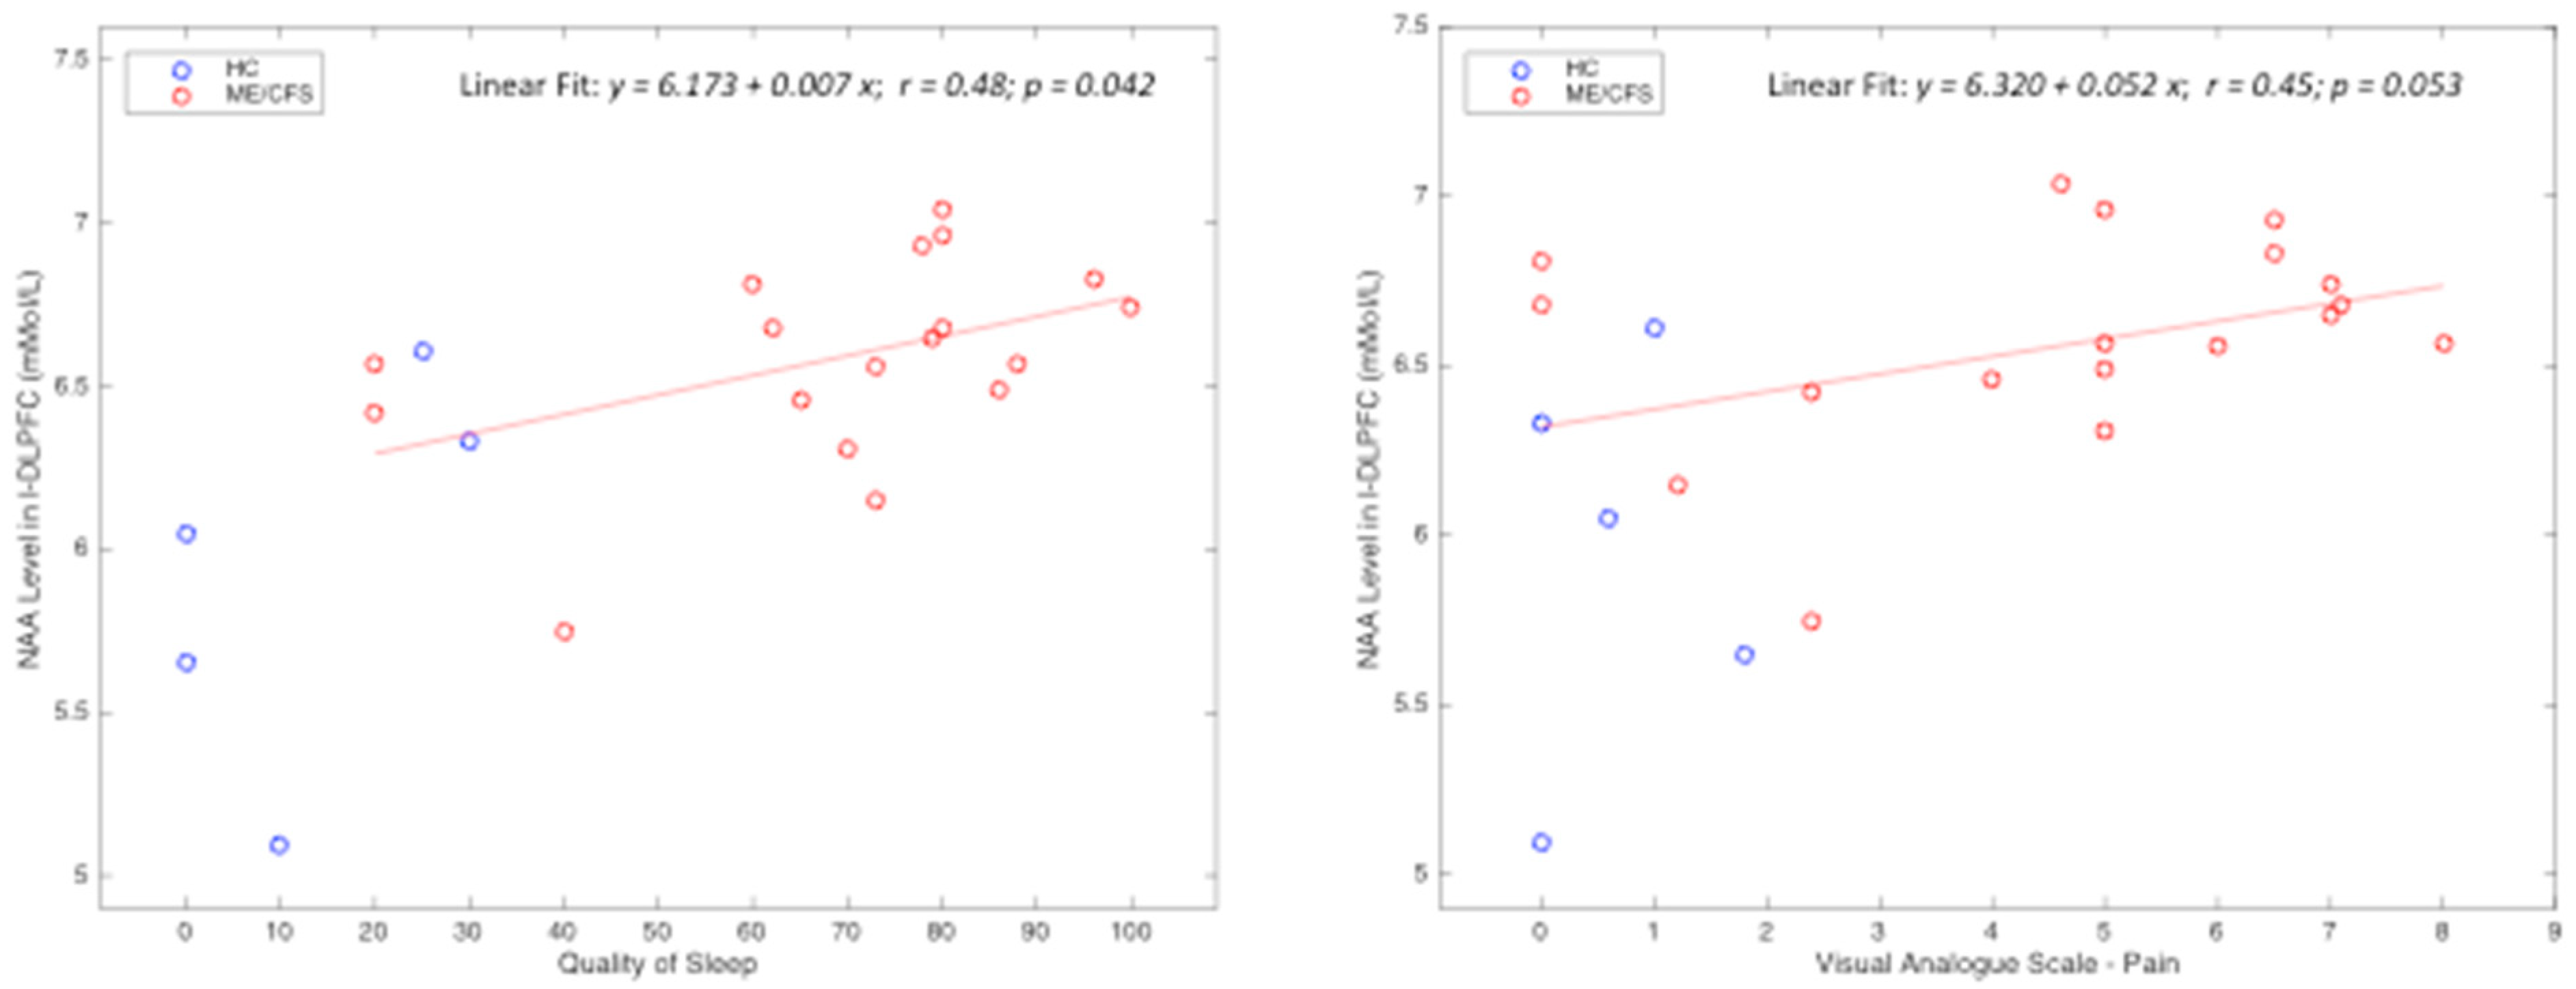
| L-DLPFC-NAA | r | 0.64 | 0.52 | 0.54 | 0.43 | 0.42 | 0.25 |
| p | 0.004 * | 0.040 * | 0.036 * | 0.117 | 0.192 | 0.257 | |
| Average Hand Grip Strength | r | −0.50 | 0.01 | −0.32 | −0.55 | −0.33 | −0.37 |
| p | 0.048 * | 0.962 | 0.152 | 0.028 * | 0.122 | 0.085 | |
| Number of Voxels Activated: 1 Back | r | 0.15 | 0.31 | 0.03 | 0.42 | 0.02 | 0.01 |
| p | 0.503 | 0.148 | 0.895 | 0.094 | 0.918 | 0.959 | |
| Number of Voxels Activated: 2 Back | r | −0.13 | 0.07 | −0.06 | −0.1 | −0.01 | 0.29 |
| p | 0.561 | 0.759 | 0.804 | 0.66 | 0.948 | 0.181 |
Disclaimer/Publisher’s Note: The statements, opinions and data contained in all publications are solely those of the individual author(s) and contributor(s) and not of MDPI and/or the editor(s). MDPI and/or the editor(s) disclaim responsibility for any injury to people or property resulting from any ideas, methods, instructions or products referred to in the content. |
© 2024 by the authors. Licensee MDPI, Basel, Switzerland. This article is an open access article distributed under the terms and conditions of the Creative Commons Attribution (CC BY) license (https://creativecommons.org/licenses/by/4.0/).
Share and Cite
Kaur, R.; Greeley, B.; Ciok, A.; Mehta, K.; Tsai, M.; Robertson, H.; Debelic, K.; Zhang, L.X.; Nelson, T.; Boulter, T.; et al. A Multimodal Magnetic Resonance Imaging Study on Myalgic Encephalomyelitis/Chronic Fatigue Syndrome: Feasibility and Clinical Correlation. Medicina 2024, 60, 1370. https://doi.org/10.3390/medicina60081370
Kaur R, Greeley B, Ciok A, Mehta K, Tsai M, Robertson H, Debelic K, Zhang LX, Nelson T, Boulter T, et al. A Multimodal Magnetic Resonance Imaging Study on Myalgic Encephalomyelitis/Chronic Fatigue Syndrome: Feasibility and Clinical Correlation. Medicina. 2024; 60(8):1370. https://doi.org/10.3390/medicina60081370
Chicago/Turabian StyleKaur, Raminder, Brian Greeley, Alexander Ciok, Kashish Mehta, Melody Tsai, Hilary Robertson, Kati Debelic, Lan Xin Zhang, Todd Nelson, Travis Boulter, and et al. 2024. "A Multimodal Magnetic Resonance Imaging Study on Myalgic Encephalomyelitis/Chronic Fatigue Syndrome: Feasibility and Clinical Correlation" Medicina 60, no. 8: 1370. https://doi.org/10.3390/medicina60081370
APA StyleKaur, R., Greeley, B., Ciok, A., Mehta, K., Tsai, M., Robertson, H., Debelic, K., Zhang, L. X., Nelson, T., Boulter, T., Siu, W., Nacul, L., & Song, X. (2024). A Multimodal Magnetic Resonance Imaging Study on Myalgic Encephalomyelitis/Chronic Fatigue Syndrome: Feasibility and Clinical Correlation. Medicina, 60(8), 1370. https://doi.org/10.3390/medicina60081370