
Lymphocyte Inhibition Mechanisms and Immune Checkpoints in COVID-19: Insights into Prognostic Markers and Disease Severity

 ,
, 
Abstract
1. Introduction
2. Materials and Methods
2.1. Study Participants (Basic Characteristics)
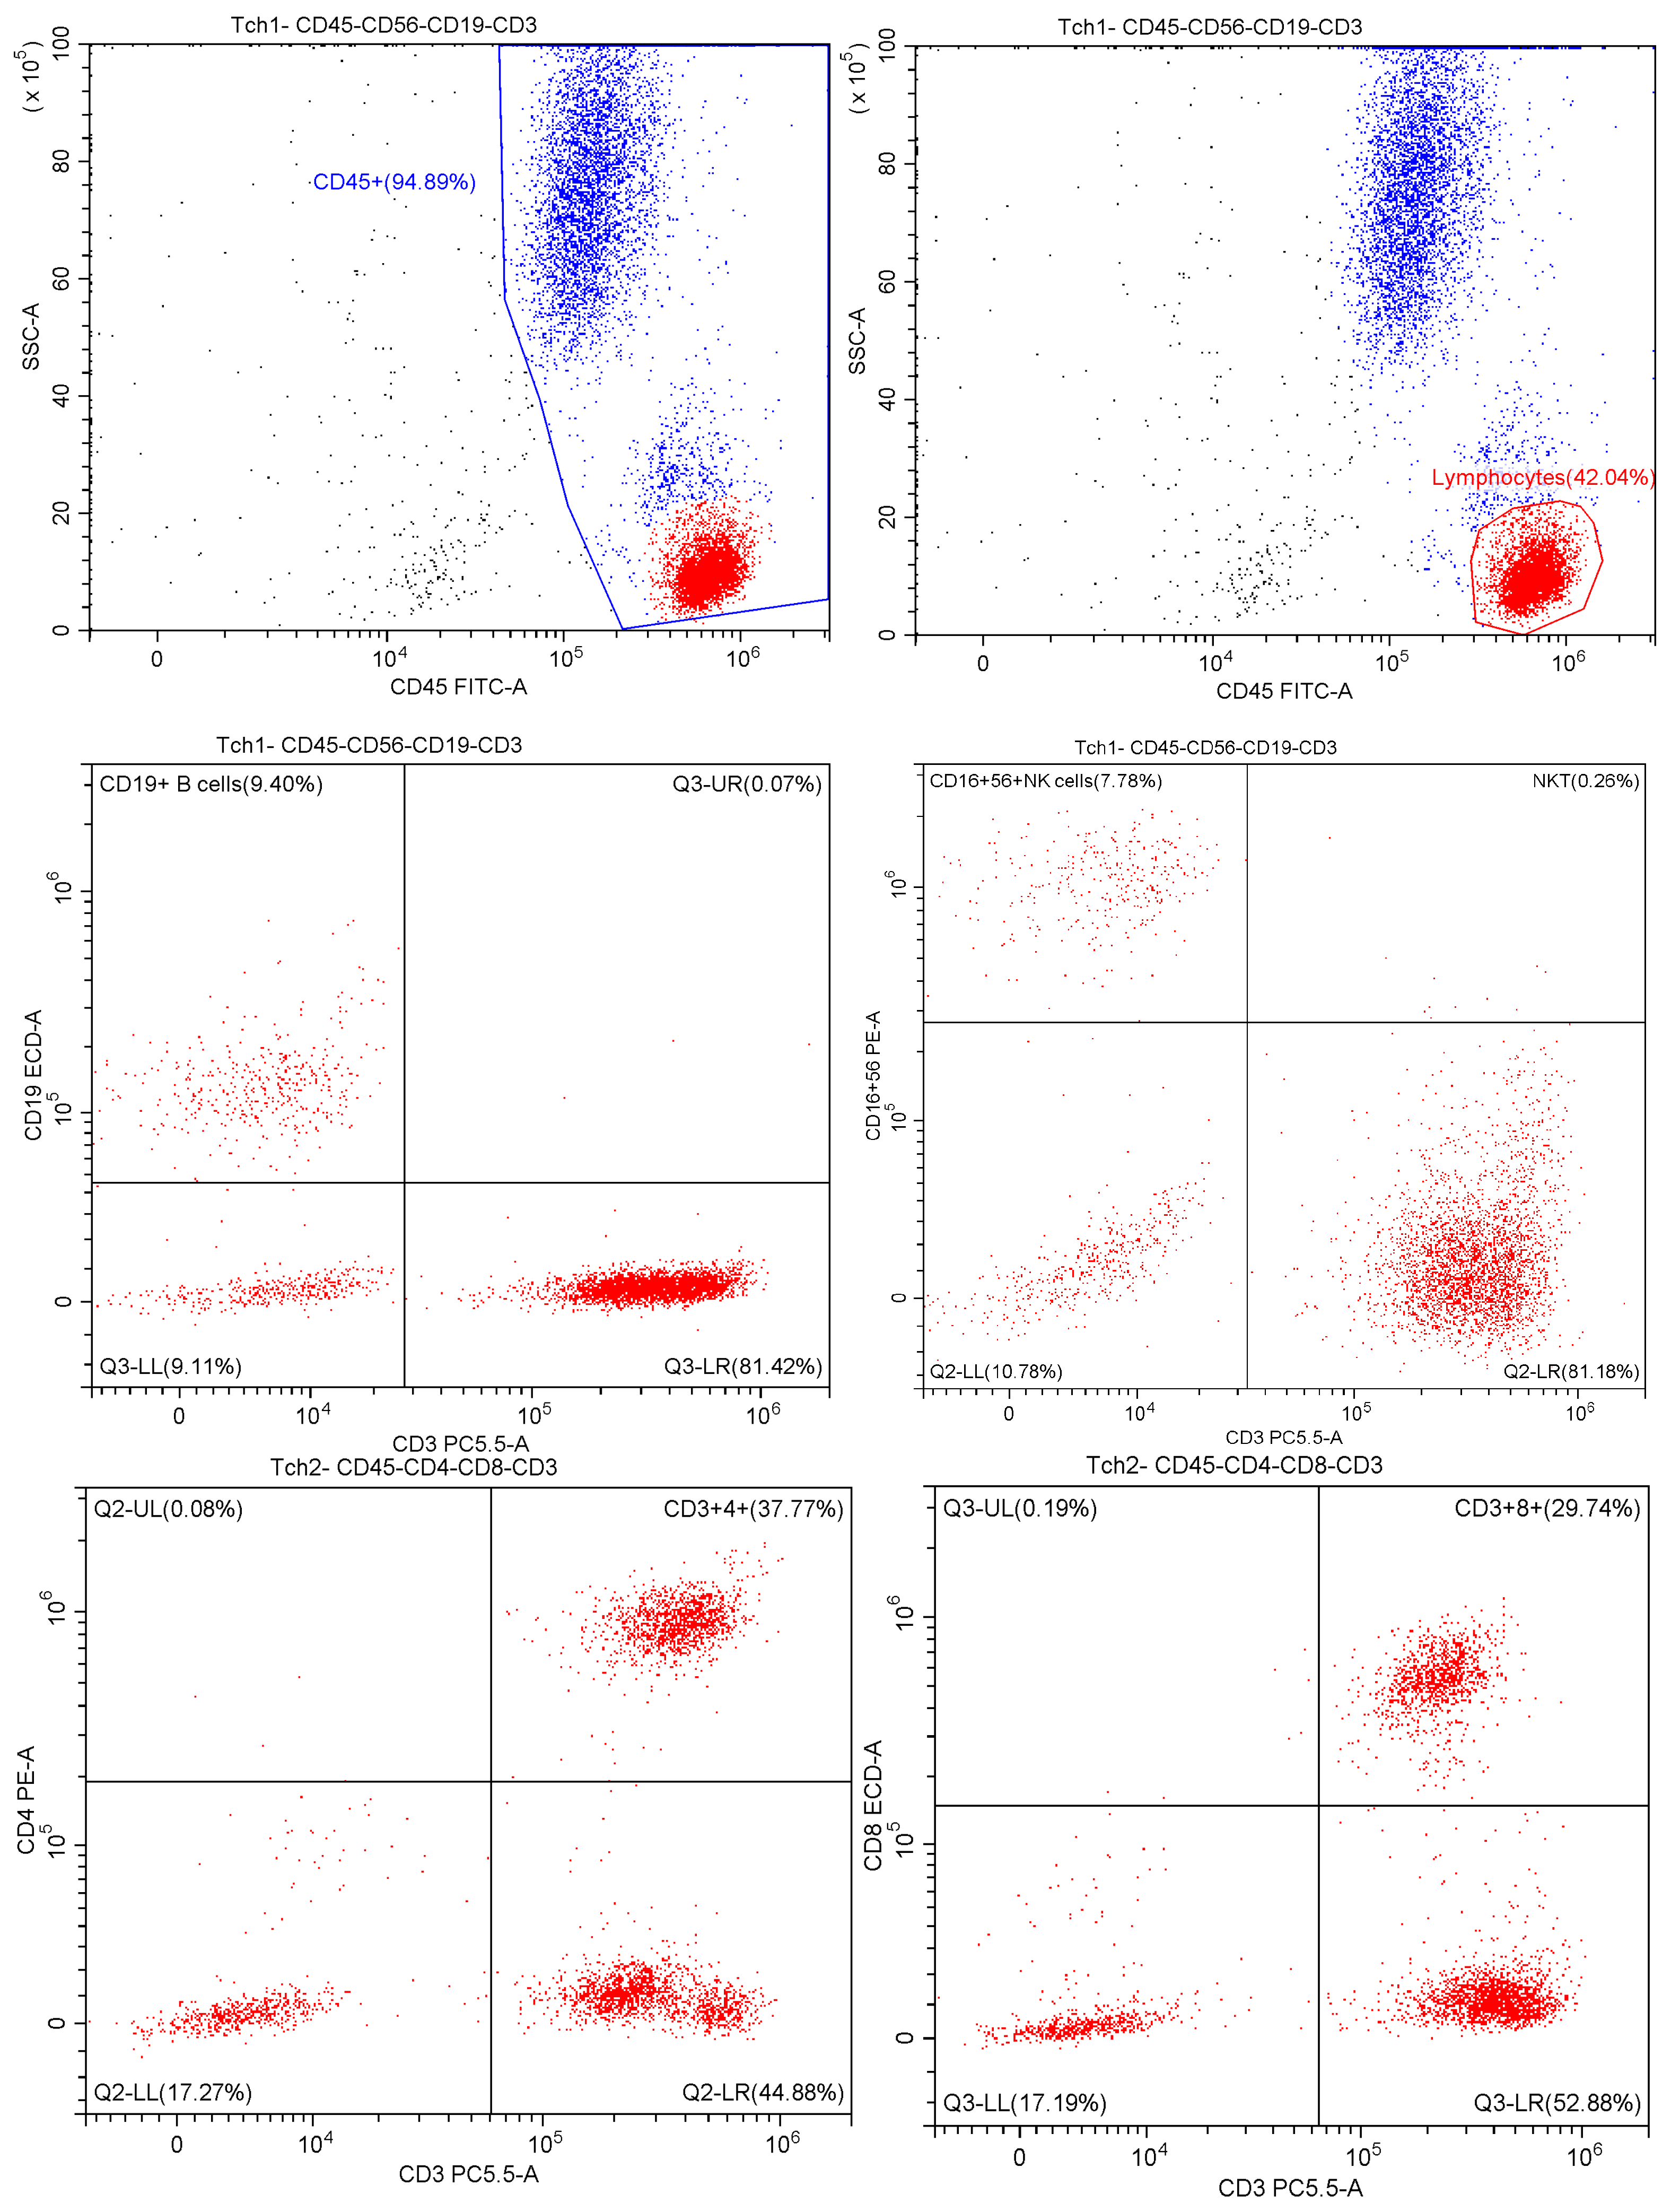
2.2. Multiparametric Flow Cytometry
2.3. Enzyme-Linked Immunosorbent Assay (ELISA)
2.4. Data Analysis
3. Results
3.1. Expression of PD-1 and TIM-3 in Patients with COVID-19 upon Hospital Admission
3.2. Expression of PD-1 and TIM-3 in Patients with COVID-19 After 1 Week
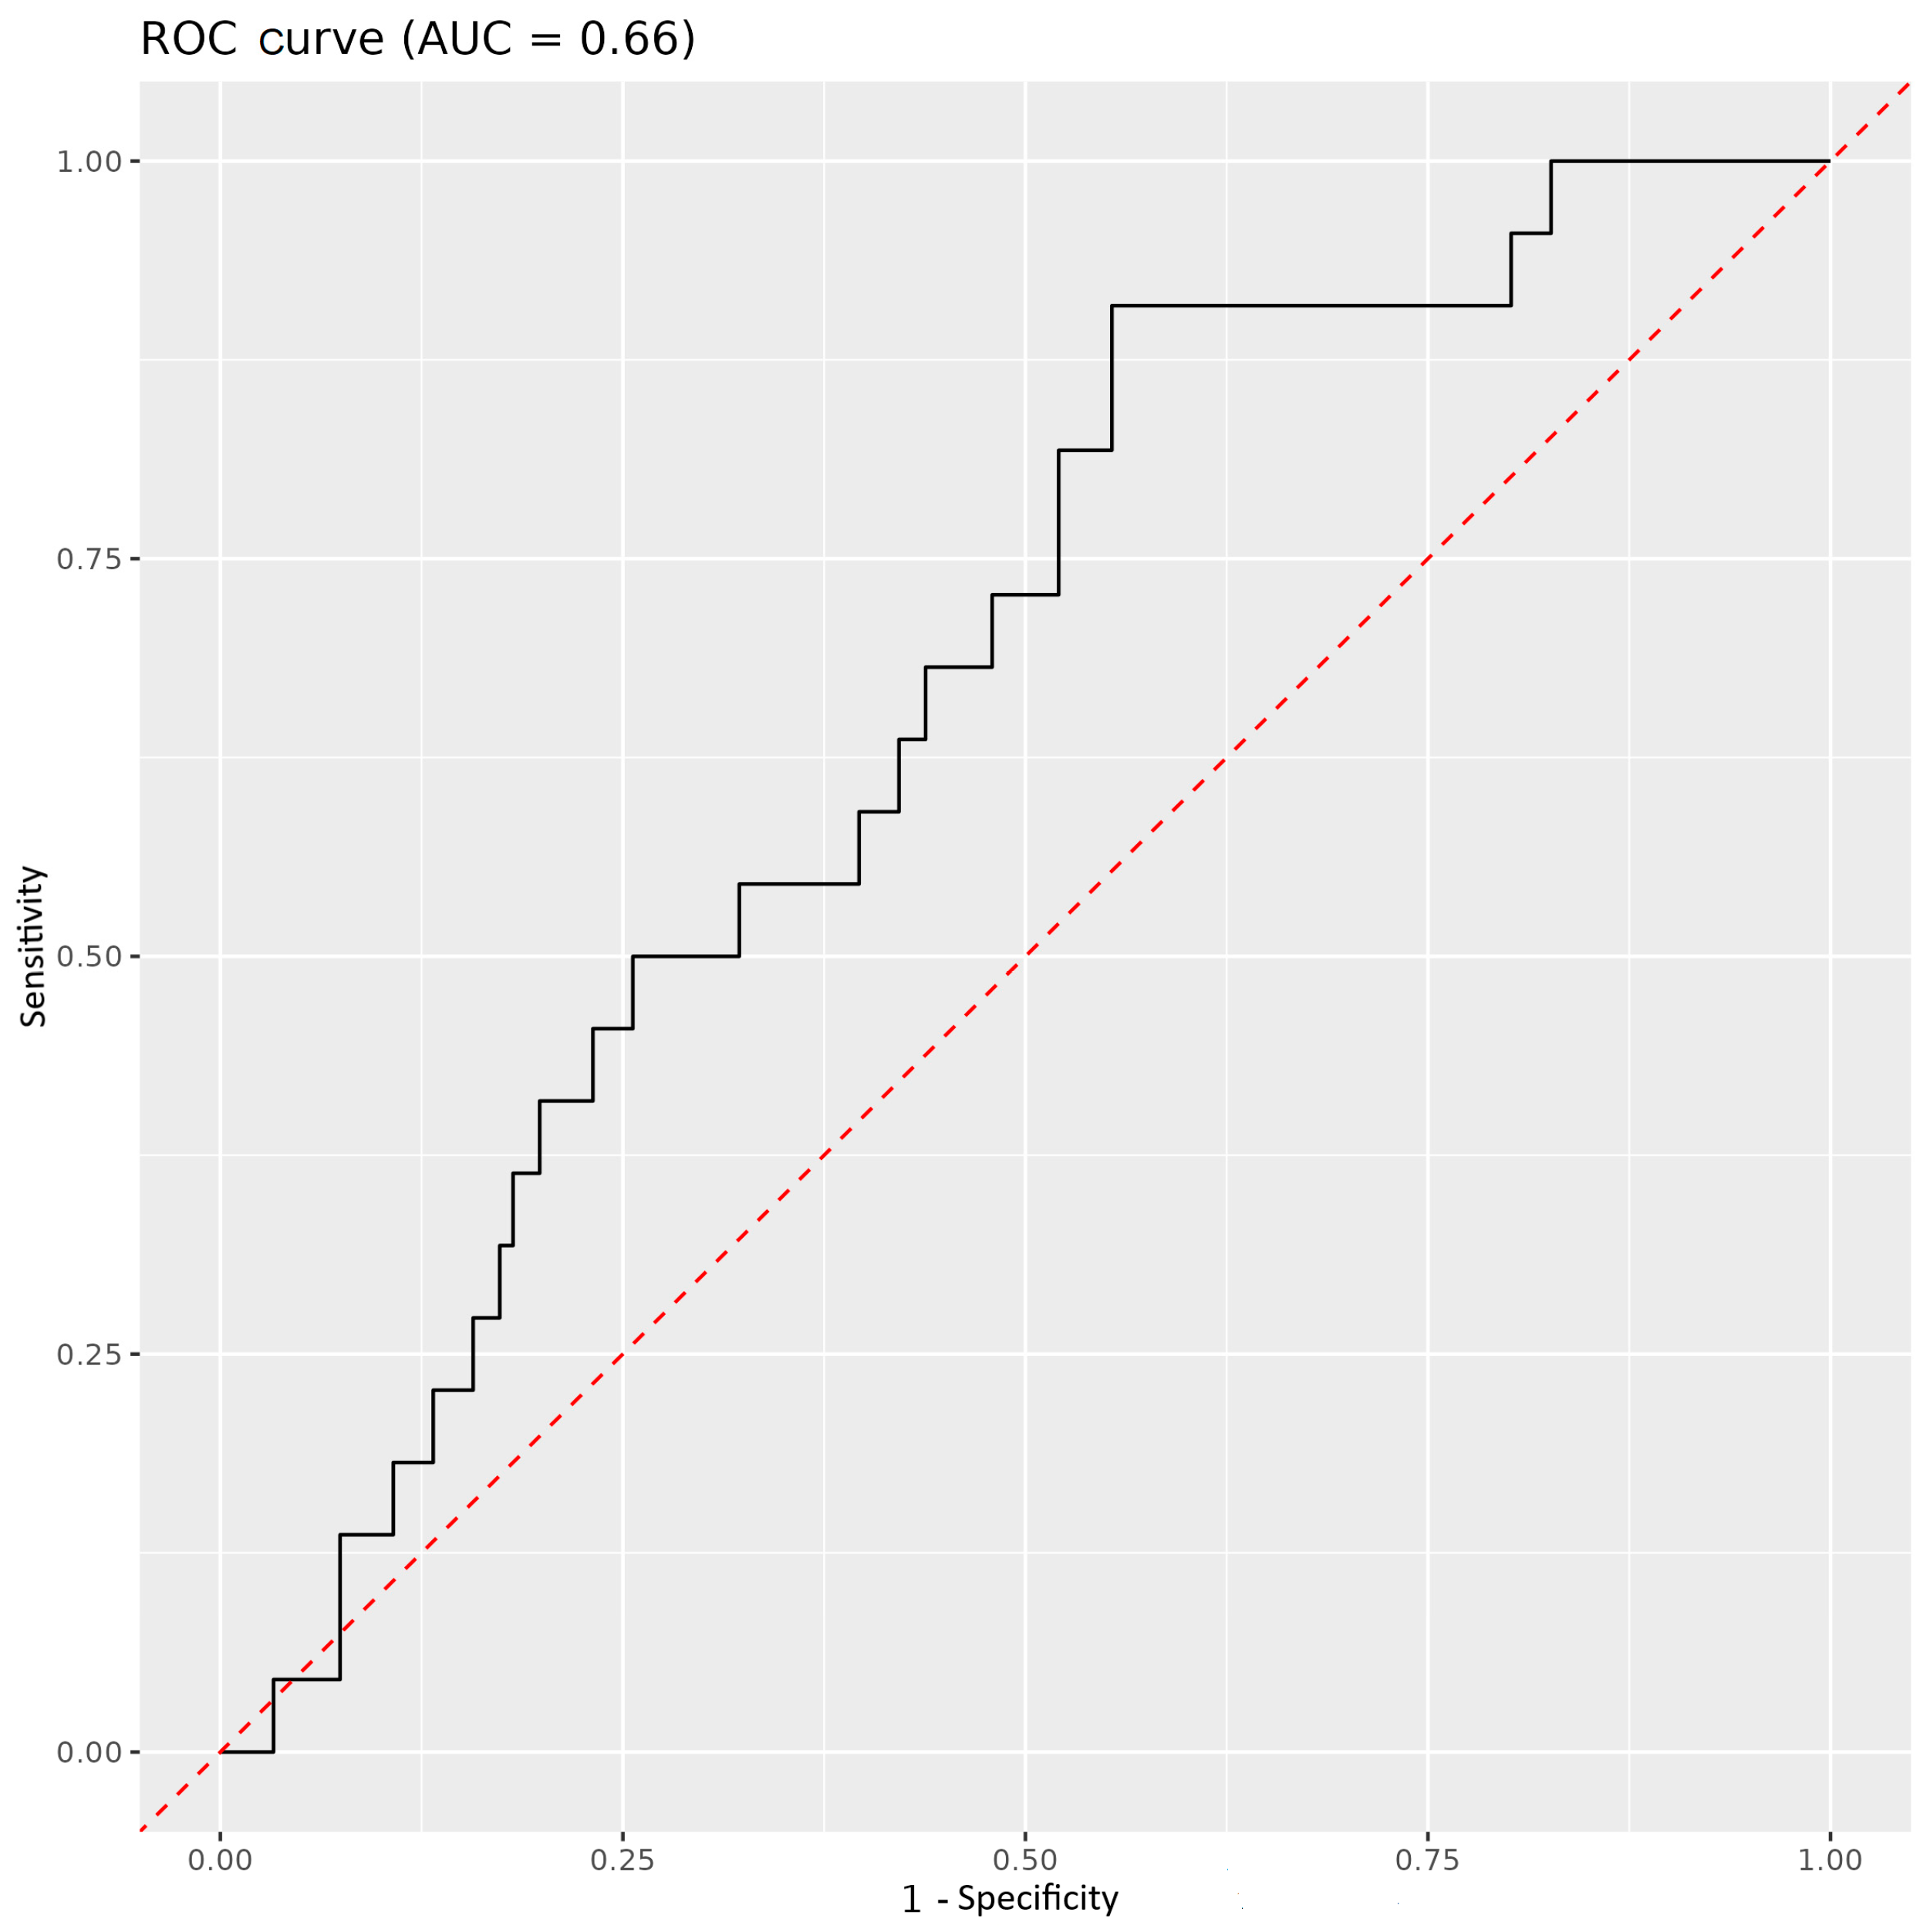
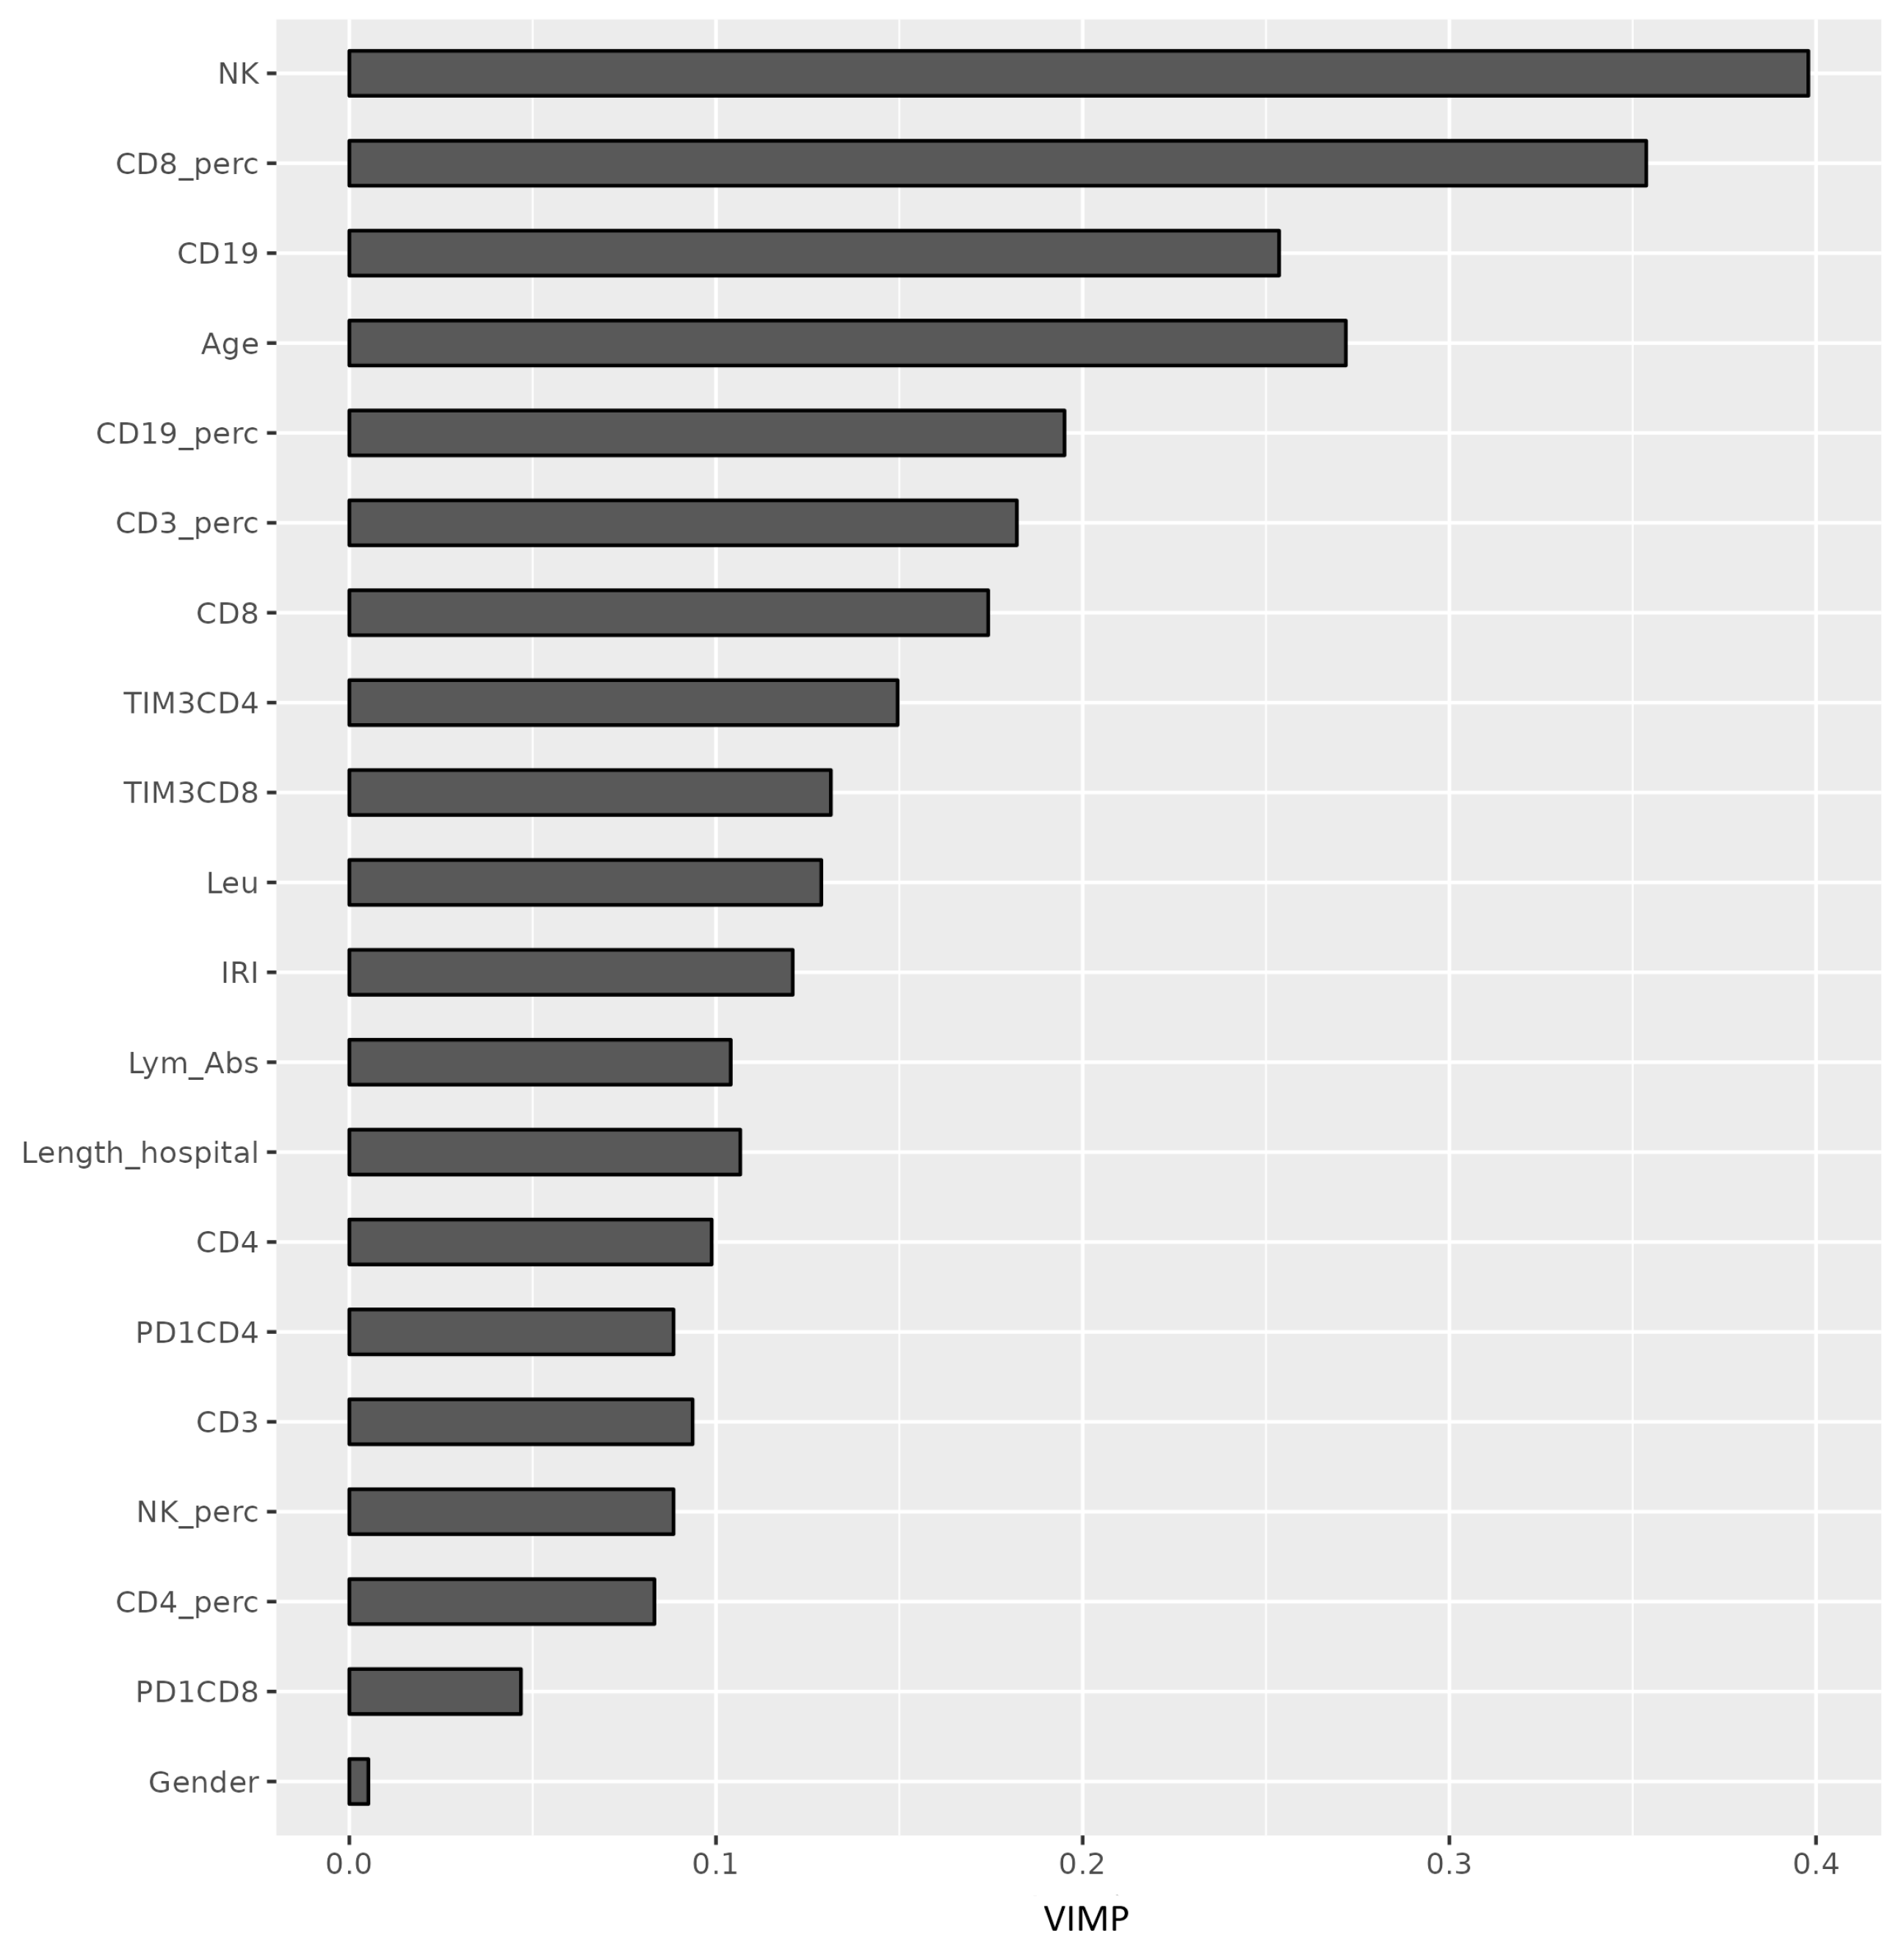
3.3. Immune Parameters as Predictors of COVID-19 Outcome
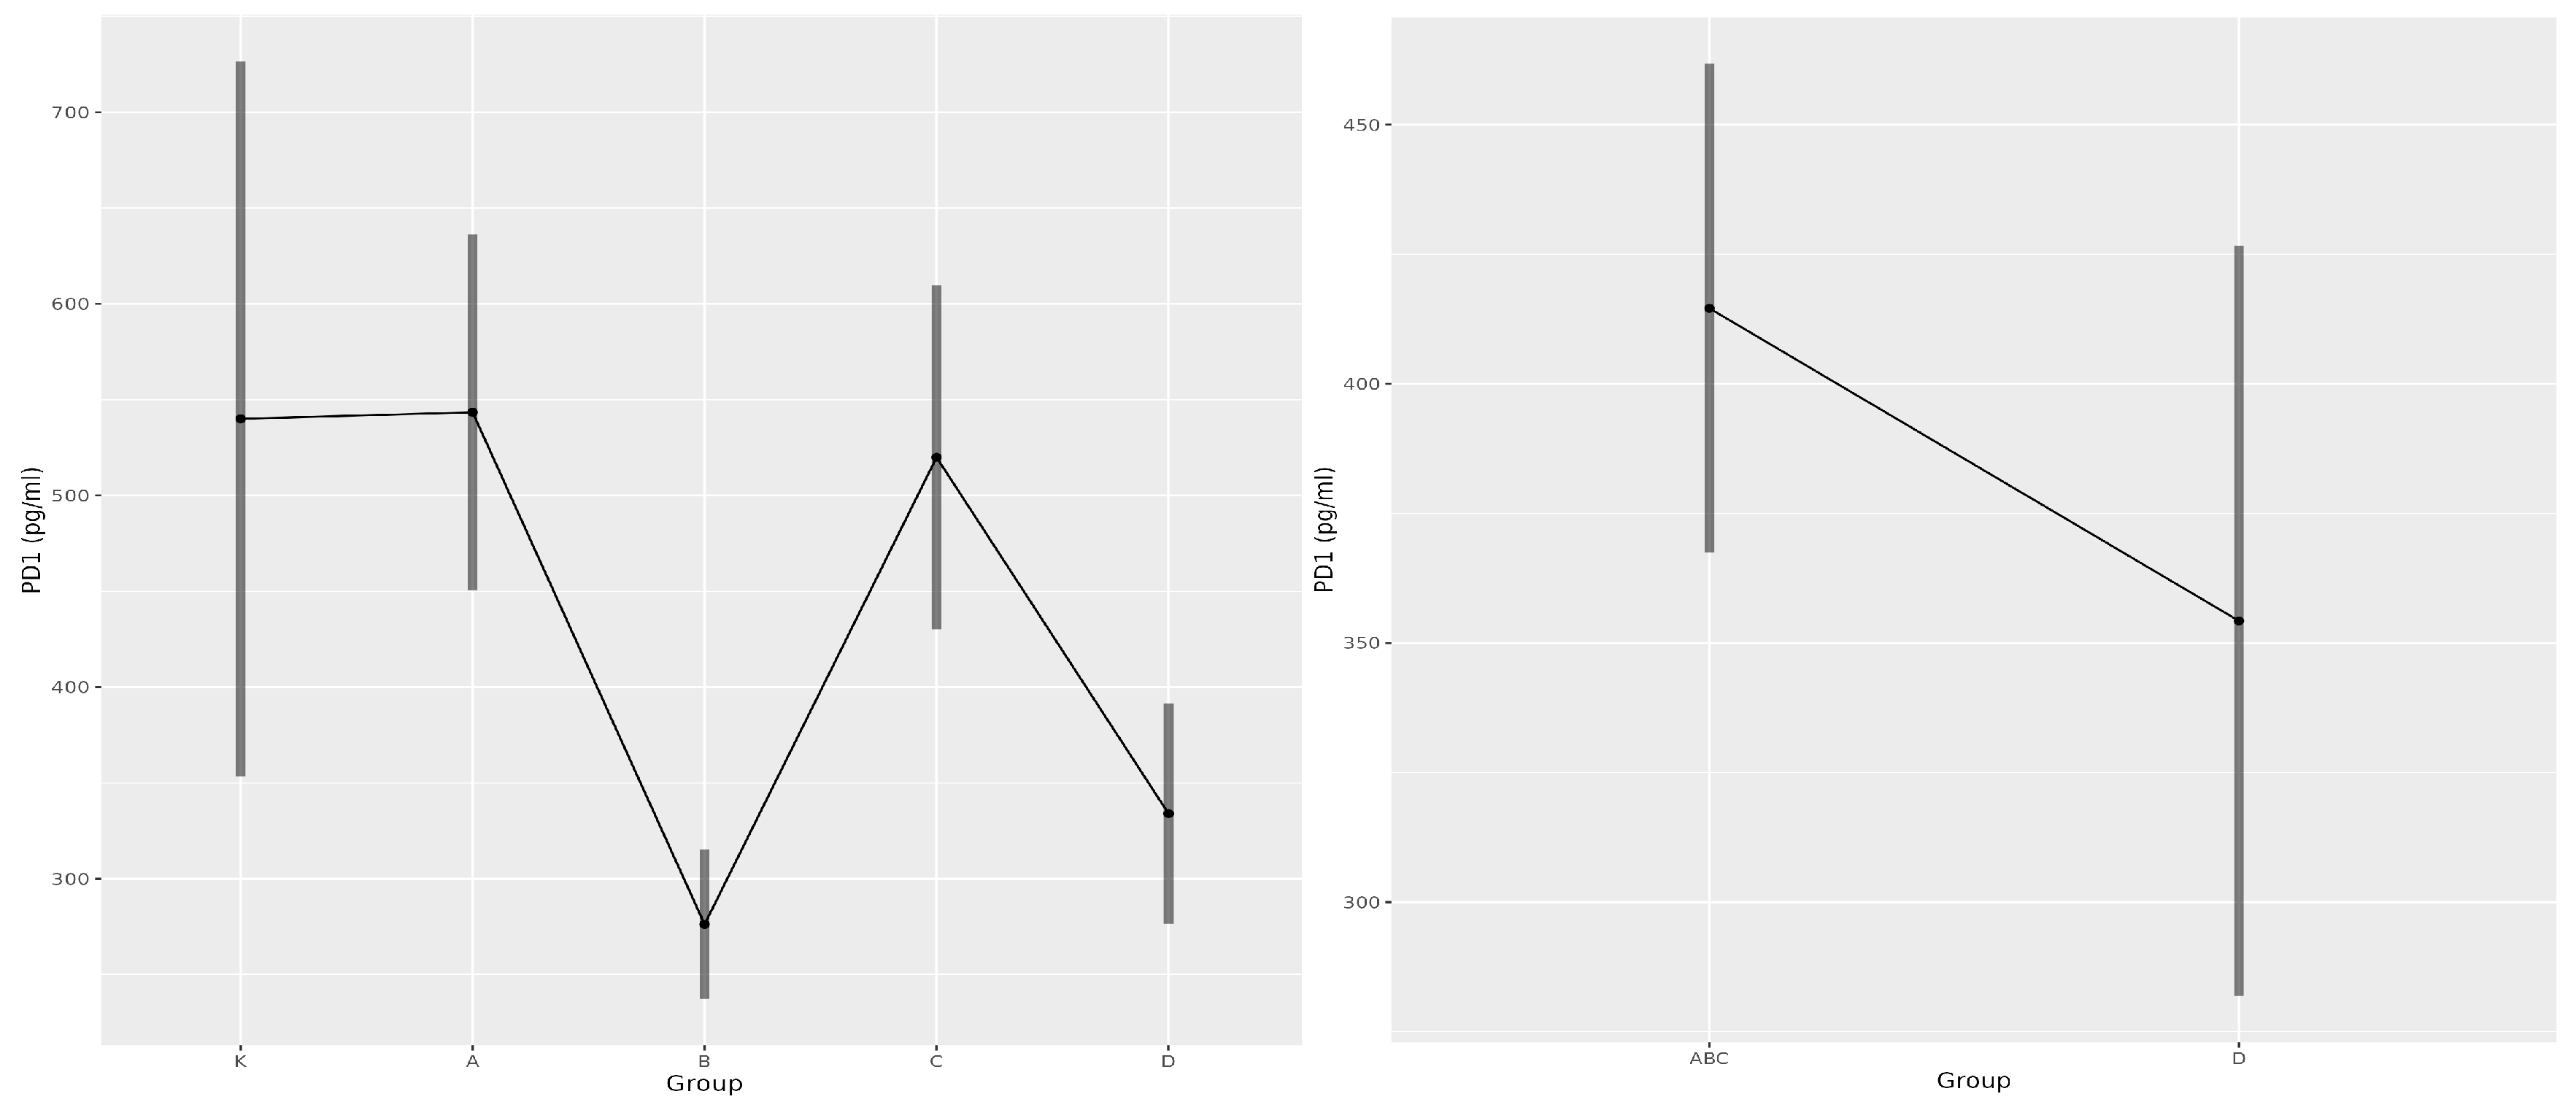
3.4. Soluble PD-1 as a Predictor of COVID-19
4. Discussion
5. Conclusions
Supplementary Materials
Author Contributions
Funding
Institutional Review Board Statement
Informed Consent Statement
Data Availability Statement
Conflicts of Interest
References
- Zhou, Y.; Fu, B.; Zheng, X.; Wang, D.; Zhao, C.; Qi, Y.; Sun, R.; Tian, Z.; Xu, X.; Wei, H. Pathogenic T-cells and inflammatory monocytes incite inflammatory storms in severe COVID-19 patients. Natl. Sci. Rev. 2020, 7, 998–1002. [Google Scholar] [CrossRef]
- Barnova, M.; Bobcakova, A.; Urdova, V.; Kosturiak, R.; Kapustova, L.; Dobrota, D.; Jesenak, M. Inhibitory immune checkpoint molecules and exhaustion of T cells in COVID-19. Physiol. Res. 2021, 70, S227–S247. [Google Scholar] [CrossRef] [PubMed]
- R Bonam, S.; Hu, H.; Bayry, J. Role of the PD-1 and PD-L1 axis in COVID-19. Future Microbiol. 2022, 17, 985–988. [Google Scholar] [CrossRef]
- Jesenak, M.; Brndiarova, M.; Urbancikova, I.; Rennerova, Z.; Vojtkova, J.; Bobcakova, A.; Ostro, R.; Banovcin, P. Immune parameters and COVID-19 infection – associations with clinical severity and disease prognosis. Front. Cell. Infect. Microbiol. 2020, 10, 364. [Google Scholar] [CrossRef]
- Cascella, M.; Rajnik, M.; Aleem, A.; Dulebohn, S.C.; Di Napoli, R. Features, evaluation, and treatment of coronavirus (COVID-19). In StatPearls; StatPearls Publishing: Treasure Island, FL, USA, 2024. [Google Scholar]
- Huang, Y.; Tu, M.; Wang, S.; Chen, S.; Zhou, W.; Chen, D.; Zhou, L.; Wang, M.; Zhao, Y.; Zeng, W.; et al. Clinical characteristics of laboratory confirmed positive cases of SARS-CoV-2 infection in Wuhan, China: A retrospective single center analysis. Travel. Med. Infect. Dis. 2020, 36, 101606. [Google Scholar] [CrossRef] [PubMed]
- Chen, G.; Wu, D.; Guo, W.; Cao, Y.; Huang, D.; Wang, H.; Wang, T.; Zhang, X.; Chen, H.; Yu, H.; et al. Clinical and immunological features of severe and moderate coronavirus disease 2019. J. Clin. Investig. 2020, 130, 2620–2629. [Google Scholar] [CrossRef]
- Chen, Z.; John Wherry, E. T cell responses in patients with COVID-19. Nat. Rev. Immunol. 2020, 20, 529–536. [Google Scholar] [CrossRef]
- Ding, Q.; Lu, P.; Fan, Y.; Xia, Y.; Liu, M. The clinical characteristics of pneumonia patients coinfected with 2019 novel coronavirus and influenza virus in Wuhan, China. J. Med. Virol. 2020, 92, 1549–1555. [Google Scholar] [CrossRef]
- For the Gansu Provincial Medical Treatment Expert Group of COVID-19; Yue, H.; Bai, X.; Wang, J.; Yu, Q.; Liu, W.; Pu, J.; Wang, X.; Hu, J.; Xu, D.; et al. Clinical characteristics of coronavirus disease 2019 in Gansu Province, China. Ann. Palliat. Med. 2020, 9, 1404–1412. [Google Scholar] [CrossRef] [PubMed]
- Diao, B.; Wang, C.; Tan, Y.; Chen, X.; Liu, Y.; Ning, L.; Chen, L.; Li, M.; Liu, Y.; Wang, G.; et al. Reduction and functional exhaustion of T cells in patients with coronavirus disease 2019 (COVID-19). Front. Immunol. 2020, 11, 827. [Google Scholar] [CrossRef]
- Tan, L.; Wang, Q.; Zhang, D.; Ding, J.; Huang, Q.; Tang, Y.-Q.; Wang, Q.; Miao, H. Lymphopenia predicts disease severity of COVID-19: A descriptive and predictive study. Signal Transduct. Target. Ther. 2020, 5, 33. [Google Scholar] [CrossRef]
- He, R.; Lu, Z.; Zhang, L.; Fan, T.; Xiong, R.; Shen, X.; Feng, H.; Meng, H.; Lin, W.; Jiang, W.; et al. The clinical course and its correlated immune status in COVID-19 pneumonia. J. Clin. Virol. 2020, 127, 104361. [Google Scholar] [CrossRef]
- Wang, F.; Nie, J.; Wang, H.; Zhao, Q.; Xiong, Y.; Deng, L.; Song, S.; Ma, Z.; Mo, P.; Zhang, Y. Characteristics of peripheral lymphocyte subset alteration in COVID-19 pneumonia. J. Infect. Dis. 2020, 221, 1762–1769. [Google Scholar] [CrossRef]
- Kuri-Cervantes, L.; Pampena, M.B.; Meng, W.; Rosenfeld, A.M.; Ittner, C.A.G.; Weisman, A.R.; Agyekum, R.S.; Mathew, D.; Baxter, A.E.; Vella, L.A.; et al. Comprehensive mapping of immune perturbations associated with severe COVID-19. Sci. Immunol. 2020, 5, eabd7114. [Google Scholar] [CrossRef] [PubMed]
- Beserra, D.R.; Alberca, R.W.; Branco, A.C.C.C.; De Mendonça Oliveira, L.; De Souza Andrade, M.M.; Gozzi-Silva, S.C.; Teixeira, F.M.E.; Yendo, T.M.; Da Silva Duarte, A.J.; Sato, M.N. Upregulation of PD-1 expression and high sPD-L1 levels associated with COVID-19 severity. J. Immunol. Res. 2022, 2022, 9764002. [Google Scholar] [CrossRef]
- Rha, M.-S.; Jeong, H.W.; Ko, J.-H.; Choi, S.J.; Seo, I.-H.; Lee, J.S.; Sa, M.; Kim, A.R.; Joo, E.-J.; Ahn, J.Y.; et al. PD-1-expressing SARS-CoV-2-specific CD8+ T cells are not exhausted, but functional in patients with COVID-19. Immunity 2021, 54, 44–52.e3. [Google Scholar] [CrossRef]
- Bobcakova, A.; Petriskova, J.; Vysehradsky, R.; Kocan, I.; Kapustova, L.; Barnova, M.; Diamant, Z.; Jesenak, M. Immune profile in patients with COVID-19: Lymphocytes exhaustion markers in relationship to clinical outcome. Front. Cell. Infect. Microbiol. 2021, 11, 646688. [Google Scholar] [CrossRef] [PubMed]
- Martín-Quirós, A.; Maroun-Eid, C.; Avendaño-Ortiz, J.; Lozano-Rodríguez, R.; Valentín Quiroga, J.; Terrón, V.; Montalbán-Hernández, K.; García-Garrido, M.A.; Muñoz del Val, E.; del Balzo-Castillo, Á.; et al. Potential role of the galectin-9/TIM-3 axis in the disparate progression of SARS-CoV-2 in a married couple: A case report. Biomed. Hub 2021, 6, 48–58. [Google Scholar] [CrossRef] [PubMed]
- Gu, D.; Ao, X.; Yang, Y.; Chen, Z.; Xu, X. Soluble immune checkpoints in cancer: Production, function and biological significance. J. Immunother. Cancer 2018, 6, 132. [Google Scholar] [CrossRef]
- Bailly, C.; Thuru, X.; Quesnel, B. Soluble programmed death ligand-1 (sPD-L1): A pool of circulating proteins implicated in health and diseases. Cancers 2021, 13, 3034. [Google Scholar] [CrossRef] [PubMed]
- Kong, Y.; Wang, Y.; Wu, X.; Han, J.; Li, G.; Hua, M.; Han, K.; Zhang, H.; Li, A.; Zeng, H. Storm of soluble immune checkpoints associated with disease severity of COVID-19. Signal Transduct. Target. Ther. 2020, 5, 192. [Google Scholar] [CrossRef] [PubMed]
- Gibellini, L.; De Biasi, S.; Paolini, A.; Borella, R.; Boraldi, F.; Mattioli, M.; Lo Tartaro, D.; Fidanza, L.; Caro-Maldonado, A.; Meschiari, M.; et al. Altered bioenergetics and mitochondrial dysfunction of monocytes in patients with COVID-19 pneumonia. EMBO Mol. Med. 2020, 12, e13001. [Google Scholar] [CrossRef] [PubMed]
- Lozano-Rodríguez, R.; Terrón-Arcos, V.; López, R.; Martín-Gutiérrez, J.; Martín-Quirós, A.; Maroun-Eid, C.; Del Val, E.M.; Cañada-Illana, C.; Pascual Iglesias, A.; Quiroga, J.V.; et al. Differential immune checkpoint and Ig-like V-type receptor profiles in COVID-19: Associations with severity and treatment. J. Clin. Med. 2022, 11, 3287. [Google Scholar] [CrossRef]
- Xu, J.; Wang, J.; Wang, X.; Tan, R.; Qi, X.; Liu, Z.; Qu, H.; Pan, T.; Zhan, Q.; Zuo, Y.; et al. Soluble PD-L1 improved direct ARDS by reducing monocyte-derived macrophages. Cell Death Dis. 2020, 11, 934. [Google Scholar] [CrossRef] [PubMed]
- Khan, M.; Zhao, Z.; Arooj, S.; Fu, Y.; Liao, G. Soluble PD-1: Predictive, prognostic, and therapeutic value for cancer immunotherapy. Front. Immunol. 2020, 11, 587460. [Google Scholar] [CrossRef]
- Yadaw, A.S.; Li, Y.; Bose, S.; Iyengar, R.; Bunyavanich, S.; Pandey, G. Clinical features of COVID-19 mortality: Development and validation of a clinical prediction model. Lancet Digit. Health 2020, 2, e516–e525. [Google Scholar] [CrossRef]
- Gao, Y.; Cai, G.-Y.; Fang, W.; Li, H.-Y.; Wang, S.-Y.; Chen, L.; Yu, Y.; Liu, D.; Xu, S.; Cui, P.-F.; et al. Machine learning based early warning system enables accurate mortality risk prediction for COVID-19. Nat. Commun. 2020, 11, 5033. [Google Scholar] [CrossRef]
- Moulaei, K.; Shanbehzadeh, M.; Mohammadi-Taghiabad, Z.; Kazemi-Arpanahi, H. Comparing machine learning algorithms for predicting COVID-19 mortality. BMC Med. Inform. Decis. Mak. 2022, 22, 2. [Google Scholar] [CrossRef]


| Group | Quantity | Age (Years) | Hospitalisation (Days) | Female | Male |
|---|---|---|---|---|---|
| K | 25 | 5 | |||
| Mean | 43.8 | 0 | 83.3% | 16.7% | |
| SD | 13.6 | 0 | |||
| Median | 44 | 0 | |||
| A | 51 | 49 | |||
| Mean | 64.2 | 8.6 | 51.0% | 49.0% | |
| SD | 13.6 | 5.33 | |||
| Median | 67 | 7 | |||
| B | 168 | 210 | |||
| Mean | 64.2 | 10.7 | 44.4% | 55.6% | |
| SD | 14.4 | 5.7 | |||
| Median | 65 | 9 | |||
| C | 30 | 60 | |||
| Mean | 61.4 | 21.7 | 33.3% | 66.7% | |
| SD | 13.7 | 13.4 | |||
| Median | 63.5 | 18.1 | |||
| D | 86 | 115 | |||
| Mean | 75.8 | 12.3 | 42.8% | 57.2% | |
| SD | 11.1 | 8.1 | |||
| Median | 76 | 10.1 |
| A (n = 100) | B (n = 378) | C (n = 90) | D (n = 201) | |
|---|---|---|---|---|
| Chronic ischaemic heart disease | 30 (30.0%) | 156 (41.3%) | 23 (25.6%) | 139 (69.2%) |
| Hypertension | 62 (62.0%) | 265 (70.1%) | 63 (70.0%) | 174 (86.6%) |
| Obesity | 17 (17.0%) | 135 (35.7%) | 42 (46.7%) | 58 (28.8%) |
| Arrhythmia | 12 (12.0%) | 65 (17.2%) | 6 (6.7%) | 57 (28.3%) |
| Chronic obstructive pulmonary disease | 8 (8.0%) | 39 (10.3%) | 8 (8.9%) | 28 (13.9%) |
| Stroke history | 6 (6.0%) | 22 (5.8%) | 9 (10.0%) | 38 (18.9%) |
| Cancer | 12 (12.0%) | 16 (4.2%) | 5 (5.6%) | 25 (12.4%) |
| Immunodeficiency | 1 (1.0%) | 1 (0.26%) | 5 (5.6%) | 3 (1.5%) |
| Pregnancy | 0 (0.0%) | 2 (0.52%) | 3 (3.3%) | 0 (0.0%) |
| Systemic corticosteroids | 42 (42.0%) | 339 (89.7%) | 86 (95.6%) | 172 (85.6%) |
| Antivirals (remdesivir, favipiravir) | 10 (10.0%) | 141 (37.3%) | 38 (42.2%) | 68 (33.8%) |
| Group | Quantity | N | Age (Years) | Female | Male |
|---|---|---|---|---|---|
| K | 11 | 4 (36.0%) | 7 (63.0%) | ||
| Mean | 41 | ||||
| SD | 11.89 | ||||
| Median | 38 | ||||
| A | |||||
| Mean | 36 | 63.61 | 18 (50.0%) | 18 (50.0%) | |
| SD | 14.88 | ||||
| Median | 63.5 | ||||
| B | |||||
| Mean | 38 | 66.31 | 19 (50.0%) | 19 (50.0%) | |
| SD | 14.61 | ||||
| Median | 69.5 | ||||
| C | 36 | ||||
| Mean | 63.97 | 11 (30.6%) | 25 (69.4%) | ||
| SD | 12.42 | ||||
| Median | 64 | ||||
| D | 35 | ||||
| Mean | 77.37 | 13 (37.1%) | 22 (62.9%) | ||
| SD | 10.81 | ||||
| Median | 77 |
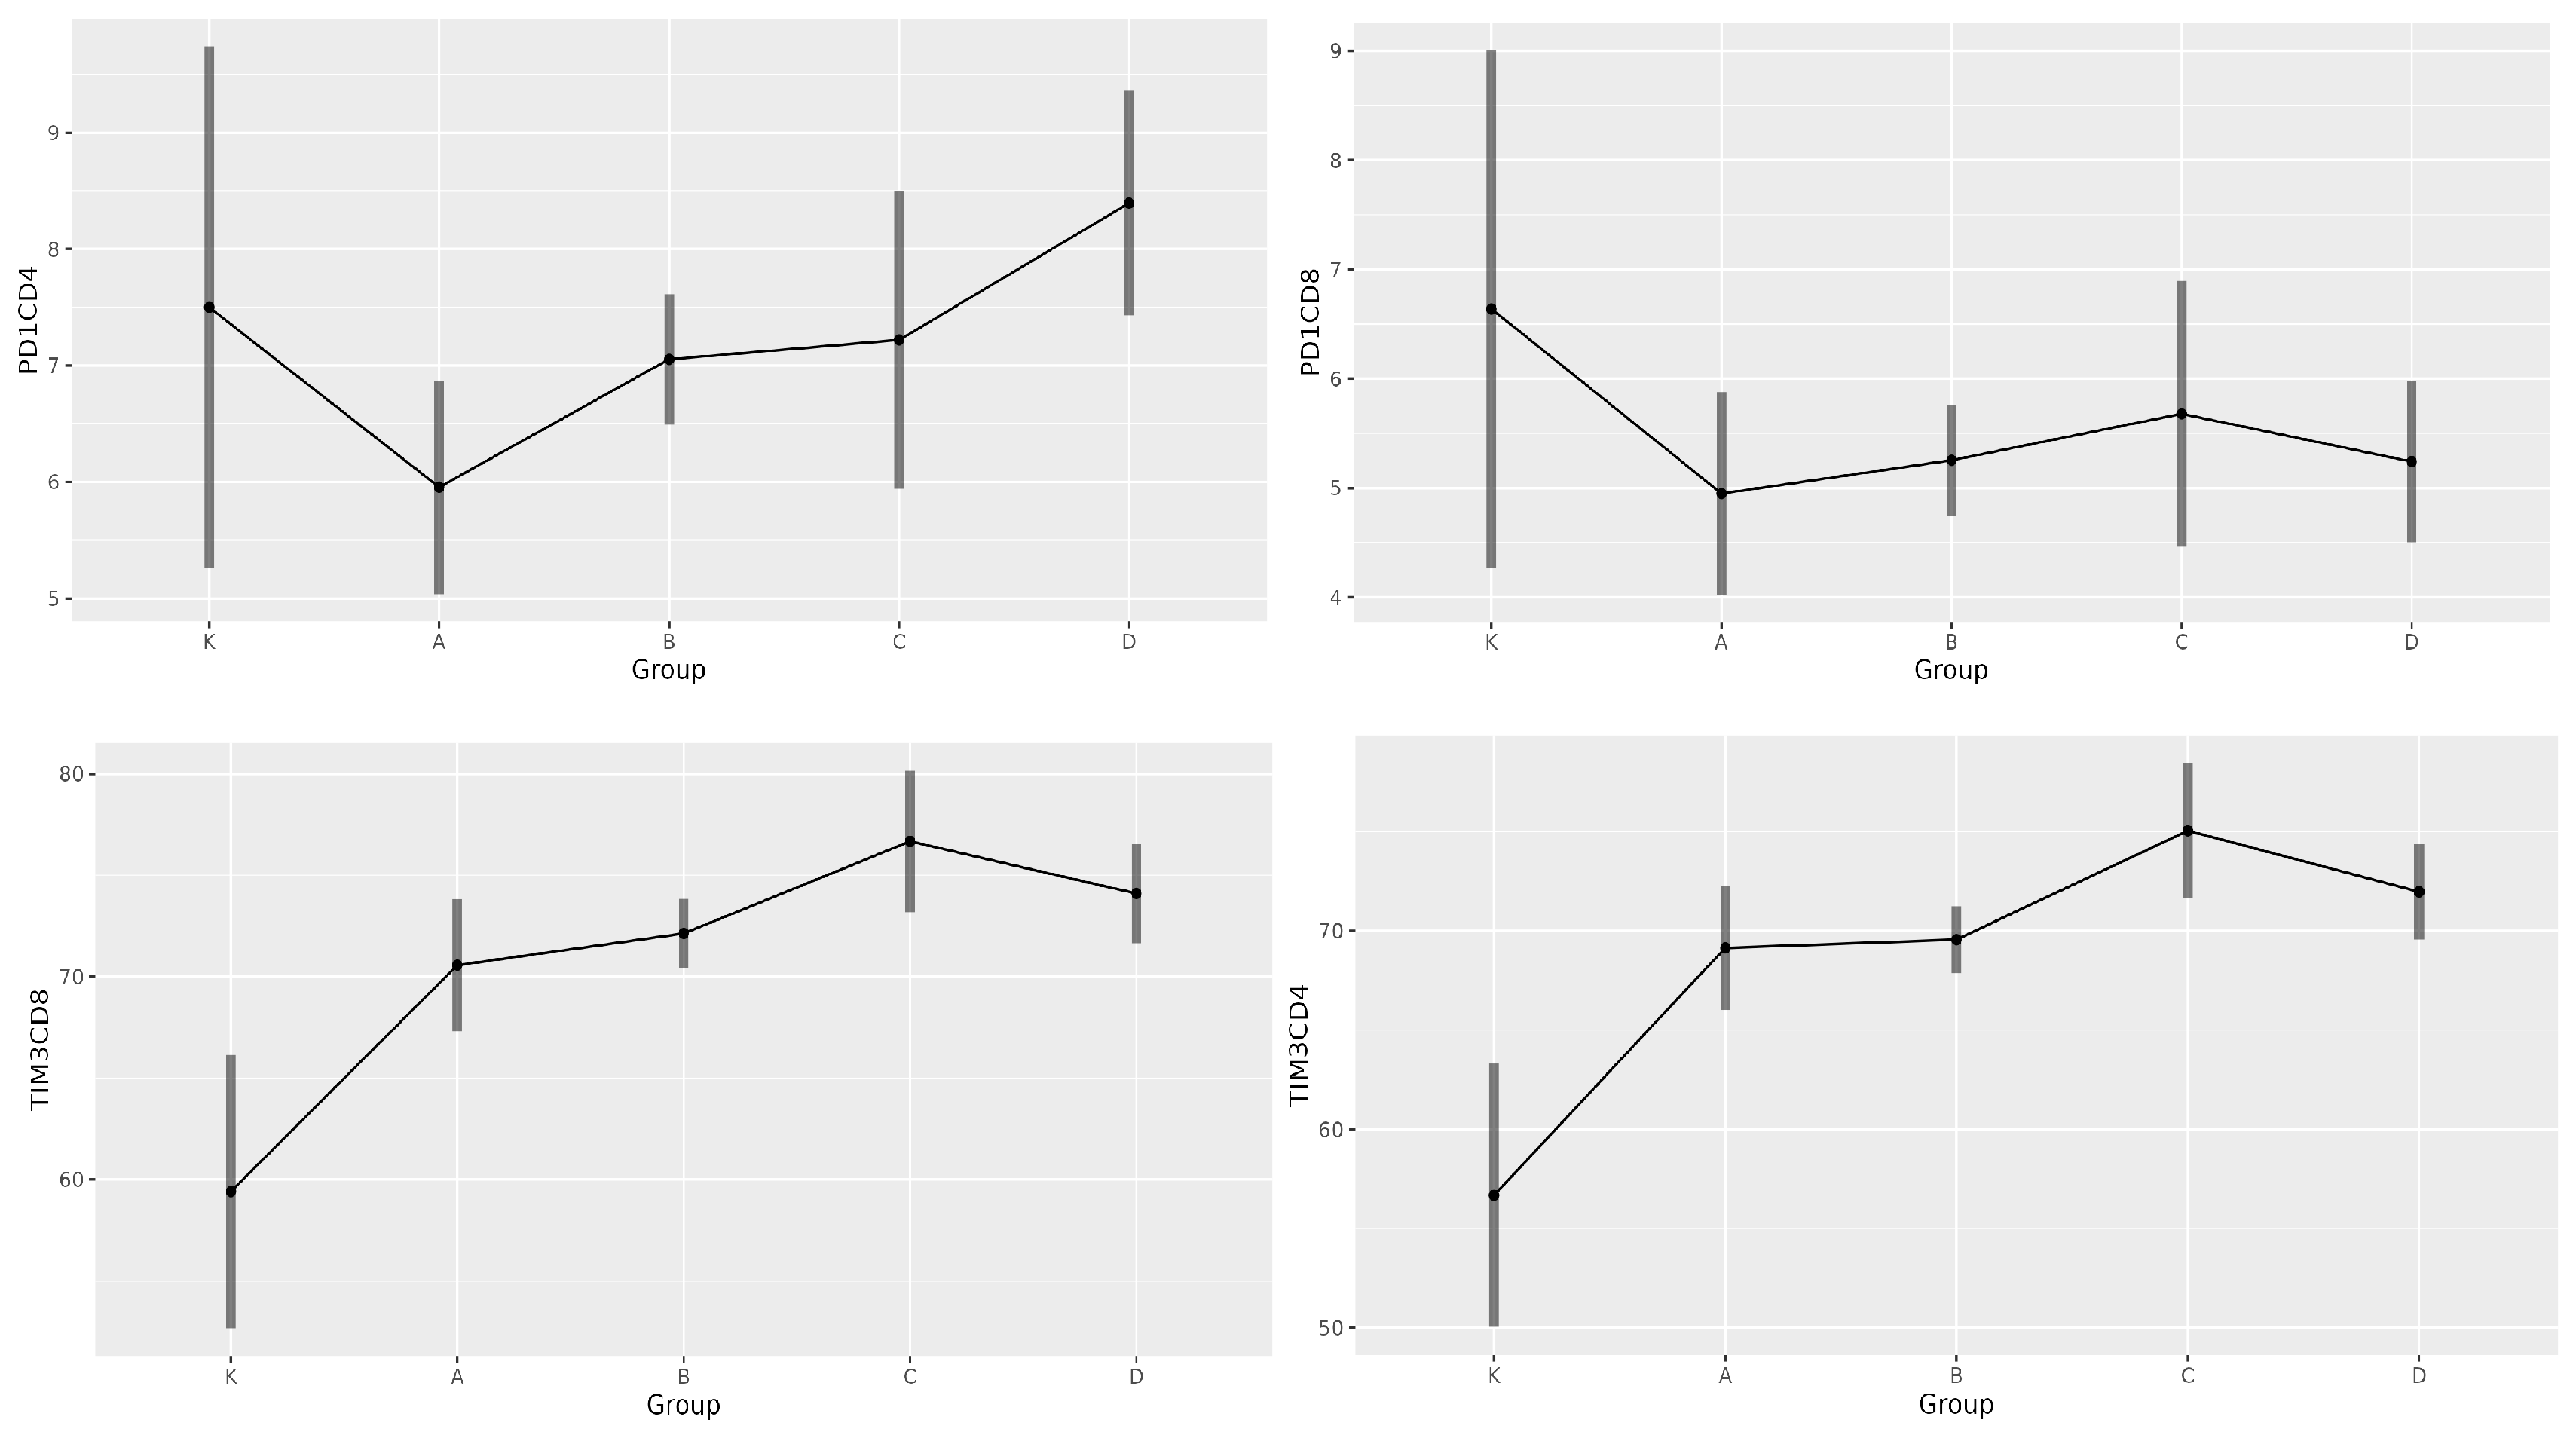
| Group | PD-1 CD4+ | PD-1 CD8+ | TIM-3 CD4+ | TIM-3 CD8+ |
|---|---|---|---|---|
| K | 7.5 | 6.6 | 56.7 | 59.2 |
| A | 5.9 | 4.9 | 69.2 | 70.6 |
| B | 7.0 | 5.2 | 69.6 | 72.1 |
| C | 7.2 | 5.6 | 75.0 | 76.6 |
| D | 8.4 | 5.2 | 71.9 | 74.1 |
| Variable | Contrast | Estimate | p Value | Lower CI | Upper CI |
|---|---|---|---|---|---|
| PD-1 CD4+ | A vs. D | −2.441 | 0.003 | −4.310 | −0.571 |
| TIM-3 CD4+ | K vs. A | −12.472 | 0.006 | −22.393 | −2.550 |
| K vs. B | −12.890 | 0.002 | −22.391 | −3.389 | |
| K vs. C | −18.369 | 0.000 | −29.278 | −7.460 | |
| K vs. D | −15.295 | 0.001 | −25.572 | −5.017 | |
| B vs. C | −5.479 | 0.039 | −10.788 | −0.171 | |
| TIM-3 CD8+ | K vs. A | −11.151 | 0.022 | −21.270 | −1.032 |
| K vs. B | −12.710 | 0.003 | −22.369 | −3.051 | |
| K vs. C | −17.250 | 0.000 | −28.363 | −6.137 | |
| K vs. D | −14.681 | 0.001 | −25.134 | −4.227 |
| Parameters | K | A | B | C | D |
|---|---|---|---|---|---|
| sPD-1 [pg/mL] | 567.6 | 610.1 | 317.4 | 613.1 | 490.2 |
Disclaimer/Publisher’s Note: The statements, opinions and data contained in all publications are solely those of the individual author(s) and contributor(s) and not of MDPI and/or the editor(s). MDPI and/or the editor(s) disclaim responsibility for any injury to people or property resulting from any ideas, methods, instructions or products referred to in the content. |
© 2025 by the authors. Published by MDPI on behalf of the Lithuanian University of Health Sciences. Licensee MDPI, Basel, Switzerland. This article is an open access article distributed under the terms and conditions of the Creative Commons Attribution (CC BY) license (https://creativecommons.org/licenses/by/4.0/).
Share and Cite
Schniederova, M.; Bobcakova, A.; Grendar, M.; Markocsy, A.; Ceres, A.; Cibulka, M.; Dobrota, D.; Jesenak, M. Lymphocyte Inhibition Mechanisms and Immune Checkpoints in COVID-19: Insights into Prognostic Markers and Disease Severity. Medicina 2025, 61, 189. https://doi.org/10.3390/medicina61020189
Schniederova M, Bobcakova A, Grendar M, Markocsy A, Ceres A, Cibulka M, Dobrota D, Jesenak M. Lymphocyte Inhibition Mechanisms and Immune Checkpoints in COVID-19: Insights into Prognostic Markers and Disease Severity. Medicina. 2025; 61(2):189. https://doi.org/10.3390/medicina61020189
Chicago/Turabian StyleSchniederova, Martina, Anna Bobcakova, Marian Grendar, Adam Markocsy, Andrej Ceres, Michal Cibulka, Dusan Dobrota, and Milos Jesenak. 2025. "Lymphocyte Inhibition Mechanisms and Immune Checkpoints in COVID-19: Insights into Prognostic Markers and Disease Severity" Medicina 61, no. 2: 189. https://doi.org/10.3390/medicina61020189
APA StyleSchniederova, M., Bobcakova, A., Grendar, M., Markocsy, A., Ceres, A., Cibulka, M., Dobrota, D., & Jesenak, M. (2025). Lymphocyte Inhibition Mechanisms and Immune Checkpoints in COVID-19: Insights into Prognostic Markers and Disease Severity. Medicina, 61(2), 189. https://doi.org/10.3390/medicina61020189