Abstract
Sargassum muticum (SM) poses a serious environmental issue since it is a fast-expanding invasive species occupying key areas of the European shoreline, disrupting the autochthonous algae species, and disturbing the ecosystem. This problem has concerned the general population and the scientific community. Nevertheless, as macroalgae are recognized as a source of bioactive molecules, the abundance of SM presents an opportunity as a raw material. In this work, response surface methodology (RSM) was applied as a tool for the optimization of the extraction of bioactive compounds from SM by microwave-assisted extraction (MAE). Five different parameters were used as target functions: yield, total phenolic content (TPC); and the antioxidant measurements of 2,2-diphenyl-1-picrylhydrazyl radical scavenging activity (DPPH), 2,2′-azino-bis (3-ethylbenzothiazoline-6-sulfonic acid) diammonium salt (ABTS), and β-carotene bleaching (BC). After the optimal extraction conditions were determined (time = 14.00 min; pressure = 11.03 bar; ethanol = 33.31%), the chemical composition and bioactivity of the optimum extract was evaluated to appraise its antioxidant capability to scavenge reactive species and as a potential antibacterial, antidiabetic, antiproliferation, and neuroprotective agent. The results lead to the conclusion that MAE crude extract has bioactive properties, being especially active as an antiproliferation agent and as a nitric oxide and superoxide radical scavenger.
1. Introduction
The number of marine macroalgae introduced into non-native ecosystems has drastically increased due to market globalization, global warming, and other economic activities such as aquaculture and tourism. These invasive species are defined as exotic or non-native species when they have been introduced in habitats different to their own or with unusual abundance and can cause a serious environmental impact by reducing the autochthonous biodiversity and causing a shift in trophic networks in the marine ecosystems that they colonize [1,2]. Alongside this ecological impact, the increased presence of invasive species also influences the economy as it affects the fishing industry, more precisely, fishermen’s equipment such as boats and nets.
Despite being an invasive brown macroalga from Japan, Sargassum muticum (Yendo) Fensholt (SM) is among the most prevalent Sargassum species on European coastlines [3]. This high pervasiveness can be explained by its monoecious characteristics allowing it to disperse reproductive fronds that spread up to 5 m to find another fertile alga, making it an extremely fast and efficient opportunist species [4,5,6]. SM occupies preferably tidal pools, where the water remains at low tide, and can form remarkably dense populations from spring to late summer in the coastal fringe, with depths of 10 m [4]. Several attempts to eradicate SM have been developed, but with little to no success. Consequently, seasonal harvesting of the alga was adopted [5]. This raw material was once often collected since it was utilized as fertilizer. However, because it requires manual labor and is reliant on the tide, this method was abandoned, not being able to compete with more modern, less expensive fertilizers [6].
So, there is a massive availability of SM material that is not currently being utilized but may have great potential since brown algae species are known to have compounds with biological properties [7]. Furthermore, with the growing interest in environmentally friendly materials there is an increased search for natural supplies, and brown macroalgae have been identified as a rich source of bioactive compounds with antitumor, anti-inflammatory, antioxidant, antidiabetic, antiproliferation, and antimicrobial activities [7,8,9,10,11,12]. In this sense, brown macroalga SM can fill the gap in natural bioactive compounds and be employed as an ingredient or functional food [8,13,14]. So, while it is critical to manage SM expansion sustainably, this species can provide a high-value raw material, contributing to the management of the ecosystem.
As a result, macroalgae, notably the invasive SM, have gained the interest of the scientific community and several high-profile companies. Several green alternative techniques have been used to extract bioactive compounds from brown macroalgae, namely, the microwave-assisted extraction (MAE) technique [15,16]. MAE presents several advantages over traditional extraction techniques, such as a short extraction time, low solvent consumption, selective heating, high extraction efficacy, and limited degradation of the desired compounds [14]. Response surface methodology (RSM) was chosen to optimize the MAE process. It is a well-established method for optimizing various processes, including extraction, drying, blanching, enzymatic hydrolysis, clarification, etc. [17].
Under this framework, and focusing on adding value to this alga, this study aimed to explore the antimicrobial, antioxidant, neuroprotective, antidiabetic, and antiproliferation effects of SM. RSM was used as a strategy to optimize MAE extraction yield, the total phenolic content (TPC), and the antioxidant capacity by DPPH and ABTS•+- scavenging activity, and β-carotene bleaching assay. Later, the optimized extract was characterized in terms of phenolic composition by HPLC MS/MS and used to test the mentioned biological properties [17].
As the antioxidant potential is associated with the control of excess reactive oxygen species (ROS), which are risk factors for numerous chronic and degenerative diseases, including cancer, respiratory, neurological, and digestive disorders [18], a series of bioactive tests were made in the optimized SM extract to explore its radical scavenging, and antimicrobial, neuroprotective, and antiproliferation activity.
2. Materials and Methods
2.1. Chemicals and Solutions
Carlo Erba Reagents S.A was used to acquire all solvents. Salicylic acid was obtained from Fisher Scientific in Leicestershire, UK, and hydrogen peroxide was purchased from Laborspirit in Lisbon, Portugal. The rest were purchased from Sigma-Aldrich (St. Louis, MO, USA, and Steinheim, Germany).
2.2. Algae Sampling and Preparation
In the winter season of 2019, Algamar (www.algamar.com accessed on 30 May 2024) manually collected samples of SM from the northwest coast of Spain, specifically Galicia. The collected samples (17 specimens) underwent a series of processing steps: sorting, classification, washing with tap water, and finally, lyophilization using a LyoAlfa10/15 system from Telstar, Thermo Fisher Scientific. After this, the samples were transformed into a fine powder using a blender and were stored at −80 °C until being used for extraction.
2.3. Optimization Procedure
2.3.1. Microwave-Assisted Extraction
The microwave-assisted extraction (MAE) was performed using a multiwave-3000 (Anton-Paar, Germany) in closed vessels. Briefly, the lyophilized SM was extracted with a solvent mixture (ethanol: water), with a solid to liquid ratio of 30 g/L. After the extraction, the samples were immediately put in an ice bath for 5 min. Later, the extracted samples were centrifuged at 9000 rpm for 15 min. The liquid phase was filtered (0.22 µm) and used to determine the extraction yield, the TPC, and the antioxidant capacity [19].
2.3.2. Experimental Design and Mathematical Modelling
A circumscribed central composite design (CCCD) with 5 levels was employed to optimize 3 independent variables: time (t or X1, 3 to 25 min), pressure (P or X2, 2 to 20 bar), and ethanol concentration (S or X3, 0 to 100%). This design generated 28 combinations of responses: twenty-two experiments were established by the interplay of these variables and six replicates of the central point (Table 1). There were five response variables, all quantified in dry weight (dw): Y1 (mg/g dw), that represents the extraction yield; Y2 (mg PGE/g dw), the TPC; Y3 (nM R•/g dw), the DPPH; Y4 (nM R•/g dw), the ABTS•+-RSA; and Y5 (µM BC/g dw), the BCM. The data were fitted to a polynomial model using the least squares regression technique, as indicated in Equation (1):
where Y represents the dependent variable (response variables Y1 to Y5) and Xi and Xj are independent variables. On the other hand, b0 and bi correspond to the constant and linear effect coefficients, respectively; bij, bii, biijj, and biii are the linear interactive, quadratic, quadratic interactive, and cubic effects between the response variables, respectively; and n is the number of variables.

Table 1.
Experimental RSM results of the CCCD for the MAE optimization of the independent variables (X1, X2, and X3) for the five assessed responses (yield, TPC, DPPH, ABTS, and BCM). Variables are presented in natural values and codified ranges.
2.3.3. Response Variables
Extraction Yield
The extraction yield was calculated as the relation between the dry weight of the crude extract and the mass of lyophilized alga used in each extraction point in mg/g. Briefly, crucibles were prepared (104 °C, 1–2 h) and weighed. Then, 5 mL of the extracted solution was added and put in the oven for 24 h (TCF forced air oven, Argo lab). After that time, the crucibles were cooled down in the desiccator and weighed to obtain the extraction yield.
Phytochemical Content
The total polyphenol content (TPC) of SM extracts was assessed using the Folin–Ciocalteu method with no modifications [20]. The results are given in mg of phloroglucinol equivalent (PGE)/g dw. All the tests were conducted in triplicate.
Antioxidant Activity
DPPH: The antioxidant capacity based on this method was performed based on a previously published work [21]. The results are expressed in nM DPPH/g extract dw.
ABTS•+ assay: This technique was carried out as described by Viacava et al. [22]. The results are expressed in nM ABTS•+/g alga extract dw.
β-Carotene bleaching method (BCM): This methodology was described previously [23]. The results’ units are in µM BC/g alga extract dw.
All the microscale analytical determinations were made in a Multi-Modal Synergy ™ HTX microplate reader at least in triplicate.
2.3.4. Statistical Evaluation
All the statistical results, fitting procedures, and coefficient values were calculated using a Microsoft Excel spreadsheet. DeltaGraph v7 was used to create the graphic illustrations from the obtained data. The statistical evaluation of the experimental results for the optimization was performed as follows: (a) Coefficient determination: minimizing the sum of the quadratic differences between the obtained and predicted values to obtain the parametric estimates, using the least squares method (quasi-Newton) by the “solver” macro in Microsoft Excel; (b) Coefficients’ significance: the confidence intervals were calculated using “SolverAid” to obtain the coefficients’ significance, discarding the non-statistically significant terms for the p-value (p > 0.05); (c) Model consistency: Fisher’s F test (α = 0.05) was used to determine if the built models correctly described the obtained data; and (d) Other statistical evaluation criteria: “SolverStat” (prediction uncertainties of parameters and models) and the R2 value were used to confirm the homogeneity of the model (percentage of adaptability of each dependent variable explained by the model).
2.4. Chemical Characterization by HPLC-ESI-QqQ-MS/MS
The analysis of the phenolic profile was carried out using high-performance liquid chromatography (Dionex Ultimate 3000UPLC+ system, Thermo Scientific, Waltham, MA, USA) coupled with a triple quadrupole tandem mass spectrometer (Thermo Scientific TSQ Quantis, San Jose, CA, USA) equipped with a working electrospray ion (ESI) source in negative/positive mode (HPLC-ESI-QqQ-MS/MS). Compounds were separated using a Phenomenex nucleosil C18 column (5 μm, 100 Å, 4.6 mm × 150 mm) thermostatic at 40 °C.
The solvents used were (A) 0.1% formic acid in water and (B) acetonitrile in the following elution gradients: 15% B (5 min), 15–35% B (5 min), 35–70% B (10 min), 70–90% B (4 min), 90–15% B (1 min), and 15% B (5 min). A flow rate of 0.3 mL/min was used and the sample injection volume was 20 μL. For mass detection, the following parameters were used as universal conditions: sheath gas—30 Ar; auxiliary gas—10 Ar; ion transfer tube temperature: 325 °C; and vaporizer temperature: 350 °C.
Mass analysis was performed using a selected reaction monitoring (SRM) system and parameters (precursor/product ion, retention time, collision energy, and RF lens voltage) were optimized for each compound. The chemical compounds detected were classified into the following classes: alkaloids, flavonoids, phenolic acids, flavonoids, tannins, and terpenes. The semi-quantification of these classes was determined according to the calibration curve of the following standards, respectively: caffeine, epigallocatechin, gallic acid, ferulic acid, phloroglucinol, and genipin. The results are expressed in mg per g of extract (mg/g E) and data acquisition was performed using the Xcalibur 4.1 software.
2.5. Evaluation of the Biological Properties of the Optimum Extract
2.5.1. Antioxidant Activity (ROS and RNS)
Superoxide Antiradical Activity
To appraise the superoxide (O2●–) antiradical activity, the methodology described by Oliveira and colleagues [24] was adopted. SM extracts were dissolved in KH2PO4/K2HPO4 buffer (19 mM; pH 7.4). Half-maximal inhibitory concentration (IC50, µg/mL) values were determined to express the results.
Hydrogen Peroxide Scavenging Activity
The H2O2 scavenging ability was determined based on the decrease in the signal at 230 nm, according to previous methods [25,26]. A blank sample was made for each dilution by replacing H2O2 solution with the buffer, and buffer solution was used as the negative control. The results are expressed as IC50 (µg/mL).
Hydroxyl Antiradical Scavenging Activity
Hydroxyl radical scavenging (●HO) was performed based on the salicylic acid method [27], as described formerly, with some modifications [28]. Sample blanks were prepared by replacing H2O2 with demineralized water, and the alga extract with water in negative controls. The results are expressed as IC50 (µg g/mL).
Nitrogen Oxide Antiradical Scavenging Activity
●NO scavenging activity was estimated based on a diazotization reaction [29,30]. Briefly, six different concentrations of SM extract were tested. Buffer alone was used as a negative control, and 2% phosphoric acid was added to the blank. The results are expressed as IC50 (µg/mL). Ascorbic acid was used as the reference control for all antioxidant assays.
2.5.2. Antimicrobial Activity Assay
Microorganisms and Cultures
Active cultures of the Gram-positive bacteria Staphylococcus aureus (ATCC 25923), Staphylococcus epidermidis (NCTC 11047), and Bacillus cereus (ATCC 14579), and Gram-negative bacteria Pseudomonas aeruginosa (ATCC 10145), Salmonella enteritidis (ATCC 13076), and Escherichia coli (NCTC 9001), were grown in Mueller–Hinton broth (MHB) overnight at 37 °C. After, the inoculum concentration was set to 0.1 ± 0.01 optical density at 600 nm (0.5 MacFarland standard) by dilution in fresh MHB [31].
Extract Preparation
The optimum extract of SM was lyophilized and dissolved in dimethyl sulfoxide (DMSO) to a 20 mg/mL concentration. Later, the solubilized extract was disinfected by filtration (0.20 µm sterile syringe filter).
Minimal Inhibitory Concentration
The minimal inhibitory concentration (MIC) test was performed by the microdilution method, adapted from previously described work [31]. Sample blanks, sterile medium with extract, positive controls prepared with inoculated medium, and negative controls with lactic acid (40%) were included in each test. An inhibition halo assay was performed following the methodology previously described with no adaptations [32].
2.5.3. Enzyme Inhibition Assays
Cholinesterase Inhibition Assay
The acetylcholinesterase (AChE) and buthyrylcholinesterase (BuChE) inhibition methodology was firstly reported by Ellman et al. and based on the measurement of the thiocholine released during the acetylthiocholine/butyrylthiocoline hydrolysis under the influence of AChE or BuChE, respectively [33,34]. Galantamine was used as a positive control and buffer as a negative control. The results are expressed as IC50 µg/mL.
Monoamino Oxidase A and B Inhibition Assay
Monoamine oxidase A (MAO-A) and B (MAO-B) inhibition activity promoted by SM extracts was evaluated by measuring the production of 4-hydroxyquinoline at 314 nm for 70 min, using kynuramine (3.75 mM) as the substrate, according to previously published work [30,35]. Clorgyline was the positive control whereas negative controls and blanks were prepared by substituting extracts or enzymes with buffer, respectively. The results are expressed as IC50 µg/mL.
Tyrosinase Inhibition Assay
Tyrosinase inhibition was determined in accordance with Masuda et al. [36]. Blanks were prepared by substituting L-DOPA with buffer and kojic acid was employed as the test validation control. The results are expressed as IC50 µg/mL.
α-Amilase Inhibition Assay
The analysis of α-amylase activity was performed according to previous methods [37]. Briefly, 100 μL of extract and 100 μL of 1% starch solution were incubated for 10 min at RT. A volume of 100 μL porcine pancreatic α-amylase (0.5 mg/mL) was added and samples were incubated for an additional 10 min. Samples, starch, and enzyme solutions were prepared in 20 mM phosphate buffer also containing 6 mM of NaCL at pH 6.9. After, 200 μL of dinitrosalicylic acid color reagent was added to stop the reaction (100 °C for 5 min). Samples were cooled to RT, and 50 μL of each sample and 200 μL of water were added to the microplate and read at 540 nm. Blank values were subtracted from each well and the results were compared with the control [37] and the results are expressed as IC50 µg/mL.
2.5.4. Antiproliferative Activity
The sulforhodamine B (SRB) method was used to evaluate the antiproliferative activity following a previously described procedure [38]. The activity was tested against human tumor cell lines A549 (lung adenocarcinoma), HepG2 (hepatocellular carcinoma), and AGS (gastric adenocarcinoma), and a non-tumor cell line obtained from African green monkey kidney (Vero), and ellipticine was used as a positive control [39].
All the described biological property tests were made in at least triplicate and the microscale methods were carried out in a SynergyHT (BioTek Instruments) microplate reader; the half-maximal concentration (IC50 or GI50) was calculated using the GraphPad Prism8 software after fitting the experimental data to the Weibull equation (Equation (2)). The normality of the data was determined by the Shapiro–Wilk test (p > 0.05), and fitting was performed at the 95% confidence level, with a correlation coefficient (R2) greater than 0.9 for all tested parameters [40].
where a represents the dose–response curve slope, τ the half-maximal concentration (IC50 or GI50), and k the asymptote.
3. Results and Discussion
3.1. Theoretical Response Surface Models and Statistical Verification
The CCCD and the corresponding values obtained for each response criterion for the 28 treatments under the various experimental MAE conditions are shown in Table 1. From this table, it is seen that higher yields of extraction (YDW) were obtained for lower ethanol percentages (between 0 and 20%); the highest result was obtained for experimental run number 3 using shorter times, medium energy, and a lesser percentage of ethanol concentration. On the contrary, the lowest results were obtained when X3:S = 100% (runs 14, 16, 18, 20, and 22). For the phytochemical content (YTPC), the highest result was also obtained for experimental run number 3, and generally, the highest amounts were found when X3:S = 20% (runs 1, 3, 5, and 7). The lowest results were observed in the axial points. For the antioxidant responses (YDPPH, YABTS, and YBCM), the results generally agreed, showing the lowest results for axial points and the best activity in central points, corresponding to mild conditions of the variables. Even without model fitting, this initial approximation provides insight into the effect of the variables on each response.
Later, using the experimental data of the 28 different combinations of conditions (denoted as X1:t, X2:P, and X3:S) utilized in the MAE, fitting to the polynomial models using Equation (1) was performed. On the other hand, the estimated parametric values for each response—yield, TPC, DPPH, ABTS, and BCM—and numerical statistical criteria were obtained and are presented in Table 2. Those coefficients reflected as non-significant (ns) were not considered for the model development and are not displayed. The responses shown in Table 2 were correlated with the three independent variables using the polynomial equation by considering only the statistically significant coefficients (p < 0.05) to build simplified non-linear equations for each response presented below (Equations (3)–(7)):
Table 2.
Parametric results of the polynomial fitting of Equation (1) for MAE and in terms of the extraction behavior for the five assessed responses (yield, TPC, DPPH, ABTS, and BCM) (A). Variables are presented in codified ranges and the parametric subscripts 1, 2, and 3 refer to the variables involved (X1, X2, and X3, respectively). Statistical information of the fitting analysis is also shown. (B) Optimum conditions in natural values that lead to optimal response values.
Overall, the linear, quadratic, and interactive effects were statistically significant (p < 0.05), with all the variables having representation in each equation, proving the adequacy of the selection. The cubic term was mostly used for describing the effect of X3:S. Regarding the statistical analysis, the quadratic regression model resulted in determination of the R2 coefficient (Table 2). All tested responses showed values between 0.80 and 0.93, confirming the fitting between the experimental and the regression models, explaining more than 80% of the variability.
3.2. Impact of the Extraction Variables on the Target Responses and Optimal Conditions
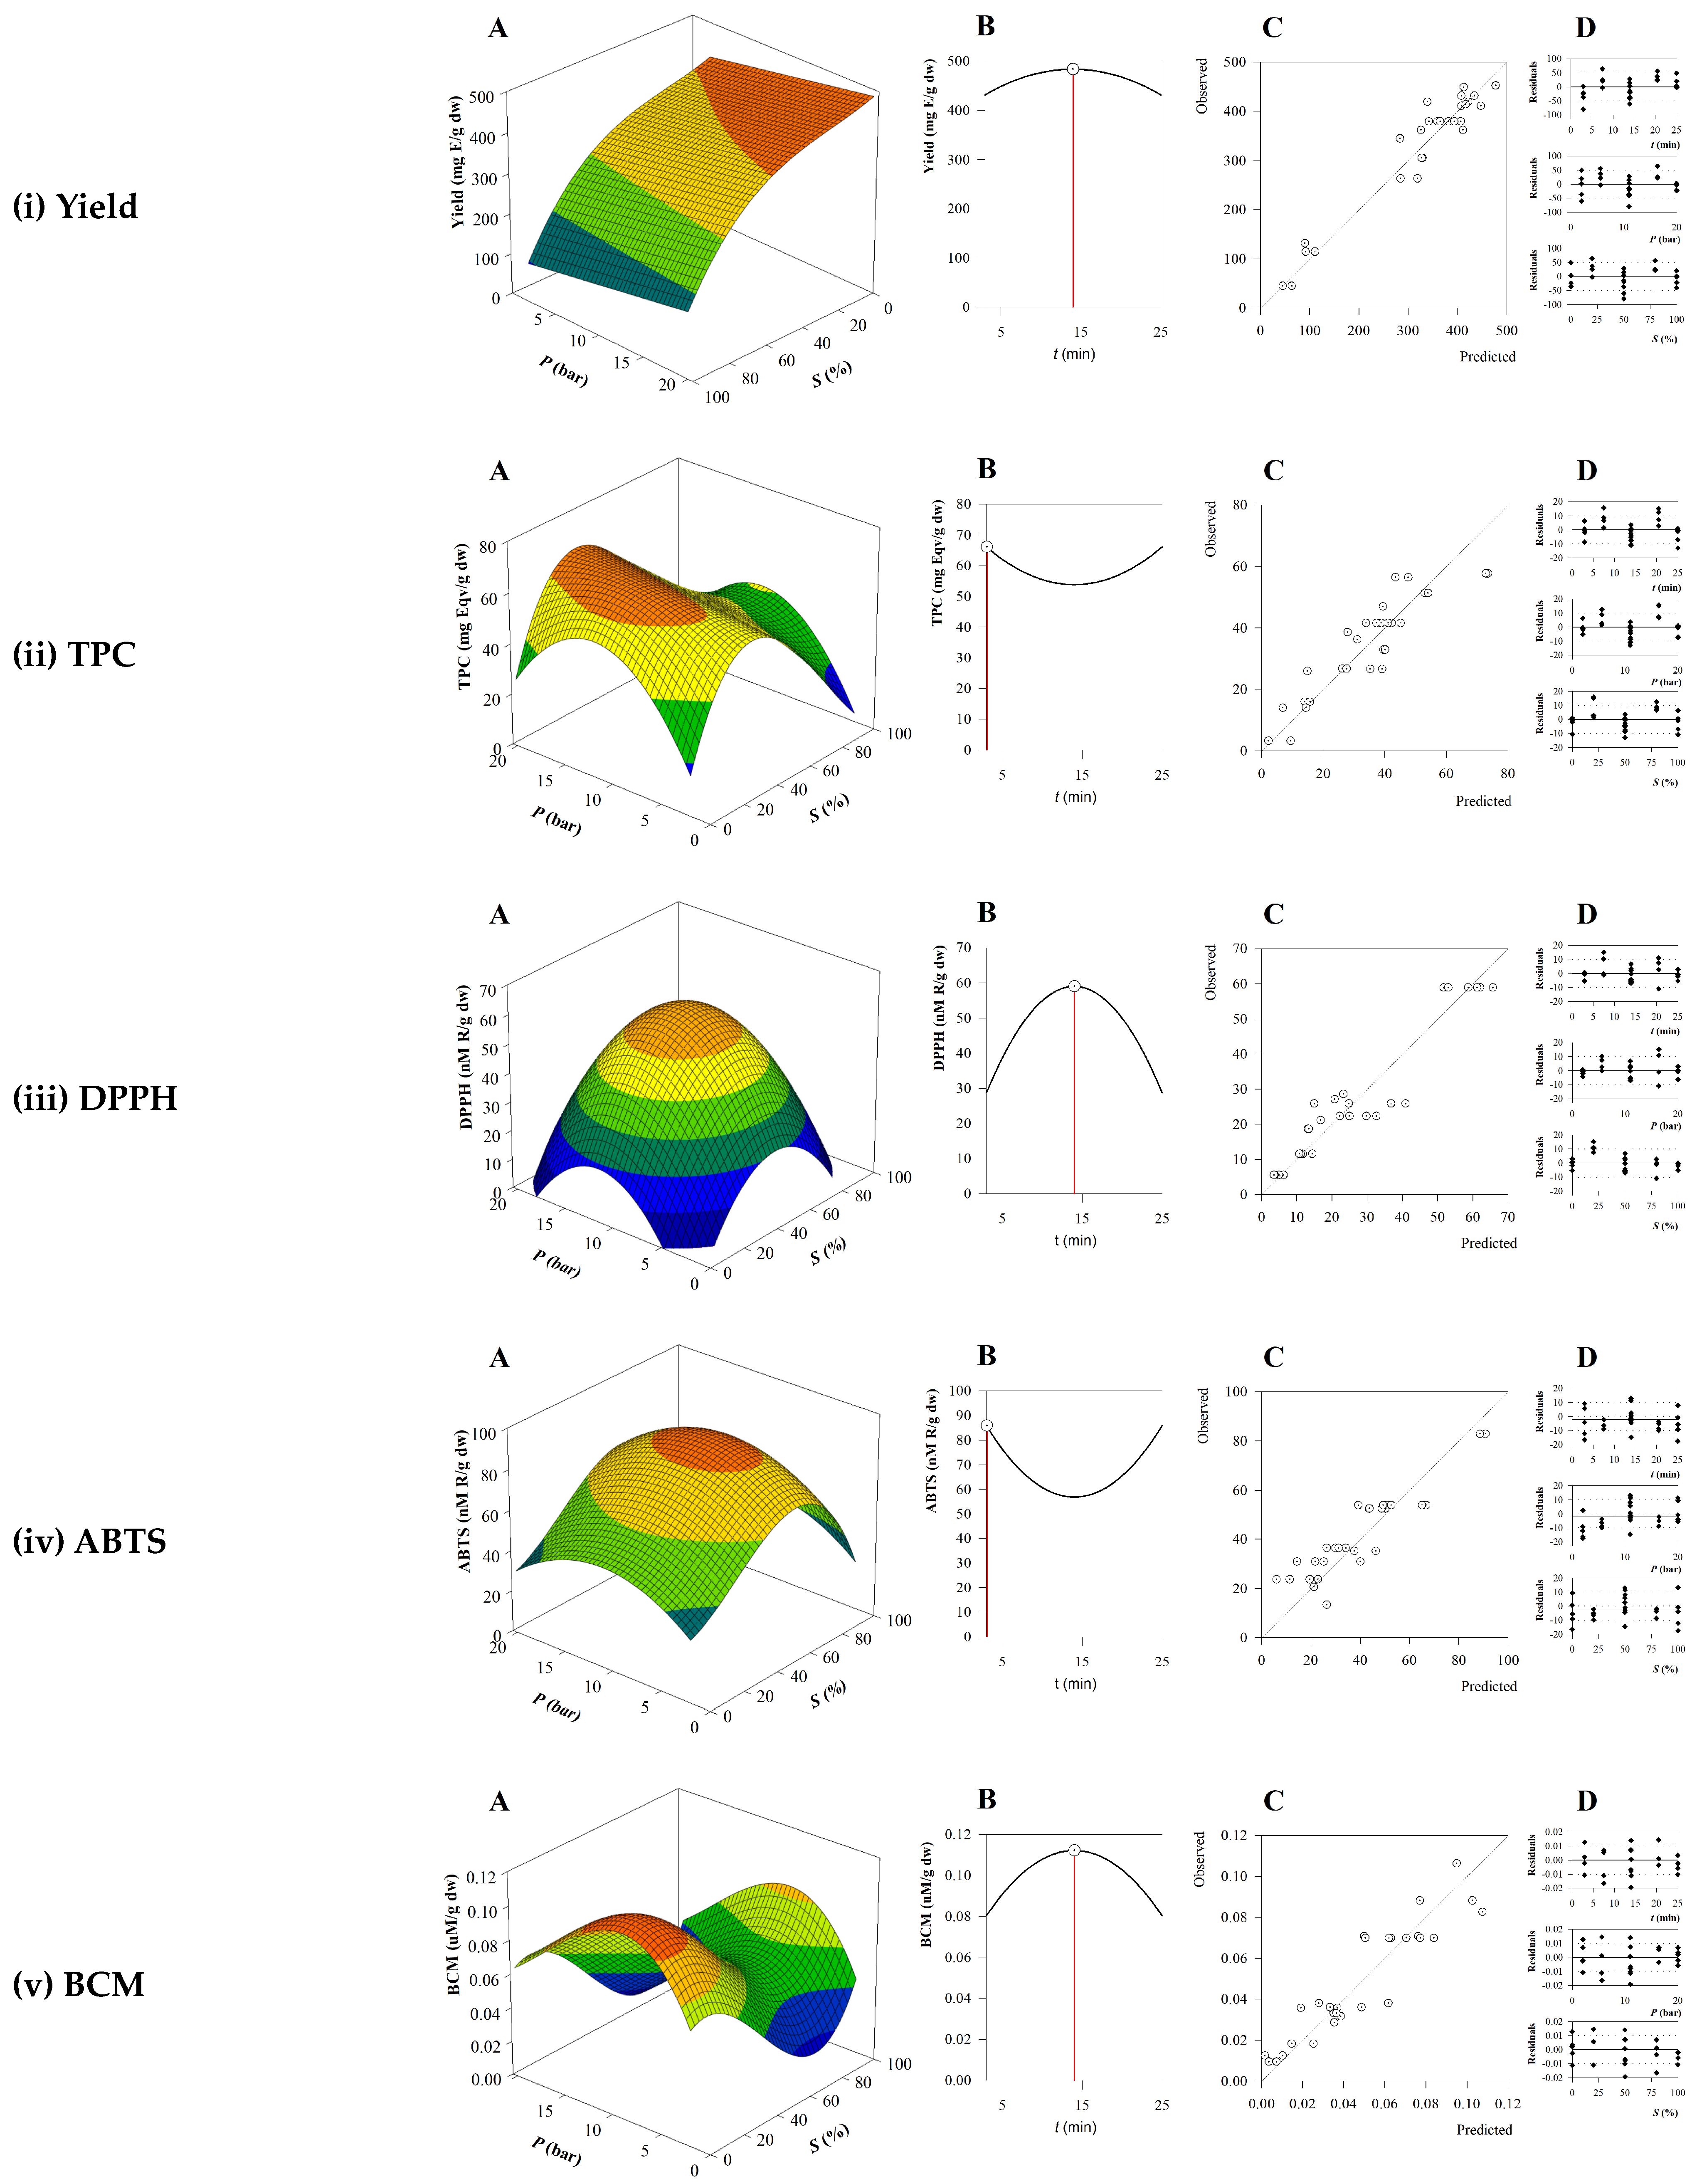
The three-dimensional surface plots originating from the RSM analyses are represented in Figure 1A. In these plots, the interactive effect of the two independent variables (X2:P and X3:S) is shown, while the third (X1:t) remains at an intermediate value. Considering the interactive effect of the two independent variables, solvent concentration (X3:S) was the factor that most impacted the responses, indicating that lower ethanol percentages led to higher responses, suggesting that most of the extracted compounds and those with antioxidant activity were highly polar. Generally, medium to higher pressure values also resulted in increased responses. Figure 1B depicts two-dimensional plots as a function of time (X1:t), thus representing how the response is modelled through time and at which point the response is optimized for each response—yield, TPC, DPPH, ABTS, and BCM. From these results and in terms of response evolution through time, the optimum values were obtained for short to medium times. Figure 1C shows the regression model fitting the predicted and experimental values and in Figure 1D the distribution of residuals is shown. The randomized distribution of these points illustrates the absence of autocorrelation, and thus, the efficacy of the proposed models (Equations (3)–(7)). RSM was used to discover the MAE optimal extraction conditions (Table 2B) that maximize each of the studied responses—yield, TPC, DPPH, ABTS, and BCM—based on their specific model. Based on these results, the conditions that maximize yield aligned with the other responses in terms of time and pressure. However, maximum yield was obtained when using only water as the solvent, probably due to the high affinity and content of polysaccharides in the sample. Regarding the optimal conditions to maximize each antioxidant activity, all preferred medium pressure and short to medium times but the solvent was markedly different. This discrepancy originates from the different mechanisms of the antioxidant assays: single-electron transfer (SET) assays, namely, DPPH and ABTS, based on the donation of an electron, differ from hydrogen atom transfer (HAT) assays, namely, BCM, that donate a hydrogen atom [41]. Therefore, the ratio EtOH:H2O can affect the nature of the extracted molecules, and thus, the outcome of the response. For example, the BCM assay is adequate for measuring molecules with lipophilic properties, thus hydroethanolic mixtures are preferred [23]. TPC’s optimal conditions were aligned with antioxidant assays, confirming that this parameter is usually used to estimate the antioxidant capacity given their good correlation. Moreover, the differences between the responses were desired, to offer a complementary insight and contribute to overall comprehension of the governing mechanisms in SM compounds. At the optimal extraction point, the TPC value was 66.10 mg PGE/g dw (Table 2B). Several reports have described the measurement of TPC in SM crude extracts; nevertheless, a straightforward comparison between these reports is extremely hard to achieve since there are a multiplicity of factors influencing the TPC results, like seasonality [42], harvest location, and weather [3], in addition to extraction conditions. For instance, a study performed by Namvar and collaborators reported a TPC value in SM extract of 78.95 mg GAE/100 g dw [43]. Another report showed that TPC values for water and ethanol heat-assisted extracts (HAEs) of SM, were 230.8 and 114.9 mg GAE/g, respectively [44]. Furthermore, another study, that used a combination of enzymatic and ultrasound-assisted extraction (UAE) techniques, led to TPC values between 201 and 301 μg catechol equivalent/g lyophilized extract [45]. These differing findings support using optimization tools to find the extraction conditions that lead to higher yields and effectiveness of the extracts.
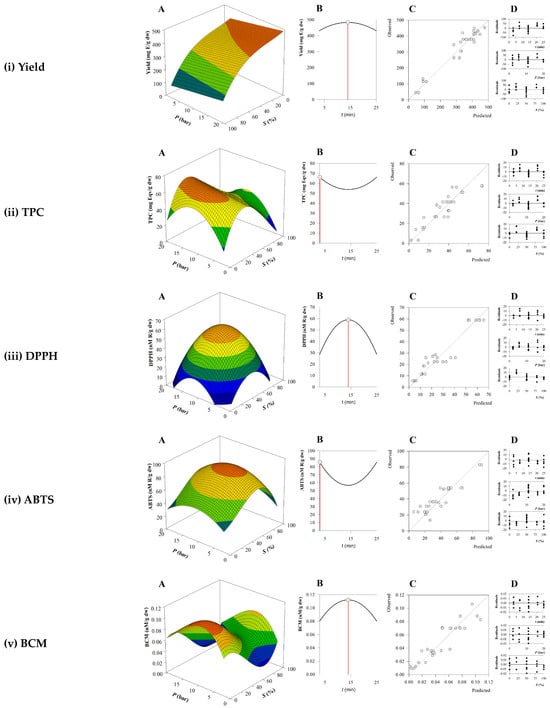
Figure 1.
(A) Response surface plots of the combined effect of the two independent variables X2:P and X3:S while keeping X1:t at its central value. (B) Two-dimensional plot of the response variable as a function of time (X1:t). (C) Quadratic regression model of the predicted versus the experimental values. (D) Distribution of residual values.
Within this framework, simultaneous optimization was developed leveraging RSM to find the highest possible recovery of phytochemical compounds with antioxidant properties from the SM extract. Our approach prioritized maximizing the outcomes projected by the established models. Consequently, the ideal conditions for MAE were identified as follows: time of 14.0 min (t), pressure of 11.03 bar (P), and ethanol concentration of 33.31% (S). Accordingly, the predicted values for each response under these optimal conditions were determined and are depicted below in Table 2B. These results suggest that achieving the best condition to maximize one particular response might negatively impact other responses. This underscores the importance of adopting simultaneous optimization methods.
3.3. Chemical Characterization by HPLC-ESI-QqQ-MS/MS
After determining extraction conditions that simultaneously maximize yield, TPC, and antioxidant capacity, a series of tests were performed to characterize the optimum extract from the chemical point of view. Therefore, based on the literature and knowledge about the biological properties of phenolic compounds present in brown algae, the sample was analyzed to identify and quantify these compounds [46,47,48,49,50,51,52].
This task is especially demanding in the case of macroalgae because many phlorotannins present isomers. In addition, there are no available standards for all compounds, so data are presented as attempted identifications based on the literature. Semi-quantification was performed using a standard for each class of phenolic compounds and the detailed list of detected compounds can be found in Table 3. Molecules semi-quantified with concentrations lower than 5 µg/mL were marked as below the quantification limit (LOQ).
Table 3.
Annotated phenolic compounds in SM analyzed by HPLC-ESI-QqQ-MS/MS.
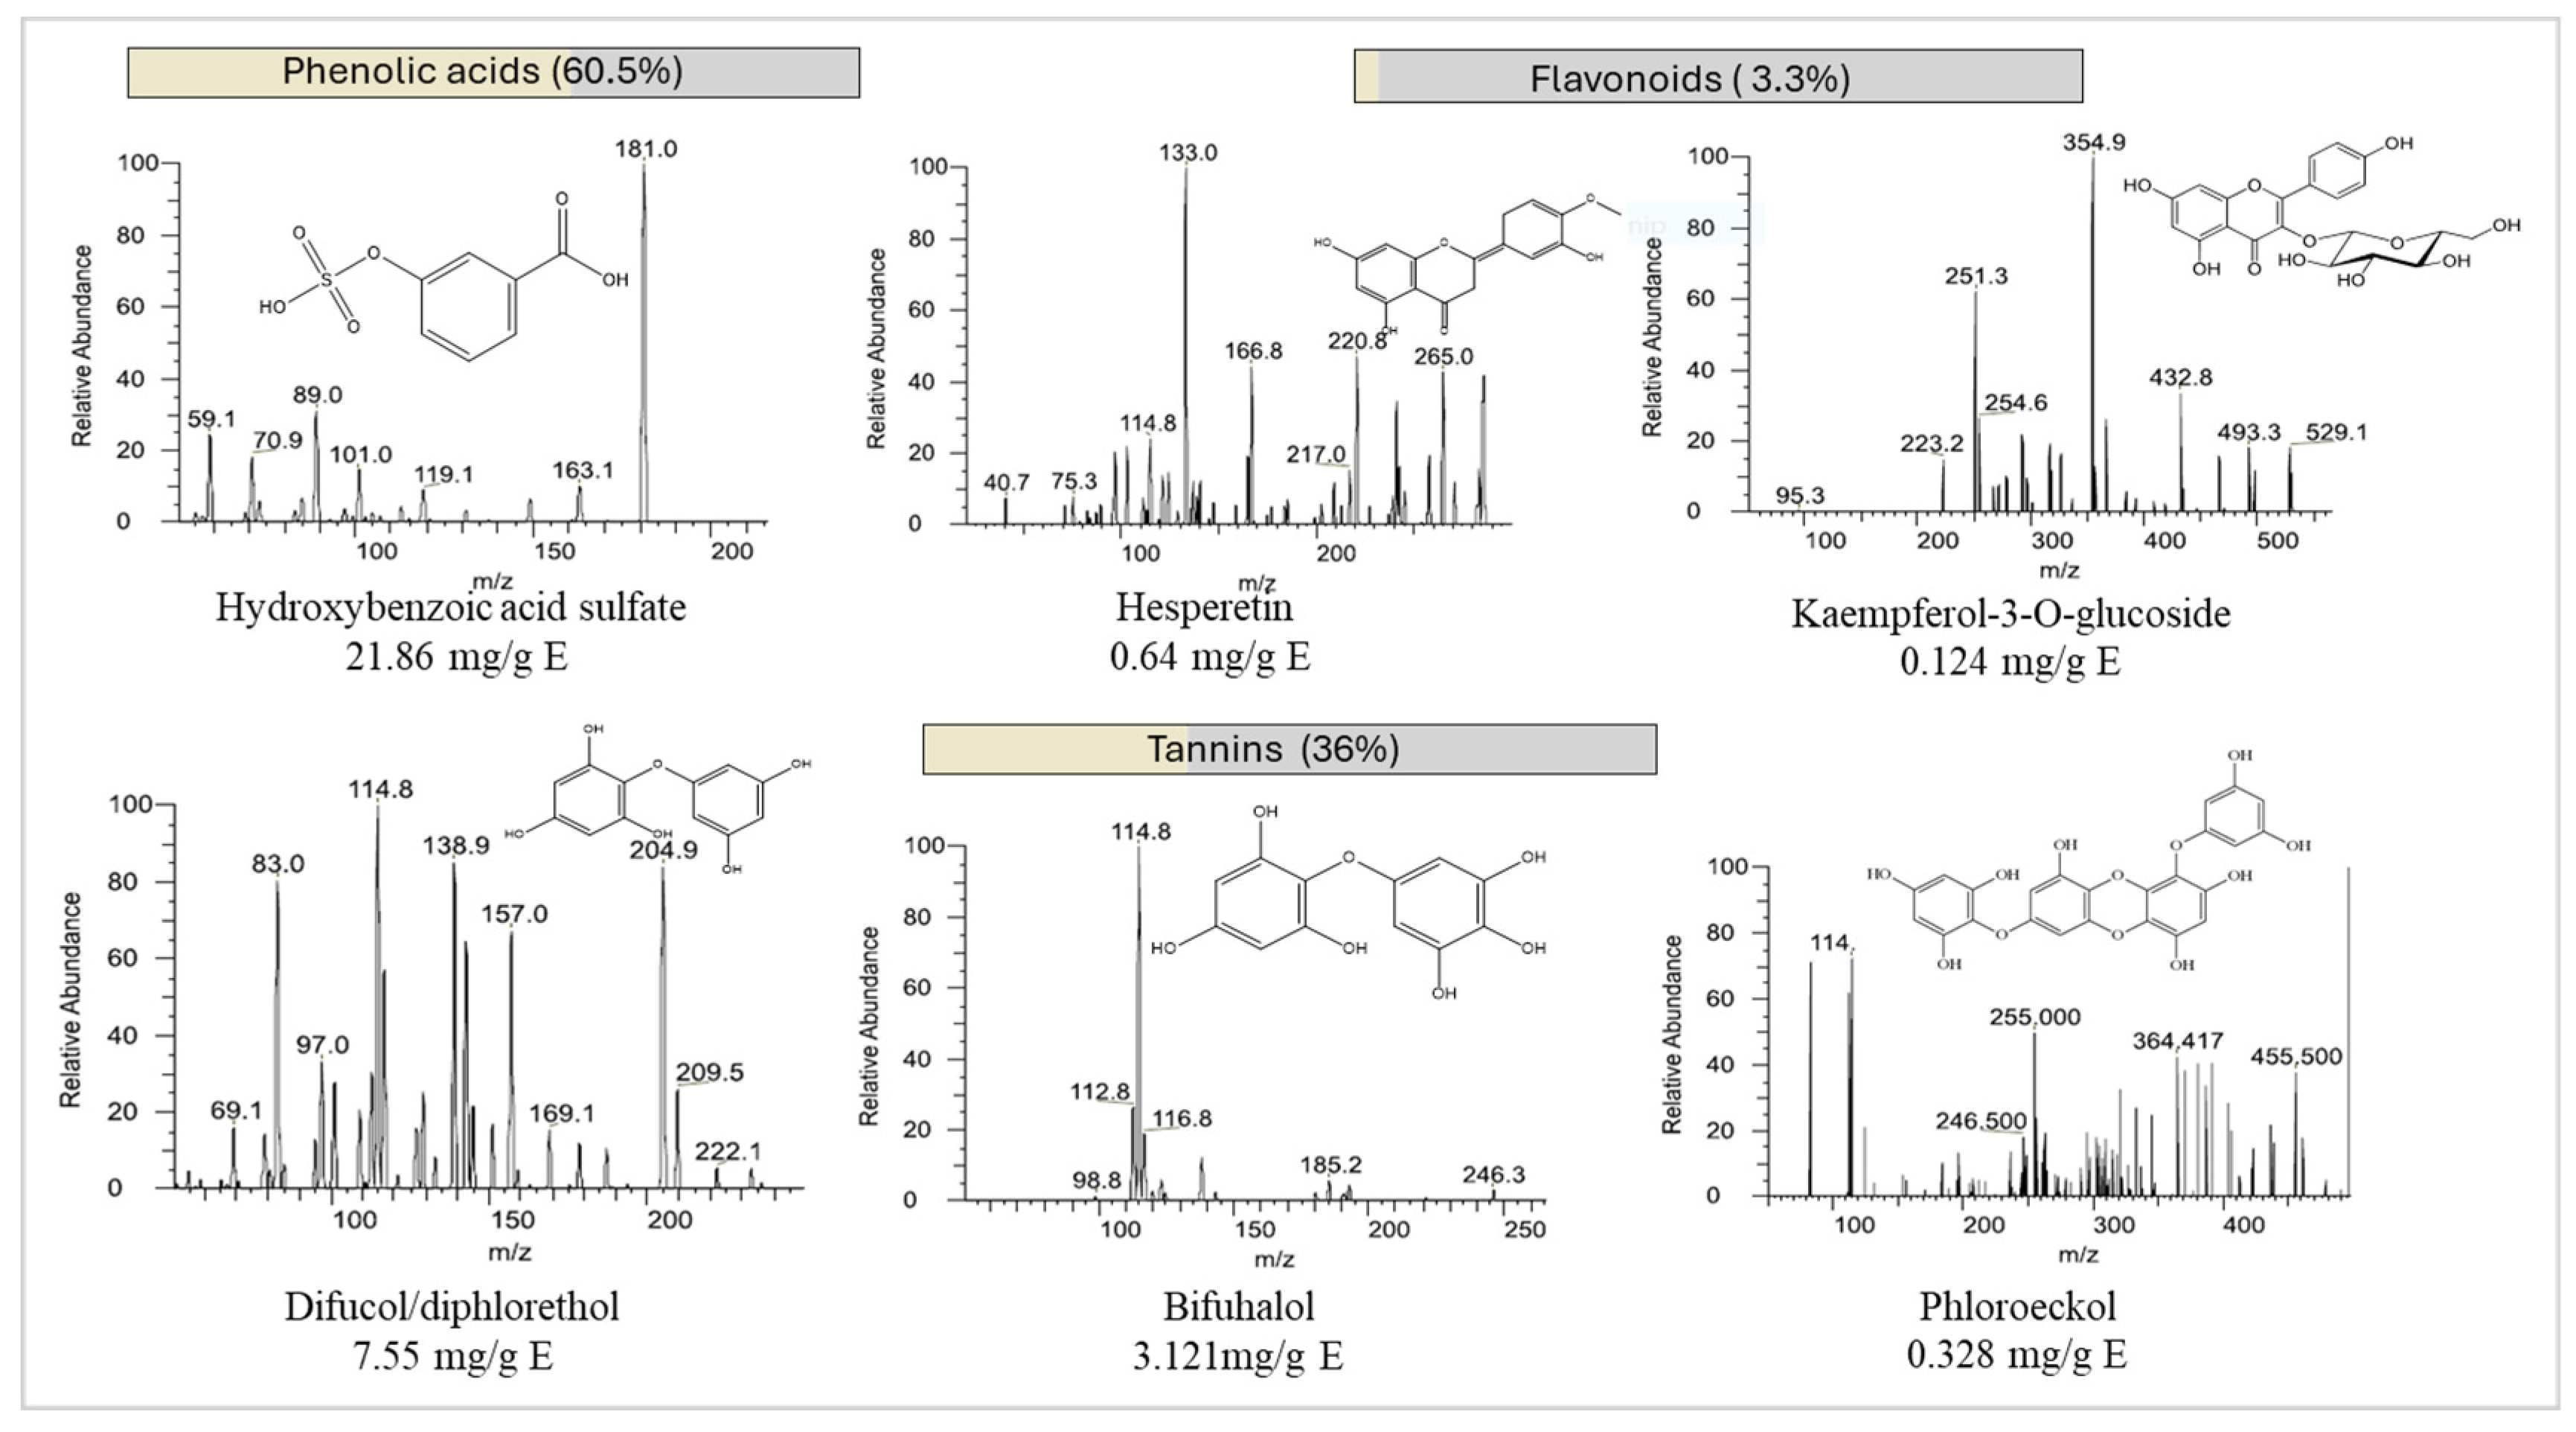
As far as the phenolic acid family is concerned, its total contribution to the total phenolic content was estimated at 60.5%. The most significant molecule was hydroxybenzoic acid sulfate with a concentration of 21.86 mg/g E (Figure 2), isomeric forms were not considered. The presence of this molecule in SM was demonstrated previously in an ethyl acetate fraction as the most intense peak [73]. The second most abundant compound in the phenolic acid family was hydroxybenzoic acid glucoside, which was detected at the concentration of 0.258 mg/g E, with the precursor ion of [M − H]− 316. This secondary metabolite is not typically detected in algae’s phenolic profiles but was previously detected by Zhong and colleagues in Sargassum sp. [51].
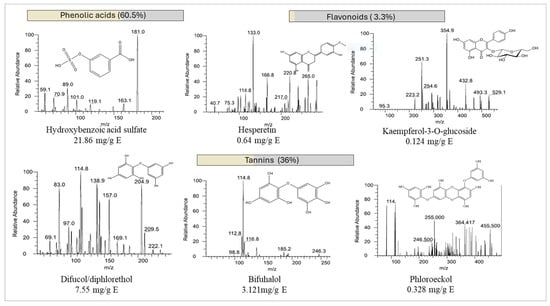
Figure 2.
Mass spectra of the most abundant molecules in SM analyzed by HPLC-ESI-QqQ-MS/MS. Note: Please note for hydroxybenzoic acid sulfate, this is a representation of one of the possible isomeric forms.
As for the flavonoid family, their contribution was estimated at 3.3%. Hesperetin was the molecule quantified in the highest quantity at 0.642 mg/g E ([M − H]− 303 and MS2 90.9 and 262.9). To our knowledge, there are no previous records of the presence of this molecule in SM. However, this flavonoid was found in the brown algae species Bifurcaria bifurcata and Fucus spiralis at concentrations of 70.35 and 66.4 µg/g E, corroborating our findings [54].
As expected, the group of tannins was the one with the highest number of tentatively identified compounds. Their contribution to the total detected phenolic compounds was estimated at 36%. A study made on SM (pressurized liquid extraction; EtOH:H2O) has tentatively identified several phlorotannins with different degrees of polymerization (from 3 to 11) by HPLC-MS; however, no quantification was made based on the chromatographic results [52]. In this study, a total of 43 tannins were tentatively identified. The most abundant phlorotannin was difucol [M − H]+ 251.097, quantified as 7.55 mg/g E, followed by bifuhalol [M − H]+ 266.592, with a concentration of 3.121 mg/g E. These two compounds constituted, based on phloroglucinol equivalents, approximately 80% of the total phlorotannins detected.
3.4. Biological Activities of the Optimum Extract
3.4.1. Scavenging Activity of ROS and RNS
Free radicals are naturally formed as a metabolic consequence of cells’ reactions with oxygen. However, these processes are not the only source of oxidative stress, environmental pollution, UV radiation, exposure to pesticide residues, and cigarette smoke, among others, are responsible for an increase in these harmful molecules. Furthermore, oxidative stress that appears when ROS exceeds the cellular antioxidant system capacity can be related to pathologies like neurodegeneration, cardiovascular diseases, and cancer [74].
Consequently, antioxidants play a critical role in health and food preservation by constraining free radicals through scavenging mechanisms. To assess the macroalga extract’s scavenging capacity, several in vitro tests were performed against relevant ROS and RNS, such as the superoxide anion radical, hydrogen peroxide, and nitric oxide radical [75]. The SM extract’s antiradical scavenging capacity is presented in Table 4.
Table 4.
Bioactivity analyses of SM optimized extract. (A) Antioxidant activity; (B) inhibition of central nervous system-related enzymes; (C) antiproliferative effects; (D) antimicrobial activity against Gram-negative and Gram-positive pathogenic bacteria.
ROS occurs naturally in aerobic organisms as a metabolic product of oxygen. Likewise, the superoxide anion O2•− can appear as a response of the immune system to pathogens or after the stimulation of the O2 molecule by irradiation. The non-radical species hydrogen peroxide is a part of several cellular mechanisms, and due to its relative stability and the high permeability of the cell membrane can induce toxicity, being commonly used as an oxidative stress promoter in in vitro models [8]. These species promote cellular damage and induce several human diseases [75]. These facts substantiate the importance of finding natural extracts with ROS scavenging capacity.
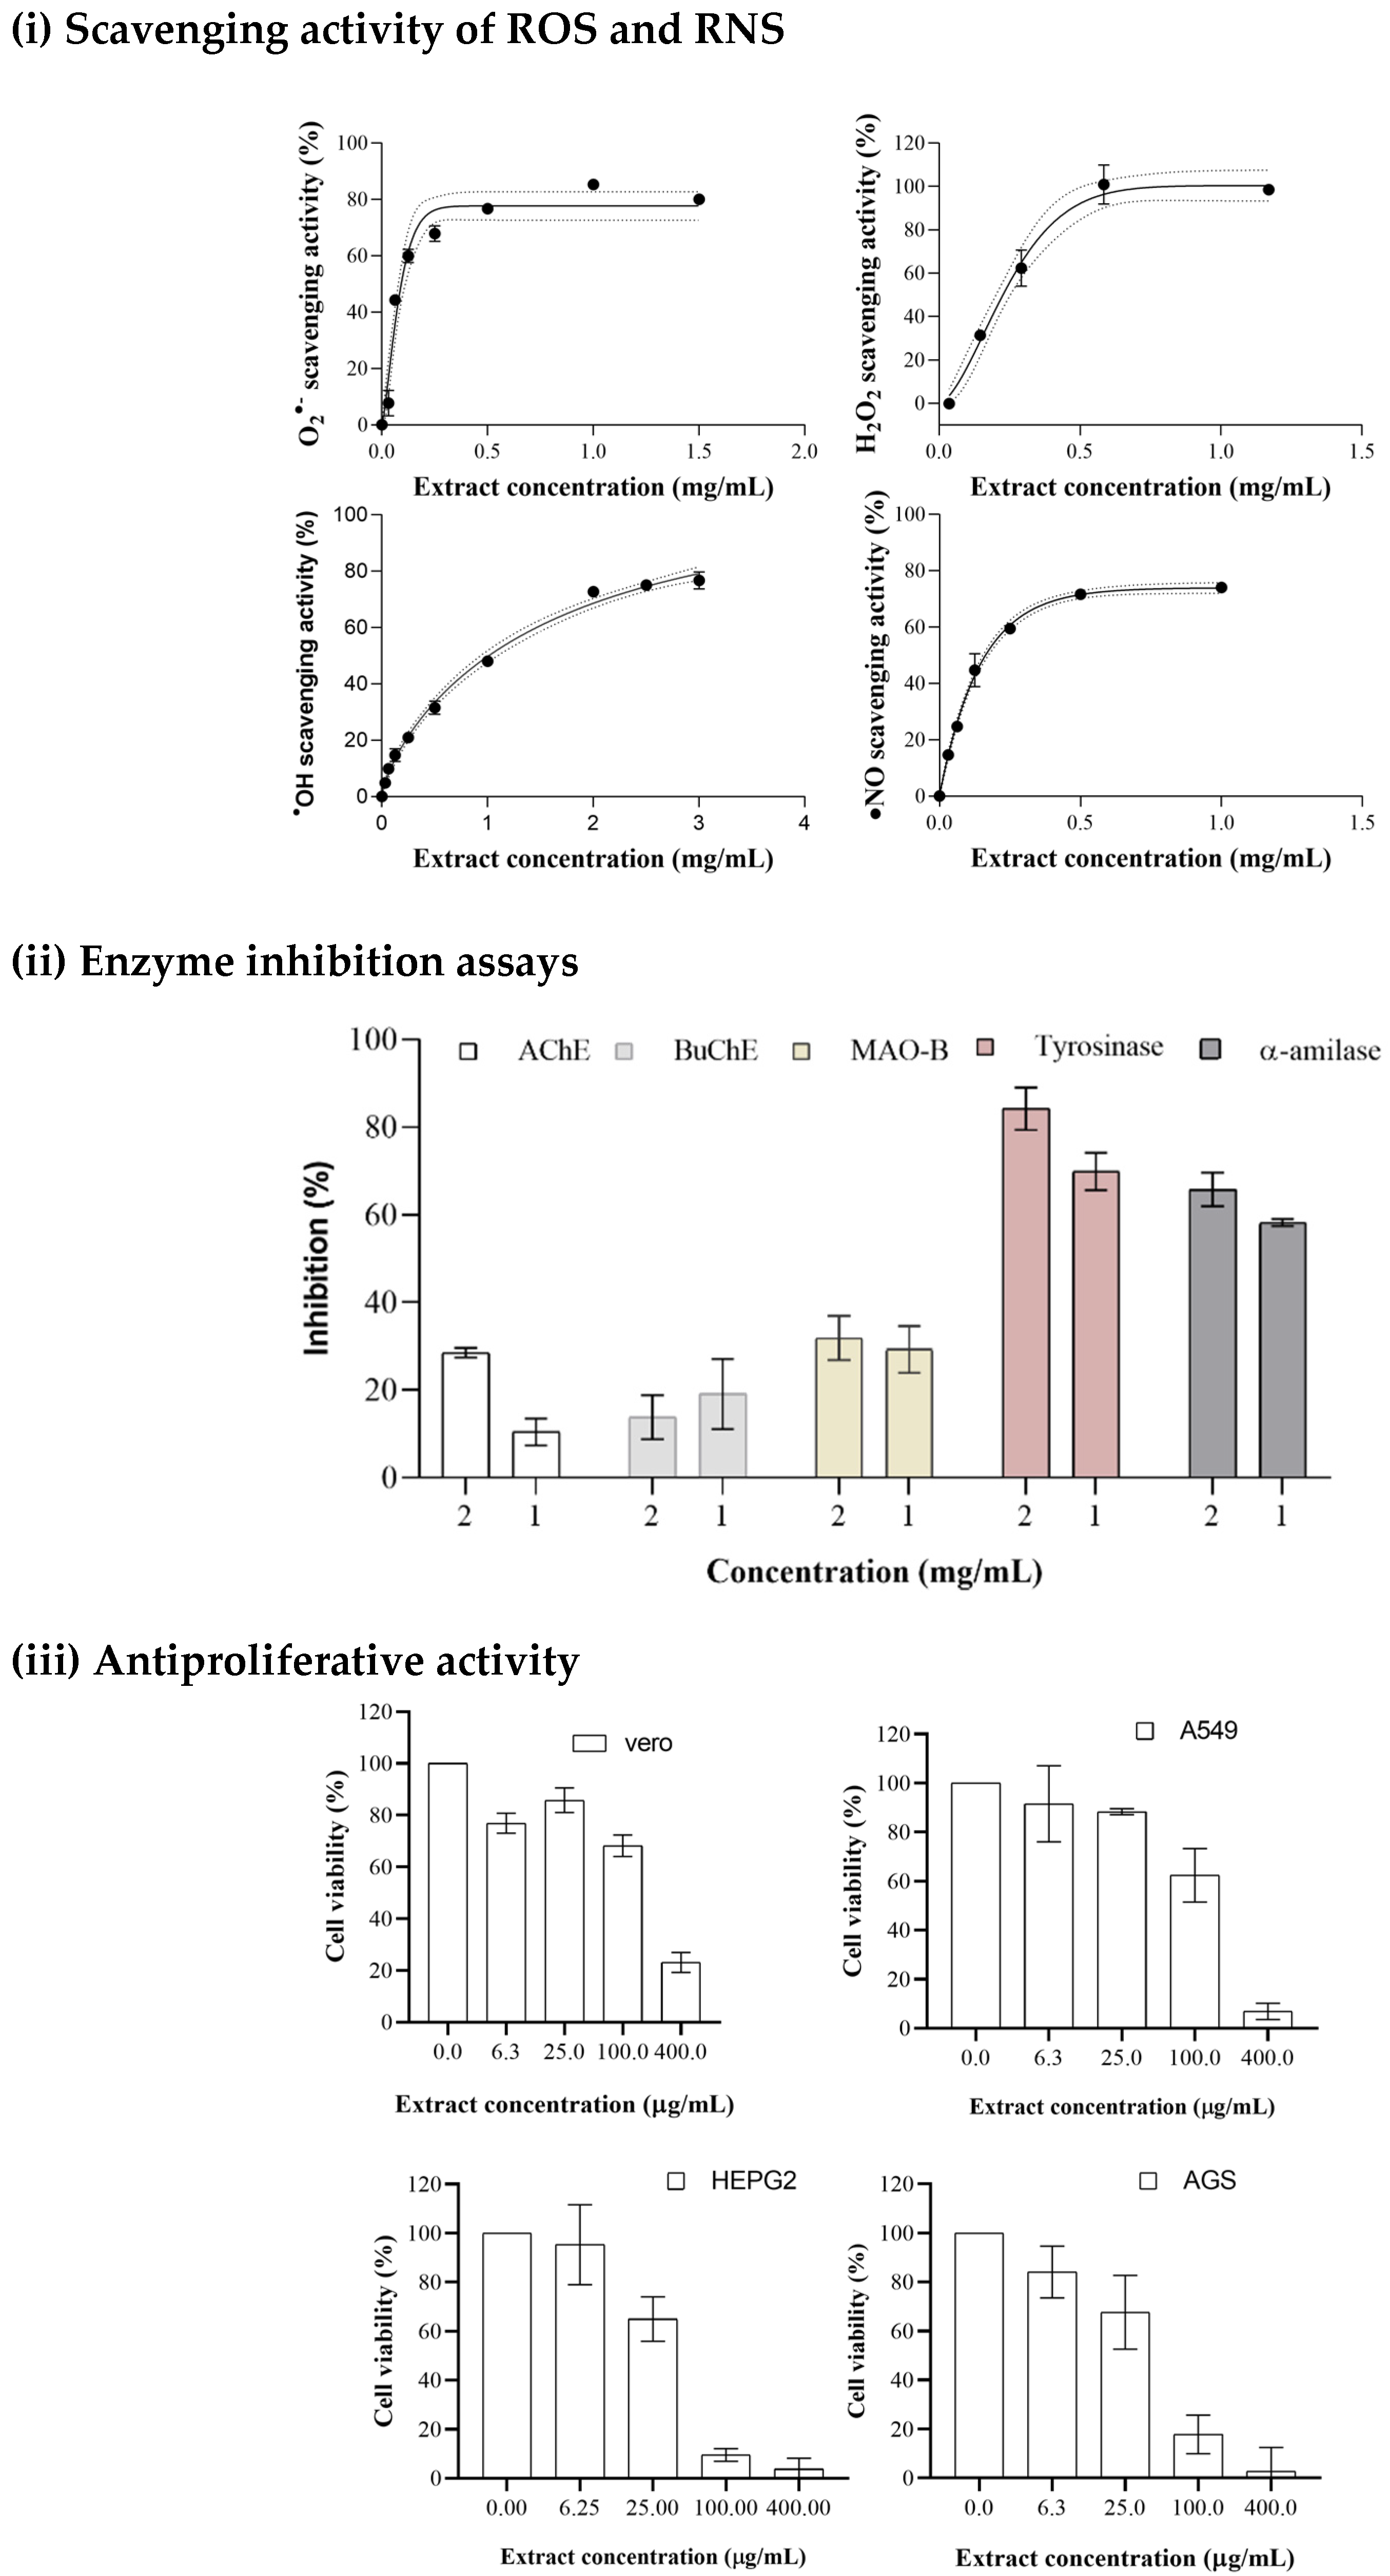
Figure 3 shows that the SM extract scavenges the oxidizing molecules in a dose-dependent manner. The performance of SM as a superoxide scavenger (IC50 = 57.72 µg/mL) is better than that of the reference molecule (IC50 = 160 µg/mL). The antioxidant capacity against the nitric oxide radical is more than four times greater than ascorbic acid, revealing the possibility of SM extract having anti-inflammatory properties, as there is a known link between the ●NO radical and inflammatory processes [76]. The high antioxidant potential of SM extract is related to the high concentration of phenolic acids [77] and phlorotannins [78], which are the major compounds of the SM phenolic profile, as supported by the cited literature. Moreover, these results may be justified by previous findings that Apo-9’-fucoxanthinone from SM effectively suppressed lipopolysaccharide-induced nitric oxide (●NO) [79]. It has also been related to cytoprotective characteristics by inhibiting hydrogen peroxide production and Caspase-9 enzyme activity [8].
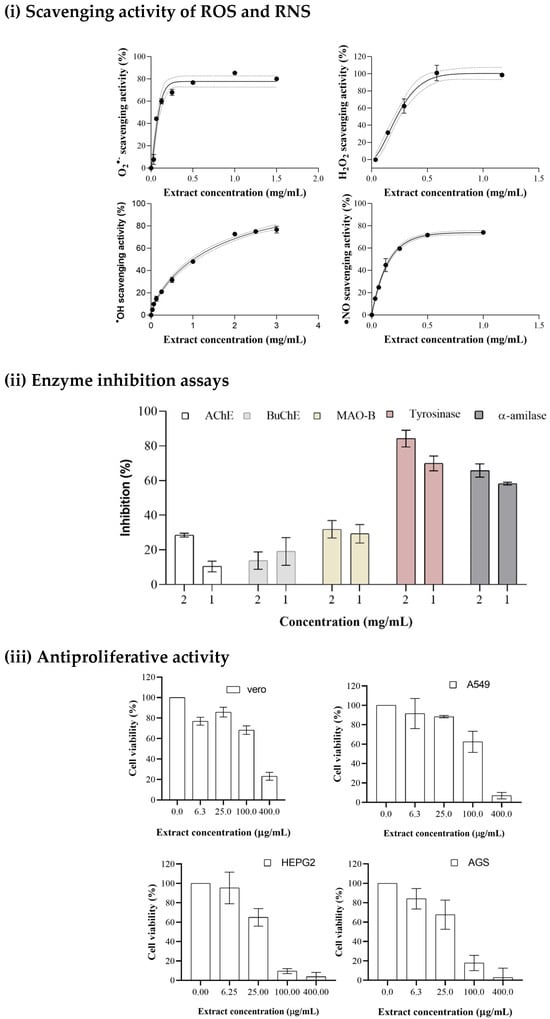
Figure 3.
(i) Dose–response curves of superoxide anion radical, hydroxyl radical, hydrogen peroxide, and nitric oxide radical scavenging activities—dotted lines stand for 95% confidence levels. (ii) Inhibition response of enzyme tested at the extract concentrations of 2 and 1 mg/mL. (iii) Dose–response bars of A549, HepG2, AGS, and Vero cell inhibition rates—error bars represent the standard deviation; n = 3.
3.4.2. Antimicrobial Activity
SM extracts have been reported as a source of antimicrobial compounds [80]. Aiming to appraise the antimicrobial potential of the MAE-obtained extract, four foodborne pathogens, B. cereus, E. coli, S. enteritidis, and P. aeruginosa, and two microorganisms that cause opportunistic infections (S. aureus and S. epidermidis) were tested by the broth dilution method. The results revealed some antimicrobial activity against two of the tested species, S. aureus (8 mg/mL) and P. aeruginosa (8 mg/mL), and no substantial activity against the others.
The existing data on the antimicrobial activity of SM extracts are scarce. Acetone and chloroform extracts of SM have been reported to have some antimicrobial potential toward Shigella fleschneri, Micrococcus sp., and Salmonella paratyphi [81]. There is also a report of significant inhibition activity against P. aeruginosa, E. coli, and S. aureus achieved with SM acetone–water extracts [3]. Other authors described the nonexistence of antibacterial activity of SM extracts, suggesting that the presence of complex sugars such as polysaccharides in the sample triggered the growth of bacteria instead of repressing it [82].
3.4.3. Inhibition of Enzymatic Activity
Neurodegenerative diseases are a major concern in this century, as populations are aging, and the prevalence of neurological disorders such as Alzheimer’s and Parkinson’s is also increasing [83]. Moreover, depression is a severe mental disorder that is a cause of disability worldwide and the most common comorbidity associated with neurodegenerative disorders [84]. Consequently, there is an upsurge in interest in natural products capable of interacting and potentially decreasing the occurrence of these diseases. The ability of the SM extracts to inhibit the AChE, BuChE, MAO-A, and MAO-B related to Alzheimer’s, Parkinson’s, and clinical depression disorders was researched. The results indicate a weak activity, with IC50 > 2 mg/mL of extract for all enzymes except for tyrosinase.
The data showed that 2 mg/mL of extract was able to promote a 28.5% inhibition rate of AChE; and a 19.5% inhibition effect on BuChE was observed in Figure 3. In another study, SM extracted with 1:1 methanol:dichloromethane solution led to no inhibition activity of SM extracts against AChE [85]. On the other hand, the result obtained for disruption of tyrosine activity was more significant, with an IC50 = 238.7 µg/mL (p < 0.05; R2 = 0.9756). This is a key enzyme associated with Parkinson’s disease, being involved in the increase in neuromelanin that leads to deficiency in the neurotransmitter dopamine and neuronal death [86,87].
Concerning MAO inhibition activity, an inhibition of 30% was achieved with the maximum extract concentration tested (2 mg/mL) towards MAO-B; however, no effect was found against MAO-A. In addition, the α-amylase inhibitory activity was also very significant, with an IC50 of 31.62 µg/mL (p < 0.05; R2 = 0.9114). There is already published work focusing on the inhibitory activity of carbohydrate-metabolizing enzymes by SM extracts, showing that a phlorotannin-rich extract (purified from a crude acetone–water (7:3, v/v) extract) of SM can inhibit the enzyme α-amylase to a moderate extent [88]. The result obtained in this work is much more effective for inhibiting α-amylase and highlights the effectiveness of the MAE extraction technique and the optimization procedure.
3.4.4. Antiproliferative Activity
The ability of the SM extract, to inhibit the proliferation of abnormal cancer cells was tested on three cell lines, namely, A549 (adenocarcinoma of the lung), HepG2 (hepatocellular carcinoma), and AGS (adenocarcinoma of the stomach), as well as on kidney epithelial cells derived from African green monkey. The results show that SM extract effectively disrupts the proliferation of all tested cell lines depending on the dose (Figure 3), particularly against gastric and hepatocellular carcinoma (IC50 of 40.19 and 34.49 µg/mL, respectively). A thorough review demonstrated the capacity of individual or purified phlorotannin extracts to inhibit cancer cells [46]. Moreover, polyphenolic-rich methanolic extracts of SM have already shown efficiency in inducing cell death in human breast cancer cells [43]. In vivo tests in fertilized chicken eggs also reveal antiangiogenic activity [43]. Also, PLE-EtOH:H2O SM extract, as an antiproliferation agent of colorectal adenocarcinoma cells (HT-29 cells), has been determined to have a GI50 between 32.2 and 83.8 µg/mL, depending on the phlorotannin profile caused by the different samples’ origins, highlighting the importance of the phlorotannin content in the antiproliferation activity [52].
4. Conclusions
The RSM proved useful to optimize the MAE of S. muticum and resulted in the following optimal extraction conditions: time = 14.00 min; pressure = 11.03 bar; ethanol = 33.31%. Regarding the characterization of the phenolic compounds, the largest group was phenolic acids (60.5%) followed by phlorotannins (36%). The SM extract showed moderate activity in inhibiting enzymes associated with Alzheimer’s disease. The algal extract also inhibited MAO-B and demonstrated significant inhibitory activity against tyrosine and α-amylase enzymes (IC50 of 238.7 and 31.6 µg/mL, respectively). The obtained crude extract was evaluated for its antioxidant capacity and showed high activity against ROS and RNS, suggesting the possibility of using SM extract as a natural antioxidant additive. The crude extract studied exhibited cytotoxic properties against lung, liver, and gastric carcinoma cells. SM extract affected the growth of two of the six strains of microorganisms tested, S. aureus and P. aeruginosa, with estimated MICs of 8 mg/mL. These results allow us to suggest the application of SM extracts as antioxidant additives with nutraceutical characteristics.
Author Contributions
Conceptualization, A.S., L.C., M.C. and M.A.P.; methodology, A.S., L.C., C.L.-L., C.G., F.C., P.G.-P., A.C. and V.F.D.; software, A.S., M.C. and M.A.P.; validation, A.S., L.C., M.C., C.G. and M.A.P.; formal analysis, A.S., L.C., M.C. and M.A.P.; investigation, A.S., L.C., M.C. and M.A.P.; resources, M.F.B., J.S.-G. and M.A.P.; data curation, A.S., L.C., M.C., C.G., F.C., P.G.-P. and M.A.P.; writing—original draft preparation, A.S. and M.C. writing—review and editing, C.G., M.F.B. and M.A.P.; visualization, A.S., L.C., M.C., C.G., M.F.B. and M.A.P.; supervision, M.F.B., J.S.-G. and M.A.P.; project administration, M.F.B., J.S.-G. and M.A.P.; funding acquisition, M.F.B., J.S.-G. and M.A.P. All authors have read and agreed to the published version of the manuscript.
Funding
This research received no external funding.
Institutional Review Board Statement
Not applicable.
Data Availability Statement
The original data presented in the study are included in the article; further inquiries can be directed to the corresponding author.
Acknowledgments
The research leading to these results was supported by Xunta de Galicia for supporting the pre-doctoral grant of M. Carpena (ED481A 2021/313). L. Cassani (ED481D-2024-002) acknowledges Consellería de Educación, Ciencia, Universidades e Formación Profesional (Xunta de Galicia) for the financial support. The authors also would like to acknowledge the AlgaMar company (www.algamar.com) for the collaboration and algae material provision, the Agency for the Scientific and Technological Promotion (ANPCyT, Argentina) for providing financial support for this research through the project PICT (2020)/1602 and the Ibero-American Program of Science and Technology for Development (CYTED-IBEROCIRCULAR, 323RT0142). This work received financial support from FCT/MCTES (UIDB/50006/2020 DOI 10.54499/UIDB/50006/2020) through national funds and also to Ibero-American Program on Science and Technology (CYTED—GENOPSYSEN, P222RT0117). Fatima Barroso (2020.03107.CEECIND) and Clara Grosso (CEECIND/03436/2020) thank FCT for the FCT Investigator grant.
Conflicts of Interest
The authors declare no conflicts of interest.
References
- Rossi, F.; Incera, M.; Callier, M.; Olabarria, C. Effects of Detrital Non-Native and Native Macroalgae on the Nitrogen and Carbon Cycling in Intertidal Sediments. Mar. Biol. 2011, 158, 2705–2715. [Google Scholar] [CrossRef]
- Pereira, A.G.; Fraga-Corral, M.; Garcia-Oliveira, P.; Lourenço-Lopes, C.; Carpena, M.; Prieto, M.A.; Simal-Gandara, J. The Use of Invasive Algae Species as a Source of Secondary Metabolites and Biological Activities: Spain as Case-Study. Mar. Drugs 2021, 19, 178. [Google Scholar] [CrossRef]
- Tanniou, A.; Vandanjon, L.; Incera, M.; Serrano Leon, E.; Husa, V.; Le Grand, J.; Nicolas, J.L.; Poupart, N.; Kervarec, N.; Engelen, A.; et al. Assessment of the Spatial Variability of Phenolic Contents and Associated Bioactivities in the Invasive Alga Sargassum muticum Sampled along Its European Range from Norway to Portugal. J. Appl. Phycol. 2014, 26, 1215–1230. [Google Scholar] [CrossRef]
- Raoux, A.; Pezy, J.P.; Sporniak, T.; Dauvin, J.C. Does the Invasive Macro-Algae Sargassum muticum (Yendo) Fensholt, 1955 Offer an Appropriate Temporary Habitat for Mobile Fauna Including Non Indigenous Species? Ecol. Indic. 2021, 126, 107624. [Google Scholar] [CrossRef]
- Kraan, S. Sargassum muticum (Yendo) Fensholt in Ireland: An Invasive Species on the Move. J. Appl. Phycol. 2008, 20, 825–832. [Google Scholar] [CrossRef]
- Pinteus, S.; Lemos, M.F.L.; Alves, C.; Neugebauer, A.; Silva, J.; Thomas, O.P.; Botana, L.M.; Gaspar, H.; Pedrosa, R. Marine Invasive Macroalgae: Turning a Real Threat into a Major Opportunity—The Biotechnological Potential of Sargassum muticum and Asparagopsis armata. Algal Res. 2018, 34, 217–234. [Google Scholar] [CrossRef]
- Silva, A.; Cassani, L.; Grosso, C.; Garcia-Oliveira, P.; Morais, S.L.; Echave, J.; Carpena, M.; Xiao, J.; Barroso, M.F.; Simal-Gandara, J.; et al. Recent Advances in Biological Properties of Brown Algae-Derived Compounds for Nutraceutical Applications. Crit. Rev. Food Sci. Nutr. 2024, 64, 1283–1311. [Google Scholar] [CrossRef]
- Pinteus, S.; Lemos, M.F.L.; Silva, J.; Alves, C.; Neugebauer, A.; Freitas, R.; Duarte, A.; Pedrosa, R. An Insight into Sargassum muticum Cytoprotective Mechanisms against Oxidative Stress on a Human Cell in Vitro Model. Mar. Drugs 2017, 15, 353. [Google Scholar] [CrossRef]
- Silva, A.; Silva, S.A.; Carpena, M.; Garcia-Oliveira, P.; Gullón, P.; Barroso, M.F.; Prieto, M.A.; Simal-Gandara, J. Macroalgae as a Source of Valuable Antimicrobial Compounds: Extraction and Applications. Antibiotics 2020, 9, 642. [Google Scholar] [CrossRef]
- Zheng, H.; Du, H.; Ye, E.; Xu, X.; Wang, X.; Jiang, X.; Min, Z.; Zhuang, L.; Li, S.; Guo, L. Optimized Extraction of Polyphenols with Antioxidant and Anti-Biofilm Activities and LC-MS/MS-Based Characterization of Phlorotannins from Sargassum muticum. LWT 2024, 198, 116069. [Google Scholar] [CrossRef]
- Bouzenad, N.; Ammouchi, N.; Chaib, N.; Messaoudi, M.; Bousabaa, W.; Bensouici, C.; Sawicka, B.; Atanassova, M.; Ahmad, S.F.; Zahnit, W. Exploring Bioactive Components and Assessing Antioxidant and Antibacterial Activities in Five Seaweed Extracts from the Northeastern Coast of Algeria. Mar. Drugs 2024, 22, 273. [Google Scholar] [CrossRef]
- Diego-González, L.; Álvarez-Viñas, M.; Simón-Vázquez, R.; Domínguez, H.; Torres, M.; Flórez-Fernández, N. Characterization of the Antiproliferative Activity of Sargassum muticum Low and High Molecular Weight Polysaccharide Fractions. Mar. Drugs 2023, 22, 16. [Google Scholar] [CrossRef]
- Rodrigues, D.; Costa-Pinto, A.R.; Sousa, S.; Vasconcelos, M.W.; Pintado, M.M.; Pereira, L.; Rocha-Santos, T.; da Costa, J.P.; Silva, A.; Duarte, A.C.; et al. Sargassum muticum and Osmundea pinnatifida Enzymatic Extracts: Chemical, Structural, and Cytotoxic Characterization. Mar. Drugs 2019, 17, 209. [Google Scholar] [CrossRef]
- Dang, T.T.; Bowyer, M.C.; Van Altena, I.A.; Scarlett, C.J. Optimum Conditions of Microwave-Assisted Extraction for Phenolic Compounds and Antioxidant Capacity of the Brown Alga Sargassum Vestitum. Sep. Sci. Technol. 2018, 53, 1711–1723. [Google Scholar] [CrossRef]
- Quitério, E.; Grosso, C.; Ferraz, R.; Delerue-Matos, C.; Soares, C. A Critical Comparison of the Advanced Extraction Techniques Applied to Obtain Health-Promoting Compounds from Seaweeds. Mar. Drugs 2022, 20, 677. [Google Scholar] [CrossRef]
- Grosso, C.; Valentão, P.; Ferreres, F.; Andrade, P.B. Alternative and Efficient Extraction Methods for Marine-Derived Compounds. Mar. Drugs 2015, 13, 3182–3230. [Google Scholar] [CrossRef]
- Yolmeh, M.; Jafari, S.M. Applications of Response Surface Methodology in the Food Industry Processes. Food Bioprocess Technol. 2017, 10, 413–433. [Google Scholar] [CrossRef]
- Liu, Z.; Ren, Z.; Zhang, J.; Chuang, C.-C.; Kandaswamy, E.; Zhou, T.; Zuo, L. Role of ROS and Nutritional Antioxidants in Human Diseases. Front. Physiol. 2018, 9, 477. [Google Scholar] [CrossRef]
- Cassani, L.; Silva, A.; Carpena, M.; Pellegrini, M.C.; García-Pérez, P.; Grosso, C.; Barroso, M.F.; Simal-Gandara, J.; Gómez-Zavaglia, A.; Prieto, M.A. Phytochemical Compounds with Promising Biological Activities from Ascophyllum Nodosum Extracts Using Microwave-Assisted Extraction. Food Chem. 2024, 438, 138037. [Google Scholar] [CrossRef]
- Cassani, L.; Tomadoni, B.; Ponce, A.; Agüero, M.V.; Moreira, M.R. Combined Use of Ultrasound and Vanillin to Improve Quality Parameters and Safety of Strawberry Juice Enriched with Prebiotic Fibers. Food Bioprocess Technol. 2017, 10, 1454–1465. [Google Scholar] [CrossRef]
- Okawa, M.; Kinjo, J.; Nohara, T.; Ono, M. DPPH (1,1-Diphenyl-2-Picrylhydrazyl) Radical Scavenging Activity of Flavonoids Obtained from Some Medicinal Plants. Biol. Pharm. Bull. 2001, 24, 1202–1205. [Google Scholar] [CrossRef] [PubMed]
- Viacava, G.E.; Goyeneche, R.; Goñi, M.G.; Roura, S.I.; Agüero, M.V. Natural Elicitors as Preharvest Treatments to Improve Postharvest Quality of Butterhead Lettuce. Sci. Hortic. 2018, 228, 145–152. [Google Scholar] [CrossRef]
- Lage, M.Á.P.; García, M.A.M.; Álvarez, J.A.V.; Anders, Y.; Curran, T.P. A New Microplate Procedure for Simultaneous Assessment of Lipophilic and Hydrophilic Antioxidants and Pro-Oxidants, Using Crocin and β-Carotene Bleaching Methods in a Single Combined Assay: Tea Extracts as a Case Study. Food Res. Int. 2013, 53, 836–846. [Google Scholar] [CrossRef]
- Oliveira, A.P.; Valentão, P.; Pereira, J.A.; Silva, B.M.; Tavares, F.; Andrade, P.B. Ficus carica L.: Metabolic and Biological Screening. Food Chem. Toxicol. 2009, 47, 2841–2846. [Google Scholar] [CrossRef]
- Gülçin, İ.; Mshvildadze, V.; Gepdiremen, A.; Elias, R. Screening of Antiradical and Antioxidant Activity of Monodesmosides and Crude Extract from Leontice Smirnowii Tuber. Phytomedicine 2006, 13, 343–351. [Google Scholar] [CrossRef] [PubMed]
- Mancini, S.; Nardo, L.; Gregori, M.; Ribeiro, I.; Mantegazza, F.; Delerue-Matos, C.; Masserini, M.; Grosso, C. Functionalized Liposomes and Phytosomes Loading Annona muricata L. Aqueous Extract: Potential Nanoshuttles for Brain-Delivery of Phenolic Compounds. Phytomedicine 2018, 42, 233–244. [Google Scholar] [CrossRef] [PubMed]
- Smirnoff, N.; Cumbes, Q.J. Hydroxyl Radical Scavenging Activity of Compatible Solutes. Phytochemistry 1989, 28, 1057–1060. [Google Scholar] [CrossRef]
- Geng, M.; Ren, M.; Liu, Z.; Shang, X. Free Radical Scavenging Activities of Pigment Extract from Hibiscus syriacus L. Petals In Vitro. Afr. J. Biotechnol. 2012, 11, 429–435. [Google Scholar] [CrossRef]
- Sun, J.; Zhang, X.; Broderick, M.; Fein, H. Measurement of Nitric Oxide Production in Biological Systems by Using Griess Reaction Assay. Sensors 2003, 3, 276–284. [Google Scholar] [CrossRef]
- Soares, C.; Paíga, P.; Marques, M.; Neto, T.; Carvalho, A.P.; Paiva, A.; Simões, P.; Costa, L.; Bernardo, A.; Fernández, N.; et al. Multi-Step Subcritical Water Extracts of Fucus vesiculosus L. and Codium tomentosum Stackhouse: Composition, Health-Benefits and Safety. Processes 2021, 9, 893. [Google Scholar] [CrossRef]
- Paz, M.; Gúllon, P.; Barroso, M.F.; Carvalho, A.P.; Domingues, V.F.; Gomes, A.M.; Becker, H.; Longhinotti, E.; Delerue-Matos, C. Brazilian Fruit Pulps as Functional Foods and Additives: Evaluation of Bioactive Compounds. Food Chem. 2015, 172, 462–468. [Google Scholar] [CrossRef]
- Silva, A.; Rodrigues, C.; Garcia-Oliveira, P.; Lourenço-Lopes, C.; Silva, S.A.; Garcia-Perez, P.; Carvalho, A.P.; Domingues, V.F.; Barroso, M.F.; Delerue-Matos, C.; et al. Screening for Bioactive Properties on Brown Algae from the Northwest Iberian Peninsula. Foods 2021, 10, 1915. [Google Scholar] [CrossRef]
- Ellman, G.L.; Courtney, K.D.; Andres, V.; Featherstone, R.M. A New and Rapid Colorimetric Determination of Acetylcholinesterase Activity. Biochem. Pharmacol. 1961, 7, 88–95. [Google Scholar] [CrossRef]
- Delerue, T.; Fátima Barroso, M.; Dias-Teixeira, M.; Figueiredo-González, M.; Delerue-Matos, C.; Grosso, C. Interactions between Ginkgo biloba L. and Scutellaria Baicalensis Georgi in Multicomponent Mixtures towards Cholinesterase Inhibition and ROS Scavenging. Food Res. Int. 2021, 140, 109857. [Google Scholar] [CrossRef]
- Weissbach, H.; Smith, T.E.; Daly, J.W.; Witkop, B.; Udenfriend, S. A Rapid Spectrophotometric Assay of Monoamine Oxidase Based on the Rate of Disappearance of Kynuramine. J. Biol. Chem. 1960, 235, 1160–1163. [Google Scholar] [CrossRef]
- Masuda, T.; Yamashita, D.; Takeda, Y.; Yonemori, S. Screening for Tyrosinase Inhibitors among Extracts of Seashore Plants and Identification of Potent Ihibitors from Garcinia subelliptica. Biosci. Biotechnol. Biochem. 2005, 69, 197–201. [Google Scholar] [CrossRef]
- Figueiredo-González, M.; Grosso, C.; Valentão, P.; Andrade, P.B. α-Glucosidase and α-Amylase Inhibitors from Myrcia Spp.: A Stronger Alternative to Acarbose? J. Pharm. Biomed. Anal. 2016, 118, 322–327. [Google Scholar] [CrossRef]
- Roriz, C.L.; Xavier, V.; Heleno, S.A.; Pinela, J.; Dias, M.I.; Calhelha, R.C.; Morales, P.; Ferreira, I.C.F.R.; Barros, L. Chemical and Bioactive Features of Amaranthus caudatus L. Flowers and Optimized Ultrasound-Assisted Extraction of Betalains. Foods 2021, 10, 779. [Google Scholar] [CrossRef]
- Vichai, V.; Kirtikara, K. Sulforhodamine B Colorimetric Assay for Cytotoxicity Screening. Nat. Protoc. 2006, 1, 1112–1116. [Google Scholar] [CrossRef]
- Calhelha, R.C.; Martínez, M.A.; Prieto, M.A.; Ferreira, I.C.F.R. Mathematical Models of Cytotoxic Effects in Endpoint Tumor Cell Line Assays: Critical Assessment of the Application of a Single Parametric Value as a Standard Criterion to Quantify the Dose–Response Effects and New Unexplored Proposal Formats. Analyst 2017, 142, 4124–4141. [Google Scholar] [CrossRef]
- Rumpf, J.; Burger, R.; Schulze, M. Statistical Evaluation of DPPH, ABTS, FRAP, and Folin-Ciocalteu Assays to Assess the Antioxidant Capacity of Lignins. Int. J. Biol. Macromol. 2023, 233, 123470. [Google Scholar] [CrossRef]
- Casas, M.P.; Conde, E.; Domínguez, H.; Moure, A. Ecofriendly Extraction of Bioactive Fractions from Sargassum muticum. Process Biochem. 2019, 79, 166–173. [Google Scholar] [CrossRef]
- Namvar, F.; Mohamad, R.; Baharara, J.; Zafar-Balanejad, S.; Fargahi, F.; Rahman, H.S. Antioxidant, Antiproliferative, and Antiangiogenesis Effects of Polyphenol-Rich Seaweed (Sargassum muticum). BioMed Res. Int. 2013, 2013, 604787. [Google Scholar] [CrossRef]
- Sabeena Farvin, K.H.; Jacobsen, C. Phenolic Compounds and Antioxidant Activities of Selected Species of Seaweeds from Danish Coast. Food Chem. 2013, 138, 1670–1681. [Google Scholar] [CrossRef]
- Rodrigues, D.; Sousa, S.; Silva, A.; Amorim, M.; Pereira, L.; Rocha-Santos, T.A.P.; Gomes, A.M.P.; Duarte, A.C.; Freitas, A.C. Impact of Enzyme- and Ultrasound-Assisted Extraction Methods on Biological Properties of Red, Brown, and Green Seaweeds from the Central West Coast of Portugal. J. Agric. Food Chem. 2015, 63, 3177–3188. [Google Scholar] [CrossRef]
- Erpel, F.; Mateos, R.; Pérez-Jiménez, J.; Pérez-Correa, J.R. Phlorotannins: From Isolation and Structural Characterization, to the Evaluation of Their Antidiabetic and Anticancer Potential. Food Res. Int. 2020, 137, 109589. [Google Scholar] [CrossRef]
- Olate-Gallegos, C.; Barriga, A.; Vergara, C.; Fredes, C.; García, P.; Giménez, B.; Robert, P. Identification of Polyphenols from Chilean Brown Seaweeds Extracts by LC-DAD-ESI-MS/MS. J. Aquat. Food Prod. Technol. 2019, 28, 375–391. [Google Scholar] [CrossRef]
- Isaza Martínez, J.H.; Torres Castañeda, H.G. Preparation and Chromatographic Analysis of Phlorotannins. J. Chromatogr. Sci. 2013, 51, 825–838. [Google Scholar] [CrossRef]
- Agregán, R.; Munekata, P.E.S.; Franco, D.; Dominguez, R.; Carballo, J.; Lorenzo, J.M. Phenolic Compounds from Three Brown Seaweed Species Using LC-DAD–ESI-MS/MS. Food Res. Int. 2017, 99, 979–985. [Google Scholar] [CrossRef]
- Catarino, M.D.; Pires, S.M.G.; Silva, S.; Costa, F.; Braga, S.S.; Pinto, D.C.G.A.; Silva, A.M.S.; Cardoso, S.M. Overview of Phlorotannins’ Constituents in Fucales. Mar. Drugs 2022, 20, 754. [Google Scholar] [CrossRef]
- Zhong, B.; Robinson, N.A.; Warner, R.D.; Barrow, C.J.; Dunshea, F.R.; Suleria, H.A.R. LC-ESI-QTOF-MS/MS Characterization of Seaweed Phenolics and Their Antioxidant Potential. Mar. Drugs 2020, 18, 331. [Google Scholar] [CrossRef]
- Montero, L.; Sánchez-Camargo, A.P.; García-Cañas, V.; Tanniou, A.; Stiger-Pouvreau, V.; Russo, M.; Rastrelli, L.; Cifuentes, A.; Herrero, M.; Ibáñez, E. Anti-Proliferative Activity and Chemical Characterization by Comprehensive Two-Dimensional Liquid Chromatography Coupled to Mass Spectrometry of Phlorotannins from the Brown Macroalga Sargassum muticum Collected on North-Atlantic Coasts. J. Chromatogr. A 2016, 1428, 115–125. [Google Scholar] [CrossRef]
- Elsaman, S.; Elsonbaty, S.M.; Moawed, F.S.M.; Hegazy, M.G.A. Evaluation of Brown Micro-Algae Synergies With Low Dose γ -Radiation Against Chronic Hepatitis Induced by D-Galactosamine in Rats. Dose-Response 2023, 21, 155932582311694. [Google Scholar] [CrossRef]
- Grina, F.; Ullah, Z.; Kaplaner, E.; Moujahid, A.; Eddoha, R.; Nasser, B.; Terzioğlu, P.; Yilmaz, M.A.; Ertaş, A.; Öztürk, M.; et al. In Vitro Enzyme Inhibitory Properties, Antioxidant Activities, and Phytochemical Fingerprints of Five Moroccan Seaweeds. S. Afr. J. Bot. 2020, 128, 152–160. [Google Scholar] [CrossRef]
- Tatsis, E.C.; Boeren, S.; Exarchou, V.; Troganis, A.N.; Vervoort, J.; Gerothanassis, I.P. Identification of the Major Constituents of Hypericum Perforatum by LC/SPE/NMR and/or LC/MS. Phytochemistry 2007, 68, 383–393. [Google Scholar] [CrossRef]
- Ghallab, D.S.; Shawky, E.; Ibrahim, R.S.; Mohyeldin, M.M. Comprehensive Metabolomics Unveil the Discriminatory Metabolites of Some Mediterranean Sea Marine Algae in Relation to Their Cytotoxic Activities. Sci. Rep. 2022, 12, 8094. [Google Scholar] [CrossRef]
- Vallverdú-Queralt, A.; Regueiro, J.; Martínez-Huélamo, M.; Rinaldi Alvarenga, J.F.; Leal, L.N.; Lamuela-Raventos, R.M. A Comprehensive Study on the Phenolic Profile of Widely Used Culinary Herbs and Spices: Rosemary, Thyme, Oregano, Cinnamon, Cumin and Bay. Food Chem. 2014, 154, 299–307. [Google Scholar] [CrossRef]
- Siciliano, T.; De Tommasi, N.; Morelli, I.; Braca, A. Study of Flavonoids of Sechium Edule (Jacq) Swartz (Cucurbitaceae) Different Edible Organs by Liquid Chromatography Photodiode Array Mass Spectrometry. J. Agric. Food Chem. 2004, 52, 6510–6515. [Google Scholar] [CrossRef]
- Gancel, A.-L.; Alter, P.; Dhuique-Mayer, C.; Ruales, J.; Vaillant, F. Identifying Carotenoids and Phenolic Compounds In Naranjilla (Solanum Quitoense Lam. Var. Puyo Hybrid), an Andean Fruit. J. Agric. Food Chem. 2008, 56, 11890–11899. [Google Scholar] [CrossRef]
- Martins, B.T.; Correia da Silva, M.; Pinto, M.; Cidade, H.; Kijjoa, A. Marine Natural Flavonoids: Chemistry and Biological Activities. Nat. Prod. Res. 2019, 33, 3260–3272. [Google Scholar] [CrossRef]
- Rattmann, Y.D.; Mendéz-Sánchez, S.C.; Furian, A.F.; Paludo, K.S.; de Souza, L.M.; Dartora, N.; Oliveira, M.S.; Costa, E.M.d.S.; Miguel, O.G.; Sassaki, G.L.; et al. Standardized Extract of Dicksonia sellowiana Presl. Hook (Dicksoniaceae) Decreases Oxidative Damage in Cultured Endothelial Cells and in Rats. J. Ethnopharmacol. 2011, 133, 999–1007. [Google Scholar] [CrossRef] [PubMed]
- Rajauria, G. Optimization and Validation of Reverse Phase HPLC Method for Qualitative and Quantitative Assessment of Polyphenols in Seaweed. J. Pharm. Biomed. Anal. 2018, 148, 230–237. [Google Scholar] [CrossRef] [PubMed]
- Allwood, J.W.; Evans, H.; Austin, C.; McDougall, G.J. Extraction, Enrichment, and LC-MSn-Based Characterization of Phlorotannins and Related Phenolics from the Brown Seaweed, Ascophyllum Nodosum. Mar. Drugs 2020, 18, 448. [Google Scholar] [CrossRef] [PubMed]
- Vázquez-Rodríguez, B.; Gutiérrez-Uribe, J.A.; Antunes-Ricardo, M.; Santos-Zea, L.; Cruz-Suárez, L.E. Ultrasound-Assisted Extraction of Phlorotannins and Polysaccharides from Silvetia compressa (Phaeophyceae). J. Appl. Phycol. 2020, 32, 1441–1453. [Google Scholar] [CrossRef]
- Li, Y.; Fu, X.; Duan, D.; Liu, X.; Xu, J.; Gao, X. Extraction and Identification of Phlorotannins from the Brown Alga, Sargassum Fusiforme (Harvey) Setchell. Mar. Drugs 2017, 15, 49. [Google Scholar] [CrossRef] [PubMed]
- Lopes, G.; Barbosa, M.; Vallejo, F.; Gil-Izquierdo, Á.; Andrade, P.B.; Valentão, P.; Pereira, D.M.; Ferreres, F. Profiling Phlorotannins from Fucus Spp. of the Northern Portuguese Coastline: Chemical Approach by HPLC-DAD-ESI/MS and UPLC-ESI-QTOF/MS. Algal Res. 2018, 29, 113–120. [Google Scholar] [CrossRef]
- Catarino, M.D.; Silva, A.; Cruz, M.T.; Mateus, N.; Silva, A.M.S.; Cardoso, S.M. Phlorotannins from Fucus Vesiculosus: Modulation of Inflammatory Response by Blocking NF-ΚB Signaling Pathway. Int. J. Mol. Sci. 2020, 21, 6897. [Google Scholar] [CrossRef] [PubMed]
- Wang, T.; Jónsdóttir, R.; Liu, H.; Gu, L.; Kristinsson, H.G.; Raghavan, S.; Ólafsdóttir, G. Antioxidant Capacities of Phlorotannins Extracted from the Brown Algae Fucus Vesiculosus. J. Agric. Food Chem. 2012, 60, 5874–5883. [Google Scholar] [CrossRef] [PubMed]
- Vissers, A.M.; Caligiani, A.; Sforza, S.; Vincken, J.-P.; Gruppen, H. Phlorotannin Composition of Laminaria Digitata. Phytochem. Anal. 2017, 28, 487–495. [Google Scholar] [CrossRef]
- Hermund, D.B.; Plaza, M.; Turner, C.; Jónsdóttir, R.; Kristinsson, H.G.; Jacobsen, C.; Nielsen, K.F. Structure Dependent Antioxidant Capacity of Phlorotannins from Icelandic Fucus Vesiculosus by UHPLC-DAD-ECD-QTOFMS. Food Chem. 2018, 240, 904–909. [Google Scholar] [CrossRef]
- Amarante, S.J.; Catarino, M.D.; Marçal, C.; Silva, A.M.S.; Ferreira, R.; Cardoso, S.M. Microwave-Assisted Extraction of Phlorotannins from Fucus Vesiculosus. Mar. Drugs 2020, 18, 559. [Google Scholar] [CrossRef] [PubMed]
- Zhang, R.; Yuen, A.K.L.; Magnusson, M.; Wright, J.T.; de Nys, R.; Masters, A.F.; Maschmeyer, T. A Comparative Assessment of the Activity and Structure of Phlorotannins from the Brown Seaweed Carpophyllum Flexuosum. Algal Res. 2018, 29, 130–141. [Google Scholar] [CrossRef]
- Chouh, A.; Nouadri, T.; Catarino, M.D.; Silva, A.M.S.; Cardoso, S.M. Phlorotannins of the Brown Algae Sargassum Vulgare from the Mediterranean Sea Coast. Antioxidants 2022, 11, 1055. [Google Scholar] [CrossRef] [PubMed]
- Treml, J.; Šmejkal, K. Flavonoids as Potent Scavengers of Hydroxyl Radicals. Compr. Rev. Food Sci. Food Saf. 2016, 15, 720–738. [Google Scholar] [CrossRef] [PubMed]
- Balboa, E.M.; Conde, E.; Moure, A.; Falqué, E.; Domínguez, H. In Vitro Antioxidant Properties of Crude Extracts and Compounds from Brown Algae. Food Chem. 2013, 138, 1764–1785. [Google Scholar] [CrossRef] [PubMed]
- Miyasaka, N.; Hirata, Y. Nitric Oxide and Inflammatory Arthritides. Life Sci. 1997, 61, 2073–2081. [Google Scholar] [CrossRef]
- Kalinowska, M.; Gołębiewska, E.; Świderski, G.; Męczyńska-Wielgosz, S.; Lewandowska, H.; Pietryczuk, A.; Cudowski, A.; Astel, A.; Świsłocka, R.; Samsonowicz, M.; et al. Plant-Derived and Dietary Hydroxybenzoic Acids—A Comprehensive Study of Structural, Anti-/Pro-Oxidant, Lipophilic, Antimicrobial, and Cytotoxic Activity in MDA-MB-231 and MCF-7 Cell Lines. Nutrients 2021, 13, 3107. [Google Scholar] [CrossRef]
- Phang, S.J.; Teh, H.X.; Looi, M.L.; Arumugam, B.; Fauzi, M.B.; Kuppusamy, U.R. Phlorotannins from Brown Algae: A Review on Their Antioxidant Mechanisms and Applications in Oxidative Stress-Mediated Diseases. J. Appl. Phycol. 2023, 35, 867–892. [Google Scholar] [CrossRef]
- Yang, E.-J.; Ham, Y.M.; Lee, W.J.; Lee, N.H.; Hyun, C.-G. Anti-Inflammatory Effects of Apo-9′-Fucoxanthinone from the Brown Alga, Sargassum muticum. DARU J. Pharm. Sci. 2013, 21, 62. [Google Scholar] [CrossRef] [PubMed]
- Pérez, M.J.; Falqué, E.; Domínguez, H. Antimicrobial Action of Compounds from Marine Seaweed. Mar. Drugs 2016, 14, 52. [Google Scholar] [CrossRef]
- Moorthi, P.V. Antimicrobial Properties of Marine Seaweed, Sargassum muticum against Human Pathogens. J. Coast. Life Med. 2015, 3, 122–125. [Google Scholar] [CrossRef]
- Puspita, M.; Déniel, M.; Widowati, I.; Radjasa, O.K.; Douzenel, P.; Marty, C.; Vandanjon, L.; Bedoux, G.; Bourgougnon, N. Total Phenolic Content and Biological Activities of Enzymatic Extracts from Sargassum muticum (Yendo) Fensholt. J. Appl. Phycol. 2017, 29, 2521–2537. [Google Scholar] [CrossRef] [PubMed]
- Feigin, V.L.; Nichols, E.; Alam, T.; Bannick, M.S.; Beghi, E.; Blake, N.; Culpepper, W.J.; Dorsey, E.R.; Elbaz, A.; Ellenbogen, R.G.; et al. Global, Regional, and National Burden of Neurological Disorders, 1990–2016: A Systematic Analysis for the Global Burden of Disease Study 2016. Lancet Neurol. 2019, 18, 459–480. [Google Scholar] [CrossRef] [PubMed]
- Gelenberg, A.J. The Prevalence and Impact of Depression. J. Clin. Psychiatry 2010, 71, e06. [Google Scholar] [CrossRef] [PubMed]
- Pinteus, S.; Lemos, M.F.L.; Alves, C.; Silva, J.; Pedrosa, R. The Marine Invasive Seaweeds Asparagopsis armata and Sargassum muticum as Targets for Greener Antifouling Solutions. Sci. Total Environ. 2021, 750, 141372. [Google Scholar] [CrossRef] [PubMed]
- Nagatsu, T.; Nakashima, A.; Watanabe, H.; Ito, S.; Wakamatsu, K. Neuromelanin in Parkinson’s Disease: Tyrosine Hydroxylase and Tyrosinase. Int. J. Mol. Sci. 2022, 23, 4176. [Google Scholar] [CrossRef]
- Hasegawa, T. Tyrosinase-Expressing Neuronal Cell Line as in Vitro Model of Parkinson’s Disease. Int. J. Mol. Sci. 2010, 11, 1082–1089. [Google Scholar] [CrossRef]
- Barbosa, M.; Fernandes, F.; Carlos, M.J.; Valentão, P.; Andrade, P.B. Adding Value to Marine Invaders by Exploring the Potential of Sargassum muticum (Yendo) Fensholt Phlorotannin Extract on Targets Underlying Metabolic Changes in Diabetes. Algal Res. 2021, 59, 102455. [Google Scholar] [CrossRef]
Disclaimer/Publisher’s Note: The statements, opinions and data contained in all publications are solely those of the individual author(s) and contributor(s) and not of MDPI and/or the editor(s). MDPI and/or the editor(s) disclaim responsibility for any injury to people or property resulting from any ideas, methods, instructions or products referred to in the content. |
© 2024 by the authors. Licensee MDPI, Basel, Switzerland. This article is an open access article distributed under the terms and conditions of the Creative Commons Attribution (CC BY) license (https://creativecommons.org/licenses/by/4.0/).