
Ameliorative Effect of Chitosan/Spirulina platensis Ethanolic Extract Nanoformulation against Cyclophosphamide-Induced Ovarian Toxicity: Role of PPAR-γ/Nrf-2/HO-1 and NF-kB/TNF-α Signaling Pathways

 , , , ,
  and
and
Abstract
:1. Introduction
2. Results
2.1. In Vitro Analysis
2.1.1. Antioxidant, Total Phenolic, and Total Flavonoid Contents of the SP Ethanolic Extract
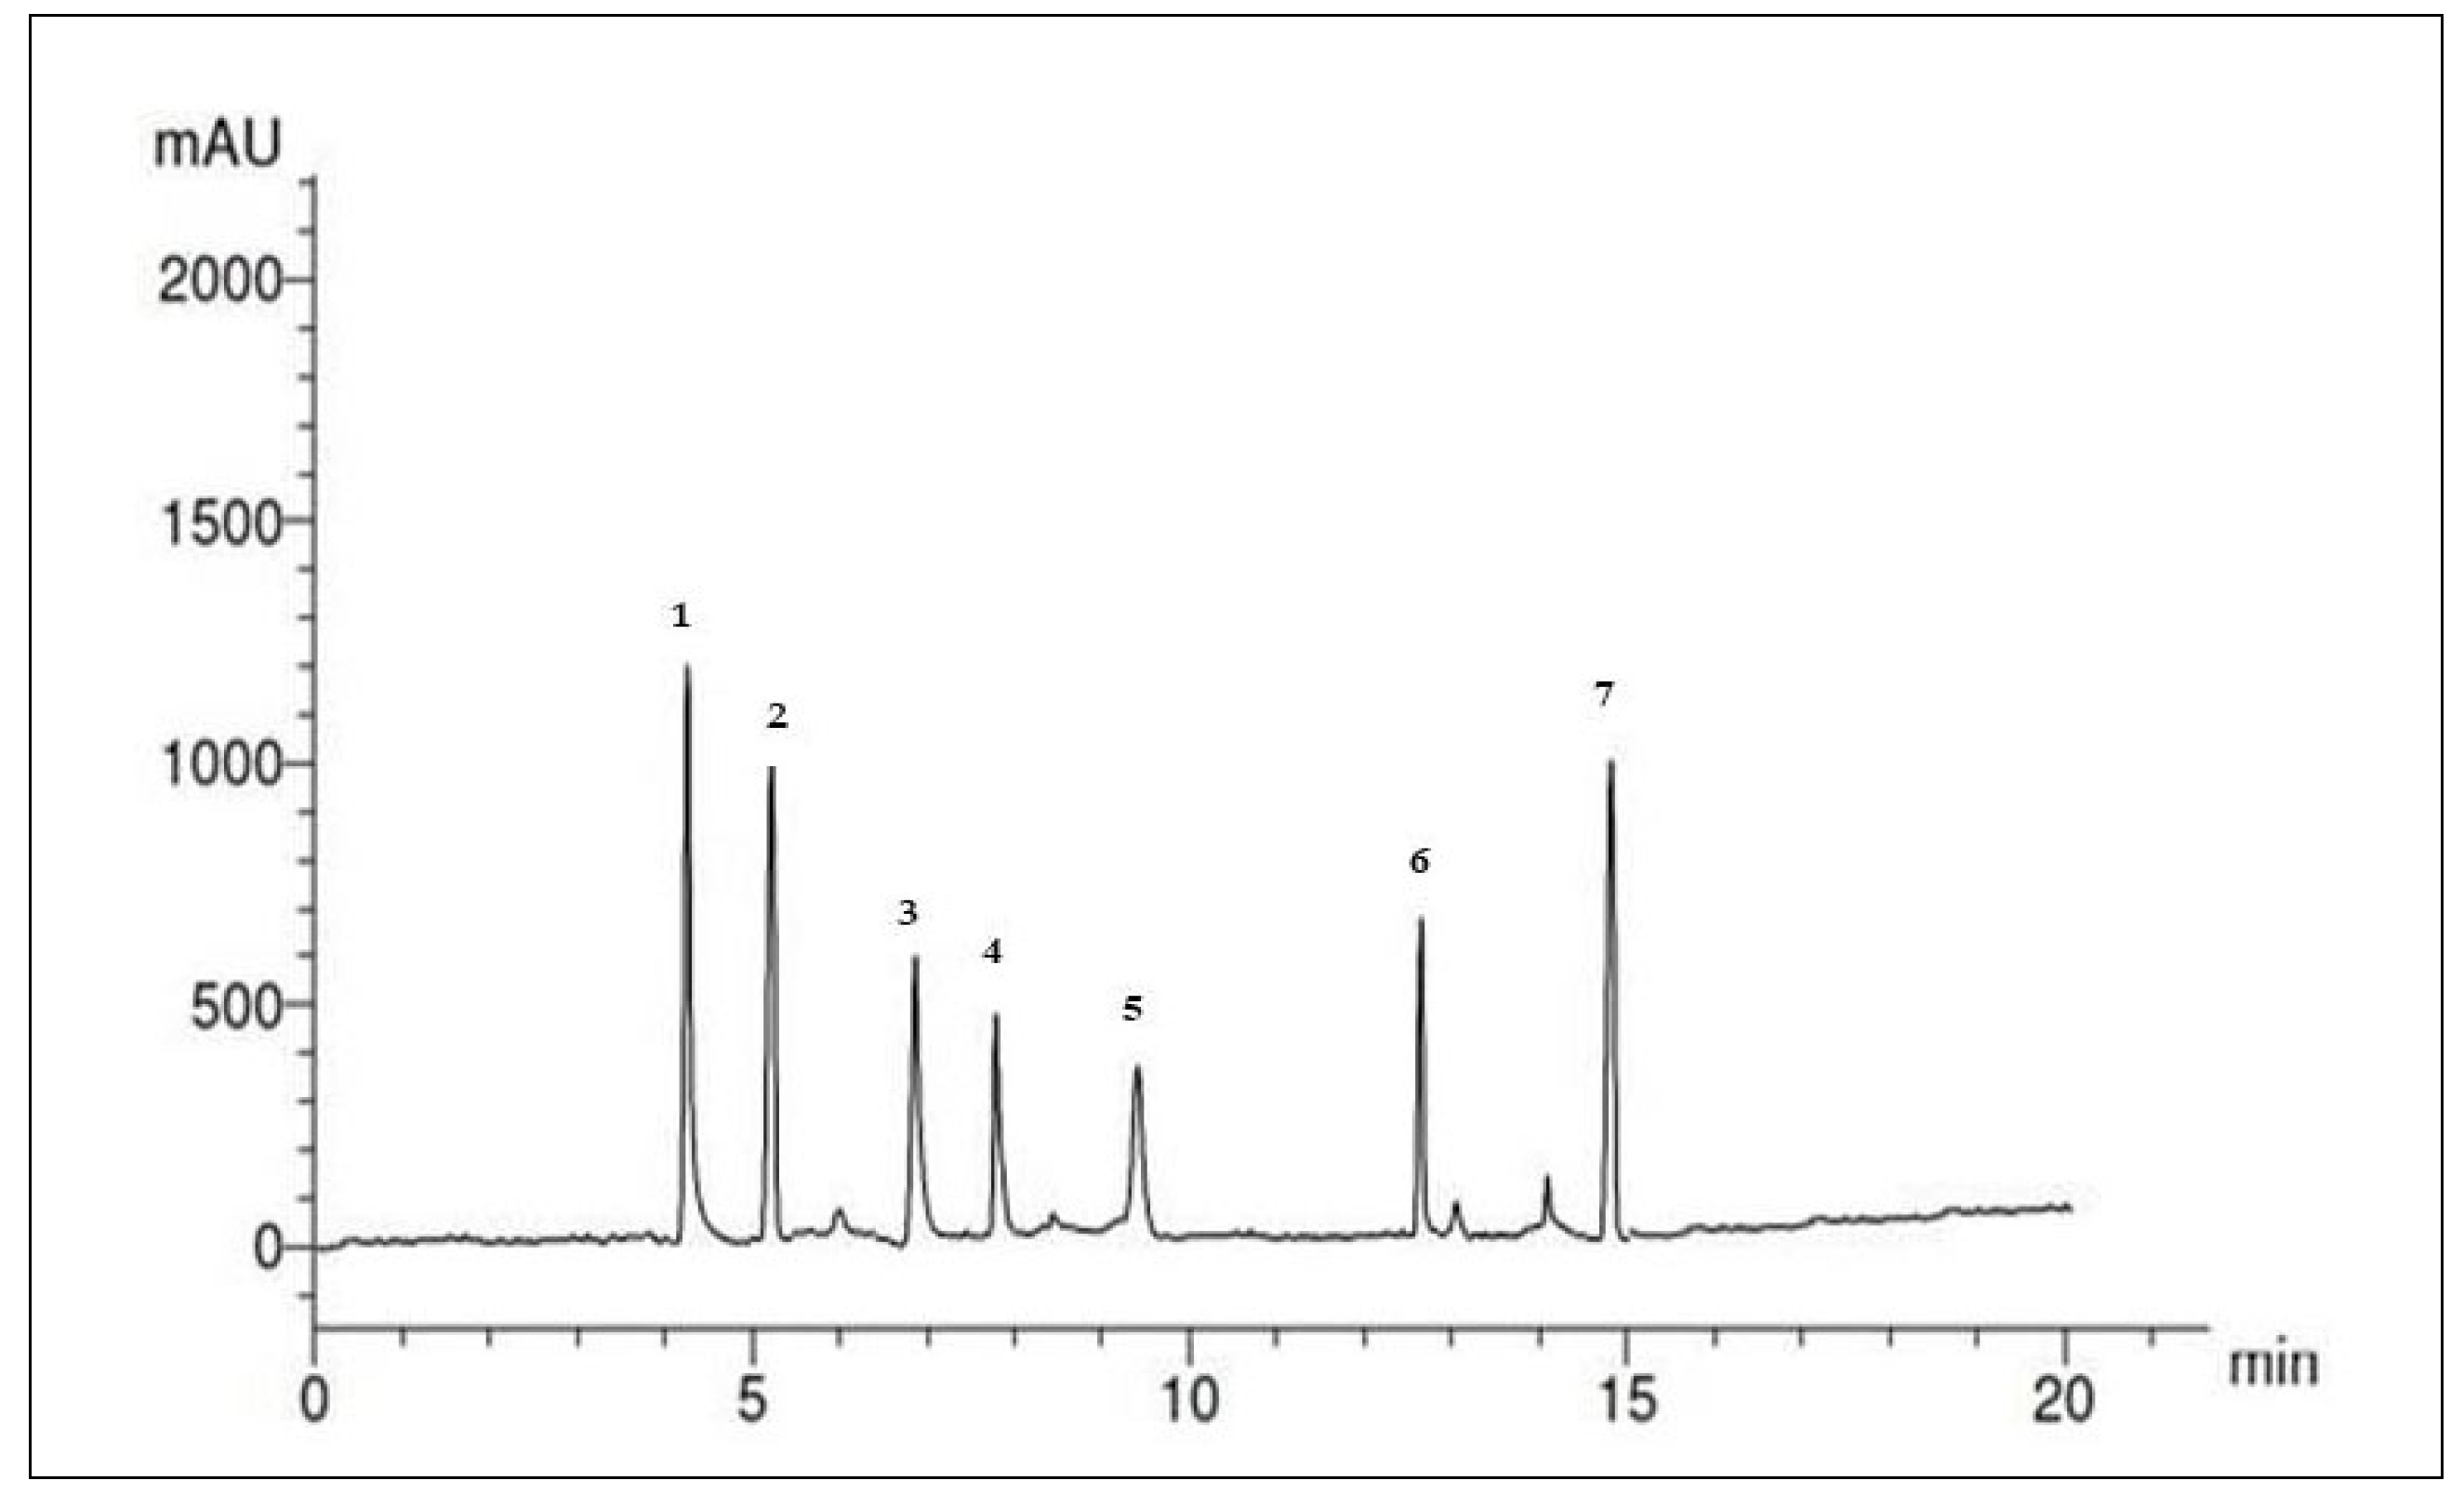
2.1.2. Analyses of Phenolic and Flavonoid Compounds in the SP Ethanolic Extract Using HPLC
2.1.3. GC-MS Analysis of the SP Ethanolic Extract
2.1.4. Characterization of SP Nanoparticles
Analyses of the Percentage Yield, Particle Size, and Zeta Potential
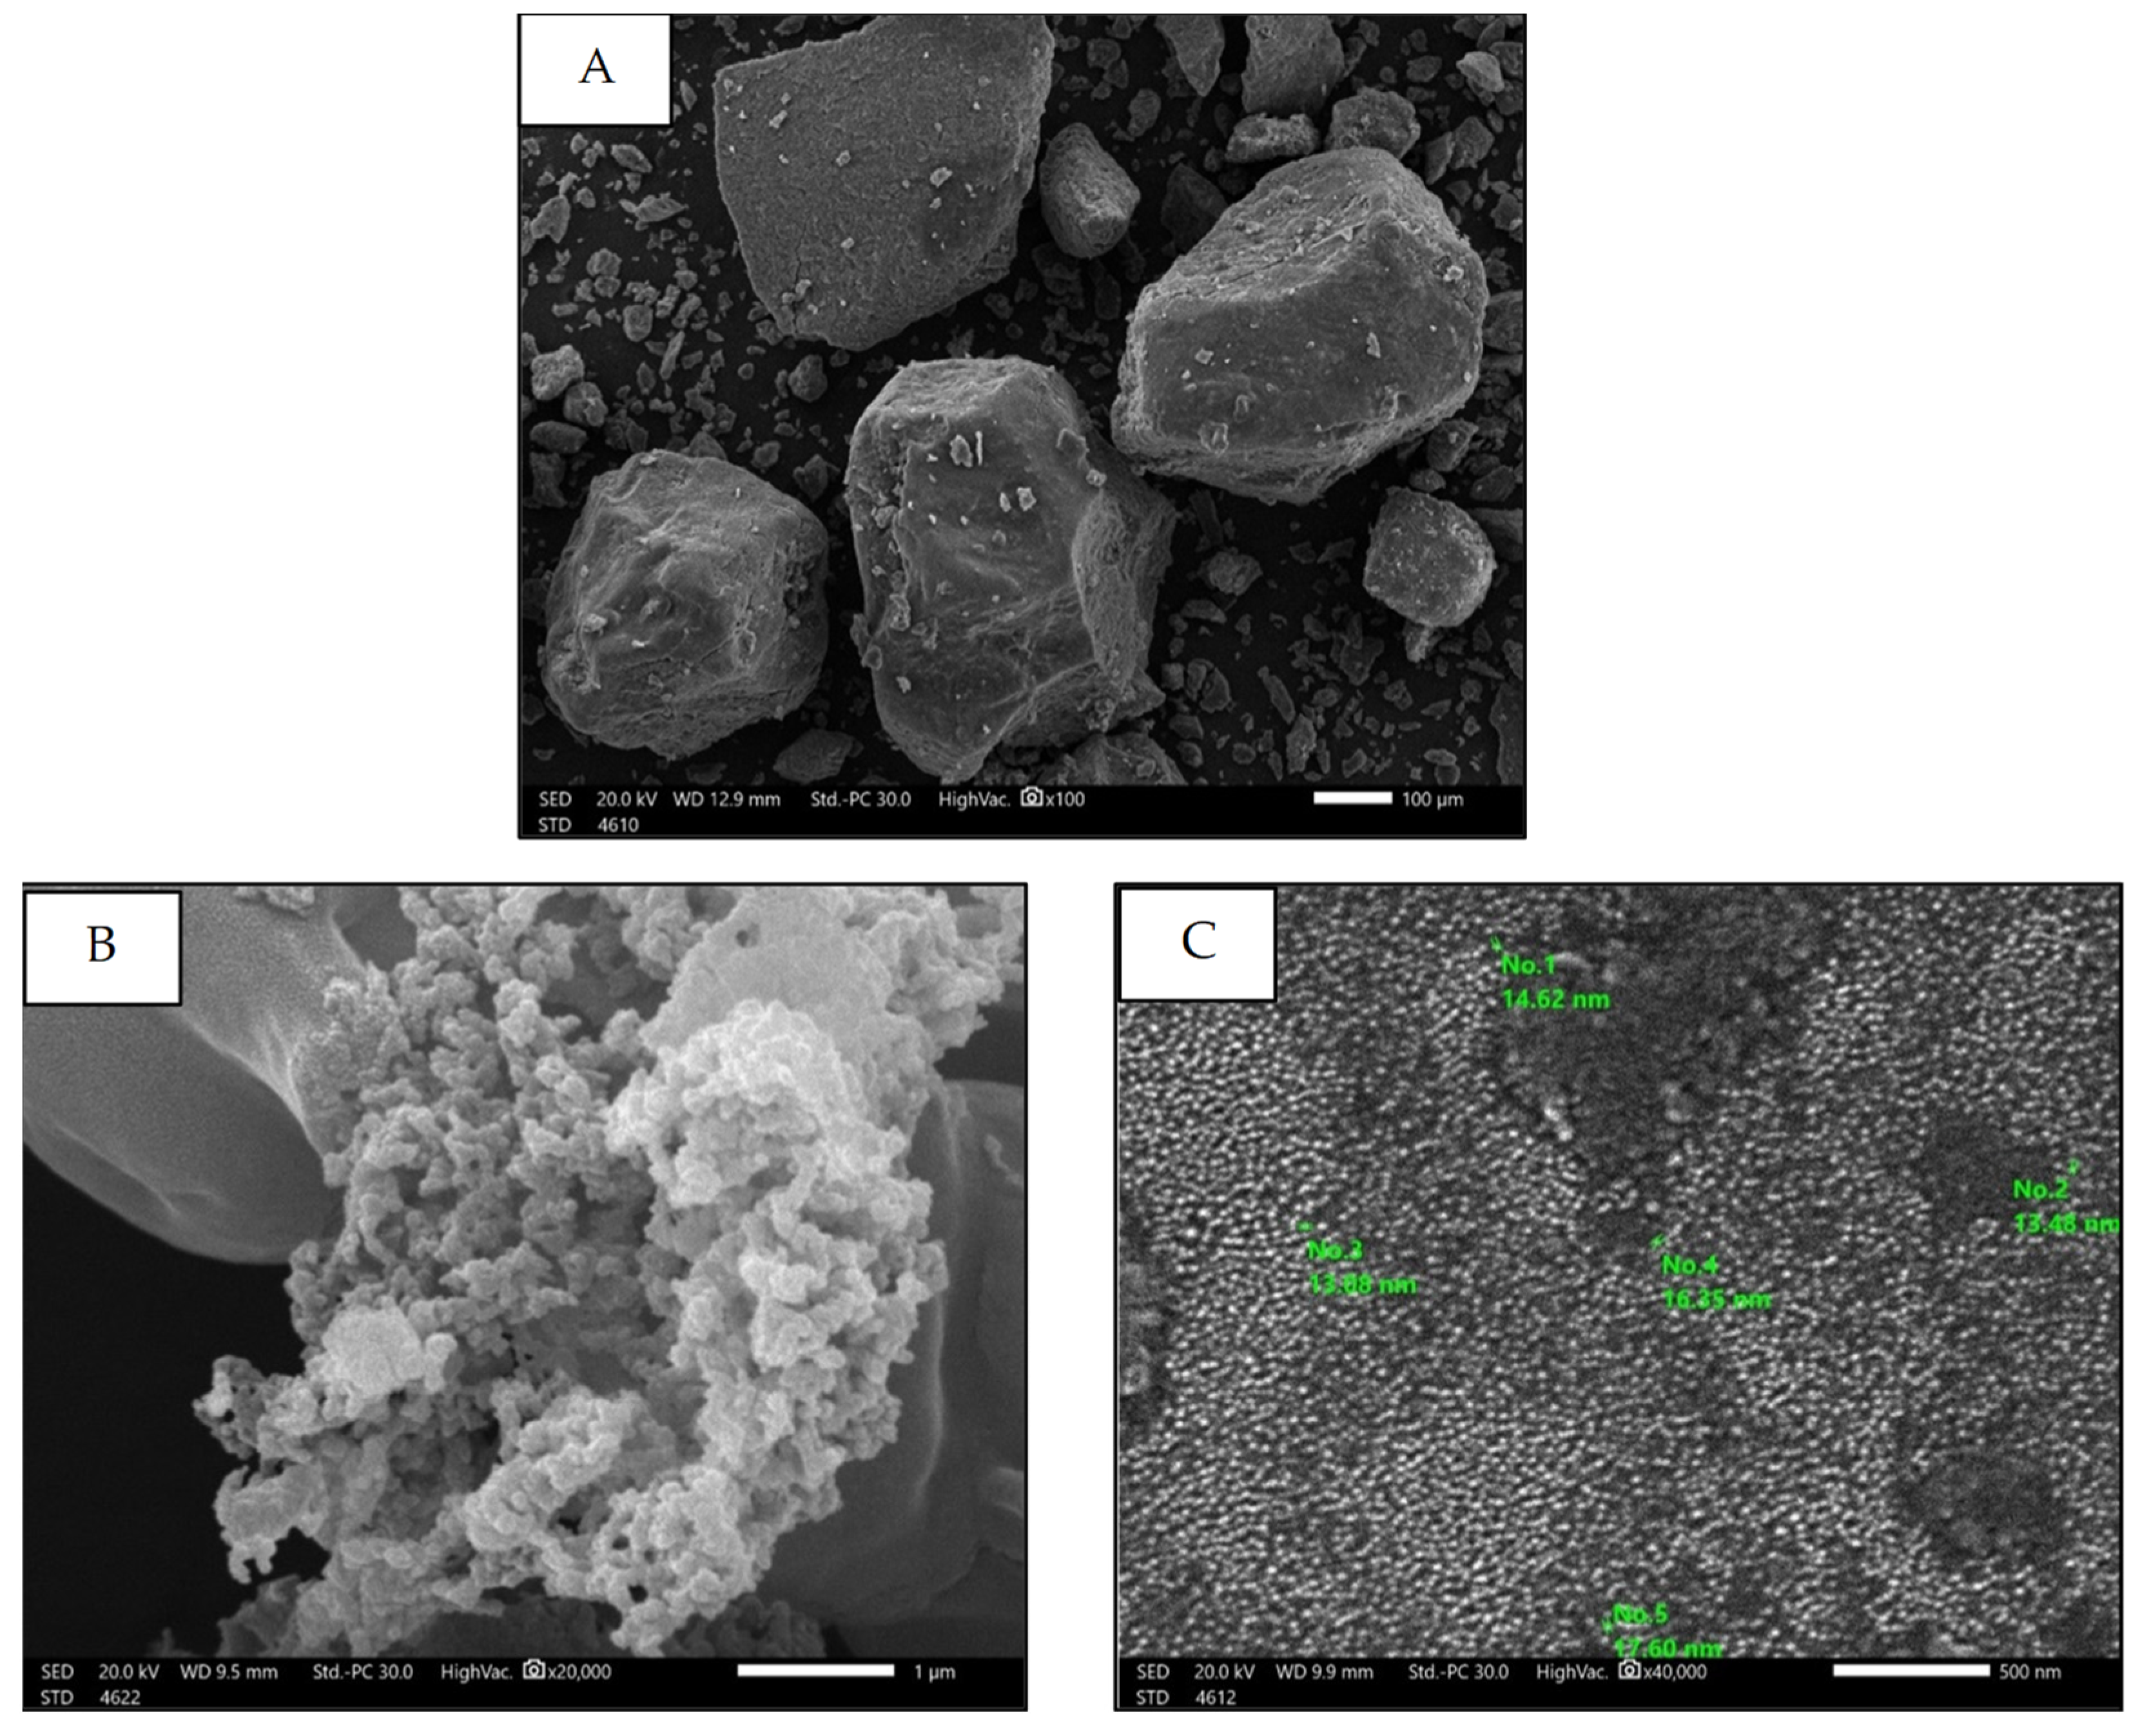
Scanning Electron Microscopy (SEM)
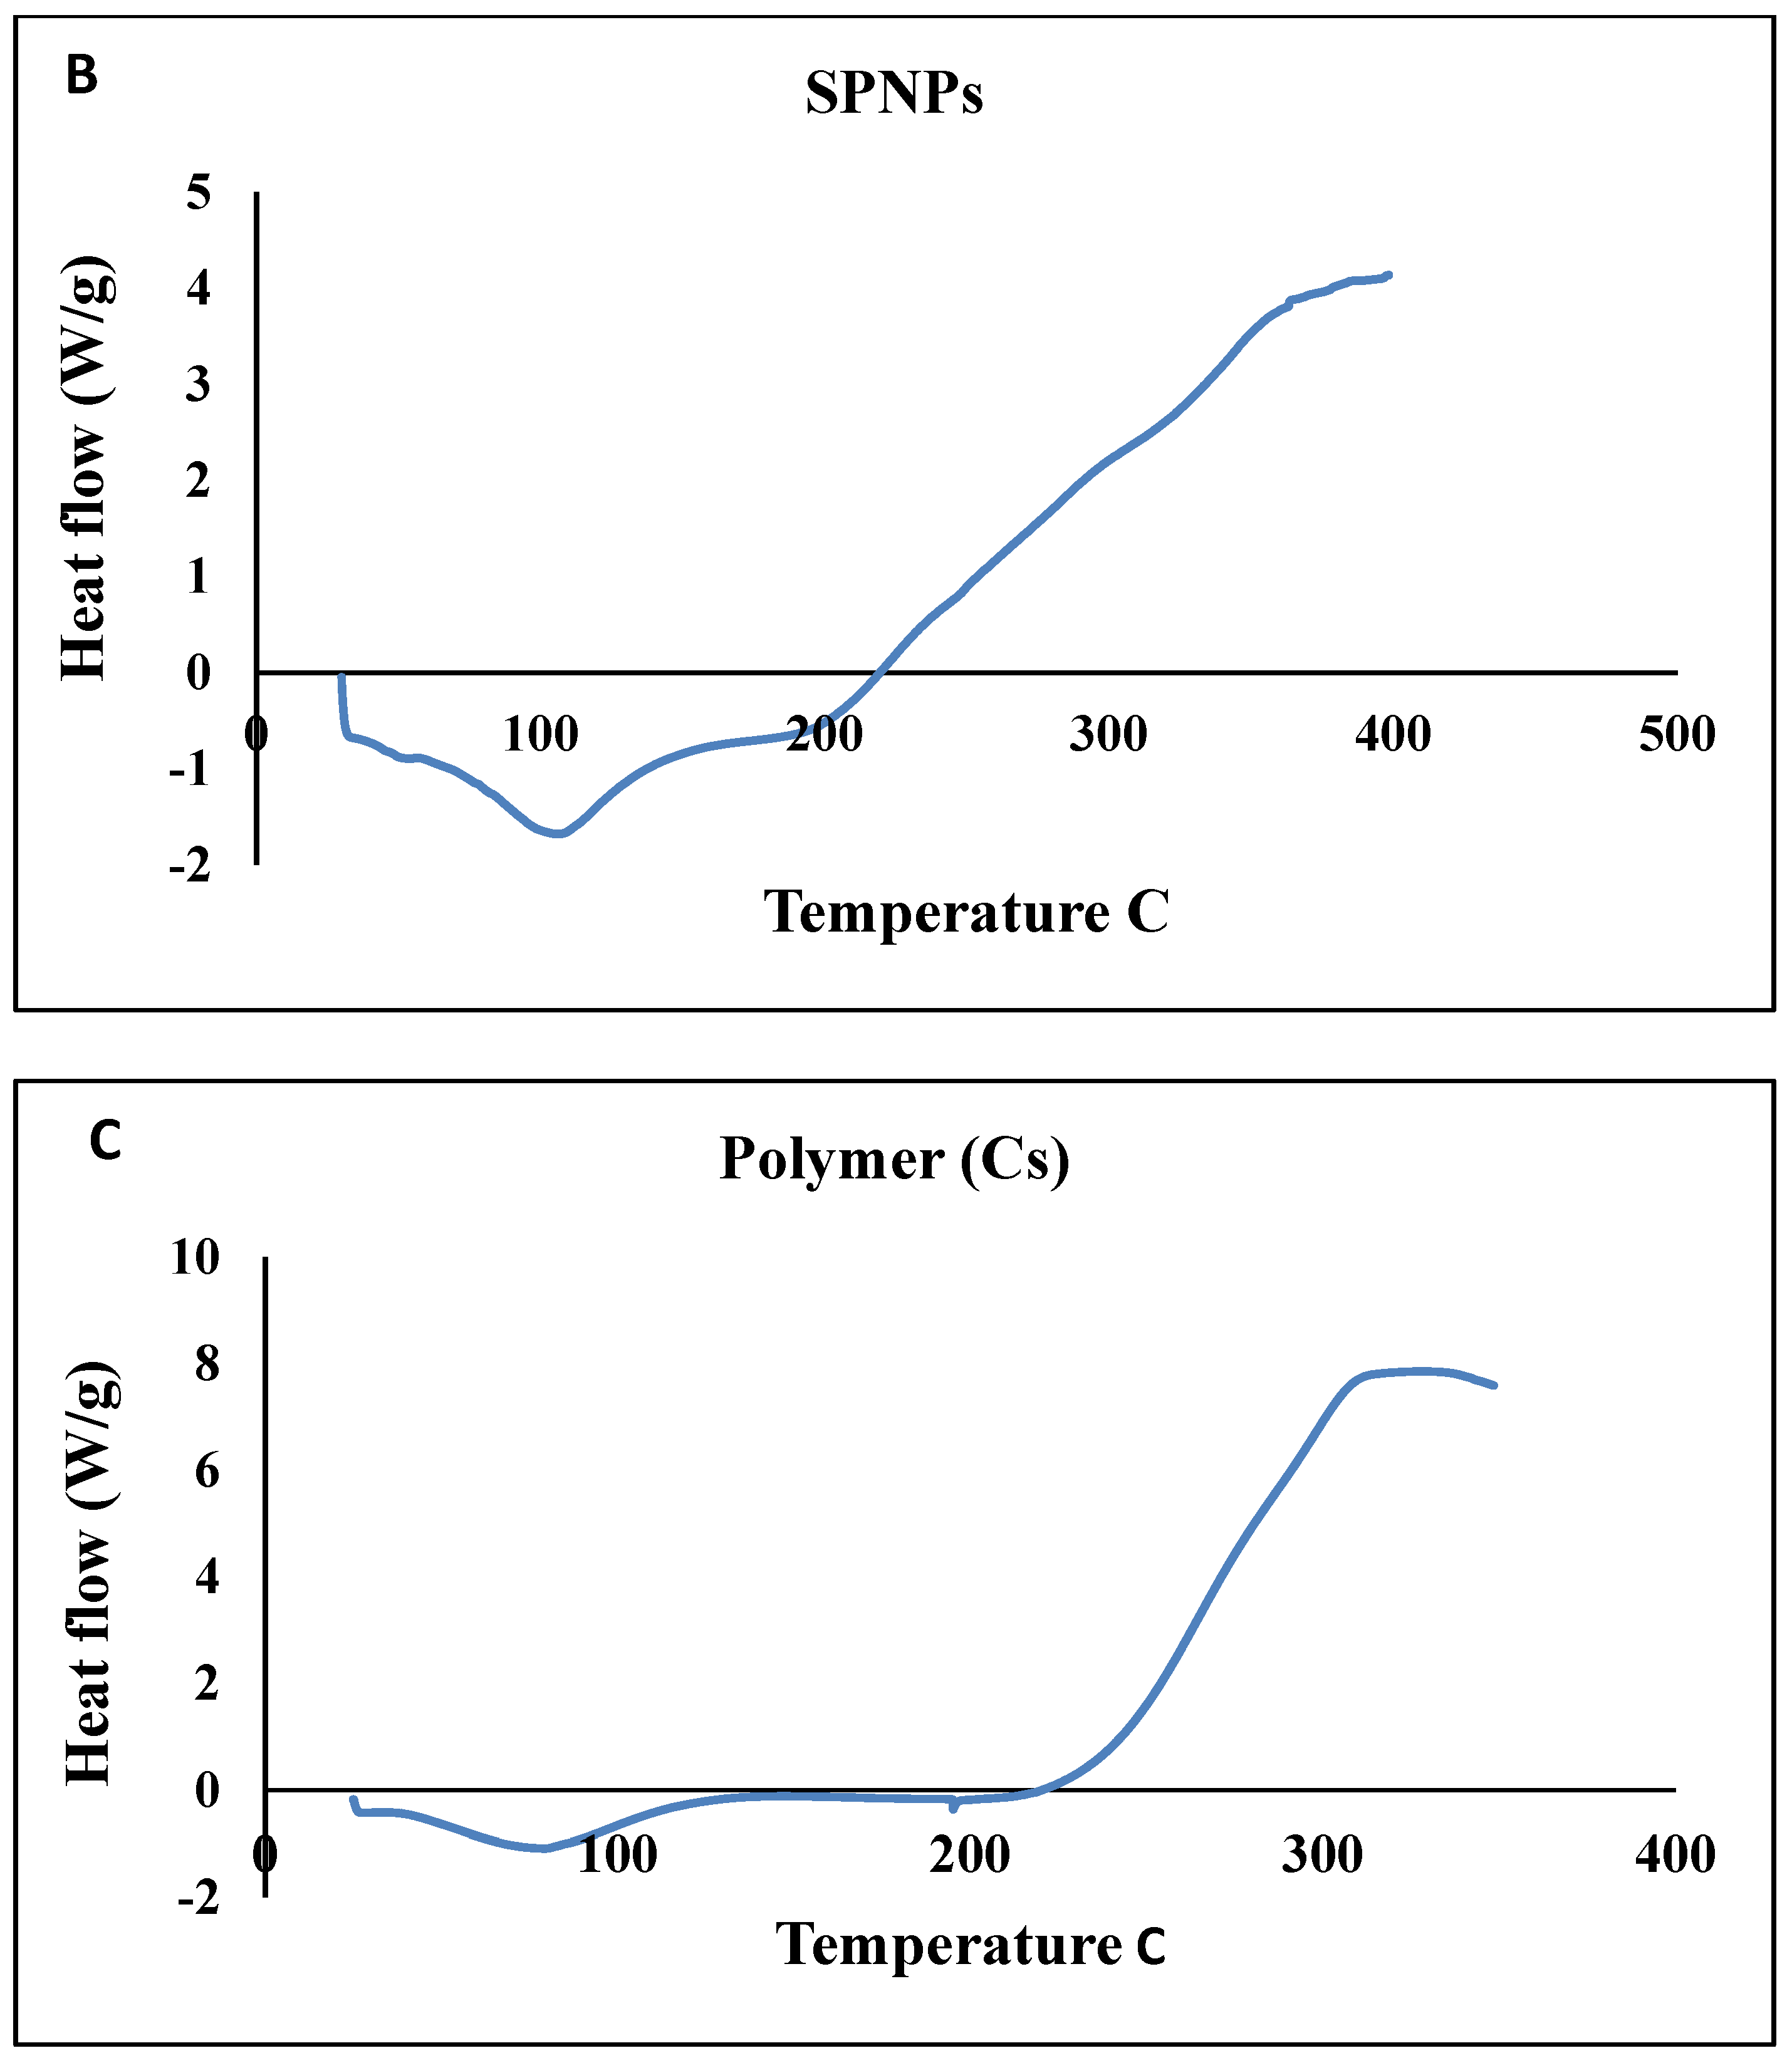
Thermal Stability (DSC)
X-ray Diffraction Analysis (XRD)
2.2. Biological Investigations
2.2.1. Effects of Free SP Extract and the Nanoformulation on Estradiol, Progesterone, and Anti-Mullerian Hormone Levels in Serum
2.2.2. Effects of Free SP Extract and the Nanoformulation on FSH and LH Levels in Serum
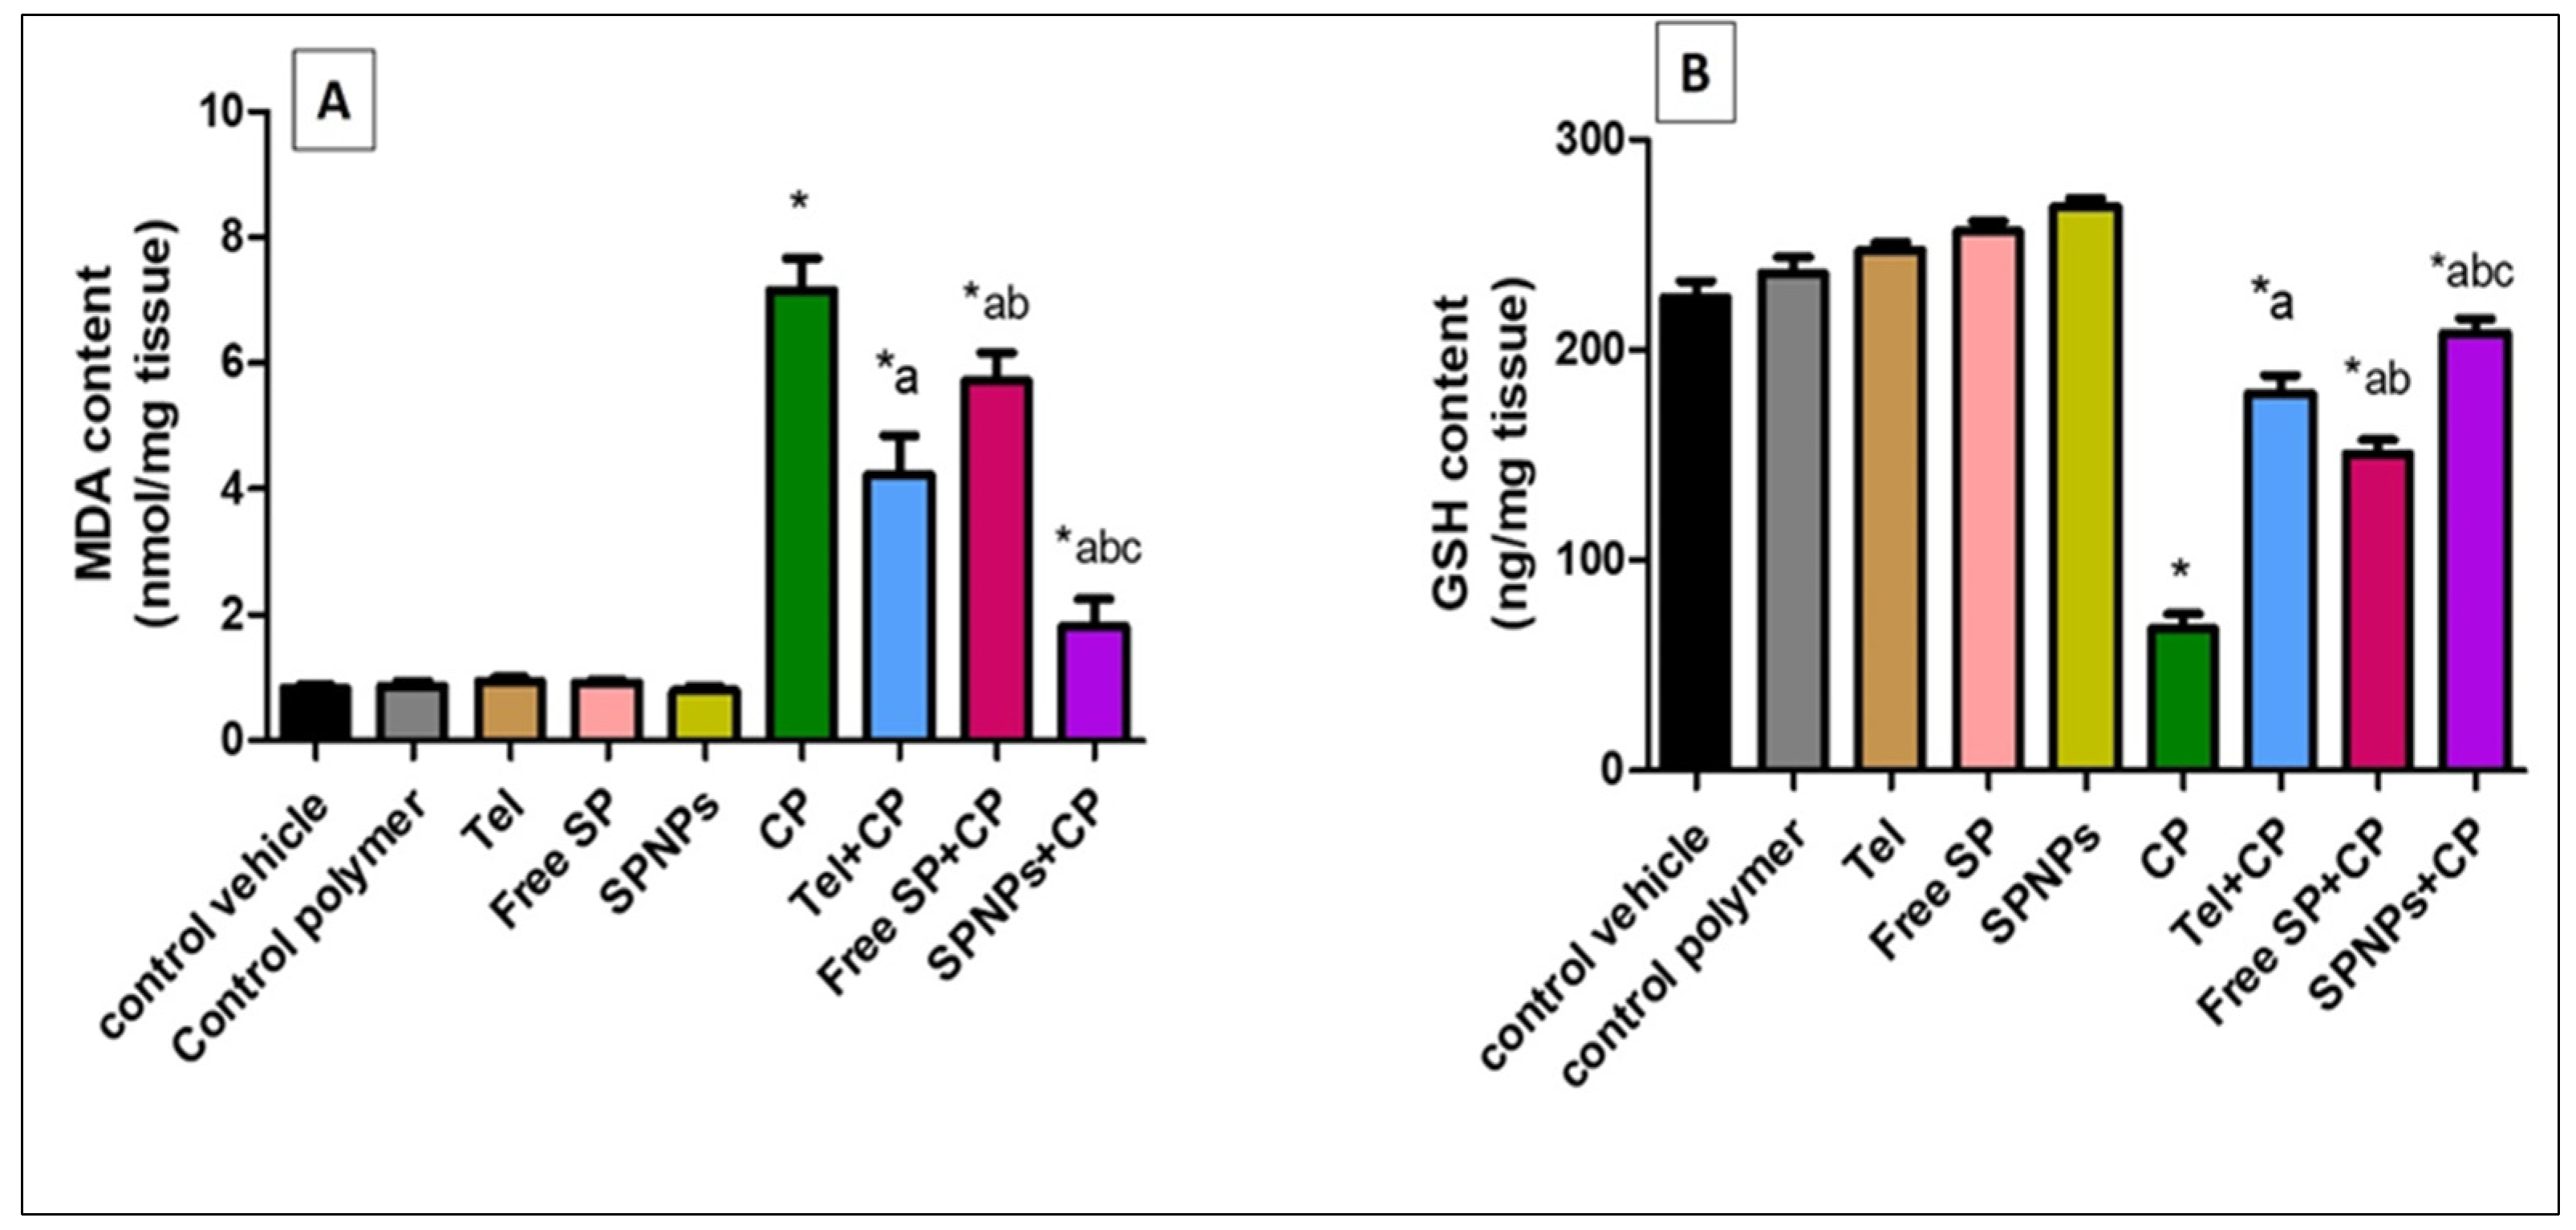
2.2.3. Effect of Free SP Extract and the Nanoformulation on Oxidative Stress Biomarkers in Ovarian Tissues
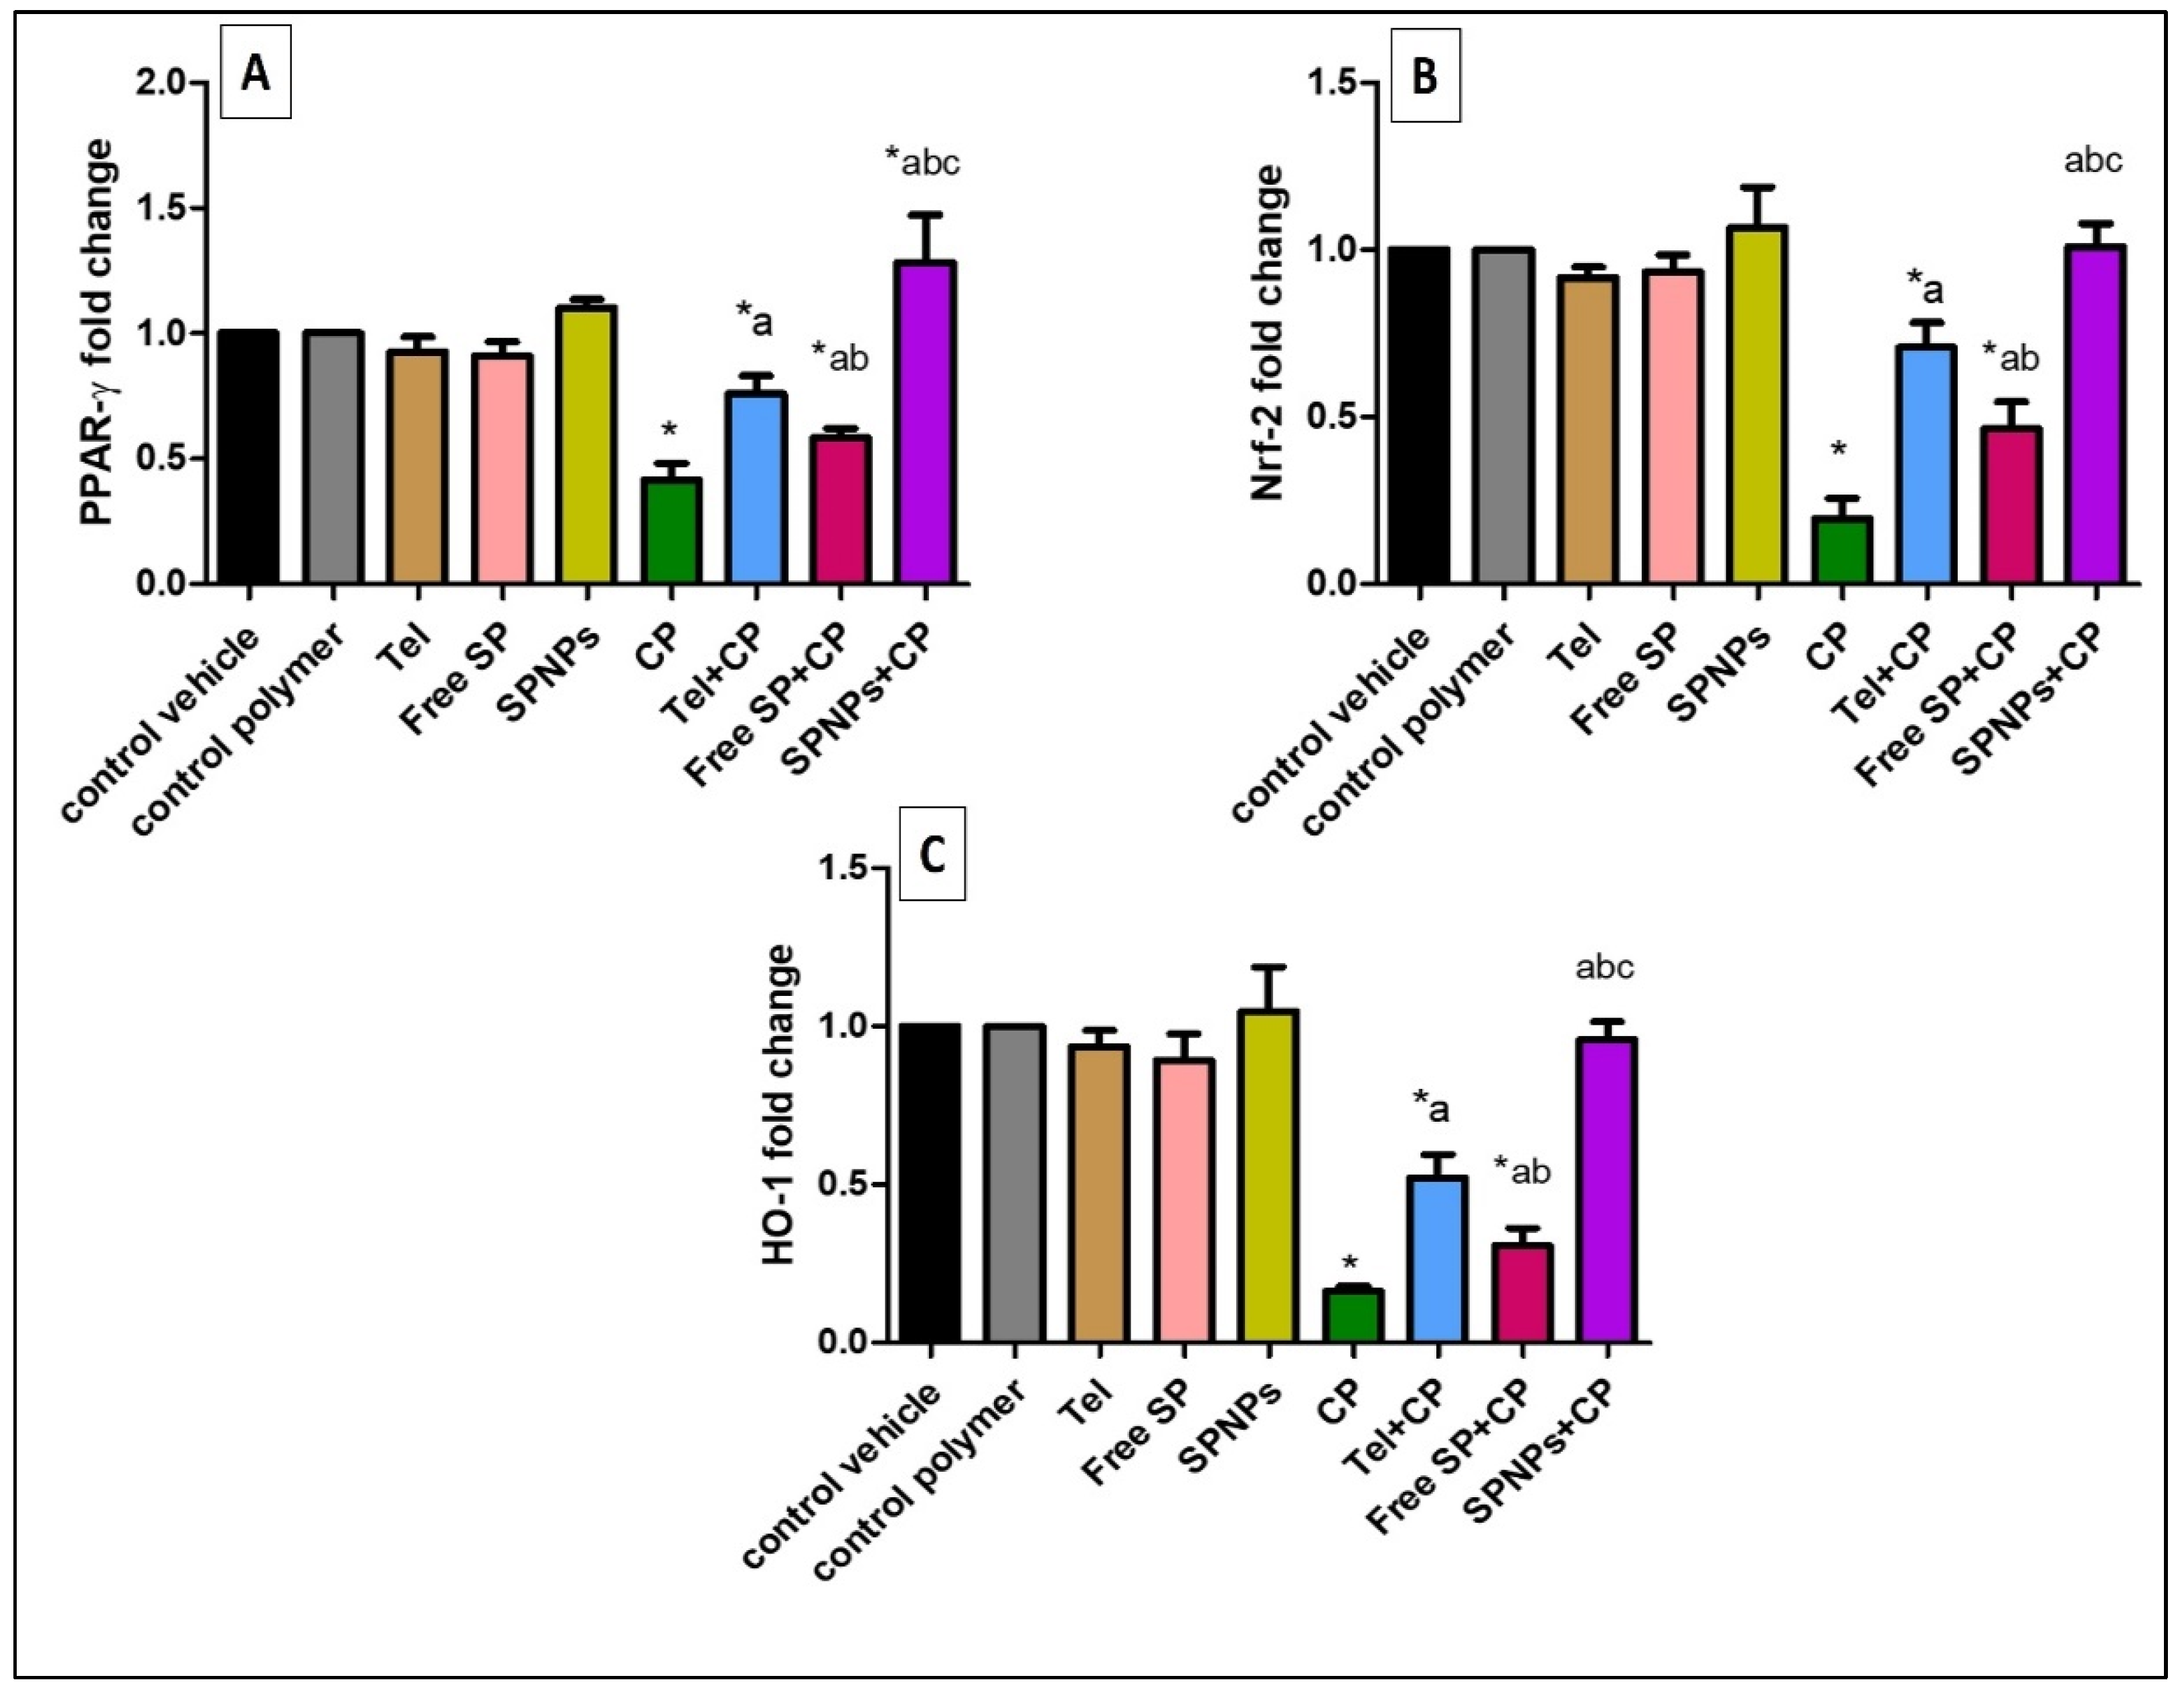
2.2.4. Effects of the Free SP Extract and the Nanoformulation on the PPAR-γ, Nrf-2, and HO-1 Signaling Pathways in Ovarian Tissues
2.2.5. Effects of Free and Nanoformulation of SP on CP-Induced Ovarian Histopathological Changes
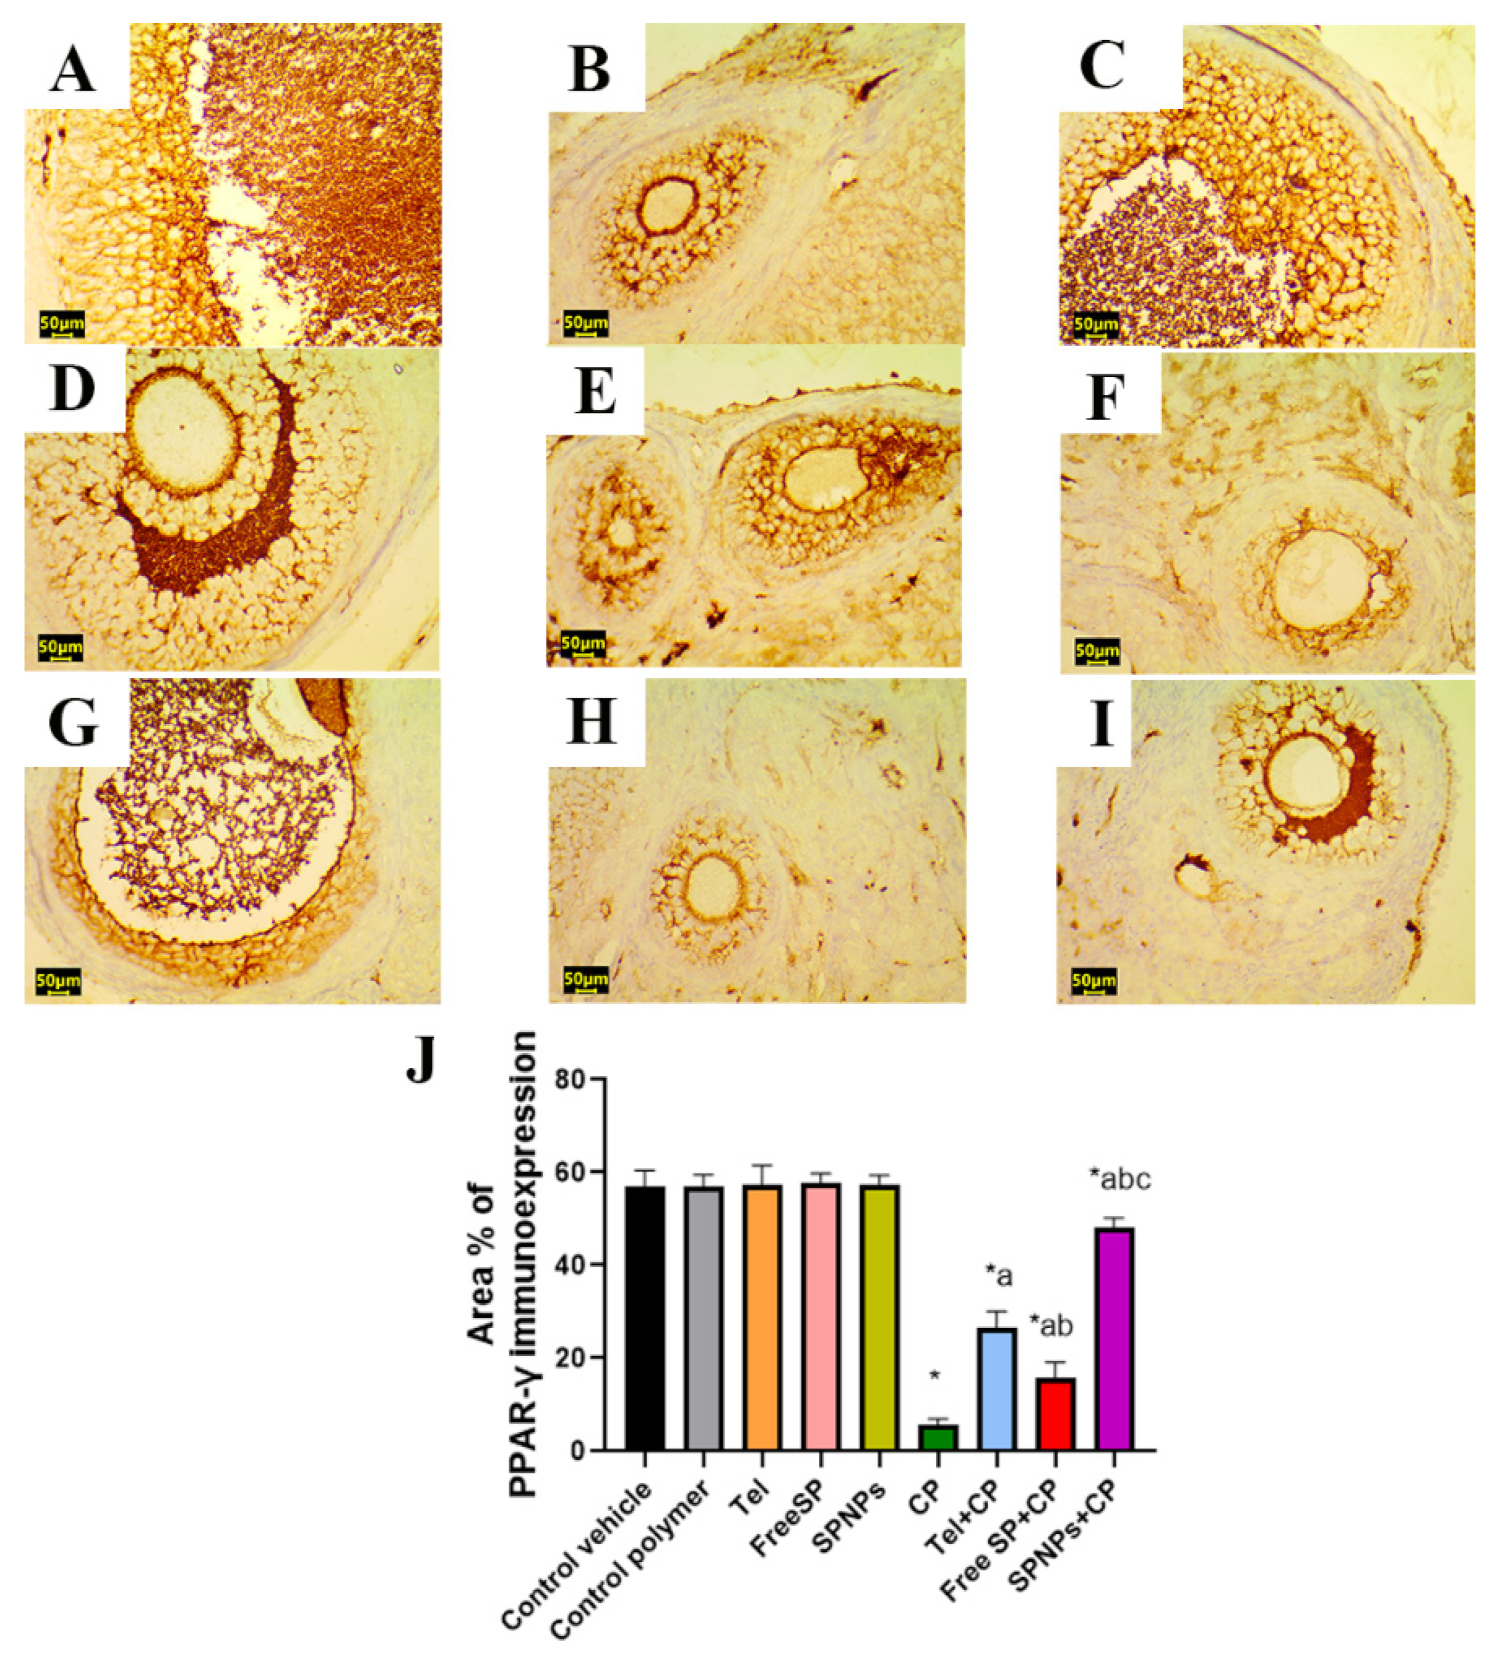
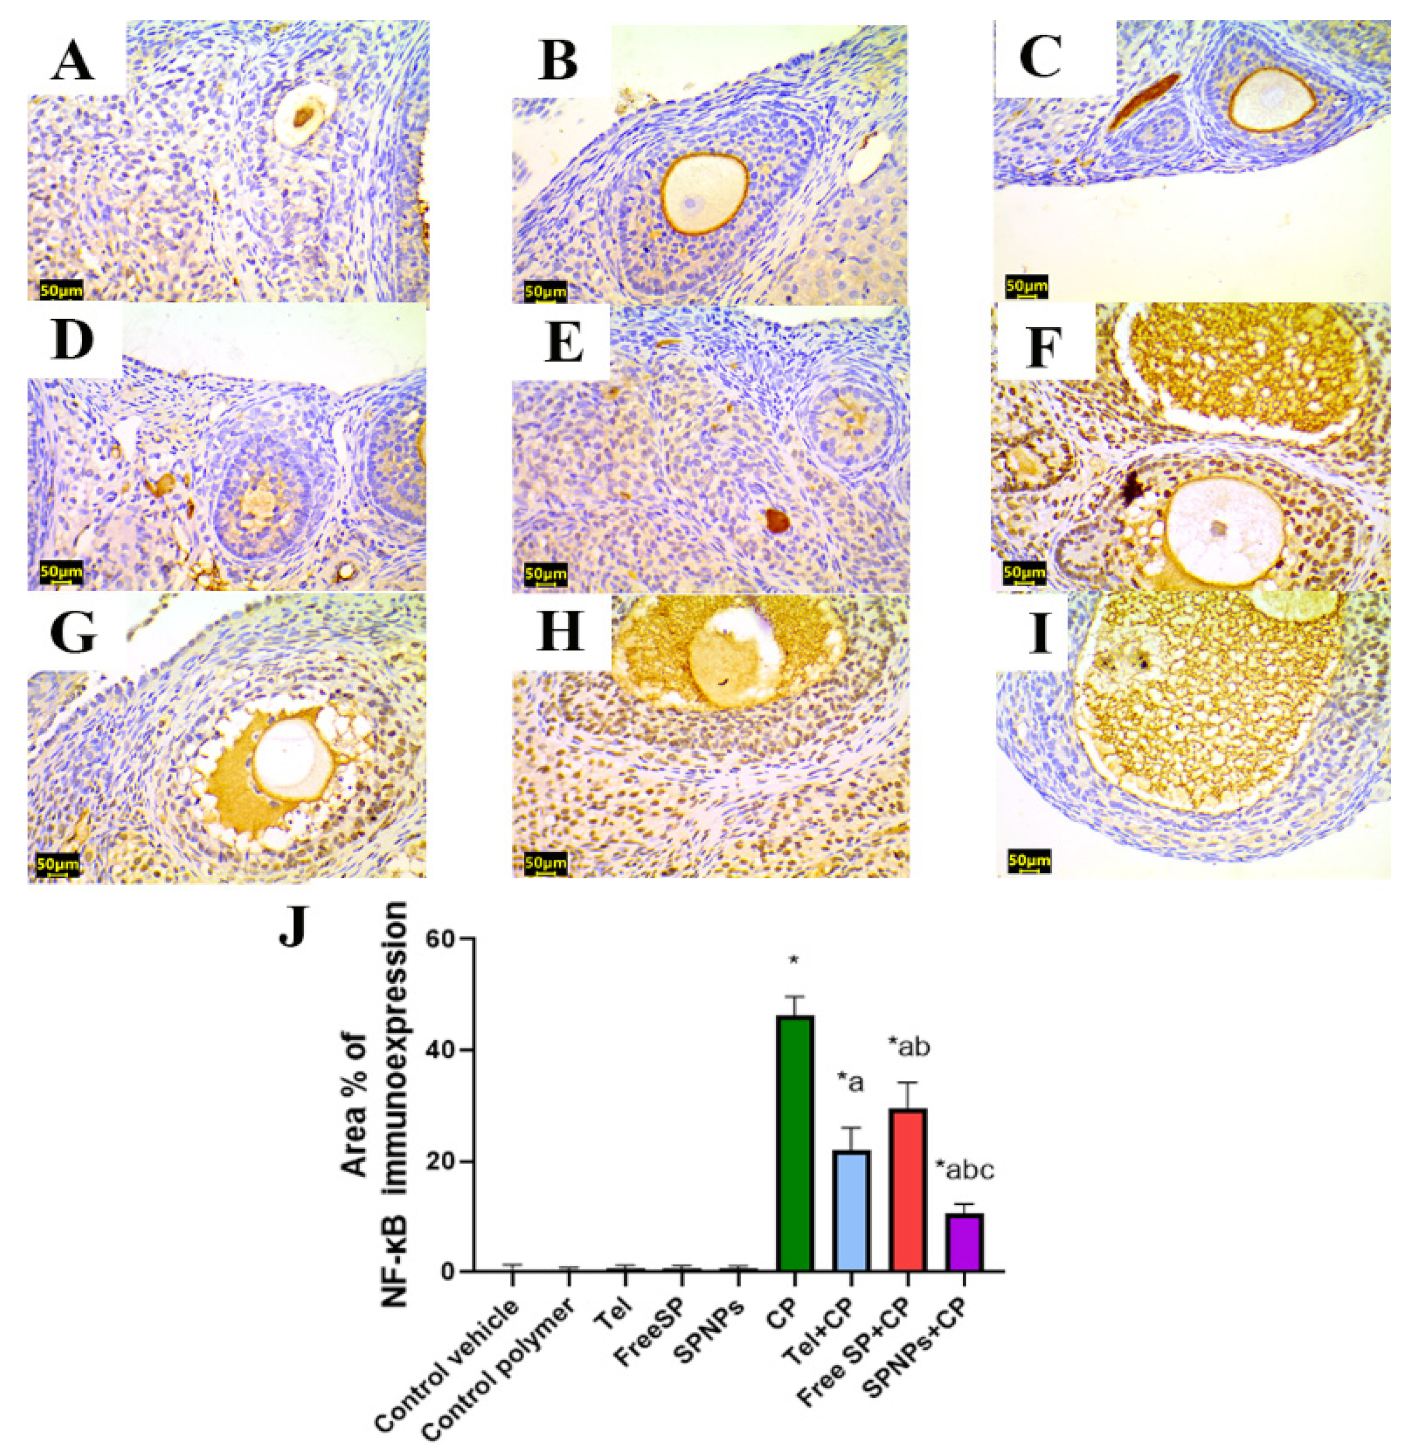
2.2.6. Effects of the Free SP Extract and the Nanoformulation on the Immunohistochemical Expression of PPAR-γ/NF-κB/TNF-α/Caspase-3 in CP-Induced Ovarian Damage
3. Discussion
4. Materials and Methods
4.1. Drugs and Chemicals
4.2. In Vitro Investigation
4.2.1. Spirulina platensis (SP) Cultivation
4.2.2. Preparation of the Ethanolic Extract of Spirulina Platensis
4.2.3. Evaluation of the Antioxidant Activity of SP Ethanolic Extract Using the DPPH Radical Scavenging Method
4.2.4. Total Phenolic Content (TPC) of the SP Ethanolic Extract
4.2.5. Total Flavonoid Content (TFC) of the SP Ethanolic Extract
4.2.6. Analyses of Phenolic and Flavonoid Compounds in the SP Ethanolic Extract Using High-Performance Liquid Chromatography (HPLC)
4.2.7. Gas Chromatography-Mass Spectrometry (GC-MS) Analysis of the SP Ethanolic Extract
4.2.8. Preparation of SP Nanoparticles (SPNPs) Using the Ionic Gelation Method
4.2.9. Characterization of SP Nanoparticles
The Percentage of Coacervation Yield
Average Particle Size and Zeta-Potential Evaluation
Transmission Electron Microscopy (TEM)
Thermal Stability (DSC)
X-ray Diffraction Analysis (XRD)
4.3. In Vivo Investigation
4.3.1. Study Animals
4.3.2. Experimental Design
4.3.3. Sample Collection
4.3.4. Biochemical Analysis
4.3.5. Investigation of Oxidative Stress Biomarkers
4.3.6. Real-Time Quantitative (qRT-PCR) Analysis of PPAR-γ, Nrf2, and HO-1
4.3.7. Histopathological Examination
4.3.8. Immunohistochemical Detection of PPAR-γ, caspase-3, NF-kB, and TNF-α in Ovarian Tissue
4.4. Statistical Analysis
5. Conclusions
Author Contributions
Funding
Institutional Review Board Statement
Data Availability Statement
Acknowledgments
Conflicts of Interest
References
- Mills, K.A.; Chess-Williams, R.; McDermott, C. Novel Insights into the Mechanism of Cyclophosphamide-Induced Bladder Toxicity: Chloroacetaldehyde’s Contribution to Urothelial Dysfunction In Vitro. Arch. Toxicol. 2019, 93, 3291–3303. [Google Scholar] [CrossRef] [PubMed]
- Aly, F.M.; Othman, A.; Haridy, M.A.M. Protective Effects of Fullerene C60 Nanoparticles and Virgin Olive Oil against Genotoxicity Induced by Cyclophosphamide in Rats. Oxid. Med. Cell. Longev. 2018, 2018, 1261356. [Google Scholar] [CrossRef] [PubMed]
- Sheweita, S.A.; El-Hosseiny, L.S.; Nashashibi, M.A. Protective Effects of Essential Oils as Natural Antioxidants against Hepatotoxicity Induced by Cyclophosphamide in Mice. PLoS ONE 2016, 11, e0165667. [Google Scholar] [CrossRef] [PubMed]
- Murali, V.P.; Kuttan, G. Curculigo Orchioides Gaertn Effectively Ameliorates the Uro- and Nephrotoxicities Induced by Cyclophosphamide Administration in Experimental Animals. Integr. Cancer Ther. 2016, 15, 205–215. [Google Scholar] [CrossRef] [PubMed]
- Singh, S.; Kumar, A. Protective Effect of Edaravone on Cyclophosphamide Induced Oxidative Stress and Neurotoxicity in Rats. Curr. Drug Saf. 2019, 14, 209–216. [Google Scholar] [CrossRef]
- Lawson, M.; Vasilaras, A.; De Vries, A.; Mactaggart, P.; Nicol, D. Urological Implications of Cyclophosphamide and Ifosfamide. Scand. J. Urol. Nephrol. 2008, 42, 309–317. [Google Scholar] [CrossRef]
- Reynolds, A.C.; McKenzie, L.J. Cancer Treatment-Related Ovarian Dysfunction in Women of Childbearing Potential: Management and Fertility Preservation Options. J. Clin. Oncol. 2023, 41, 2281–2292. [Google Scholar] [CrossRef]
- Tsai-Turton, M.; Luong, B.T.; Tan, Y.; Luderer, U. Cyclophosphamide-Induced Apoptosis in COV434 Human Granulosa Cells Involves Oxidative Stress and Glutathione Depletion. Toxicol. Sci. 2007, 98, 216–230. [Google Scholar] [CrossRef]
- Korkmaz, A.; Topal, T.; Oter, S. Pathophysiological Aspects of Cyclophosphamide and Ifosfamide Induced Hemorrhagic Cystitis; Implication of Reactive Oxygen and Nitrogen Species as Well as PARP Activation. Cell Biol. Toxicol. 2007, 23, 303–312. [Google Scholar] [CrossRef]
- Zanchi, M.M.; Manfredini, V.; Brum, D.D.S.; Vargas, L.M.; Spiazzi, C.C.; Soares, M.B.; Izaguirry, A.P.; Santos, F.W. Green Tea Infusion Improves Cyclophosphamide-Induced Damage on Male Mice Reproductive System. Toxicol. Rep. 2015, 2, 252–260. [Google Scholar] [CrossRef]
- Wei, X.; Su, F.; Su, X.; Hu, T.; Hu, S. Stereospecific Antioxidant Effects of Ginsenoside Rg3 on Oxidative Stress Induced by Cyclophosphamide in Mice. Fitoterapia 2012, 83, 636–642. [Google Scholar] [CrossRef] [PubMed]
- Afkhami-Ardakani, M.; Hassanzadeh, S.; Shahrooz, R.; Asadi-Samani, M.; Latifi, E.; Luther, T. Phytotherapy and Phytopharmacology for Reduction of Cyclophosphamide-Induced Toxicity in the Male Urinary System. J. Ren. Inj. Prev. 2017, 6, 164–170. [Google Scholar] [CrossRef]
- Wu, Q.; Liu, L.; Miron, A.; Klímová, B.; Wan, D.; Kuča, K. The Antioxidant, Immunomodulatory, and Anti-Inflammatory Activities of Spirulina: An Overview. Arch. Toxicol. 2016, 90, 1817–1840. [Google Scholar] [CrossRef]
- Wang, Y.; Chang, C.F.; Chou, J.; Chen, H.L.; Deng, X.; Harvey, B.K.; Cadet, J.L.; Bickford, P.C. Dietary Supplementation with Blueberries, Spinach, or Spirulina Reduces Ischemic Brain Damage. Exp. Neurol. 2005, 193, 75–84. [Google Scholar] [CrossRef] [PubMed]
- Calella, P.; Cerullo, G.; Di Dio, M.; Liguori, F.; Di Onofrio, V.; Gallè, F.; Liguori, G. Antioxidant, Anti-Inflammatory and Immunomodulatory Effects of Spirulina in Exercise and Sport: A Systematic Review. Front. Nutr. 2022, 9, 1048258. [Google Scholar] [CrossRef] [PubMed]
- Gentscheva, G.; Nikolova, K.; Panayotova, V.; Peycheva, K.; Makedonski, L.; Slavov, P.; Radusheva, P.; Petrova, P.; Yotkovska, I. Application of Arthrospira Platensis for Medicinal Purposes and the Food Industry: A Review of the Literature. Life 2023, 13, 845. [Google Scholar] [CrossRef] [PubMed]
- Almukainzi, M.; El-Masry, T.A.; Ibrahim, H.A.; Saad, H.M.; El Zahaby, E.I.; Saleh, A.; El-Nagar, M.M.F. New Insights into the Potential Cardioprotective Effects of Telmisartan and Nanoformulated Extract of Spirulina Platensis via Regulation of Oxidative Stress, Apoptosis, and Autophagy in an Experimental Model. Front. Pharmacol. 2024, 15, 1380057. [Google Scholar] [CrossRef]
- El-Shall, N.A.; Jiang, S.; Farag, M.R.; Azzam, M.; Al-Abdullatif, A.A.; Alhotan, R.; Dhama, K.; Hassan, F.U.; Alagawany, M. Potential of Spirulina Platensis as a Feed Supplement for Poultry to Enhance Growth Performance and Immune Modulation. Front. Immunol. 2023, 14, 1072787. [Google Scholar] [CrossRef]
- Abourehab, M.A.S.; Pramanik, S.; Abdelgawad, M.A.; Abualsoud, B.M.; Kadi, A.; Ansari, M.J.; Deepak, A. Recent Advances of Chitosan Formulations in Biomedical Applications. Int. J. Mol. Sci. 2022, 23, 10975. [Google Scholar] [CrossRef]
- Kim, S. Competitive Biological Activities of Chitosan and Its Derivatives: Antimicrobial, Antioxidant, Anticancer, and Anti-Inflammatory Activities. Int. J. Polym. Sci. 2018, 2018, 1708172. [Google Scholar] [CrossRef]
- Fatullayeva, S.; Tagiyev, D.; Zeynalov, N.; Mammadova, S.; Aliyeva, E. Recent Advances of Chitosan-Based Polymers in Biomedical Applications and Environmental Protection. J. Polym. Res. 2022, 29, 259. [Google Scholar] [CrossRef]
- Mikušová, V.; Mikuš, P. Advances in Chitosan-Based Nanoparticles for Drug Delivery. Int. J. Mol. Sci. 2021, 22, 9652. [Google Scholar] [CrossRef]
- Chang, P.G.; Gupta, R.; Timilsena, Y.P.; Adhikari, B. Optimisation of the Complex Coacervation between Canola Protein Isolate and Chitosan. J. Food Eng. 2016, 191, 58–66. [Google Scholar] [CrossRef]
- Hoang, N.H.; Thanh, T.L.; Sangpueak, R.; Treekoon, J.; Saengchan, C.; Thepbandit, W.; Papathoti, N.K.; Kamkaew, A.; Buensanteai, N. Chitosan Nanoparticles-Based Ionic Gelation Method: A Promising Candidate for Plant Disease Management. Polymers 2022, 14, 662. [Google Scholar] [CrossRef]
- Wolf, G. Angiotensin II as a Mediator of Tubulointerstitial Injury. Nephrol. Dial. Transplant. 2000, 15, 61–63. [Google Scholar] [CrossRef]
- Siragy, H. Angiotensin II Receptor Blockers: Review of the Binding Characteristics. Am. J. Cardiol. 1999, 84, 3–8. [Google Scholar] [CrossRef]
- Al-Hejjaj, W.K.G.; Numan, I.T.; Al-Sa’ad, R.Z.; Hussain, S.A. Anti-Inflammatory Activity of Telmisartan in Rat Models of Experimentally-Induced Chronic Inflammation: Comparative Study with Dexamethasone. Saudi Pharm. J. 2011, 19, 29–34. [Google Scholar] [CrossRef]
- Ahmed, M.A. Effect of Angiotensin II Type 1 Receptor Blocker on Renal Function, Arterial Blood Pressure and Parathyroid Hormone Related Protein over Expression in Cadmium Induced Nephrotoxicity in Adult Male Rats. Int. J. Physiol. Pathophysiol. Pharmacol. 2013, 5, 109–119. [Google Scholar] [PubMed]
- Lu, J.; Ren, D.F.; Wang, J.Z.; Sanada, H.; Egashira, Y. Protection by Dietary Spirulina Platensis against D-Galactosamine-and Acetaminophen-Induced Liver Injuries. Br. J. Nutr. 2010, 103, 1573–1576. [Google Scholar] [CrossRef]
- Scaglioni, P.T.; Quadros, L.; de Paula, M.; Furlong, V.B.; Abreu, P.C.; Badiale-Furlong, E. Inhibition of Enzymatic and Oxidative Processes by Phenolic Extracts from Spirulina Sp. and Nannochloropsis Sp. Food. Technol. Biotechnol. 2018, 56, 344–353. [Google Scholar] [CrossRef]
- Zaid, A.A.A.; Hammad, D.M.; Sharaf, E.M. Antioxidant and Anticancer Activity of Spirulina Platensis Water Extracts. Int. J. Pharmacol. 2015, 11, 846–851. [Google Scholar] [CrossRef]
- Hossain, M.F.; Ratnayake, R.R.; Meerajini, K.; Wasantha Kumara, K.L. Antioxidant properties in some selected cyanobacteria isolated from fresh water bodies of Sri Lanka. Food. Sci. Nutr. 2016, 4, 753–758. [Google Scholar] [CrossRef] [PubMed]
- Alves, A.; Ramos, A.; Gonçalves, M.M.; Bernardo, M.; Mendes, B. Antioxidant Activity, Quality Parameters and Mineral Content of Portuguese Monofloral Honeys. J. Food Compos. Anal. 2013, 30, 130–138. [Google Scholar] [CrossRef]
- Asghar, S.F.; Habib-ur-Rehman; Choudhary, M.I.; Atta-ur-Rahman. Gas Chromatography-Mass Spectrometry (GC-MS) Analysis of Petroleum Ether Extract (Oil) and Bio-Assays of Crude Extract of Iris Germanica. Int. J. Genet. Mol. Biol. 2011, 3, 95–100. [Google Scholar]
- Ganesh, M.; Mohankumar, M. Extraction and Identification of Bioactive Components in Sida Cordata (Burm.f.) Using Gas Chromatography–Mass Spectrometry. J. Food Sci. Technol. 2017, 54, 3082–3091. [Google Scholar] [CrossRef]
- Zhang, Y.; Liu, X.; Wang, Y.; Jiang, P.; Quek, S.Y. Antibacterial Activity and Mechanism of Cinnamon Essential Oil against Escherichia Coli and Staphylococcus Aureus. Food Control 2016, 59, 282–289. [Google Scholar] [CrossRef]
- Islam, M.T.; Ali, E.S.; Uddin, S.J.; Shaw, S.; Islam, M.A.; Ahmed, M.I.; Chandra Shill, M.; Karmakar, U.K.; Yarla, N.S.; Khan, I.N.; et al. Phytol: A Review of Biomedical Activities. Food Chem. Toxicol. 2018, 121, 82–94. [Google Scholar] [CrossRef] [PubMed]
- Marsili, L.; Dal Bo, M.; Berti, F.; Toffoli, G. Chitosan-Based Biocompatible Copolymers for Thermoresponsive Drug Delivery Systems: On the Development of a Standardization System. Pharmaceutics 2021, 13, 1876. [Google Scholar] [CrossRef] [PubMed]
- Zhang, H.; Tumarkin, E.; Peerani, R.; Nie, Z.; Sullan, R.M.A.; Walker, G.C.; Kumacheva, E. Microfluidic Production of Biopolymer Microcapsules with Controlled Morphology. J. Am. Chem. Soc. 2006, 128, 12205–12210. [Google Scholar] [CrossRef]
- Liang, J.; Yan, H.; Puligundla, P.; Gao, X.; Zhou, Y.; Wan, X. Applications of Chitosan Nanoparticles to Enhance Absorption and Bioavailability of Tea Polyphenols: A Review. Food Hydrocoll. 2017, 69, 286–292. [Google Scholar] [CrossRef]
- Benelhadj, S.; Gharsallaoui, A.; Degraeve, P.; Attia, H.; Ghorbel, D. Effect of PH on the Functional Properties of Arthrospira (Spirulina) Platensis Protein Isolate. Food Chem. 2016, 194, 1056–1063. [Google Scholar] [CrossRef]
- Choi, J.; Fuentes, C.; Fransson, J.; Wahlgren, M.; Nilsson, L. Separation and Zeta-Potential Determination of Proteins and Their Oligomers Using Electrical Asymmetrical Flow Field-Flow Fractionation (EAF4). J. Chromatogr. A 2020, 1633, 461625. [Google Scholar] [CrossRef]
- Rahman, L.; Goswami, J.; Choudhury, D. Assessment of Physical and Thermal Behaviour of Chitosan-Based Biocomposites Reinforced with Leaf and Stem Extract of Tectona Grandis. Polym. Polym. Compos. 2022, 30, 1–12. [Google Scholar] [CrossRef]
- Kern, J.C.; Kehrer, J.P. Acrolein-Induced Cell Death: A Caspase-Influenced Decision between Apoptosis and Oncosis/Necrosis. Chem. Biol. Interact. 2002, 139, 79–95. [Google Scholar] [CrossRef]
- Abdel-Raheem, I.T.; Omran, G.A.; Katary, M.A. Irbesartan, an Angiotensin II Receptor Antagonist, with Selective PPAR-Gamma-Modulating Activity Improves Function and Structure of Chemotherapy-Damaged Ovaries in Rats. Fundam. Clin. Pharmacol. 2015, 29, 286–298. [Google Scholar] [CrossRef]
- Kabirian, A.; Batavani, R.A.; Asri-Rezaei, S.; Soleimanzadeh, A. Comparative Study of the Protective Effects of Chicken Embryo Amniotic Fluid, Vitamin C and Coenzyme Q10 on Cyclophosphamide-Induced Oxidative Stress in Mice Ovaries. Vet. Res. Forum. 2018, 9, 217–224. [Google Scholar] [CrossRef] [PubMed]
- Costa, D.L.; Amaral, E.P.; Andrade, B.B. Modulation of Inflammation and Immune Responses by Heme Oxygenase-1: Implications for Infection with Intracellular Pathogens. Antioxidants 2020, 9, 1205. [Google Scholar] [CrossRef] [PubMed]
- Spears, N.; Lopes, F.; Stefansdottir, A.; Rossi, V.; De Felici, M.; Anderson, R.A.; Klinger, F.G. Ovarian Damage from Chemotherapy and Current Approaches to Its Protection. Hum. Reprod. Update 2019, 25, 673–693. [Google Scholar] [CrossRef]
- Principe, D.R.; Kamath, S.D.; Korc, M.; Munshi, H.G. The immune modifying effects of chemotherapy and advances in chemo-immunotherapy. Pharm. Therap. 2022, 236, 108111. [Google Scholar] [CrossRef]
- Gogvadze, V.; Orrenius, S.; Zhivotovsky, B. Multiple Pathways of Cytochrome c Release from Mitochondria in Apoptosis. Biochim. Biophys. Acta (BBA) Bioenerg. 2006, 1757, 639–647. [Google Scholar] [CrossRef]
- Wang, H.; Wang, H.; Zhou, X.M.; Wu, L.Y.; Liu, G.J.; Xu, W.D.; Zhang, X.S.; Gao, Y.Y.; Tao, T.; Zhou, Y.; et al. Aucubin Alleviates Oxidative Stress and Inflammation via Nrf2-Mediated Signaling Activity in Experimental Traumatic Brain Injury. J. Neuroinflammation 2020, 17, 188. [Google Scholar] [CrossRef] [PubMed]
- Tian, W.; De La Vega, M.R.; Schmidlin, C.J.; Ooi, A.; Zhang, D.D. Kelch-like ECH-Associated Protein 1 (KEAP1) Differentially Regulates Nuclear Factor Erythroid-2-Related Factors 1 and 2 (NRF1 and NRF2). J. Biol. Chem. 2018, 293, 2029–2040. [Google Scholar] [CrossRef] [PubMed]
- Niture, S.K.; Kaspar, J.W.; Shen, J.; Jaiswal, A.K. Nrf2 Signaling and Cell Survival. Toxicol. Appl. Pharmacol. 2010, 244, 37–42. [Google Scholar] [CrossRef] [PubMed]
- Rogers, S.L.; Burns, R.G. Changes in Aggregate Stability, Nutrient Status, Indigenous Microbial Populations, and Seedling Emergence, Following Inoculation of Soil with Nostoc Muscorum. Biol. Fertil. Soils 1994, 18, 209–215. [Google Scholar] [CrossRef]
- Kumar, A.; Ramamoorthy, D.; Verma, D.K.; Kumar, A.; Kumar, N.; Kanak, K.R.; Marwein, B.M.; Mohan, K. Antioxidant and Phytonutrient Activities of Spirulina Platensis. Energy Nexus 2022, 6, 100070. [Google Scholar] [CrossRef]
- Marinova, D.; Ribarova, F.; Atanassova, M. Total Phenolics and Total Flavonoids in Bulgarian Fruits and Vegetables. Int. J. Mol. Sci. 2005, 40, 255–260. [Google Scholar]
- Chang, C.C.; Yang, M.H.; Wen, H.M.; Chern, J.C. Estimation of Total Flavonoid Content in Propolis by Two Complementary Colometric Methods. J. Food Drug Anal. 2002, 10, 178–182. [Google Scholar] [CrossRef]
- El-Kareem, M.S.M.A.; Rabbih, M.A.E.F.; Selim, E.T.M.; Elsherbiny, E.A.E.; El-Khateeb, A.Y. Application of GC/EIMS in Combination with Semi-Empirical Calculations for Identification and Investigation of Some Volatile Components in Basil Essential Oil. Int. J. Anal. Mass. Spectrom. Chromatogr. 2016, 04, 14–25. [Google Scholar] [CrossRef]
- Aiba, S.; Ogawa, T. Assessment of Growth Yield of a Blue-Green Alga, Spirulina Platensis, in Axenic and Continuous Culture. J. Gen. Microbiol. 1977, 102, 179–182. [Google Scholar] [CrossRef]
- Rehman, M.; Ihsan, A.; Madni, A.; Bajwa, S.Z.; Shi, D.; Webster, T.J.; Khan, W.S. Solid Lipid Nanoparticles for Thermoresponsive Targeting: Evidence from Spectrophotometry, Electrochemical, and Cytotoxicity Studies. Int. J. Nanomed. 2017, 12, 8325–8336. [Google Scholar] [CrossRef]
- Li, J.; Chen, Y.H.; Xu, J.Y.; Liu, J.Y.; Fu, J.C.; Cao, X.P.; Huang, J.; Zheng, Y.H. Effects of chitooligosaccharide-zinc on the ovarian function of mice with premature ovarian failure via the SESN2/NRF2 signaling pathway. Chin. J. Nat. Med. 2021, 19, 721–731. [Google Scholar] [CrossRef]
- Yang, Z.; Hong, W.; Zheng, K.; Feng, J.; Hu, C.; Tan, J.; Zhong, Z.; Zheng, Y. Chitosan Oligosaccharides Alleviate H2O2-stimulated Granulosa Cell Damage via HIF-1α Signaling Pathway. Oxid. Med. Cell. Longev. 2022, 2022, 4247042. [Google Scholar] [CrossRef] [PubMed]
- Ali, H.H.; Ahmed, Z.A.; Aziz, T.A. Effect of Telmisartan and Quercetin in 5 Fluorouracil-Induced Renal Toxicity in Rats. J. Inflamm. Res. 2022, 15, 6113–6124. [Google Scholar] [CrossRef]
- Khalil, S.R.; Salem, H.F.A.; Metwally, M.M.M.; Emad, R.M.; Elbohi, K.M.; Ali, S.A. Protective Effect of Spirulina Platensis against Physiological, Ultrastructural and Cell Proliferation Damage Induced by Furan in Kidney and Liver of Rat. Ecotoxicol. Environ. Saf. 2020, 192, 110256. [Google Scholar] [CrossRef]
- Saleh, D.O.; Mansour, D.F. Ovario-protective effects of genistein against cyclophosphamide toxicity in rats: Role of anti-müllerian hormone and oestradiol. Eur. J. Pharmacol. 2016, 789, 163–171. [Google Scholar] [CrossRef]
- Hardiningtyas, S.D.; Putri, F.A.; Setyaningsih, I. Antibacterial Activity of Ethanolic Spirulina Platensis Extract-Water Soluble Chitosan Nanoparticles. IOP Conf. Ser. Earth Environ. Sci. 2022, 1033, 012053. [Google Scholar] [CrossRef]
- Yuan, J.S.; Reed, A.; Chen, F.; Stewart, C.N. Statistical Analysis of Real-Time PCR Data. BMC Bioinformatics 2006, 7, 85. [Google Scholar] [CrossRef] [PubMed]
- Ismail, T.A.; Soliman, M.M.; Ismail, S.A. Adiponectin Regulation in Type 2 Diabetic Rats: Effects of Insulin, Metformin and Dexamethasone. Am. J. Pharmacol. Toxicol. 2013, 8208, 197–208. [Google Scholar] [CrossRef]
- Yamashita, Y.; Ueyama, T.; Nishi, T.; Yamamoto, Y.; Kawakoshi, A.; Sunami, S.; Iguchi, M.; Tamai, H.; Ueda, K.; Ito, T.; et al. Nrf2-Inducing Anti-Oxidation Stress Response in the Rat Liver-New Beneficial Effect of Lansoprazole. PLoS ONE 2014, 9, 97419. [Google Scholar] [CrossRef] [PubMed]
- Chu, X.; Zhang, X.; Gong, X.; Zhou, H.; Cai, C. Effects of Hyperoxia Exposure on the Expression of Nrf2 and Heme Oxygenase-1 in Lung Tissues of Premature Rats. Mol. Cell. Probes 2020, 51, 101529. [Google Scholar] [CrossRef]
- Suvarna, K.S.; Layton, C.; Bancroft, J.D. Bancroft’s Theory and Practice of Histological Techniques E-Book; Elsevier Health Sciences: Amsterdam, The Netherlands, 2018. [Google Scholar]
- Gibson-Corley, K.N.; Olivier, A.K.; Meyerholz, D.K. Principles for Valid Histopathologic Scoring in Research. Vet. Pathol. 2013, 50, 1007–1015. [Google Scholar] [CrossRef] [PubMed]
- Eser, A.; Hizli, D.; Haltas, H.; Namuslu, M.; Kosus, A.; Kosus, N.; Kafali, H. Effects of curcumin on ovarian ischemia-reperfusion injury in a rat model. Biomed. Rep. 2015, 3, 807–813. [Google Scholar] [CrossRef] [PubMed]
- Dijkstra, G.; de Rooij, D.G.; de Jong, F.H.; van den Hurk, R. Effect of hypothyroidism on ovarian follicular development, granulosa cell proliferation, and peripheral hormone levels in the prepubertal rat. Eur. J. Endocrinol. 1996, 134, 649–654. [Google Scholar] [CrossRef]
- Tilly, J.L. Ovarian follicle counts—Not as simple as 1, 2, 3. Reprod. Biol. Endocrinol. 2003, 1, 11. [Google Scholar] [CrossRef] [PubMed]
- Dabbs, D.J. Diagnostic Immunohistochemistry E-Book: Theranostic and Genomic Applications; Elsevier Health Sciences: Amsterdam, The Netherlands, 2017. [Google Scholar]
- Crowe, A.R.; Yue, W. Semi-Quantitative Determination of Protein Expression Using Immunohistochemistry Staining and Analysis. Bio-Protocol 2019, 9, 3465. [Google Scholar] [CrossRef]


| Assay | SP Ethanolic Extract |
|---|---|
| DPPH (Inhibition %) | 79.7 ± 1.3 |
| Total phenolic content (mg GAE/g DW) | 35.9 ± 0.5 |
| Total flavonoid content (mg GAE/g DW) | 81.17 ± 2.5 |
| Paek No. | RT | Compounds | Concentration µg/mL |
|---|---|---|---|
| 1 | 4.1 | Catechol | 10.31 ± 0.72 |
| 2 | 5.1 | Syringgenic | 12.89 ± 0.83 |
| 3 | 7.0 | Cinnamic acid | 3.78 ± 0.22 |
| 4 | 8.0 | Caffeic acid | 1.41 ± 0.02 |
| 5 | 9.4 | Pyrogallol | 1.39 ± 0.03 |
| 6 | 12.7 | Unknown | -- |
| 7 | 15.0 | Unknown | -- |
| Peak No. | RT | Compounds | Concentration µg/mL |
|---|---|---|---|
| 1 | 4.6 | Naringin | 3.12 |
| 2 | 5.2 | Rutin | 6.20 |
| 3 | 7.0 | Quersestin | 15.30 |
| 4 | 8.1 | Kampferol | 3.51 |
| 5 | 9.0 | Luteolin | 6.41 |
| 6 | 10.0 | Apegenin | 3.36 |
| 7 | 12.01 | Catechin | 5.26 |
| 8 | 14.0 | Unknown | -- |
| RT | Compound Name | PA % | MF | Biological Activity |
|---|---|---|---|---|
| 21.31 | Heptadecane | 2.83 | C17H36 | Antioxidant and antimicrobial activity |
| 26.39 | Hexadecanoic acid | 8.08 | C16H32O2 | Antioxidant, antibacterial, and anti-inflammatory activity |
| 29.10 | Phytol | 8.67 | C20H40O | Anti-inflammatory, antioxidant, and antimicrobial activity |
| 29.39 | 9,12-Octadecadienoic acid (Z, Z) | 9.11 | C18H32O2 | Antioxidant, anticancer, and anti-inflammatory activity |
| 29.54 | 9,12-Octadecadienoyl chloride (Z, Z) | 9.45 | C18H31CIO | Antibacterial and antifungal activity |
| 30.03 | Oleic acid | 1.67 | C18H34O2 | Antioxidant, antibacterial, and anti-inflammatory activity |
| 35.31 | Hexadecanoic acid, 2,3-di-hydroxypropyl ester | 1.89 | C19H38O4 | Antioxidant activity |
| 37.95 | 9-Octadecenoic acid (Z,Z)-, 2-hydroxy-1-(hydroxymethyl)ethyl ester | 5.82 | C21H38O4 | Antioxidant, anti-inflammatory, antimicrobial, and diuretic activity |
| 42.73 | Hexadecanoic acid, octadecyl ester | 47.92 | C17H34O2 | Antioxidant and anti-inflammatory activity |
| Parameter | Mean | Range |
|---|---|---|
| Percentage yield (%) | 20.96 ± 2.89 | 18.29 to 24.3 |
| Particle size (nm) | 138.2 ± 7.18 | 132.6 to 146.3 |
| Zeta potential (mV) | −28.33 to −33.69 | −31.58 ± 2.86 |
| Endothermic Peak | Exothermic Peak | |||
|---|---|---|---|---|
| Peak (°C) | Heat Flow (W/g) | Peak (°C) | Heat Flow (W/g) | |
| Free SP | 87.08 °C | −1.399 | 303.1 °C | 1.54 |
| Polymer (Cs) | 78.33 | −1.078 | 328.73 | 7.85 |
| SPNPs | 106.53 | −1.677 | 398.4 | 4.13 |
| Group/n = 6 | Dosage Protocol |
|---|---|
| 1: Control vehicle | Rats received a daily oral dose of saline for 21 days. |
| 2: Control polymer | Rats received daily oral doses of chitosan polymer (equivalent dose of 100 mg/kg, P.O. SPNPs for 21 days [61,62]. |
| 3: Telmisartan (Tel) | Rats received daily oral doses of telmisartan (10 mg/kg, P.O.) for 21 days [63]. |
| 4: Spirulina platensis extract (Free SP) | Rats received daily oral doses of Spirulina platensis extract (300 mg/kg, P.O.) for 21 days [64]. |
| 5: Nanoformulation of the Spirulina platensis extract (SPNPs) | Rats received daily oral doses of the nanoformulation of the Spirulina platensis extract (100 mg/kg, P.O.) for 21 days [17]. |
| 6: Cyclophosphamide (CP) | Rats received a daily oral dose of saline for 21 days with a single injection of CP (200 mg/kg. I.P.) on day 19 [65]. |
| 7: Tel+CP | Rats were treated with Tel (10 mg/kg. P.O.) for 21 consecutive days, and on day 19, a single dose of CP (200 mg/kg, I.P.) was given. |
| 8: Free SP+CP | Rats were treated with free SP extract (300 mg/kg. P.O.) for 21 consecutive days, and on day 19, a single dose of CP (200 mg/kg, I.P.) was given. |
| 9: SPNPs+CP | Rats were treated with SPNPs (100 mg/kg. P.O.) for 21 consecutive days, and on day 19, a single dose of CP (200 mg/kg, I.P.) was given. |
| Genes | Sequence (5′-3′) | References |
|---|---|---|
| PPAR-γ | F:CATTTCTGCTCCACACTATGAA R: CGGGAAGGACTTTATGTATGCG | [67] |
| Nrf2 | F:CACATCCAGACAGACACCAGT R: CTACAAATGGGAATGTCTCTGC | [68] |
| HO-1 | F: GGCTTTAAGCTGGTGATGGC R: GGGTTCTGCTTGTTTCGCTC | [69] |
| Β-actin | F: TCCTCCTGAGCGCAAGTACTCT R: GCTCAGTAACAGTCCGCCTAGAA | [70] |
Disclaimer/Publisher’s Note: The statements, opinions and data contained in all publications are solely those of the individual author(s) and contributor(s) and not of MDPI and/or the editor(s). MDPI and/or the editor(s) disclaim responsibility for any injury to people or property resulting from any ideas, methods, instructions or products referred to in the content. |
© 2024 by the authors. Licensee MDPI, Basel, Switzerland. This article is an open access article distributed under the terms and conditions of the Creative Commons Attribution (CC BY) license (https://creativecommons.org/licenses/by/4.0/).
Share and Cite
Almukainzi, M.; El-Masry, T.A.; Ibrahim, H.A.; Saad, H.M.; El Zahaby, E.I.; Saleh, A.; El-Nagar, M.M.F. Ameliorative Effect of Chitosan/Spirulina platensis Ethanolic Extract Nanoformulation against Cyclophosphamide-Induced Ovarian Toxicity: Role of PPAR-γ/Nrf-2/HO-1 and NF-kB/TNF-α Signaling Pathways. Mar. Drugs 2024, 22, 395. https://doi.org/10.3390/md22090395
Almukainzi M, El-Masry TA, Ibrahim HA, Saad HM, El Zahaby EI, Saleh A, El-Nagar MMF. Ameliorative Effect of Chitosan/Spirulina platensis Ethanolic Extract Nanoformulation against Cyclophosphamide-Induced Ovarian Toxicity: Role of PPAR-γ/Nrf-2/HO-1 and NF-kB/TNF-α Signaling Pathways. Marine Drugs. 2024; 22(9):395. https://doi.org/10.3390/md22090395
Chicago/Turabian StyleAlmukainzi, May, Thanaa A. El-Masry, Hanaa A. Ibrahim, Hebatallah M. Saad, Enas I. El Zahaby, Asmaa Saleh, and Maysa M. F. El-Nagar. 2024. "Ameliorative Effect of Chitosan/Spirulina platensis Ethanolic Extract Nanoformulation against Cyclophosphamide-Induced Ovarian Toxicity: Role of PPAR-γ/Nrf-2/HO-1 and NF-kB/TNF-α Signaling Pathways" Marine Drugs 22, no. 9: 395. https://doi.org/10.3390/md22090395
APA StyleAlmukainzi, M., El-Masry, T. A., Ibrahim, H. A., Saad, H. M., El Zahaby, E. I., Saleh, A., & El-Nagar, M. M. F. (2024). Ameliorative Effect of Chitosan/Spirulina platensis Ethanolic Extract Nanoformulation against Cyclophosphamide-Induced Ovarian Toxicity: Role of PPAR-γ/Nrf-2/HO-1 and NF-kB/TNF-α Signaling Pathways. Marine Drugs, 22(9), 395. https://doi.org/10.3390/md22090395