Global School-Based Childhood Obesity Interventions: A Review


Abstract
:1. Introduction
2. Experimental Section
2.1. Methods
Inclusion/Exclusion Criteria
2.2. Rationale for Review
2.3. Study Abstraction

2.4. Data Extraction
3. Results and Discussion
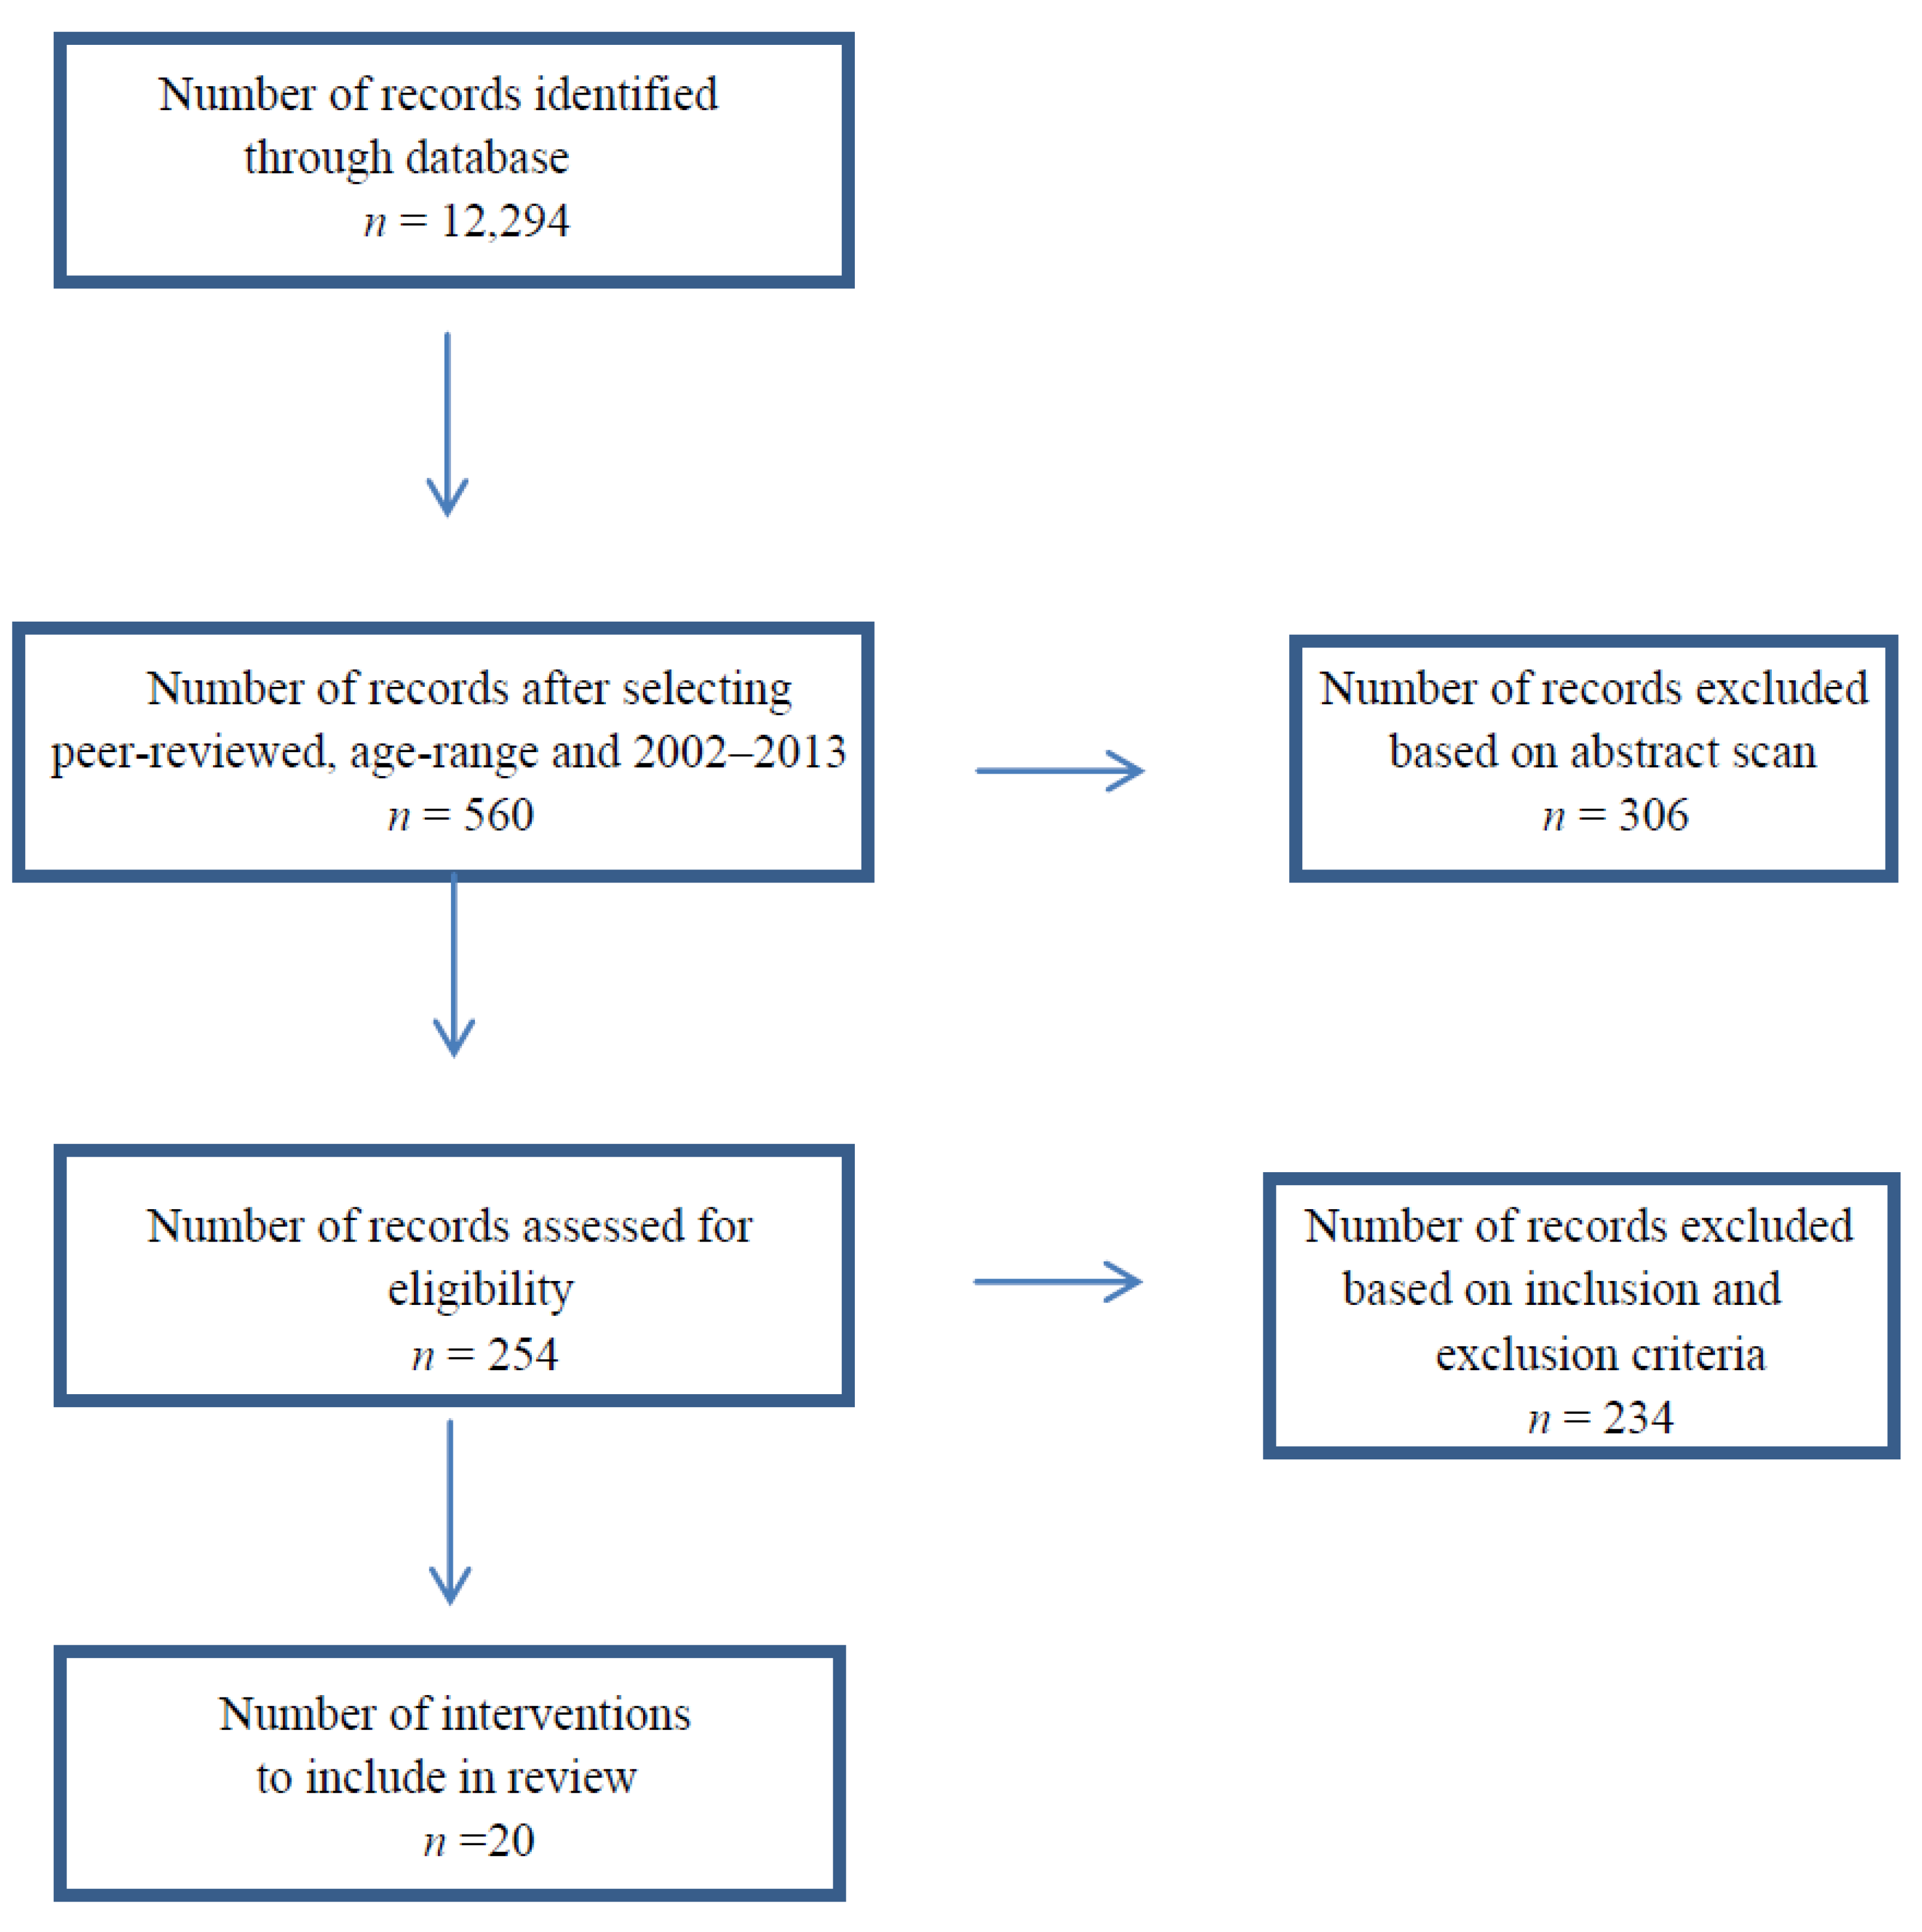
3.1. Results

| Author, Year, Reference # | Sample Description | Sample Size | Research Design | Dosage and Duration | Intervention Strategies |
|---|---|---|---|---|---|
| United States | |||||
| Chehab et al. 2007 [22] | U.S.; HS; Low-income; BL 49% OW; 28% OB | N = 46 girls | Pre-experimental | Weekly 2-h sessions; 29 weeks | Homework, aerobic activity, sampling of healthy foods, cooking exercises, group recitation of motivational catch phrases |
| DeVault et al. 2009 [23] | U.S.; ELEM; Low-income; BL BMI not assessed | N = 140; Tx. = 71, Cnt. = 69 | Quasi-experimental | Six 30-min. weekly lessons; 6 weeks | Fruit and vegetable bingo, baking whole-grain bread to bring home, comparing portion sizes of snack foods |
| Donnelly et al. 2009 [24] | U.S.; ELEM; low-income; BL BMI Int. 17.9 +/− 3.1; Cnt. 18.0 +/−3.7 | N = 1527; Cnt. = 713, Tx. = 814 | RCT | 90 min/week of physically active academic lessons; 3 years | EI; Existing lessons from Take 10!®, PA incorporated across all content areas |
| Foster et al. 2008 [25] | U.S.; Low-income; BL 17% OW, 22–25% OB | N = 1349; Tx. = 749, Cnt. = 600 | RCT | 50 h/year; 2 years | EI; PC; School self-assessment, nutrition education, nutrition policy, social marketing |
| Hollar et al. 2010 [26] | U.S.; ELEM, Low-income; 7.3% Tx. OW; 8.5% Cnt. OW; 17.6% Tx. OB; 22.9% Cnt. OB | N = 1173; Tx. = 974, Cnt. = 199 | Quasi-experimental | Monthly nutritional activities, 10–15 min. PA/day, & structured activities during PE; 2 years | EI; incorporated nutritious ingredients and whole foods, provided a healthy lifestyle curricula, hands on school-based wellness activities such as gardens |
| Johnston et al. 2013 [27] | U.S.; ELEM; BL 33% OW/OB | N = 835; PFI (professional facilitated information): N = 509 SH (self-help): N = 326 | RCT | 5 teaching moments/week, 1 lesson/week, 1 activity/2 weeks, and 1 school-wide activity/semester; 2 years | EI; PC; Healthy messages and lessons were applied to all subject areas |
| Manger et al. 2012 [28] | U.S.; ELEM; BL Cnt. OW 21%; Tx. OW 15%; Cnt. OB 14%; Tx. OB 14% | N = 697; Tx. = 396, Cnt. = 301 | Quasi-experimental | 8 weekly lessons, 30 min. each; 2 years | PC; Food charts and games, hula hoops and skip ropes, songs to promote healthy eating |
| Melnyk et al. 2009 [29] | U.S.; HS; BL Mean BMI percentile 80.5 Tx.; 71.33 Cnt. | N = 19; Tx. = 12, Cnt. = 7 | RCT | 2–3 times/week; 9 weeks | Educational information on leading a healthy lifestyle, role-playing, participation in group PA wearing pedometers. |
| Pbert et al. 2013 [30] | U.S.; HS; Low-income; BL 78.6% Int. OB; 60% Cnt. OB | N = 82; Tx. = 42, Cnt. = 40 | RCT | 6 one-on-one sessions; 2 months | 5-3-2-1-0 approach to support making 5 key behavior changes |
| Wang et al. 2010 [31] | U.S.; ELEM; Low-income; BL: OW/OB not assessed | N = 327 | Prospective | Integrated daily; 2 years | EI; PC; Change in school food, school dining, offering of cooking classes, school gardens, lesson integration, food diaries |
| International | |||||
| Graf et al. 2008 [32] | International; ELEM; BL: OW 8.1%; OB 6.6% | N = 615 | Quasi-experimental | One extra health lesson/week (20–30 min.), and one 5 min. PA break/morning; 4 years | PC; health lessons, mini PA breaks |
| Hartmann et al. 2010 [33] | International; ELEM; OW And/or OB: 1st grade Cnt. 25%; 1st grade Tx. 26%; 5th grade Cnt. 26%; 5th grade Tx. 25% | N = 411; 1st grade Cnt.=69; 1st grade Tc.p:=111; 5th grade Cnt.=85; 5th grade Tx. p = 146 | RCT | Daily PE, short activity breaks/day during lessons, PA homework playground changes; 1 year | EI;PC; Increased PA, playground changes, PA homework |
| James et al. 2004 [34] | International; ELM; BL: 27.6% F Tx. OW; 20.1% M Tx. OW; 5.7% F Tx. OB; 4.1% M Tx. OB; 28% F Cnt. OW; 18.8% M Cnt. OW.; 7.3% F Cnt. OB; 1.7% M Cnt. OB | Tx. =15 clusters, N = 325. Cnt. = 14 clusters, N = 319 | RCT | Four 1 h sessions; 1 year | EI; Educational sessions, drink diary |
| Kanyamee et al. 2013 [35] | International; ELEM; Low-income; Mean BMI z scores Tx. = 2.39 (SD = 0.42); Cnt.=2.53 (SD = 0.56) | N = 136; 68 per group | RCT | Weekly; 18 weeks | Dietary intake recorded daily, computer games, cartoon animation, and comic books |
| cLlargues et al. 2011 [36] | International; ELEM; BL 16.7% Cnt. OW; 20.3% Tx. OW; 18.1% Cnt. OB; 9.6% Tx. OB | N = 509; Tx. = 272, Cnt. = 237 | RCT | 3 h/week; 2 years | EI; PC; CR; Regular PA, hands on activities like cooking workshops and promotion of playground games. |
| Lopes et al. 2009 [37] | International;ELEM; BL BMI mean and s.d. in girls 6–7: 16.4 +/− 3, girls age 8 and +: 17.7 +/− 3.6. Boys 6–7: 16.8 +/− 2.6 and boys 8 and +: 17.8 +/− 3.2 | N = 168; 81 from one school and 87 from another | Quasi-experimental | 30 min/day; 2 weeks | EI; access to extra exercise/play equipment |
| Muckelbauer et al. 2009 [38] | International; ELEM; low-income; BL OW Tx. 23.4%; Cnt. 25.9% | N = 2950; Tx. = 1641, Cnt. = 1309 | RCT | Daily (water fountain exposure), four 45-min. classroom lessons; 1 year | EI; installment of water fountains, distribution of water bottles, associated classroom lessons |
| Sachetti et al. 2013 [39] | International; ELEM; BL Cnt. OW 24.1%; Tx. 25% OW; Cnt. 8.8% OB; Tx. 10.4% OB. | N = 428; Tx. = 212, Cnt. = 216 | RCT | 30 min PA, two 50 min. sessions/week of extra PE/week; 2 years | EI; School yard & classroom activity including circuits, games, exercises |
| Walther et al. 2009 [40] | International; ELEM; BL BMI percentile Cnt. 52.5 +/− 28.8; Int. 50.5 +/− 28.9. | N = 188; Tx. = 112, Cnt. = 76 | RCT | Int. = 45 min. PA/day. Cnt. = 45 min. exercise twice/week, healthy lifestyles session once/ month; 1 year | EI; Increased PA, lessons on lifestyles |
| Wong & Cheng, 2013 [41] | International; ELEM; BL 100% OW/OB | N = 185; MI (n =70) ; MI + group (n = 66); Cnt. = 49 | Quasi-experimental | 14-week, six-section program. 30-min./session; 11 months. | PC; Diet journal, exercise log, motivational interviewing |
| Author, Year | Primary Outcome (s) | Measures | Measures-Time | Attrition | Salient Findings |
|---|---|---|---|---|---|
| United States | |||||
| Chehab et al. 2007 [22] | BMI | Ht., wt. | Baseline, 29 weeks | 84.8% completed all components | For OB & OW girls, positive relationship (p < 0.01) between wt. loss and extent of program participation |
| DeVault et al. 2009 [23] | Nutrition-related knowledge, attitudes, behaviors | Surveys | Baseline, 6 weeks, 3 weeks follow up | 46% Cnt. & 54% of the Tx. completed both surveys all three times | Behavioral intent for food choice sig. increased at post- for Int. vs. Cnt. p < 0.014 |
| Donnelly et al. 2009 [24] | BMI | Ht., wt., academic achievement | Baseline, 3 years | 2.5% dropped out | Change for overweight to at-risk approached significance (p = 0.08). |
| Foster et al. 2008 [25] | OW, OB | Ht., wt. dietary intake, PA, sedentary behavior | Baseline, spring of year 1, 2 years | Int. & Cnt. schools at 1 (31.9% vs. 31.5%) & 2 years (36.0% vs. 39.2%) | Cnt. = 15%, Int. = 7.5% overweight in 2 years. After controlling for gender, race/ethnicity, age, predicted ORI of overweight were ~33% for the Int. group (OR = 0.67; 95% CI: 0.47–0.96; p < 0.05) |
| Hollar et al. 2010 [26] | BMI | Ht., wt., FCAT scores | Baseline, 2 years | Not mentioned | Decrease BMI between baseline and post-intervention: Cnt.: OW = 6.8 %, Tx. = 2.1% (p = .27) |
| Johnston et al. 2013 [27] | zBMI, academic outcomes | Ht., wt., year-end final grades, GPA | Baseline, 24 months | 79% completed all msmnts. | Students who were OW/OB in the PFI sig. reduced (zBMI) compared to SH group (p < 0.001). |
| Manger et al. 2012 [28] | BMI | Ht., wt. | Baseline, annually | The final data set included 697 students, 125 of whom had 2 and 572 of whom had 3 assessments of BMI | Adjusted Mean BMI % declined from 66.1 to 65.0 in Cnt., 62.8 to 58.9 in Int. (p = 0.015) |
| Melnyk et al. 2009 [29] | Triglycerides, lipoproteins, beliefs, nutritional knowledge, depressive symptoms | Ht., wt., BMI, waist circum., blood work, student- completed evaluations | Baseline, post-intervention | 89% provided complete baseline and post-intervention data | Tx.: increased commitment to make healthy choices (via choices scale)—at baseline: 54.5 and post-intervention: 58.91 (p = 0.07) |
| Pbert et al. 2013 [30] | BMI, waist circum., percent body fat, BP | Ht., wt., BMI, BP, waist circum., dietary intake, PA via accelerometer | Baseline, 2 months, 6 months | 100% remained | Adjusted Mean change BMI 6 months post 95% CI (p < 0.676) Cnt.: = 0.23 (−0.46, 0.910, Tx. = 0.01 (−0.66, 0.68) |
| Wang et al. 2010 [31] | Nutrition knowledge, fruits & vegetables | Surveys, food diaries, interviews with teachers & administration | Food behavior assessed annually, surveys completed by students (not specified) | 82.3% remained | Students most exposed to intervention increased fruits & vegetables by 0.2 cups, students least exposed decreased 0.3 cups (p < 0.05) |
| International | |||||
| Graf et al. 2008 [32] | Endurance, motor, coordination tests | Ht., wt., BMI, motor tests, body coordination tests | Baseline, end of second school year, end of fourth school year | 2% dropped out | 23.2% (13/56) of OB and OW children from the Tx. reached normal weight at final exam |
| Hartmann et al. 2010 [33] | Physical, psychosocial QOL | QOL (survey), pubertal stages, anthropometry, body composition, sociodemographic variables | Baseline, 1 year | 90% had valid post-intervention data (N = 411) | PA had sig. effect on psychosocial QOL in OW (p < 0.05) and urban first graders (p < 0.05) |
| James et al. 2004 [34] | Drink consumption, OW, OB | Ht., wt., waist circum., BMI | Baseline, 6 months, 1 year | 89% remained at 1year | 12 months post, Mean %> than 91st percentile for BMI Cnt. = 26.9%., Tx. = 20.1% |
| Kanyamee et al. 2013 [35] | Intention to perform eating behaviors, eating behaviors, BMI | Intention to perform eating behavior for wt. control; eating behaviors for wt. control, ht., wt., BMI | Baseline, 6 weeks, 18 weeks | 100% remained | At 18 weeks, Mean BMI for age (z scores) p < 0.001—Tx. = 2.00, Cnt.: = 2.55 |
| Llargues et al. 2011 [36] | BMI | Changes in eating habits, PA | Baseline, 2 years | Complete data obtained 72.3%, Cnt. = 237 (78.8%), Tx. = 272 (72.7%) | Cnt.: OW = 24.9%, OB = 10.7%. Tx.: OW = 25.1%, OB = 8.9%, p < 0.001 |
| Lopes, Lopes, and Pereira, 2009 [37] | PA levels | Gender, age, BMI accelerometer | Baseline, 2-weeks | 24 students were excluded | Sig. effects for total PA (p<0.001). Sig. interaction between gender & age (p = 0.009) |
| Muckelbauer et al. 2009 [38] | BMI | Ht., wt., gender, age, migrational background, survey | Baseline, 1 year | 92% completed intervention | BMI SDS changes from baseline to follow-up assessment were 0.005 +/− 0.289 in the Tx. & 0.007 +/− 0.295 in the Cnt. |
| Sachetti et al. 2013 [39] | PA habits, physical performances, and BMI | Ht., wt., BMI, motor tests | Baseline, 2 years | 14.2% and 13.9% in Tx. and Cnt. groups did not complete | Decrease (boys: 10%; girls: 12%) in daily sedentary activities, p < 0.05; Int. lower rise in BMI compared to the Cnt. (p < 0.001) |
| Walther et al. 2009 [40] | BMI-SDS, leukocyte msmt., HDL, motor quotient score | Body composition, BP, HR, body coordination, spirometry. Blood work, survey | Baseline, 1 year | 3 were lost in follow up for both the Cnt. and Int. groups (6 total) | Decrease OW and OB in Tx. from 12.8% to 7.3% |
| Wong & Cheng, 2013 [41] | Change in wt.-for-ht. % | Changes in weight-related behaviors, anthropometric measures | From the 4th to the 11th month after baseline | 4 did not complete, not specified as to which group | Sig. increase in the avg. calories consumed due to increase in PA in past 7 days in MI group (p < 0.01) and MI+ group (p < 0.01). Sig. change at post in BMI, fat %, anthropometric measures |
3.1.1. Sample and Design
3.1.2. Theoretical Framework
3.1.3. Intervention Approach
3.1.4. Intervention Outcomes and Measures
3.2. Discussion
|
4. Limitations
5. Conclusions
Author Contributions
Conflicts of Interest
References
- Harvard School of Public Health. Obesity Trends: Tracking the Global Epidemic. Available online: http://hsph.hardvard.edu/obesity-prevention-source/obesity-trends/ (accessed on 10 May 2014).
- Popkin, B.M.; Conde, W.; Hou, N.; Monteiro, C. Is there a lag globally in overweight trends for children compared with adults? Obesity (Silver Spring) 2006, 14, 1846–1853. [Google Scholar]
- Wang, Y.; Lobstein, T. Worldwide trends in childhood overweight and obesity. Int. J. Pediatr. Obes. 2006, 1, 11–25. [Google Scholar] [CrossRef] [PubMed]
- Onis, M.; Blossner, M.; Borghi, E. Global prevalence and trends of overweight and obesity among preschool children. Am. J. Clin. Nutr. 2010, 92, 1257–1264. [Google Scholar] [CrossRef] [PubMed]
- Olds, T.; Maher, C.; Zumin, S.; Peneau, S.; Lioret, S.; Castetbon, K.; Bellisle; de Wilde, J.; Hohepa, M.; Maddison, R.; et al. Evidence that the prevalence of childhood overweight is plateauing: Data from nine countries. Int. J. Pediatr. Obes. 2011, 6, 342–260. [Google Scholar] [CrossRef] [PubMed]
- Fryar, C.D.; Carroll, M.D.; Ogden, C.L. Prevalence of Overweight, Obesity, and Extreme Obesity among Adults: United States, Trends 1960–1962 through 2009–2010. Centers for Disease Control and Prevention: Atlanta, GA, USA, 2010. Available online: www.cdc.gov/nchs/data/hestat/obesity_adult_09_10/obesity_adult_09_10.htm (accessed on 12 May 2014). [Google Scholar]
- Ogden, C.L.; Carroll, M.D.; Kit, B.K.; Flegal, K.M. Prevalence of obesity and trends in body mass index among US children and adolescents, 1999–2010. JAMA 2012, 307, 483–490. [Google Scholar] [CrossRef] [PubMed]
- Withrow, D.; Alter, D.A. The economic burden of obesity worldwide: A systematic review of the direct costs of obesity. Obes. Rev. 2011, 12, 131–141. [Google Scholar] [CrossRef] [PubMed]
- Freedman, D.S.; Mei, Z.; Srinivasan, S.R.; Berenson, G.S.; Dietz, W.H. Cardiovascular risk factors and excess adiposity among overweight children and adolescents: The Bogalusa heart study. J. Pediatr. 2007, 150, 12–17. [Google Scholar] [CrossRef] [PubMed]
- Whitlock, E.P.; Williams, S.B.; Gold, R.; Smith, P.R.; Shipman, S.A. Screening and interventions for childhood overweight: A summary of evidence for the US Preventive Services Task Force. Pediatrics 2005, 116, 125–144. [Google Scholar]
- French, S.A.; Story, M.; Perry, C.L. Self-esteem and obesity in children and adolescents: A literature review. Obes. Res. 1995, 3, 479–490. [Google Scholar]
- Sharma, M.; Ickes, J. Psychological determinants of childhood and adolescent obesity. JSBHS 2008, 2, 33–49. [Google Scholar]
- Young, B.E.; Johnson, S.L.; Krebs, N.F. Advances in nutrition. Adv. Nutr. 2012, 3, 675–686. [Google Scholar] [CrossRef]
- Rennie, K.L.; Johnson, L.; Jebb, S.A. Behavioural determinants of obesity. Best Prac. Res. Clin. Anaesthesiol. 2005, 19, 343–358. [Google Scholar] [CrossRef]
- Budd, G.M.; Hayman, L.L. Childhood obesity: Determinants, prevention and treatment. J. Cardiovasc. Nurs. 2006, 21, 437–441. [Google Scholar] [CrossRef] [PubMed]
- Robert Wood Johnson Foundation. F as in Fat: How Obesity Threatens America’s Future; RWJF: Washington, DC, USA, 2013. [Google Scholar]
- Sharma, M. School-based interventions for childhood and adolescent obesity. Obes. Rev. 2006, 7, 261–269. [Google Scholar] [CrossRef] [PubMed]
- Sharma, M. International school-based interventions for preventing obesity in children. Obes. Rev. 2007, 8, 155–167. [Google Scholar] [CrossRef] [PubMed]
- The Community Guide. Obesity Prevention and Control: School-Based Programs. Available online: www.thecommunityguide.org/obesity/schoolbased.html (accessed on 18 January 2014).
- Karnik, S.; Kanekar, A. Childhood obesity: A global public health crisis. Int. J. Prev. Med. 2012, 3, 1–7. [Google Scholar] [PubMed]
- Summerbell, C.D.; Waters, E.; Edmunds, L.D.; Kelly, S.; Campbell, K.J. Interventions for preventing obesity in children. Cochr. Datab. Syst. Rev. 2005. [Google Scholar] [CrossRef] [Green Version]
- Chehab, L.G.; Pfeffer, B.; Vargas, I.; Chen, S.; Irigoyen, M. “Energy Up”: A novel approach to the weight management of inner-city teens. J. Adolesc. Health 2007, 40, 474–476. [Google Scholar] [CrossRef] [PubMed]
- DeVault, N.; Kennedy, T.; Hermann, J.; Mwayita, M.; Rask, P.; Jaworsky, A. It’s all about kids: Preventing overweight in elementary school children in Tulsa, OK. J. Am. Diet. Assoc. 2009, 109, 680–687. [Google Scholar] [CrossRef] [PubMed]
- Donnelly, J.E.; Greene, J.L.; Gibson, C.A.; Smith, B.K.; Washburn, R.A.; Sullivan, D.K.; DuBose, K.; Mayo, M.S.; Schmelzle, K.H.; Ryan, J.J.; et al. Physical Activity Across the Curriculum (PAAC): A randomized controlled trial to promote physical activity and diminish overweight and obesity in elementary school children. Prev. Med. 2009, 49, 336–341. [Google Scholar] [CrossRef] [PubMed]
- Foster, G.D.; Sherman, S.; Borradaile, K.E.; Grundy, K.M.; vander Veur, S.S.; Nachmani, J.; Karpyn, A.; Kumanyika, S.; Shults, J. A policy-based school intervention to prevent overweight and obesity. Pediatrics 2008, 121, 794–802. [Google Scholar] [CrossRef]
- Hollar, D.; Messiah, S.E.; Lopez-Mitnik, G.; Hollar, T.L.; Almon, M.; Agatston, A.S. Effect of a two-year obesity prevention intervention on percentile changes in body mass index and academic performance in low-income elementary school children. Am. J. Public Health 2010, 100, 646–653. [Google Scholar] [CrossRef] [PubMed]
- Johnston, C.A.; Moreno, J.P.; El-Mubasher, A.; Gallagher, M.; Tyler, C.; Woehler, D. Impact of a school-based pediatric obesity prevention program facilitated by health professionals. J. Sch. Health 2013, 83, 171–181. [Google Scholar] [CrossRef] [PubMed]
- Manger, W.M.; Manger, L.S.; Minno, A.M.; Killmeyer, M.; Holzman, R.S.; Schullinger, J.N.; Roccella, E.J. Obesity prevention in young schoolchildren: Results of a pilot study. J. Sch. Health 2012, 82, 462–468. [Google Scholar] [CrossRef] [PubMed]
- Melnyk, B.M.; Jacobson, D.; Kelly, S.; O’Haver, J.; Small, L.; Mays, M.Z. Improving the mental health, healthy lifestyle choices, and physical health of Hispanic adolescents: A randomized controlled pilot study. J. Sch. Health 2009, 79, 575–584. [Google Scholar] [CrossRef] [PubMed]
- Pbert, L.; Druker, S.; Gapinski, M.A.; Lauren, G.; Magner, R.; Reed, G.; Schneider, K.; Osganian, S. A school nurse-delivered intervention for overweight and obese adolescents. J. Sch. Health 2013, 83, 182–193. [Google Scholar] [CrossRef] [PubMed]
- Wang, M.C.; Rauzon, S.; Studer, N.; Martin, A.C.; Craig, L.; Merlo, C.; Kursunoglu, D.; Shannguan, M.; Crawford, P. Exposure to a comprehensive school intervention increases vegetable consumption. J. Adolesc. Health 2010, 47, 74–82. [Google Scholar]
- Graf, C.; Koch, B.; Falkowski, G.; Jouck, S.; Christ, H.; Staudenmaier, K.; Tokarski, W.; Gerber, A.; Predel, H.; Dordel, S. School-based prevention: Effects on obesity and physical performance after 4 years. J. Sports Sci. 2008, 26, 987–994. [Google Scholar] [CrossRef] [PubMed]
- Hartmann, T.; Zahner, L.; Pühse, U.; Puder, J.J.; Kriemler, S. Effects of a school-based physical activity program on physical and psychosocial quality of life in elementary school children: A cluster-randomized trial. Pediatr. Exerc. Sci. 2010, 22, 511–522. [Google Scholar] [PubMed]
- James, J; Thomas, P.; Cavan, D.; Kerr, D. A school-based programme to reduce carbonated drink consumption reduced obesity in children. Evid. Based Nurs. 2004, 328, 1237–1241. [Google Scholar]
- Kanyamee, M.; Warunee, F.; Jutama, C.; Patcharaporn, A.; Kennedy, C. An intervention study of changing eating behaviors and reducing weight in Thai children aged 10–12. Pac. Rim Int. J. Nurs. Res. 2013, 7, 317–328. [Google Scholar]
- Llargues, E.; Franco, R.; Recsens, A.; Nadal, A.; Vila, M.; Perez, J.M.; Recasens, I.; Salvador, G.; Serra, J.; Roure, E.; et al. Assessment of a school-based intervention in eating habits and physical activity in school children: The AVall study. J. Epidemiol. Commun. Health 2011, 65, 896–901. [Google Scholar] [CrossRef]
- Lopes, L.; Lopes, V.; Pereira, B. Physical activity levels in normal weight and overweight Portuguese children: An intervention study during an elementary school recess. Int. Electron. J. Health Educ. 2009, 12, 175–184. [Google Scholar]
- Muckelbauer, R.; Libuda, L.; Clausen, K.; Toschke, A.M.; Reinehr, T.; Kersting, M. Promotion and provision of drinking water in schools for overweight prevention: Randomized, controlled cluster trial. Pediatrics 2009, 123, 661–667. [Google Scholar] [CrossRef]
- Sacchetti, R.; Ceciliani, A.; Garulli, A.; Dallolio, L.; Beltrami, P.; Leoni, E. Effects of a 2-year school-based intervention of enhanced physical education in the primary school. J. Sch. Health 2013, 83, 639–646. [Google Scholar] [CrossRef] [PubMed]
- Walther, C.; Gaede, L.; Gelbrich, G.; Leichtle, A.; Erbs, S.; Sonnabend, M.; Fikenzer, K.; Korner, A.; Kiess, W.; Bruegel, M.; et al. Effect of increased exercise in school children on physical fitness and endothelial progenitor cells: A prospective randomized trial. Circulation 2009, 120, 2251–2259. [Google Scholar] [CrossRef] [PubMed]
- Wong, E.M.; Cheng, M.M. Effects of motivational interviewing to promote weight loss in obese children. J. Clin. Nurse 2013, 22, 2519–2530. [Google Scholar] [CrossRef]
- Glanz, K.; Rimer, B.; Lewis, F.M. Health Behavior and Health Education: Theory, Research, and Practice, 3rd ed.; Jossey-Bass, Inc.: San Francisco, CA, USA, 2002. [Google Scholar]
© 2014 by the authors; licensee MDPI, Basel, Switzerland. This article is an open access article distributed under the terms and conditions of the Creative Commons Attribution license (http://creativecommons.org/licenses/by/3.0/).
Share and Cite
Ickes, M.J.; McMullen, J.; Haider, T.; Sharma, M. Global School-Based Childhood Obesity Interventions: A Review. Int. J. Environ. Res. Public Health 2014, 11, 8940-8961. https://doi.org/10.3390/ijerph110908940
Ickes MJ, McMullen J, Haider T, Sharma M. Global School-Based Childhood Obesity Interventions: A Review. International Journal of Environmental Research and Public Health. 2014; 11(9):8940-8961. https://doi.org/10.3390/ijerph110908940
Chicago/Turabian StyleIckes, Melinda J., Jennifer McMullen, Taj Haider, and Manoj Sharma. 2014. "Global School-Based Childhood Obesity Interventions: A Review" International Journal of Environmental Research and Public Health 11, no. 9: 8940-8961. https://doi.org/10.3390/ijerph110908940