
Household Water Quantity and Health: A Systematic Review

Abstract
:1. Introduction
2. Methods
2.1. Criteria for Selecting Studies
- Eligible study designs included randomized controlled trials (RCTs); non-randomized studies (NRS) with a control group, including quasi-RCTs, non-randomized controlled trials, and controlled before-and-after studies; interrupted time-series studies; historically controlled studies; case-control studies; cohort studies; and cross-sectional studies.
- The exposure of interest was a measured change or difference in the quantity of water used in the home. Self-reported or estimated measures of water quantity were acceptable, but proxy measures such as distance to a water source or number of contacts with a water source were ineligible.
- The outcomes of interest were direct health outcomes measured at the individual or household level. Intermediate health outcomes such as cellular or metabolic processes were excluded.
- There had to be at least one quantified measure of effect linking water quantity and the health outcome of interest.
2.2. Search Methods
2.3. Data Collection, Extraction, and Analysis
2.4. Risk of Bias
3. Results
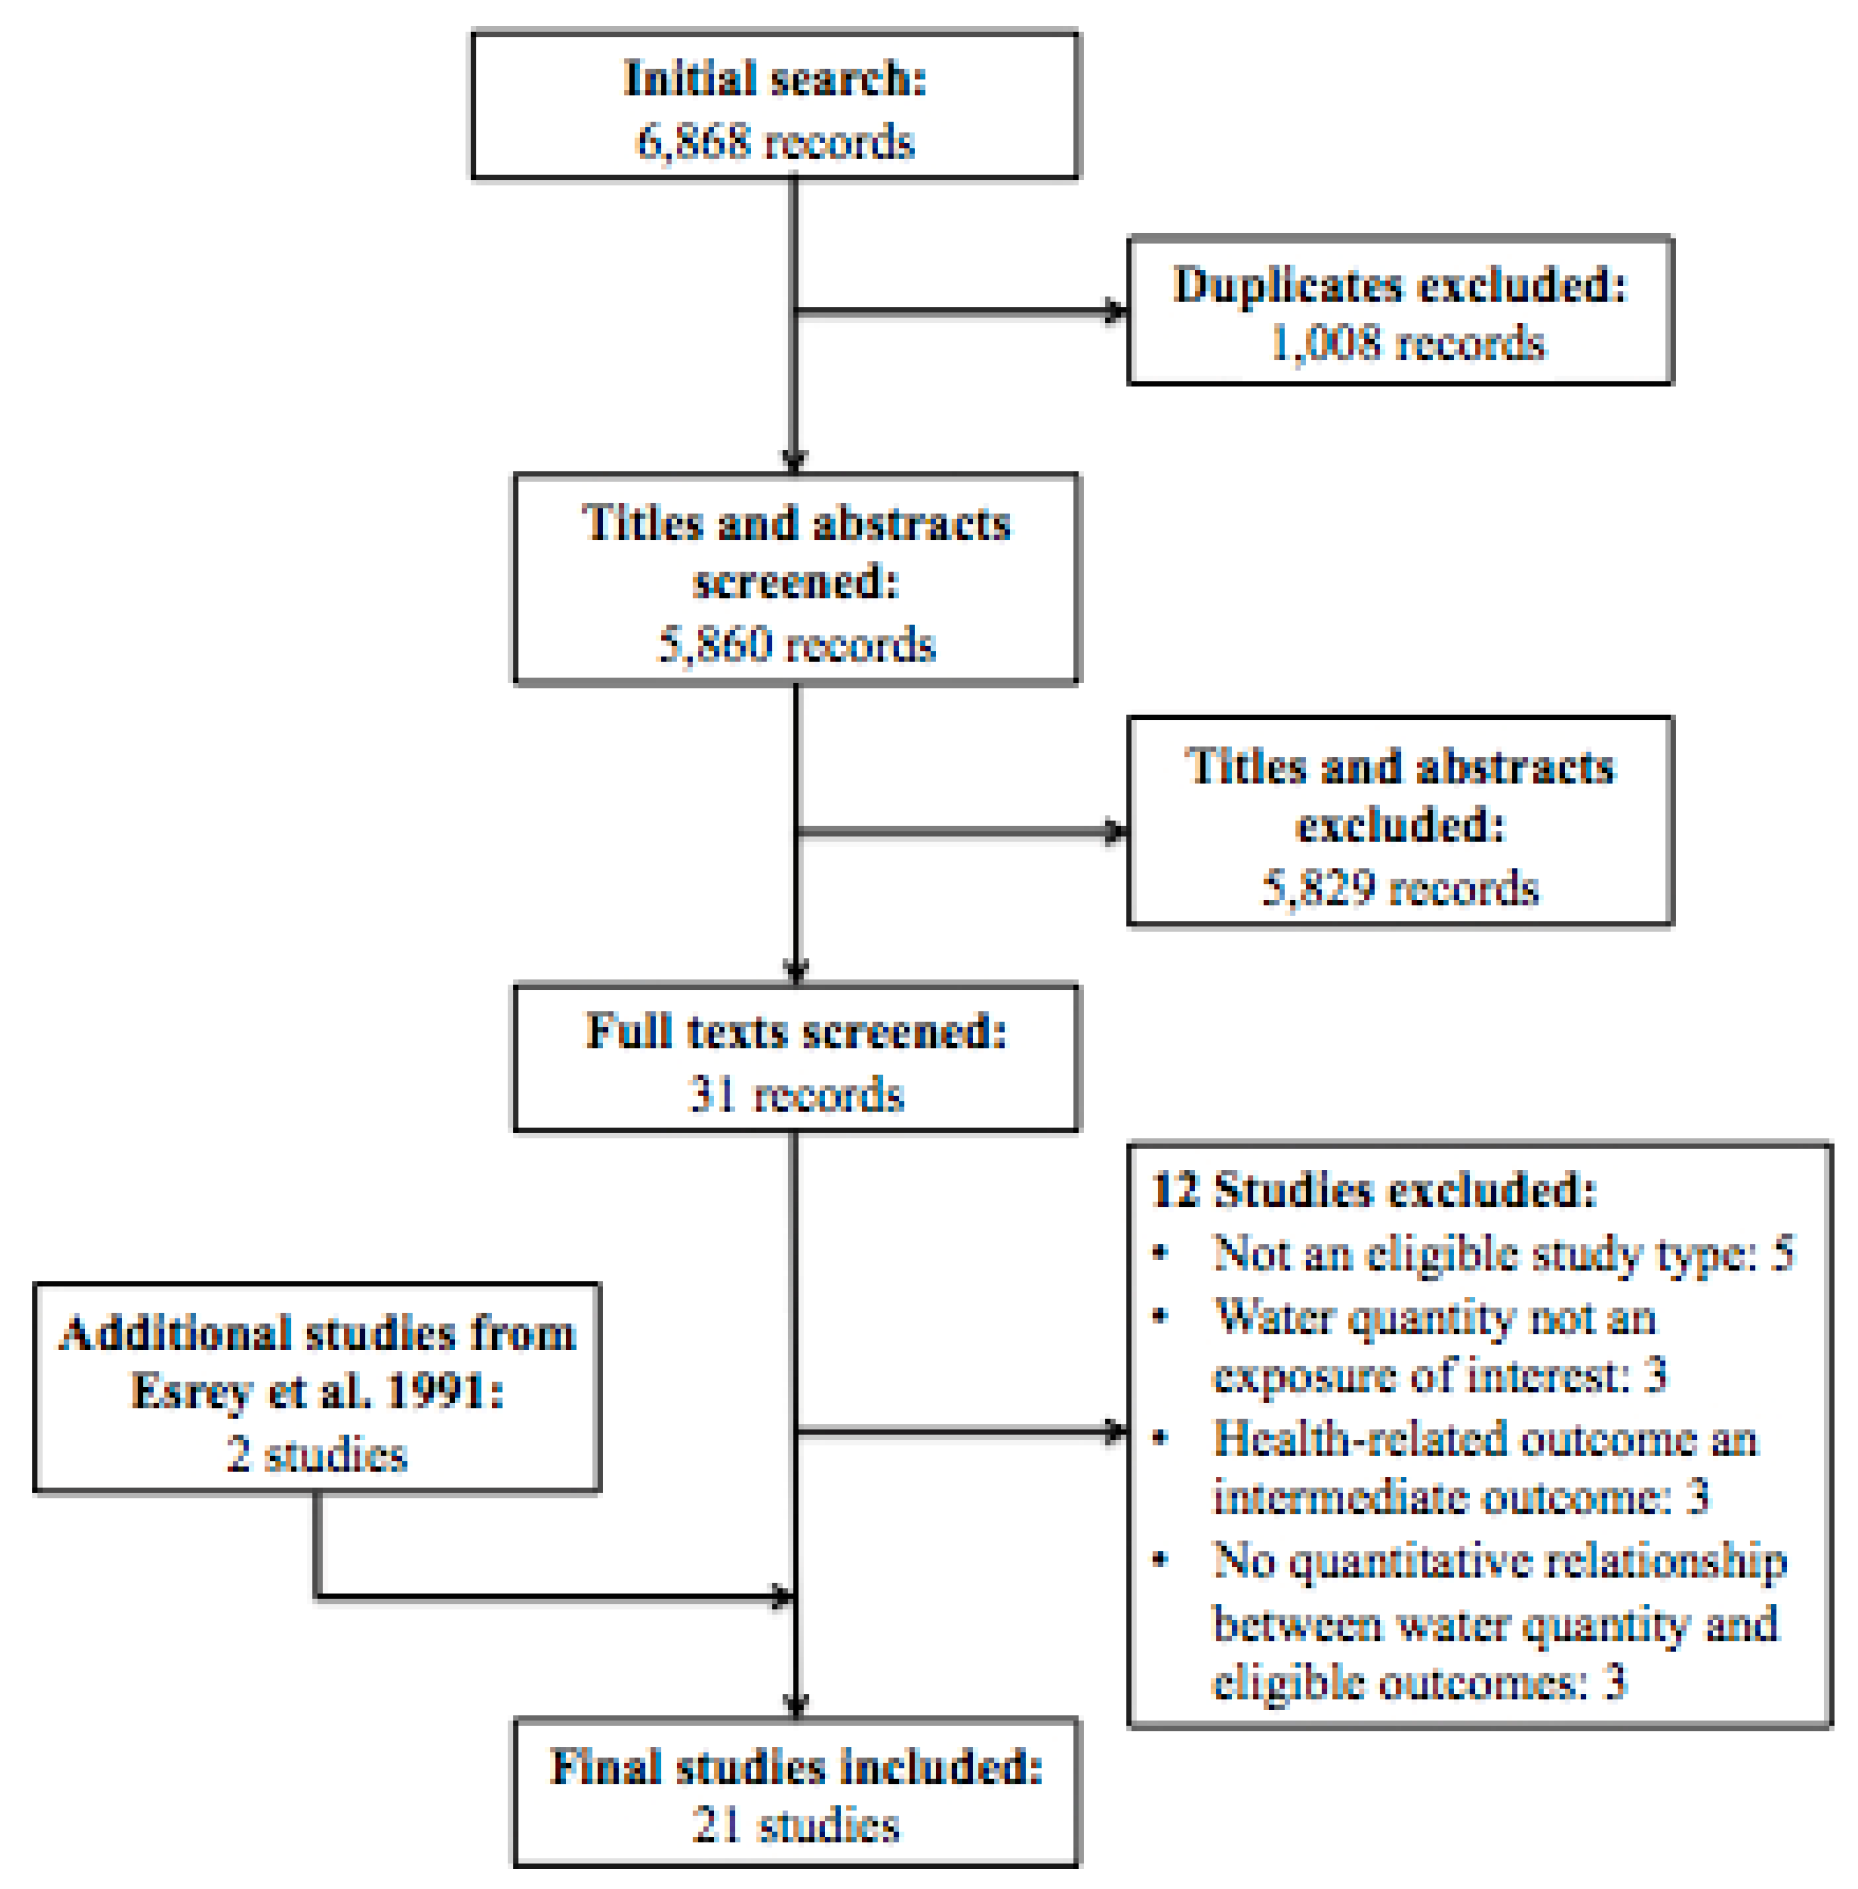
3.1. Description of Studies

3.2. Risk of Bias

| Study | Study Type | Exposure Measure | Outcome Measure | Control for Confounding | Response Rate | Selective Reporting | Overall Risk of Bias |
|---|---|---|---|---|---|---|---|
| Aggarwal 2012 [23] | Retrospective cohort | unclear | unclear | low | low | low | high |
| Bailey 1991 [24] | Case control | low | low | low | low | low | low |
| Cairncross 1987 [25] | Cross-sectional | low | high | high | unclear | high | high |
| Esrey 1989 [26] | Cross-sectional | low | high | low | unclear | low | high |
| Esrey 1992 [27] | Cross-sectional | high | low | low | low | low | high |
| Hebert 1985 [28] | Cross-sectional | high | low | low | low | low | high |
| Hu 2009 [29] | Case control | high | low | low | high | low | high |
| Jones 2007 [30] | Cross-sectional | high | high | low | high | high | high |
| Khan 1982 [31] | Cross-sectional | low | low | high | unclear | high | high |
| Kupka 1968 [32] | Cross-sectional | low | low | high | unclear | low | high |
| Mahande 2012 [33] | Case control | high | low | low | unclear | low | high |
| Moalic 2000 [34] | Cross-sectional | high | low | high | unclear | low | high |
| Palmer 2012 [35] | Prospective cohort | high | low | low | low | low | low |
| Pan 2012 [36] | Prospective cohort | high | low | low | low | low | low |
| Polack 2006 [37] | Cross-sectional | low | low | low | low | low | low |
| Shrestha 2013 [38] | Cross-sectional | high | high | low | low | low | high |
| Teklemariam 2000 [39] | Cross-sectional | high | high | high | low | low | high |
| Tumwine 2002 [40] | Cross-sectional | low | high | low | unclear | low | low |
| Vena 1993 [41] | Case control | high | low | low | unclear | high | high |
| West 1989 [42] | Cross-sectional | high | low | low | unclear | low | high |
| Zhang 2013 [43] | Cross-sectional | low | low | high | unclear | high | high |
3.3. Effects of Intervention
3.3.1. Trachoma
3.3.2. Gastrointestinal Illness
3.3.3. Growth Indicators
| Study | Setting and Participants | Trachoma Indicator | Water Quantity Measure(s) | Measure of Effect | Comparison Groups * | Values * | p Value |
|---|---|---|---|---|---|---|---|
| Bailey 1991 [24] | Gambia; rural children, <15 years | Household (HH) with at least one active trachoma case | Water brought to house | Comparison | Trachoma vs. no trachoma | 15.8 vs. 17.9 liters (L) per HH per day | >0.05 |
| Water usage for bathing children | Comparison | Trachoma vs. no trachoma | 4.2 vs. 6.4 L per child per day | 0.03 | |||
| Cairncross 1987 [25] | Mozambique; residents of rural HH | Prevalence of trachoma | Water brought to house | Comparison | High prevalence vs. low prevalence | 8 vs. 14 liters per capita per day (lpcd) | unclear |
| Kupka 1968 [32] | Morocco; residents of rural HH | Active trachoma (among <1 year olds) | Water usage | Odds ratio (OR) | <5 lpcd | (ref) | |
| 5–10 lpcd | 0.71 (0.13, 3.33) | 0.69 | |||||
| >10 lpcd | undefined | undefined | |||||
| Active trachoma (among 1–15 year olds) | Water usage | OR | <5 lpcd | (ref) | |||
| 5–10 lpcd | 0.79 (0.38, 1.54) | 0.51 | |||||
| >10 lpcd | 0.34 (0.14, 0.82) | 0.01 | |||||
| Active trachoma (among >15 year olds) | Water usage | OR | < 5 lpcd | (ref) | |||
| 5–10 lpcd | 0.89 (0.61, 1.31) | 0.63 | |||||
| >10 lpcd | 0.99 (0.60, 1.63) | 0.96 | |||||
| Severe trachoma (all ages) | Water usage | OR | <5 lpcd | (ref) | |||
| 5–10 lpcd | 0.93 (0.68, 1.27) | 0.63 | |||||
| > 10 lpcd | 1.01 (0.64, 1.58) | 0.96 | |||||
| Mahande 2012 [33] | Tanzania; residents of rural HH with at least 2 children 1–9 years | HH with at least 2 children with active trachoma | Water brought to house | OR | ≥60 L vs. <60 L | 0.40 (0.10, 0.30) | <0.001 |
| Water usage for face washing | OR | ≥2 L vs. 1 L | 0.01 (0.02, 0.07) | <0.001 | |||
| Water usage for bathing children | OR | >20 L vs. 10–20 L | 0.90 (0.24, 0.80) | >0.05 | |||
| Moalic 2000 [34] | Senegal; rural children (no age) | Child with trachoma | Water usage for washing | Comparison | Trachoma vs. no trachoma | 8.6 L vs. 9.3 L | 0.04 |
| Polack 2006 [37] | Tanzania; rural children, 1–9 years | Child with trachoma | Water brought to house | OR | ≤8 lpcd | (ref) | >0.05 |
| 9–15 lpcd | 1.02 (0.53, 1.94) | ||||||
| 15–20 lpcd | 1.12 (0.51, 2.47) | ||||||
| >20 lpcd | 1.22 (0.68, 2.18) | ||||||
| Water usage | OR | 3.8–11.3 lpcd | (ref) | >0.05 | |||
| 11.3–14.6 lpcd | 0.93 (0.27, 3.24) | ||||||
| 14.6–21.3 lpcd | 0.81 (0.23, 2.88) | ||||||
| 3.8–11.3 lpcd | 1.04 (0.26, 3.39) | ||||||
| Water usage for face washing | OR | <2 lpcd | (ref) | <0.05 | |||
| 2–3.7 lpcd | 0.32 (0.10, 1.06) | ||||||
| 3.8–5 lpcd | 0.08 (0.02, 0.31) | ||||||
| >5 lpcd | 0.05 (0.01, 0.25) | ||||||
| Water usage for face washing children | OR | <2 lpcd | (ref) | <0.01 | |||
| 2–3.5 lpcd | 0.39 (0.11, 1.34) | ||||||
| 3.6–5 lpcd | 0.29 (0.08. 1.11) | ||||||
| >5 lpcd | 0.33 (0.09, 1.17) | ||||||
| West 1989 [42] | Tanzania; rural children, 1–6 years | HH with at least one active trachoma case | Water brought to house | OR | <25 L | (ref) | >0.05 |
| 25–45 L | 1.01 (0.76, 1.35) | ||||||
| >45 L | 0.84 (0.61, 1.15) |
| Study | Setting and Participants | Gastrointestinal Illness Indicator | Water Quantity Measure(s) | Measure of Effect | Comparison Groups * | Values * | p Value |
|---|---|---|---|---|---|---|---|
| Esrey 1989 [26] | Lesotho; rural children (no age given) | Giardia lambia infection | Water usage | OR | 8 lpcd | 2.31 (1.25, 4.26) | <0.05 |
| Jones 2007 [30] | Canada; rural and urban residents | Acute gastrointestinal illness (AGI) within past 28 days | Water consumption | OR | AGI vs. no AGI | 1.06 (1.03, 1.09) | <0.05 |
| Khan1982 [31] | Bangladesh; family contacts of Shigellosis cases | Shigellosis infection (among contacts of people receiving hand washing intervention) | Drinking and cooking water usage | OR | >5.5 L vs. < 4.5 L | 0.51 (0.11, 3.78) | 0.44 |
| Bathing and washing water usage | OR | ≥25 L vs. <20 L | 0.09 (0.003, 0.65) | 0.008 | |||
| Shigellosis infection (among contacts of people receiving no hand washing intervention) | Drinking and cooking water usage | OR | >5.5 L vs. < 4.5 L | 0.81 (0.33, 1.68) | 0.58 | ||
| Bathing and washing water usage | OR | ≥25 L vs. <20 L | 1.70 (0.49, 7.83) | 0.42 | |||
| Srestha 2013 [38] | Nepal; all residents of rapidly urbanized HH | HH member experienced diarrhea in past month | Water consumption | OR | <20 lpcd | 2.53 (1.10, 6.33) | not given |
| 20–49 lpcd | 1.56 (0.63, 3.85) | ||||||
| 50–99 lpcd | 2.92 (1.17, 7.29 | ||||||
| >100 lpcd | (ref) | ||||||
| Teklemarium 2000 [39] | Ethiopia; rural children, <5 years | Child experienced diarrhea in past 2 weeks | Water consumption | OR | Diarrhea vs. no diarrhea | 6.22 lpcd vs. 6.54 lpcd | >0.05 |
| Tumwine 2002 [40] | Uganda, Tanzania, Kenya; rural and urban residents | HH member experienced diarrhea in past 7 days | Water usage | OR | Incremental increase of 1 lpcd | 0.96 (0.93, 0.98) | 0.001 |
| Study | Setting and Participants | Growth Indicator | Water Quantity Measure(s) | Measure of Effect | Comparison Groups * | Values * | p Value |
|---|---|---|---|---|---|---|---|
| Esrey 1992 [27] | Lesotho; rural infants, 0–12 months | Weight gain (among families with a latrine) | Water usage | Difference | Increased usage vs. no increased usage | 1.03 kg (0.42, 1.64) | <0.05 |
| Weight gain (among families without a latrine) | Difference | Increased usage vs. no increased usage | 0.11 kg (−0.18, 0.39) | >0.05 | |||
| Length gain (among families with a latrine) | Difference | Increased usage vs. no increased usage | 2.03 cm (0.53, 3.53) | <0.05 | |||
| Length gain (among families without a latrine) | Difference | Increased usage vs. no increased usage | −0.31 cm (−1.01, 0.39) | >0.05 | |||
| Hebert 1985 [28] | India; rural children, 0–6 years | Weight-for-height | Washing water usage | Regression coefficient | 0–18 months | 0.60 | 0.50 |
| 19–36 months | 0.24 | 0.65 | |||||
| 36–72 months | 0.25 | 0.37 | |||||
| Cooking water usage | Regression coefficient | 0–18 months | 0.15 | 0.30 | |||
| 19–36 months | 0.07 | 0.32 | |||||
| 36–72 months | 0.12 | 0.004 | |||||
| Weight-for-age | Washing water usage | Regression coefficient | 0–18 months | 1.04 | 0.26 | ||
| 19–36 months | 0.26 | 0.70 | |||||
| 36–72 months | 1.37 | 0.0003 | |||||
| Cooking water usage | Regression coefficient | 0–18 months | 0.17 | 0.26 | |||
| 19–36 months | 0.09 | 0.29 | |||||
| 36–72 months | 0.20 | 0.0003 | |||||
| Height-for-age | Washing water usage | Regression coefficient | 0–18 months | 0.36 | 0.41 | ||
| 19–36 months | 0.08 | 0.83 | |||||
| 36–72 months | 0.86 | 0.0003 | |||||
| Cooking water usage | Regression coefficient | 0–18 months | 0.005 | 0.95 | |||
| 19–36 months | 0.04 | 0.35 | |||||
| 36–72 months | 0.02 | 0.54 | |||||
| Zhang 2013 [43] | China; urban and rural primary and secondary students, 8–17 years | BMI | Water consumption | Comparison | Obese | 8.94 L | <0.001 |
| Overweight | 8.30 L | ||||||
| Normal | 7.26 L | ||||||
| Underweight | 6.81 L | ||||||
| Fluids consumption | Comparison | Obese | 12.70 L | <0.001 | |||
| Overweight | 12.02 L | ||||||
| Normal | 10.67 L | ||||||
| Underweight | 10.10 L | ||||||
| Beverage consumption | Comparison | Obese | 3.76 L | <0.001 | |||
| Overweight | 3.71 L | ||||||
| Normal | 3.41 L | ||||||
| Underweight | 3.29 L |
| Study | Setting and Participants | Non-Communicable Disease | Water Quantity Measure(s) | Measure of Effect | Comparison Groups * | Values * | p Value |
|---|---|---|---|---|---|---|---|
| Hu 2009 [29] | Canada; all residents | Renal cell carcinoma | Fluid consumption | OR | incremental increase of 0.3 L | 1.04 (1.02–1.07) | 0.0002 |
| Bottled water consumption | OR | none | (ref) | ||||
| 0–8 oz | 0.95 (0.76, 1.18) | 0.59 | |||||
| >8 oz | 0.95 (0.74, 1.22) | ||||||
| Tap water consumption | OR | <0.64 oz | (ref) | 0.24 | |||
| 0.64–20 oz | 1.01 (0.85-1.19) | ||||||
| 20–36 oz | 1.10 (0.89, 1.37) | ||||||
| >36 oz | 1.13 (0.88, 1.43) | ||||||
| Pan 2012 [36] | United States; female nurses aged 25–42 | Type II diabetes | Water consumption | RR | <1 c | 0.93 (0.83, 1.05 | 0.15 |
| 1 c | 0.93 (0.83, 1.05) | ||||||
| 2–3 c | 1.09 (0.96, 1.24) | ||||||
| 4–5 c | 1.06 (0.91, 1.23) | ||||||
| Vena 1993 [41] | United States; white male urban and rural residents, aged 35–90 | Bladder cancer (among age <65) | Fluid consumption | OR | 2–7 c | (ref) | <0.001 |
| 8–10 c | 2.60 (1.18, 5.73) | ||||||
| 11–13 c | 3.68 (1.65, 8.20) | ||||||
| 14–49 c | 6.30 (2.82, 14.08) | ||||||
| Tap water consumption | OR | 0–5 c | (ref) | <0.001 | |||
| 6–7 c | 1.32 (0.72–2.42) | ||||||
| 8–9 c | 1.63 (0.90, 2.95) | ||||||
| 10–39 c | 2.62 (1.53, 4.47) | ||||||
| Bladder cancer (among age >65) | Fluid consumption | OR | 2–7 c | (ref) | <0.001 | ||
| 8–10 c | 1.77 (1.08, 2.92) | ||||||
| 11–13 c | 1.80 (1.02, 3.19) | ||||||
| 14–49 c | 3.38 (1.83, 6.24) | ||||||
| Tap water consumption | OR | 0–5 c | (ref) | <0.001 | |||
| 6–7 c | 1.28 (0.77, 2.14) | ||||||
| 8–9 c | 1.41 (0.81, 2.46) | ||||||
| 10–39 c | 2.98 (1.77, 5.03) | ||||||
| Bladder cancer (among never smokers) | Tap water consumption | OR | 0–5 c | (ref) | not given | ||
| 6–7 c | 4.17 (1.09, 15.96) | ||||||
| 8–9 c | 5.70 (1.46, 22.26) | ||||||
| 10–39 c | 25.51 (6.12, 106.29) | ||||||
| Bladder cancer (among ex-smokers) | Tap water consumption | OR | 0–5 c | (ref) | not given | ||
| 6–7 c | 0.82 (0.48, 1.41) | ||||||
| 8–9 c | 1.07 (0.61, 1.90) | ||||||
| 10–39 c | 1.61 (0.93, 2.78) | ||||||
| Bladder cancer (among current smokers, 1–28 pack years) | Tap water consumption | OR | 0–5 c | (ref) | not given | ||
| 6–7 c | 2.58 (0.49, 13.66) | ||||||
| 8–9 c | 2.70 (0.45, 16.13) | ||||||
| 10–39 c | 3.79 (0.77, 18.68) | ||||||
| Bladder cancer (among current smokers, >29 pack years) | Tap water consumption | OR | 0–5 c | (ref) | not given | ||
| 6–7 c | 1.87 (0.83, 4.22) | ||||||
| 8–9 c | 1.98 (0.89, 4.42) | ||||||
| 10–39 c | 3.56 (1.73, 7.31) |
| Study | Setting and Participants | Mortality Measure | Water Quantity Measure(s) | Measure of Effect | Comparison groups * | Values * | p Value |
|---|---|---|---|---|---|---|---|
| Aggarwal 2012 [23] | United States; urban and rural residents, >45 years | All-cause mortality | Water consumption | OR | none | 1.93 (0.80, 4.63) | 0.14 |
| 0–2 c | 1.44 (0.83, 2.50) | 0.20 | |||||
| 2–4 c | 0.75 (0.44, 1.28) | 0.29 | |||||
| 4–6 c | 1.27 (0.74, 2.17) | 0.38 | |||||
| 6–8 c | (ref) | ||||||
| >8 c | 1.22 (0.72, 2.07) | 0.46 | |||||
| Ischemia-related mortality | Water consumption | OR | none | 2.79 (0.80, 9.80) | 0.11 | ||
| 0–2 c | 1.81 (0.92, 3.52) | 0.08 | |||||
| 2–4 c | 1.41 (0.76, 2.63) | 0.27 | |||||
| 4–6 c | 1.74 (0.89, 3.39) | 0.10 | |||||
| 6–8 c | (ref) | ||||||
| >8 c | 1.01 (0.52, 1.95) | 0.98 | |||||
| Congestive heart failure-related mortality | Water consumption | OR | none | not given | |||
| 0–2 c | 1.93 (0.22, 16.95) | 0.55 | |||||
| 2–4 c | 1.12 (0.16, 7.69) | 0.91 | |||||
| 4–6 c | 0.96 (0.16, 5.85) | 0.96 | |||||
| 6–8 c | (ref) | ||||||
| >8 c | 0.33 (0.05, 2.42) | 0.27 | |||||
| Stroke-related mortality | Water consumption | OR | none | 0.72 (0.14, 3.77) | 0.69 | ||
| 0–2 c | 1.21 (0.33, 4.35) | 0.77 | |||||
| 2–4 c | 0.75 (0.24, 2.31) | 0.61 | |||||
| 4–6 c | 0.69 (0.22, 2.12) | 0.52 | |||||
| 6–8 c | (ref) | ||||||
| >8 c | 1.76 (0.42, 7.32) | 0.44 | |||||
| Palmer 2012 [35] | Australia; urban residents | All-cause mortality | Water consumption | Hazard ratio (HR) | Incremental increase of 0.1 L | 1.01 (0.99, 1.02) | >0.05 |
| Cardiovascular mortality | Water consumption | HR | Incremental increase of 0.1 L | 1.05 (0.89, 1.12) | >0.05 |
3.3.4. Non-Communicable Diseases
3.3.5. Mortality
4. Discussion
4.1. Low- and Middle-Income Countries
4.2. High-Income Countries
4.3. Limitations and Further Research
5. Conclusions
Supplementary Files
Supplementary File 1Acknowledgments
Author Contributions
Conflicts of Interest
References
- World Health Organization (WHO); United Nations Children’s Fund (UNICEF). Progress on Drinking Water and Sanitation: 2014 Update; WHO/UNICEF: Geneva, Switzerland/New York, NY, USA, 2014. [Google Scholar]
- Fewtrell, L.; Colford, J.M. Water, sanitation and hygiene in developing countries: Interventions and diarrhoea—A review. Water Sci. Technol. 2005, 52, 133–142. [Google Scholar] [PubMed]
- Clasen, T.F.; Roberts, I.G.; Rabie, T.; Schmidt, W.-P.; Cairncross, S. Interventions to improve water quality for preventing diarrhoea. Cochrane Database Syst. Rev. 2006, 3. [Google Scholar] [CrossRef]
- Arnold, B.F.; Colford, J.M., Jr. Treating water with chlorine at point-of-use to improve water quality and reduce child diarrhea in developing countries: A systematic review and meta-analysis. Am. J. Trop. Med. Hyg. 2007, 76, 354–364. [Google Scholar] [PubMed]
- Snilstveit, B.; Waddington, H. Effectiveness and sustainability of water, sanitation, and hygiene interventions in combating diarrhea. J. Dev. Eff. 2009, 1, 295–335. [Google Scholar]
- Cairncross, S.; Hunt, C.; Boisson, S.; Bostoen, K.; Curtis, V.; Fung, I.C.; Schmidt, W.P. Water, sanitation and hygiene for the prevention of diarrhoea. Int. J. Epidemiol. 2010, 39, 193–205. [Google Scholar] [CrossRef] [PubMed]
- Engell, R.E.; Lim, S.S. Does clean water matter? An updated meta-analysis of water supply and sanitation interventions and diarrhoeal diseases. Lancet 2013, 381. [Google Scholar] [CrossRef]
- Wolf, J.; Prüss-Ustün, A.; Cumming, O.; Bartram, J.; Bonjour, S.; Cairncross, S.; Clasen, T.; Colford, J.M., Jr.; Curtis, V.; de France, J.; et al. Assessing the impact of drinking water and sanitation on diarrhoeal disease in low- and middle-income settings: Systematic review and meta-regression. Trop. Med. Int. Health 2014, 19, 928–942. [Google Scholar] [CrossRef] [PubMed]
- Dangour, A.D.; Watson, L.; Cumming, O.; Boisson, S.; Che, Y.; Velleman, Y.; Cavill, S.; Allen, E.; Uauy, R. Interventions to improve water quality and supply, sanitation and hygiene practices, and their effects on the nutritional status of children. Cochrane Database Syst. Rev. 2013, 11. [Google Scholar] [CrossRef]
- Strunz, E.C.; Addiss, D.G.; Stocks, M.E.; Ogden, S.; Utzinger, J.; Freeman, M.C. Water, sanitation, hygiene, and soil-transmitted helminth infection: A systematic review and meta-analysis. PLoS Med. 2014, 11. [Google Scholar] [CrossRef] [PubMed]
- Travers, A.; Strasser, S.; Palmer, S.L.; Stauber, C. The added value of water, sanitation, and hygiene interventions to mass drug administration for reducing the prevalence of trachoma: A systematic review examining. J. Environ. Public Health 2013. [Google Scholar] [CrossRef] [PubMed]
- Stocks, M.E.; Ogden, S.; Haddad, D.; Addiss, D.B.; McGuire, C.; Freeman, M.C. Effect of water, sanitation, and hygiene on the prevention of trachoma: A systematic review and meta-analysis. PLoS Med. 2014, 11. [Google Scholar] [CrossRef] [PubMed]
- Esrey, S.A.; Feachem, R.G.; Hughes, J.M. Interventions for the control of diarrhoeal diseases among young children: Improving water supplies and excreta disposal facilities. Bull. WHO 1985, 63, 757–772. [Google Scholar] [PubMed]
- Esrey, S.A.; Potash, J.B.; Roberts, L.; Shiff, C. Effects of improved water supply and sanitation on ascariasis, diarrhoea, dracunculiasis, hookworm infection, schistosomiasis, and trachoma. Bull. WHO 1991, 69, 609–621. [Google Scholar] [PubMed]
- Cairncross, S.; Feachem, R. Environmental Health Engineering in the Tropics: An. Introductory Text, 2nd ed.; John Wiley & Sons: Chichester, UK, 1993. [Google Scholar]
- Sphere Project. Humanitarian Charter and Minimum Standards in Disaster Response; The Sphere Project: Geneva, Switzerland, 2004. [Google Scholar]
- WELL. Guidance Manual on Water Supply and Sanitation Programmes; WEDC: Loughborough, UK, 1998. [Google Scholar]
- Carter, R.C.; Tyrrel, S.F.; Howsam, P. The impact and sustainability of water and sanitation programmes in developing countries. J. Chart Inst. Water Environ. Manag. 1997, 13, 292–296. [Google Scholar] [CrossRef]
- Gleick, P.H. Basic water requirements for human activities: Meeting basic needs. Water Int. 1996, 21, 83–92. [Google Scholar] [CrossRef]
- WHO. Guidelines for Drinking-Water Quality, 4th ed.; WHO: Geneva, Switzerland, 2011. [Google Scholar]
- Howard, G.; Bartram, J. Domestic Water Quantity, Service Level and Health; WHO: Geneva, Switzerland, 2003. [Google Scholar]
- World Bank. Country and Lending Groups. Available online: http://data.worldbank.org/about/country-and-lending-groups (accessed on 22 May 2015).
- Aggarwal, S.; Loomba, R.; Arora, R. Water consumption does not influence all cause or cardiovascular mortality: A followup study of patients in the national health and nutrition examination survey. Circulation 2012, 126, A18070. [Google Scholar]
- Bailey, R.; Downes, B.; Downes, R.; Mabey, D. Trachoma and water use: A case control study in a Gambian village. Trans. R. Soc. Trop. Med. Hyg. 1991, 85, 824–828. [Google Scholar] [CrossRef]
- Cairncross, S.; Cliff, J.L. Water use and health in Mueda, Mozambique. Trans. R. Soc. Trop. Med. Hyg. 1987, 81, 51–54. [Google Scholar] [CrossRef]
- Esrey, S.A.; Collett, J.; Miliotis, M.D.; Koornhof, H.J.; Makhale, P. The risk of infection from Giardia lamblia due to drinking water supply, use of water, and latrines among preschool children in rural Lesotho. Int. J. Epidemiol. 1989, 18, 248–253. [Google Scholar] [CrossRef] [PubMed]
- Esrey, S.A.; Habicht, J.P.; Casella, G. The complementary effect of latrines and increased water usage on the growth of infants in rural Lesotho. Am. J. Epidemiol. 1992, 135, 659–666. [Google Scholar] [PubMed]
- Hebert, J.R. Effects of water quality and water quantity on nutritional status: Findings from a south Indian community. Bull. WHO 1985, 63, 145–155. [Google Scholar] [PubMed]
- Hu, J.F.; Mao, Y.; DesMeules, M.; Csizmadi, I.; Friedenreich, C.; Mery, L. Total fluid and specific beverage intake and risk of renal cell carcinoma in Canada. Cancer Epidemiol. 2009, 33, 355–362. [Google Scholar] [CrossRef] [PubMed]
- Jones, A.Q.; Majowicz, S.E.; Edge, V.L.; Thomas, M.K.; MacDougall, L.; Fyfe, M.; Atashband, S.; Kovacs, S.J. Drinking water consumption patterns in British Columbia: An investigation of associations with demographic factors and acute gastrointestinal illness. Sci. Total Environ. 2007, 388, 54–65. [Google Scholar] [CrossRef] [PubMed]
- Khan, M.U. Interruption of Shigellosis by hand washing. Trans. R. Soc. Trop. Med. Hyg. 1982, 76, 164–168. [Google Scholar] [CrossRef]
- Kupka, K.; Nizetic, B.; Reinhards, J. Sampling studies on the epidemiology and control of trachoma in southern Morocco. Bull. WHO 1968, 39, 547–566. [Google Scholar] [PubMed]
- Mahande, M.J.; Mazigo, H.D.; Kweka, E.J. Association between water related factors and active trachoma in Hai district, Northern Tanzania. Infect. Dis. Poverty 2012, 1. [Google Scholar] [CrossRef] [PubMed]
- Moalic, E.; Dueymes, J.M.; Baron, R.; Le Flohic, A.M. Cross-sectional survey of trachoma in school age children in the region of Thies (Senegal). Pediatr. Inf. Dis. J. 2000, 19, 979–983. [Google Scholar] [CrossRef]
- Palmer, S.; Germaine, W.; Iff, S.; Craig, J.; Mitchell, P.; Wang, J.J.; Strippoli, G. Daily water intake and risk of mortality: Longitudinal cohort study. Nephrol. Dial. Transplant. 2012, 27. [Google Scholar] [CrossRef]
- Pan, A.; Malik, V.S.; Schulze, M.B.; Manson, J.E.; Willett, W.C.; Hu, F.B. Plain-water intake and risk of type 2 diabetes in young and middle-aged women. Am. J. Clin. Nutr. 2012, 95, 1454–1460. [Google Scholar] [CrossRef] [PubMed]
- Polack, S.; Kuper, H.; Solomon, A.W.; Massae, P.A.; Abuelo, C.; Cameron, E.; Valdmanis, V.; Mahende, M.; Foster, A.; Mabey, D. The relationship between prevalence of active trachoma, water availability and its use in a Tanzanian village. Trans. R. Soc. Trop. Med. Hyg. 2006, 100, 1075–1083. [Google Scholar] [CrossRef] [PubMed]
- Shrestha, S.; Aihara, Y.; Yoden, K.; Yamagata, Z.; Nishida, K.; Kondo, N. Access to improved water and its relationship with diarrhoea in Kathmandu Valley, Nepal: A cross-sectional study. BMJ Open 2013, 3. [Google Scholar] [CrossRef] [PubMed]
- Teklemariam, S.; Getaneh, T.; Bekele, F. Environmental determinants of diarrheal morbidity in under-five children, Keffa-Sheka zone, south west Ethiopia. Ethiop. Med. J. 2000, 38, 27–34. [Google Scholar] [PubMed]
- Tumwine, J.K.; Thompson, J.; Katua-Katua, M.; Mujwajuzi, M.; Johnstone, N.; Wood, E.; Porras, I. Diarrhoea and effects of different water sources, sanitation and hygiene behaviour in East Africa. Trop. Med. Int. Health 2002, 7, 750–756. [Google Scholar] [CrossRef]
- Vena, J.E.; Graham, S.; Freudenheim, J.; Marshall, J.; Zielezny, M.; Swanson, M.; Sufrin, G. Drinking-water, fluid intake, and bladder cancer in western New York. Arch. Environ. Health 1993, 48, 191–198. [Google Scholar] [CrossRef] [PubMed]
- West, S.; Lynch, M.; Turner, V.; Munoz, B.; Rapoza, P.; Mmbaga, B.B.O.; Taylor, H.R. Water availability and trachoma. Bull. WHO 1989, 67, 71–75. [Google Scholar] [PubMed]
- Zhang, Q.; Xiaojun, W.; Hu, X.; Du, S.; Lu, L.; Gao, J.; Zou, S.; Fan, J.; Ma, G. Fluid intake and nutrition status in children and adolescents of developed cities in China. Ann. Nutr. Metable 2013, 63. [Google Scholar]
- WHO/UNICEF. WASH POST-2015: Proposed Targets and Indicators for Drinking-Water, Sanitation and Hygiene. Available online: http://www.wssinfo.org/documents/?tx_displaycontroller[type]=post_2015 (accessed on 22 May 2015).
- Clasen, T.; Fabini, D.; Boisson, S.; Taneja, J.; Song, J.; Aichinger, E.; Bui, A.; Dadashi, S.; Schmidt, W.P.; Burt, Z.; et al. Making sanitation count: Developing and testing a device for assessing latrine use in low-income settings. Environ. Sci. Technol. 2012, 46, 3295–3303. [Google Scholar] [CrossRef] [PubMed]
- Thomas, E.A.; Barstow, C.K.; Rosa, G.; Majorin, F.; Clasen, T. Use of remotely reporting electronic sensors for assessing use of water filters and cookstoves in Rwanda. Environ. Sci. Technol. 2013, 47, 13602–13610. [Google Scholar] [CrossRef] [PubMed]
© 2015 by the authors; licensee MDPI, Basel, Switzerland. This article is an open access article distributed under the terms and conditions of the Creative Commons Attribution license (http://creativecommons.org/licenses/by/4.0/).
Share and Cite
Stelmach, R.D.; Clasen, T. Household Water Quantity and Health: A Systematic Review. Int. J. Environ. Res. Public Health 2015, 12, 5954-5974. https://doi.org/10.3390/ijerph120605954
Stelmach RD, Clasen T. Household Water Quantity and Health: A Systematic Review. International Journal of Environmental Research and Public Health. 2015; 12(6):5954-5974. https://doi.org/10.3390/ijerph120605954
Chicago/Turabian StyleStelmach, Rachel D., and Thomas Clasen. 2015. "Household Water Quantity and Health: A Systematic Review" International Journal of Environmental Research and Public Health 12, no. 6: 5954-5974. https://doi.org/10.3390/ijerph120605954
APA StyleStelmach, R. D., & Clasen, T. (2015). Household Water Quantity and Health: A Systematic Review. International Journal of Environmental Research and Public Health, 12(6), 5954-5974. https://doi.org/10.3390/ijerph120605954