Putting Co-Exposures on Equal Footing: An Ecological Analysis of Same-Scale Measures of Air Pollution and Social Factors on Cardiovascular Disease in New York City

 , , ,
, , , 
Abstract
:1. Introduction
2. Materials and Methods
2.1. Design and Data
2.2. Air Pollution
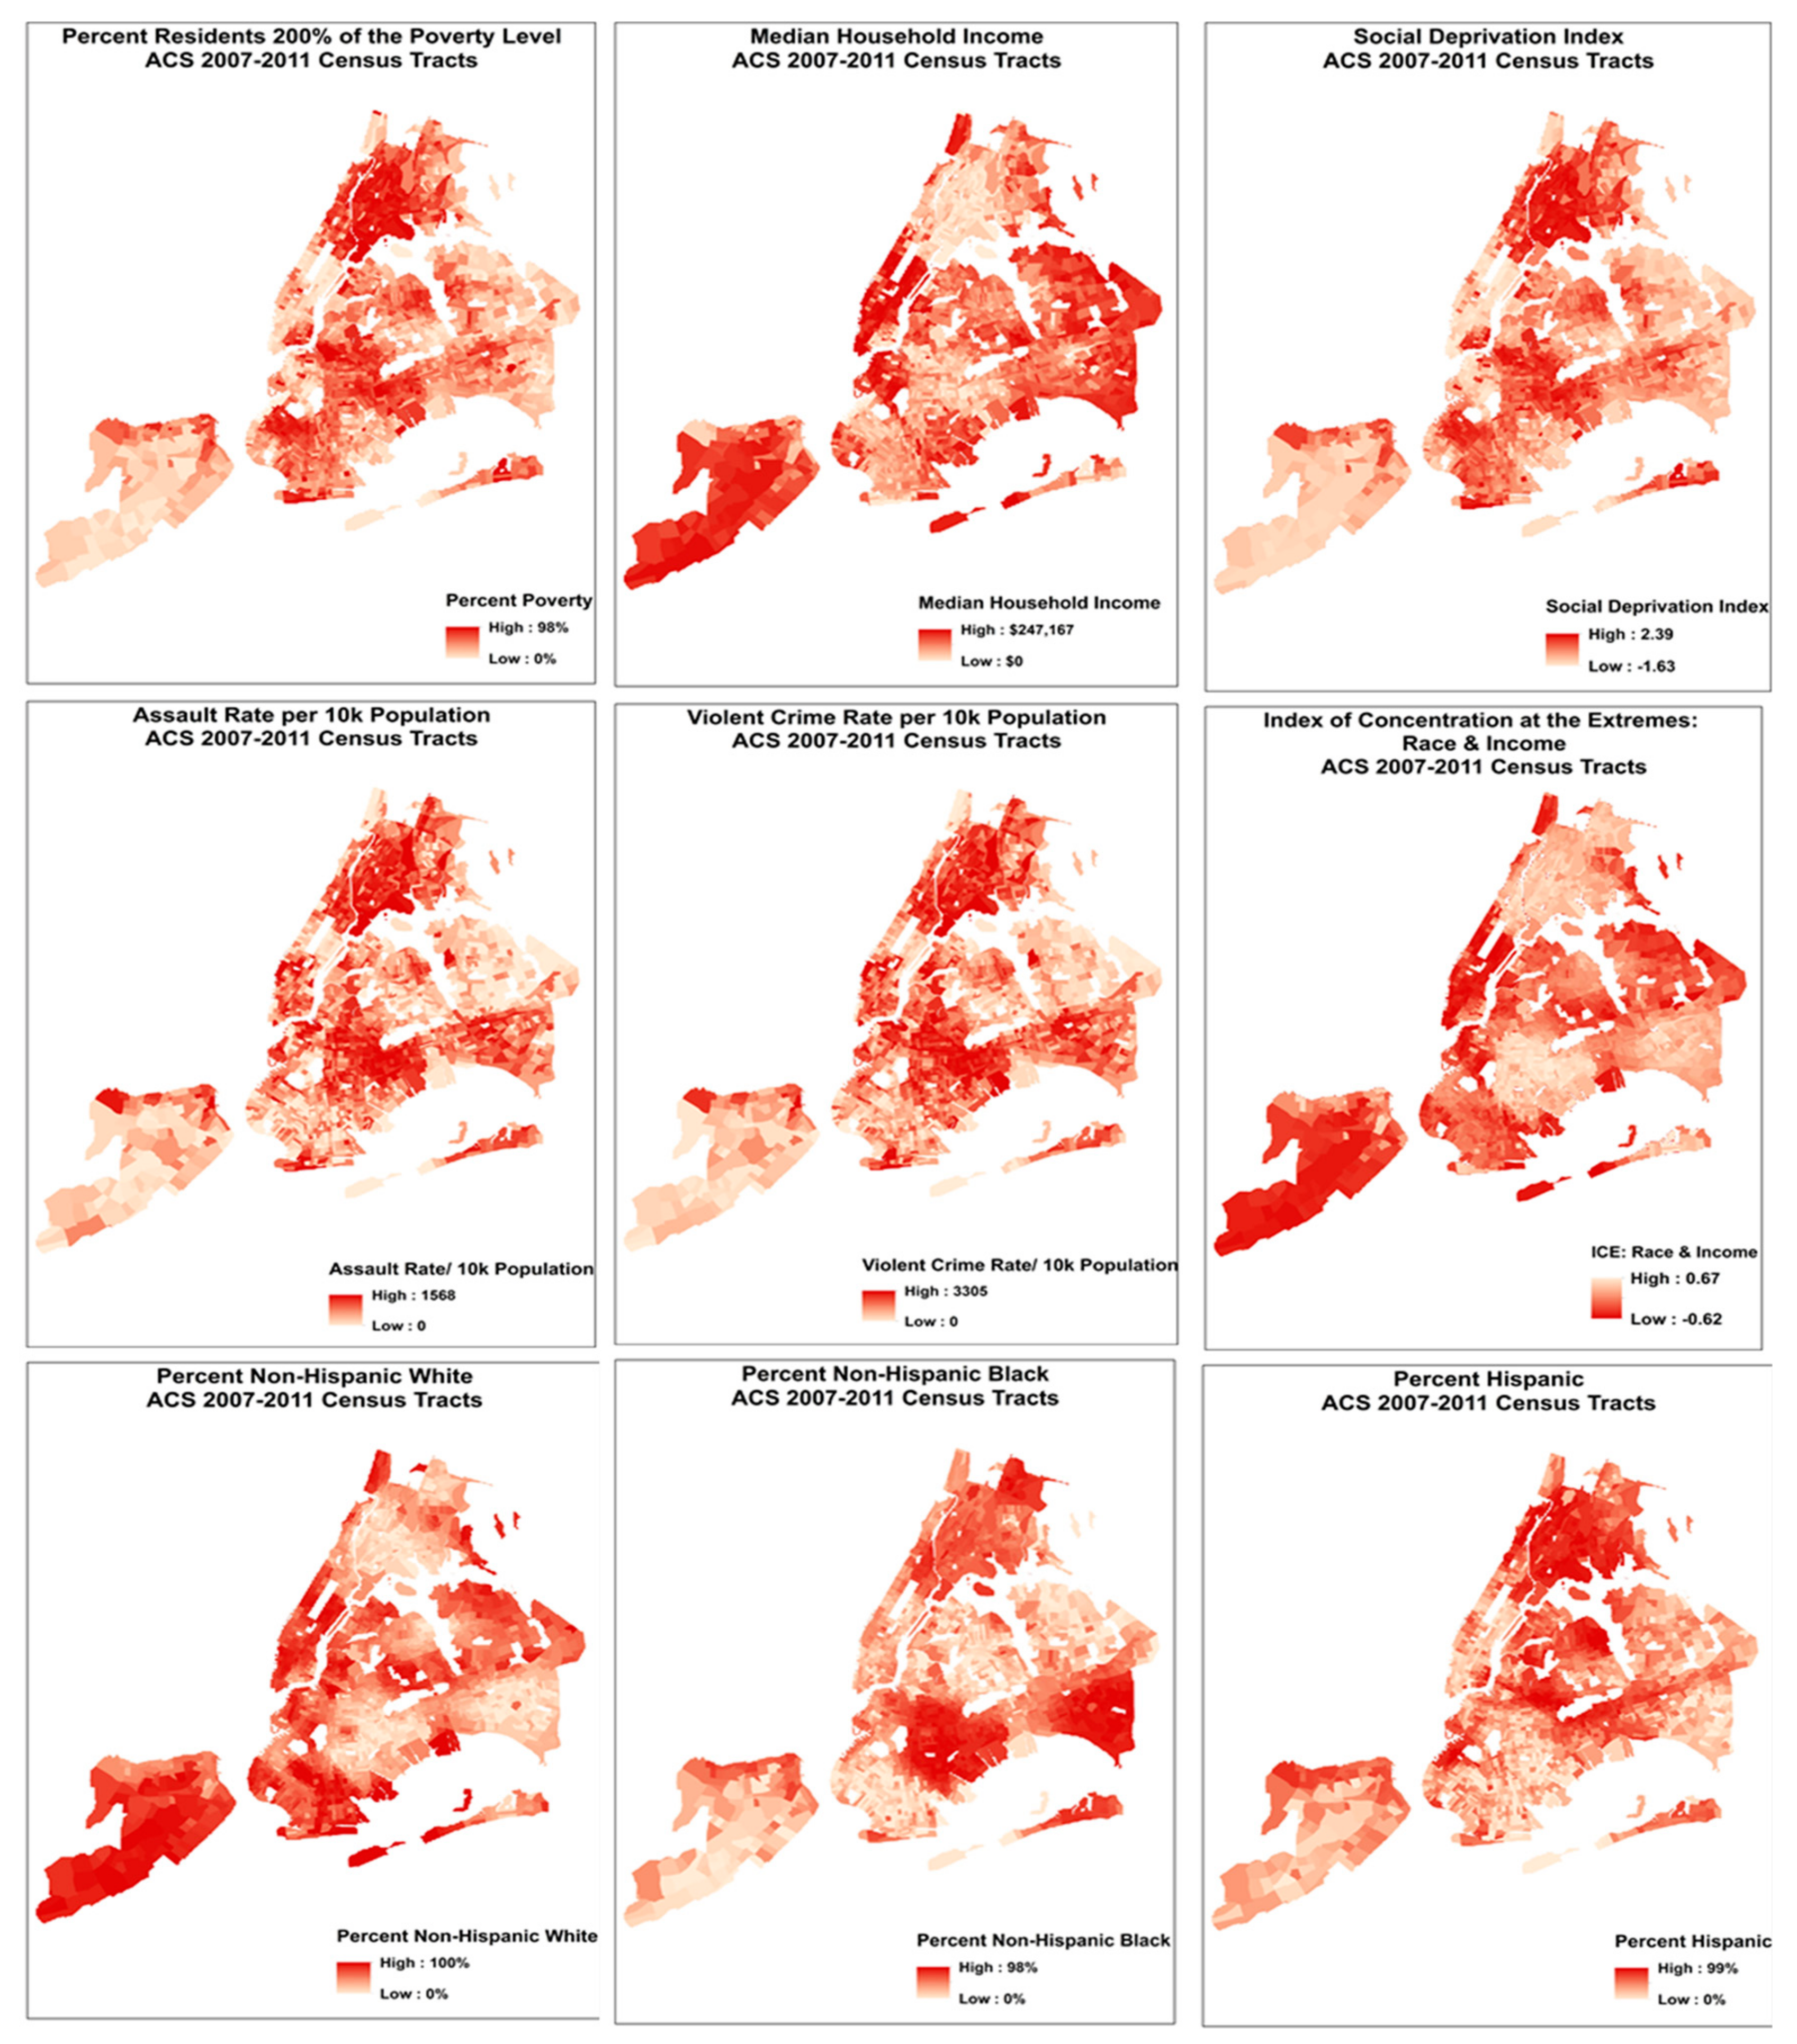
2.3. Social Factors at the Census Tract Level
2.3.1. Felony Assault and Violent Crime Rates
2.3.2. Sociodemographic Data
2.4. Statistical Analysis
3. Results
3.1. Descriptive Statistics
3.2. Unadjusted Models
3.3. Mutually-adjusted Models
3.4. Fully-adjusted Models
3.5. Sensitivity Analyses
4. Discussion
4.1. Strengths
4.2. Limitations
5. Conclusions
Supplementary Materials
Author Contributions
Funding
Conflicts of Interest
References
- Schraufnagel, D.E.; Balmes, J.R.; Cowl, C.T.; De Matteis, S.; Jung, S.-H.; Mortimer, K.; Perez-Padilla, R.; Rice, M.B.; Riojas-Rodriguez, H.; Sood, A.; et al. Air Pollution and Noncommunicable Diseases: A Review by the Forum of International Respiratory Societies’ Environmental Committee, Part 2: Air Pollution and Organ Systems. Chest 2019, 155, 417–426. [Google Scholar] [CrossRef] [PubMed]
- Miranda, M.L.; Edwards, S.E.; Keating, M.H.; Paul, C.J. Making the environmental justice grade: The relative burden of air pollution exposure in the United States. Int. J. Environ. Res. Public Health 2011, 8, 1755–1771. [Google Scholar] [CrossRef] [PubMed]
- O’Neill, M.S.; Jerrett, M.; Kawachi, I.; Levy, J.I.; Cohen, A.J.; Gouveia, N.; Wilkinson, P.; Fletcher, T.; Cifuentes, L.; Schwartz, J. Health, wealth, and air pollution: Advancing theory and methods. Environ. Health Perspect. 2003, 111, 1861–1870. [Google Scholar] [CrossRef] [PubMed]
- Jones, M.R.; Diez-Roux, A.V.; Hajat, A.; Kershaw, K.N.; O’Neill, M.S.; Guallar, E.; Post, W.S.; Kaufman, J.D.; Navas-Acien, A. Race/Ethnicity, Residential Segregation, and Exposure to Ambient Air Pollution: The Multi-Ethnic Study of Atherosclerosis (MESA). Am. J. Public Health 2014, 104, 2130–2137. [Google Scholar] [CrossRef] [PubMed]
- VanderWeele, T.J.; Hernán, M.A. Results on differential and dependent measurement error of the exposure and the outcome using signed directed acyclic graphs. Am. J. Epidemiol. 2012, 175, 1303–1310. [Google Scholar] [CrossRef] [PubMed]
- Zeger, S.L.; Thomas, D.; Dominici, F.; Samet, J.M.; Schwartz, J.; Dockery, D.; Cohen, A. Exposure measurement error in time-series studies of air pollution: Concepts and consequences. Environ. Health. Perspect. 2000, 108, 419–426. [Google Scholar] [CrossRef] [PubMed]
- Brokamp, C.; Brandt, E.B.; Ryan, P.H. Assessing Exposure to Outdoor Air Pollution for Epidemiological Studies: Model-based and Personal Sampling Strategies. J. Allergy Clin. Immunol. 2019, 143, 2002–2006. [Google Scholar] [CrossRef]
- Clougherty, J.E.; Kubzansky, L.D. A framework for examining social stress and susceptibility to air pollution in respiratory health. Environ. Health Perspect. 2009, 117, 1351–1358. [Google Scholar] [CrossRef]
- Clougherty, J.E.; Shmool, J.L.C.; Kubzansky, L.D. The Role of Non-Chemical Stressors in Mediating Socioeconomic Susceptibility to Environmental Chemicals. Curr. Environ. Health Rep. 2014, 1, 302–313. [Google Scholar] [CrossRef]
- Fuller, C.H.; Feeser, K.R.; Sarnat, J.A.; O’Neill, M.S. Air pollution, cardiovascular endpoints and susceptibility by stress and material resources: A systematic review of the evidence. Environ. Health 2017, 16, 58. [Google Scholar] [CrossRef]
- O’Lenick, C.R.; Winquist, A.; Mulholland, J.A.; Friberg, M.D.; Chang, H.H.; Kramer, M.R.; Darrow, L.A.; Sarnat, S.E. Assessment of neighbourhood-level socioeconomic status as a modifier of air pollution-asthma associations among children in Atlanta. J. Epidemiol. Community Health 2017, 71, 129–136. [Google Scholar] [CrossRef] [PubMed]
- Reid, C.E.; Jerrett, M.; Tager, I.B.; Petersen, M.L.; Mann, J.K.; Balmes, J.R. Differential respiratory health effects from the 2008 northern California wildfires: A spatiotemporal approach. Environ. Res. 2016, 150, 227–235. [Google Scholar] [CrossRef] [PubMed]
- Wong, C.-M.; Ou, C.-Q.; Chan, K.-P.; Chau, Y.-K.; Thach, T.-Q.; Yang, L.; Chung, R.Y.-N.; Thomas, G.N.; Peiris, J.S.M.; Wong, T.-W.; et al. The effects of air pollution on mortality in socially deprived urban areas in Hong Kong, China. Environ. Health Perspect. 2008, 116, 1189–1194. [Google Scholar] [CrossRef] [PubMed]
- Brewer, M.; Kimbro, R.T.; Denney, J.T.; Osiecki, K.M.; Moffett, B.; Lopez, K. Does neighborhood social and environmental context impact race/ethnic disparities in childhood asthma? Health Place 2017, 44, 86–93. [Google Scholar] [CrossRef] [PubMed]
- Hicken, M.T.; Adar, S.D.; Hajat, A.; Kershaw, K.N.; Do, D.P.; Barr, R.G.; Kaufman, J.D.; Diez Roux, A.V. Air Pollution, Cardiovascular Outcomes, and Social Disadvantage: The Multi-ethnic Study of Atherosclerosis. Epidemiology 2016, 27, 42–50. [Google Scholar] [CrossRef]
- Ross, Z.; Ito, K.; Johnson, S.; Yee, M.; Pezeshki, G.; Clougherty, J.E.; Savitz, D.; Matte, T. Spatial and temporal estimation of air pollutants in New York City: Exposure assignment for use in a birth outcomes study. Environ. Health Glob. Access Sci. Source 2013, 12, 51. [Google Scholar] [CrossRef]
- Ryan, P.H.; LeMasters, G.K. A review of land-use regression models for characterizing intraurban air pollution exposure. Inhal. Toxicol. 2007, 19 (Suppl. 1), 127–133. [Google Scholar] [CrossRef]
- Eeftens, M.; Beelen, R.; de Hoogh, K.; Bellander, T.; Cesaroni, G.; Cirach, M.; Declercq, C.; Dedele, A.; Dons, E.; de Nazelle, A.; et al. Development of land use regression models for PM2.5, PM2.5 absorbance, PM10 and PMcoarse in 20 European study areas; results of the ESCAPE project. Environ. Sci. Technol. 2012, 46, 11195–11205. [Google Scholar] [CrossRef]
- Ramos, Y.; St-Onge, B.; Blanchet, J.-P.; Smargiassi, A. Spatio-temporal models to estimate daily concentrations of fine particulate matter in Montreal: Kriging with external drift and inverse distance-weighted approaches. J. Expo. Sci. Environ. Epidemiol. 2016, 26, 405–414. [Google Scholar] [CrossRef]
- Lee, S.J.; Serre, M.; van Donkelaar, A.; Martin, R.V.; Burnett, R.T.; Jerrett, M. Comparison of Geostatistical Interpolation and Remote Sensing Techniques for Estimating Long-Term Exposure to Ambient PM2.5 Concentrations across the Continental United States. Environ. Health Perspect. 2012, 120, 1727–1732. [Google Scholar] [CrossRef]
- Kaufman, J.D.; Spalt, E.W.; Curl, C.L.; Hajat, A.; Jones, M.R.; Kim, S.-Y.; Vedal, S.; Szpiro, A.A.; Gassett, A.; Sheppard, L.; et al. Advances in Understanding Air Pollution and CVD. Glob. Heart 2016, 11, 343–352. [Google Scholar] [CrossRef] [PubMed]
- Diez Roux, A.V.; Mujahid, M.S.; Hirsch, J.A.; Moore, K.; Moore, L.V. The Impact of Neighborhoods on CV Risk. Glob. Heart 2016, 11, 353–363. [Google Scholar] [CrossRef] [PubMed]
- Giordano, G.N.; Lindstrom, M. The impact of changes in different aspects of social capital and material conditions on self-rated health over time: A longitudinal cohort study. Soc. Sci. Med. 2010, 70, 700–710. [Google Scholar] [CrossRef] [PubMed]
- Kwan, M.-P. The Uncertain Geographic Context Problem. Ann. Assoc. Am. Geogr. 2012, 102, 958–968. [Google Scholar] [CrossRef]
- Karner, A.A.; Eisinger, D.S.; Niemeier, D.A. Near-Roadway Air Quality: Synthesizing the Findings from Real-World Data. Environ. Sci. Technol. 2010, 44, 5334–5344. [Google Scholar] [CrossRef] [PubMed]
- Monn, C. Exposure assessment of air pollutants: A review on spatial heterogeneity and indoor/outdoor/personal exposure to suspended particulate matter, nitrogen dioxide and ozone. Atmos. Environ. 2001, 35, 1–32. [Google Scholar] [CrossRef]
- Mujahid, M.S.; Diez Roux, A.V.; Morenoff, J.D.; Raghunathan, T. Assessing the Measurement Properties of Neighborhood Scales: From Psychometrics to Ecometrics. Am. J. Epidemiol. 2007, 165, 858–867. [Google Scholar] [CrossRef]
- Shmool, J.L.C.; Johnson, I.L.; Dodson, Z.M.; Keene, R.; Gradeck, R.; Beach, S.R.; Clougherty, J.E. Developing a GIS-Based Online Survey Instrument to Elicit Perceived Neighborhood Geographies to Address the Uncertain Geographic Context Problem. Prof. Geogr. 2018, 70, 423–433. [Google Scholar] [CrossRef]
- Colabianchi, N.; Coulton, C.J.; Hibbert, J.D.; McClure, S.M.; Ievers-Landis, C.E.; Davis, E.M. Adolescent self-defined neighborhoods and activity spaces: Spatial overlap and relations to physical activity and obesity. Health Place 2014, 27, 22–29. [Google Scholar] [CrossRef]
- Kwan, M.-P. The Limits of the Neighborhood Effect: Contextual Uncertainties in Geographic, Environmental Health, and Social Science Research. Ann. Am. Assoc. Geogr. 2018, 108, 1482–1490. [Google Scholar] [CrossRef]
- Shmool, J.L.; Kinnee, E.; Sheffield, P.E.; Clougherty, J.E. Spatio-temporal ozone variation in a case-crossover analysis of childhood asthma hospital visits in New York City. Environ. Res. 2016, 147, 108–114. [Google Scholar] [CrossRef] [PubMed] [Green Version]
- Matte, T.D.; Ross, Z.; Kheirbek, I.; Eisl, H.; Johnson, S.; Gorczynski, J.E.; Kass, D.; Markowitz, S.; Pezeshki, G.; Clougherty, J.E. Monitoring intraurban spatial patterns of multiple combustion air pollutants in New York City: Design and implementation. J. Expo. Sci. Environ. Epidemiol. 2013, 23, 223–231. [Google Scholar] [CrossRef] [PubMed]
- Clougherty, J.E.; Kheirbek, I.; Eisl, H.M.; Ross, Z.; Pezeshki, G.; Gorczynski, J.E.; Johnson, S.; Markowitz, S.; Kass, D.; Matte, T. Intra-urban spatial variability in wintertime street-level concentrations of multiple combustion-related air pollutants: The New York City Community Air Survey (NYCCAS). J. Expo. Sci. Environ. Epidemiol. 2013, 23, 232–240. [Google Scholar] [CrossRef] [PubMed]
- NYPD Arrests Data (Historic) | NYC Open Data. Available online: https://data.cityofnewyork.us/Public-Safety/NYPD-Arrests-Data-Historic-/8h9b-rp9u (accessed on 1 July 2019).
- U.S. Department of Justice. Federal Bureau of Investigation (FBI) Federal Bureau of Investigation (FBI) Uniform Crime Report Crime in the United States 2010. Available online: https://ucr.fbi.gov/crime-in-the-u.s/2010/crime-in-the-u.s.-2010/aboutcius.pdf (accessed on 16 November 2019).
- U.S. Census Bureau. American Community Survey 2007–2011 5-Year Estimates; U.S. Census Bureau: Phoenix, AZ, USA, 2012.
- Shmool, J.L.C.; Bobb, J.F.; Ito, K.; Elston, B.; Savitz, D.A.; Ross, Z.; Matte, T.D.; Johnson, S.; Dominici, F.; Clougherty, J.E. Area-level socioeconomic deprivation, nitrogen dioxide exposure, and term birth weight in New York City. Environ. Res. 2015, 142, 624–632. [Google Scholar] [CrossRef] [PubMed] [Green Version]
- Krieger, N.; Feldman, J.M.; Waterman, P.D.; Chen, J.T.; Coull, B.A.; Hemenway, D. Local Residential Segregation Matters: Stronger Association of Census Tract Compared to Conventional City-Level Measures with Fatal and Non-Fatal Assaults (Total and Firearm Related), Using the Index of Concentration at the Extremes (ICE) for Racial, Economic, and Racialized Economic Segregation, Massachusetts (US), 1995–2010. J. Urban Health 2017, 94, 244–258. [Google Scholar] [PubMed]
- Massey, D.S.; Brodmann, S. Spheres of Influence: The Social Ecology of Racial and Class Inequality; Russell Sage Foundation: New York, NY, USA, 2014; ISBN 978-1-61044-822-2. [Google Scholar]
- Shmool, J.L.; Kubzansky, L.D.; Newman, O.D.; Spengler, J.; Shepard, P.; Clougherty, J.E. Social stressors and air pollution across New York City communities: A spatial approach for assessing correlations among multiple exposures. Environ. Health A Glob. Access Sci. Source 2014, 13, 91. [Google Scholar] [CrossRef] [PubMed] [Green Version]
- Parenteau, M.P.; Sawada, M.C. The modifiable areal unit problem (MAUP) in the relationship between exposure to NO2 and respiratory health. Int. J. Health Geogr. 2011, 10, 58. [Google Scholar] [CrossRef] [Green Version]
- Chi, G.C.; Hajat, A.; Bird, C.E.; Cullen, M.R.; Griffin, B.A.; Miller, K.A.; Shih, R.A.; Stefanick, M.L.; Vedal, S.; Whitsel, E.A.; et al. Individual and Neighborhood Socioeconomic Status and the Association between Air Pollution and Cardiovascular Disease. Environ. Health Perspect. 2016, 124, 1840–1847. [Google Scholar] [CrossRef]
- Hazlehurst, M.F.; Nurius, P.S.; Hajat, A. Individual and Neighborhood Stressors, Air Pollution and Cardiovascular Disease. Int. J. Environ. Res. Public Health 2018, 15, 472. [Google Scholar] [CrossRef] [Green Version]
- Zock, J.-P.; Verheij, R.; Helbich, M.; Volker, B.; Spreeuwenberg, P.; Strak, M.; Janssen, N.A.H.; Dijst, M.; Groenewegen, P. The impact of social capital, land use, air pollution and noise on individual morbidity in Dutch neighbourhoods. Environ. Int. 2018, 121, 453–460. [Google Scholar] [CrossRef]
- Servadio, J.L.; Lawal, A.S.; Davis, T.; Bates, J.; Russell, A.G.; Ramaswami, A.; Convertino, M.; Botchwey, N. Demographic Inequities in Health Outcomes and Air Pollution Exposure in the Atlanta Area and its Relationship to Urban Infrastructure. J. Urban Health 2018, 96, 219–234. [Google Scholar] [CrossRef] [PubMed]
- Pala, D.; Pagán, J.; Parimbelli, E.; Rocca, M.T.; Bellazzi, R.; Casella, V. Spatial Enablement to Support Environmental, Demographic, Socioeconomics, and Health Data Integration and Analysis for Big Cities: A Case Study with Asthma Hospitalizations in New York City. Front. Med. 2019, 6, 84. [Google Scholar] [CrossRef] [PubMed] [Green Version]
- Hvidtfeldt, U.A.; Sørensen, M.; Geels, C.; Ketzel, M.; Khan, J.; Tjønneland, A.; Overvad, K.; Brandt, J.; Raaschou-Nielsen, O. Long-term residential exposure to PM2.5, PM10, black carbon, NO2, and ozone and mortality in a Danish cohort. Environ. Int. 2019, 123, 265–272. [Google Scholar] [CrossRef] [PubMed]
- Barnett, A.G.; Williams, G.M.; Schwartz, J.; Best, T.L.; Neller, A.H.; Petroeschevsky, A.L.; Simpson, R.W. The effects of air pollution on hospitalizations for cardiovascular disease in elderly people in Australian and New Zealand cities. Environ. Health Perspect. 2006, 114, 1018–1023. [Google Scholar] [CrossRef] [Green Version]
- Gray, S.C.; Edwards, S.E.; Miranda, M.L. Race, socioeconomic status, and air pollution exposure in North Carolina. Environ. Res. 2013, 126, 152–158. [Google Scholar] [CrossRef]
- Su, J.G.; Jerrett, M.; de Nazelle, A.; Wolch, J. Does exposure to air pollution in urban parks have socioeconomic, racial or ethnic gradients? Environ. Res. 2011, 111, 319–328. [Google Scholar] [CrossRef]
- NYCCAS. The New York City Community Air Survey: Results from Summer Monitoring. Available online: https://www1.nyc.gov/assets/doh/downloads/pdf/environmental/nyccas-report-summer09.pdf (accessed on 16 November 2019).
- Shmool, J.L.C.; Yonas, M.A.; Newman, O.D.; Kubzansky, L.D.; Joseph, E.; Parks, A.; Callaway, C.; Chubb, L.G.; Shepard, P.; Clougherty, J.E. Identifying Perceived Neighborhood Stressors across Diverse Communities in New York City. Am. J. Community Psychol. 2015, 56, 145–155. [Google Scholar] [CrossRef]
- Hajat, A.; Diez-Roux, A.V.; Adar, S.D.; Auchincloss, A.H.; Lovasi, G.S.; O’Neill, M.S.; Sheppard, L.; Kaufman, J.D. Air Pollution and Individual and Neighborhood Socioeconomic Status: Evidence from the Multi-Ethnic Study of Atherosclerosis (MESA). Environ. Health Perspect. 2013, 121, 1325–1333. [Google Scholar] [CrossRef] [Green Version]
- Forastiere, F.; Stafoggia, M.; Tasco, C.; Picciotto, S.; Agabiti, N.; Cesaroni, G.; Perucci, C.A. Socioeconomic status, particulate air pollution, and daily mortality: Differential exposure or differential susceptibility. Am. J. Ind. Med. 2007, 50, 208–216. [Google Scholar] [CrossRef]


| N | Min | Mean | Max | Std Dev | Median | IQR | |
|---|---|---|---|---|---|---|---|
| Age-Adjusted CVD/100,000 | 1981 | 1293 | 14,387 | 58,500 | 6316 | 13,046 | 7671 |
| Average NO2 | 1981 | 12.7 | 24.4 | 38.0 | 3.4 | 24.4 | 3.9 |
| Average PM2.5 | 1981 | 8.5 | 10.4 | 14.4 | 1.0 | 10.2 | 1.4 |
| Average SO2 | 1981 | 1.4 | 4.4 | 11.7 | 2.0 | 3.8 | 2.1 |
| Average O3 | 1981 | 21.1 | 27.2 | 32.9 | 1.5 | 27.4 | 1.6 |
| Socioeconomic Deprivation Index (SDI)* | 1981 | −1.3 | 0.1 | 1.9 | 0.7 | 0 | 1.0 |
| ICE Index: Race and Income (ICE R&I)* | 1981 | −0.6 | 0 | 0.6 | 0.2 | 0.0 | 0.3 |
| 200% of Federal Poverty Line | 1981 | 0 | 0.4 | 0.9 | 0.2 | 0.4 | 0.3 |
| Median Household Income | 1981 | 9662 | 54,344 | 136,053 | 22,903 | 51,786 | 30,679 |
| Violent Crime Rate | 1981 | 0 | 44.2 | 323.3 | 39.0 | 33.8 | 44.3 |
| Assault Rate | 1981 | 0 | 20.3 | 175.1 | 20.4 | 14.2 | 23.5 |
| Non-Hispanic white | 1981 | 0 | 0.3 | 1.0 | 0.3 | 0.2 | 0.6 |
| Non-Hispanic black | 1981 | 0 | 0.3 | 1.0 | 0.3 | 0.1 | 0.4 |
| Hispanic | 1981 | 0 | 0.3 | 0.9 | 0.2 | 0.2 | 0.3 |
| CVD | NO2 | PM2.5 | SO2 | O3 | SDI Index | ICE: R&I Index | Poverty | Median Income | Violent Crime | Assault Rate | %Non-Hispanic white | % Non-Hispanic black | % Hispanic | |
|---|---|---|---|---|---|---|---|---|---|---|---|---|---|---|
| Mean Age-Adjusted CVD/100,000 | 1.00 | |||||||||||||
| Average NO2 | 0.16 | 1.00 | ||||||||||||
| Average PM2.5 | 0.21 | 0.83 | 1.00 | |||||||||||
| Average SO2 | 0.15 | 0.57 | 0.76 | 1.00 | ||||||||||
| Average O3 | −0.12 | −0.92 | −0.80 | −0.57 | 1.00 | |||||||||
| Socioeconomic Deprivation Index (SDI)* | 0.60 | 0.24 | 0.33 | 0.33 | −0.16 | 1.00 | ||||||||
| ICE Index: Race and Income* | −0.64 | −0.10 | −0.12 | −0.15 | 0.04 | −0.70 | 1.00 | |||||||
| 200% of Federal Poverty Line | 0.57 | 0.29 | 0.37 | 0.34 | −0.20 | 0.95 | −0.63 | 1.00 | ||||||
| Median Household Income | −0.51 | −0.19 | −0.24 | −0.27 | 0.10 | −0.90 | 0.72 | −0.86 | 1.00 | |||||
| Violent Crime Rate | 0.56 | 0.28 | 0.28 | 0.19 | −0.19 | 0.46 | −0.53 | 0.44 | −0.39 | 1.00 | ||||
| Assault Rate | 0.57 | 0.25 | 0.26 | 0.18 | −0.17 | 0.51 | −0.56 | 0.48 | −0.43 | 0.89 | 1.00 | |||
| Non-Hispanic white | −0.51 | −0.12 | −0.15 | −0.19 | 0.06 | −0.54 | 0.84 | −0.48 | 0.49 | −0.49 | −0.50 | 1.00 | ||
| Non-Hispanic black | 0.47 | −0.02 | −0.07 | −0.04 | 0.02 | 0.17 | −0.72 | 0.10 | −0.18 | 0.40 | 0.42 | −0.65 | 1.00 | |
| Hispanic | 0.34 | 0.18 | 0.37 | 0.43 | −0.11 | 0.59 | −0.31 | 0.57 | −0.48 | 0.28 | 0.30 | −0.46 | −0.18 | 1.00 |
| IRR | (95% CI) | AIC | |
|---|---|---|---|
| Air Pollutants | |||
| Average NO2 | 1.09 | (1.07, 1.12) | 39,765 |
| Average PM2.5 | 1.14 | (1.11, 1.17) | 39,721 |
| Average SO2 | 1.07 | (1.05, 1.09) | 39,776 |
| Average O3 | 0.94 | (0.92, 0.96) | 39,793 |
| Social Factors | |||
| Socioeconomic Deprivation Index | 1.43 | (1.40, 1.46) | 38,901 |
| ICE: Race and Income | 0.69 | (0.68, 0.70) | 38,649 |
| % living below 200% of Federal Poverty Line (FPL) | 1.45 | (1.42, 1.49) | 38,998 |
| Median Household Income | 0.75 | (0.73, 0.76) | 39,142 |
| Violent Crime Rate | 1.33 | (1.31, 1.36) | 39,023 |
| Assault Rate | 1.34 | (1.32, 1.37) | 38,990 |
| % Non-Hispanic white | 0.65 | (0.64, 0.67) | 39,086 |
| % Non-Hispanic black | 1.35 | (1.32, 1.38) | 39,264 |
| % Hispanic | 1.21 | (1.18, 1.24) | 39,567 |
| NO2 | PM2.5 | SO2 | O3 | |||||||||
|---|---|---|---|---|---|---|---|---|---|---|---|---|
| Exposures | IRR | (95% CI) | AIC | IRR | (95% CI) | AIC | IRR | (95% CI) | AIC | IRR | (95% CI) | AIC |
| Pollutant | 1.01 | (0.99, 1.03) | 38,902 | 1.00 | (0.98, 1.02) | 38,903 | 0.96 | (0.95, 0.98) | 38,884 | 1.00 | (0.98, 1.01) | 38,903 |
| SDI | 1.43 | (1.4, 1.46) | 1.43 | (1.4, 1.47) | 1.46 | (1.43, 1.49) | 1.43 | (1.4, 1.46) | ||||
| Pollutant | 1.04 | (1.03, 1.06) | 38,623 | 1.07 | (1.05, 1.09) | 38,597 | 1.01 | (1, 1.03) | 38,647 | 0.97 | (0.96, 0.98) | 38,634 |
| ICE: R&I | 0.69 | (0.68, 0.7) | 0.69 | (0.68, 0.71) | 0.69 | (0.68, 0.7) | 0.69 | (0.68, 0.7) | ||||
| Pollutant | 1.00 | (0.98, 1.02) | 39,000 | 0.99 | (0.97, 1.01) | 38,999 | 0.97 | (0.95, 0.98) | 38,984 | 1.00 | (0.99, 1.02) | 38,999 |
| % < 200% FPL | 1.45 | (1.42, 1.49) | 1.46 | (1.42, 1.5) | 1.48 | (1.44, 1.52) | 1.46 | (1.42, 1.49) | ||||
| Pollutant | 1.03 | (1.01, 1.05) | 39,133 | 1.04 | (1.02, 1.07) | 39,130 | 0.99 | (0.98, 1.01) | 39,144 | 0.98 | (0.96, 0.99) | 39,138 |
| Median Income | 0.75 | (0.74, 0.77) | 0.75 | (0.74, 0.77) | 0.74 | (0.73, 0.76) | 0.75 | (0.73, 0.76) | ||||
| Pollutant | 1.00 | (0.98, 1.02) | 39,025 | 1.03 | (1.01, 1.06) | 39,016 | 1.02 | (1, 1.03) | 39,020 | 1.00 | (0.98, 1.02) | 39,025 |
| Violent Crime | 1.33 | (1.31, 1.36) | 1.32 | (1.29, 1.35) | 1.33 | (1.3, 1.35) | 1.33 | (1.31, 1.36) | ||||
| Pollutant | 1.00 | (0.99, 1.02) | 38,992 | 1.03 | (1.01, 1.05) | 38,984 | 1.02 | (1, 1.03) | 38,988 | 1.00 | (0.98, 1.02) | 38,992 |
| Assault Rate | 1.34 | (1.31, 1.37) | 1.33 | (1.3, 1.36) | 1.33 | (1.31, 1.36) | 1.34 | (1.31, 1.37) | ||||
| Pollutant | 1.04 | (1.03, 1.06) | 39,065 | 1.07 | (1.05, 1.1) | 39,047 | 1.01 | (1, 1.03) | 39,086 | 0.97 | (0.95, 0.99) | 39,075 |
| % non-Hispanic white | 0.66 | (0.64, 0.68) | 0.67 | (0.65, 0.68) | 0.66 | (0.64, 0.68) | 0.66 | (0.64, 0.68) | ||||
| Pollutant | 1.09 | (1.07, 1.11) | 39,184 | 1.16 | (1.13, 1.18) | 39,093 | 1.08 | (1.06, 1.1) | 39,185 | 0.94 | (0.93, 0.96) | 39,227 |
| % non-Hispanic black | 1.35 | (1.32, 1.38) | 1.36 | (1.33, 1.39) | 1.35 | (1.32, 1.38) | 1.35 | (1.32, 1.38) | ||||
| Pollutant | 1.05 | (1.03, 1.08) | 39,544 | 1.06 | (1.03, 1.09) | 39,552 | 1.00 | (0.98, 1.02) | 39,569 | 0.96 | (0.94, 0.98) | 39,554 |
| % Hispanic | 1.20 | (1.17, 1.23) | 1.18 | (1.16, 1.21) | 1.21 | (1.18, 1.24) | 1.20 | (1.18, 1.23) |
| NO2 | PM2.5 | SO2 | O3 | |||||||||
|---|---|---|---|---|---|---|---|---|---|---|---|---|
| Exposures | IRR | (95% CI) | AIC | IRR | (95% CI) | AIC | IRR | (95% CI) | AIC | IRR | (95% CI) | AIC |
| Pollutant | 0.99 | (0.98, 1.01) | 38,192 | 1.01 | (0.99, 1.02) | 38,192 | 0.98 | (0.96, 0.99) | 38,182 | 1.01 | (0.99, 1.02) | 38,192 |
| SDI | 1.30 | (1.27, 1.33) | 1.30 | (1.27, 1.32) | 1.31 | (1.29, 1.34) | 1.30 | (1.27, 1.33) | ||||
| Pollutant | 1.01 | (0.99, 1.02) | 38,406 | 1.03 | (1.02, 1.05) | 38,394 | 1.00 | (0.99, 1.01) | 38,407 | 0.99 | (0.98, 1.01) | 38,406 |
| ICE: R&I | 0.75 | (0.74, 0.77) | 0.75 | (0.74, 0.77) | 0.75 | (0.74, 0.77) | 0.75 | (0.74, 0.77) | ||||
| Pollutant | 0.99 | (0.97, 1) | 38,205 | 1.00 | (0.98, 1.02) | 38,209 | 0.98 | (0.97, 0.99) | 38,200 | 1.01 | (1, 1.03) | 38,205 |
| % <200% FPL | 1.33 | (1.3, 1.36) | 1.32 | (1.29, 1.35) | 1.34 | (1.31, 1.37) | 1.33 | (1.3, 1.36) | ||||
| Pollutant | 1.00 | (0.99, 1.02) | 38,387 | 1.03 | (1.01, 1.05) | 38,376 | 1.00 | (0.98, 1.01) | 38,388 | 1.00 | (0.98, 1.01) | 38,388 |
| Median Income | 0.82 | (0.81, 0.84) | 0.83 | (0.81, 0.84) | 0.82 | (0.81, 0.84) | 0.82 | (0.81, 0.84) | ||||
| Pollutant | 0.99 | (0.98, 1.01) | 38,192 | 1.01 | (0.99, 1.02) | 38,192 | 0.98 | (0.96, 0.99) | 38,182 | 1.01 | (0.99, 1.02) | 38,192 |
| Violent Crime | 1.12 | (1.1, 1.14) | 1.12 | (1.1, 1.14) | 1.12 | (1.1, 1.14) | 1.12 | (1.1, 1.14) | ||||
| Pollutant | 1.00 | (0.98, 1.01) | 38,224 | 1.01 | (0.99, 1.03) | 38,223 | 0.98 | (0.97, 0.99) | 38,216 | 1.00 | (0.99, 1.02) | 38,224 |
| Assault Rate | 1.11 | (1.09, 1.14) | 1.11 | (1.09, 1.13) | 1.12 | (1.09, 1.14) | 1.11 | (1.09, 1.14) | ||||
| Pollutant | 0.98 | (0.96, 0.99) | 38,423 | 0.98 | (0.96, 1) | 38,425 | 0.96 | (0.95, 0.97) | 38,399 | 1.01 | (1, 1.03) | 38,427 |
| % non-Hispanic white | 0.85 | (0.83, 0.88) | 0.85 | (0.83, 0.88) | 0.85 | (0.82, 0.87) | 0.85 | (0.83, 0.88) | ||||
| Pollutant | 0.99 | (0.98, 1.01) | 38,192 | 1.01 | (0.99, 1.02) | 38,192 | 0.98 | (0.96, 0.99) | 38,182 | 1.01 | (0.99, 1.02) | 38,192 |
| % non-Hispanic black | 1.21 | (1.18, 1.23) | 1.21 | (1.18, 1.23) | 1.20 | (1.18, 1.23) | 1.21 | (1.18, 1.23) | ||||
| Pollutant | 0.97 | (0.96, 0.99) | 38,530 | 0.97 | (0.95, 0.99) | 38,531 | 0.96 | (0.94, 0.97) | 38,513 | 1.02 | (1, 1.04) | 38,535 |
| % Hispanic | 0.99 | (0.97, 1.02) | 1.00 | (0.98, 1.02) | 1.01 | (0.99, 1.03) | 0.99 | (0.97, 1.01) |
© 2019 by the authors. Licensee MDPI, Basel, Switzerland. This article is an open access article distributed under the terms and conditions of the Creative Commons Attribution (CC BY) license (http://creativecommons.org/licenses/by/4.0/).
Share and Cite
Humphrey, J.L.; Reid, C.E.; Kinnee, E.J.; Kubzansky, L.D.; Robinson, L.F.; Clougherty, J.E. Putting Co-Exposures on Equal Footing: An Ecological Analysis of Same-Scale Measures of Air Pollution and Social Factors on Cardiovascular Disease in New York City. Int. J. Environ. Res. Public Health 2019, 16, 4621. https://doi.org/10.3390/ijerph16234621
Humphrey JL, Reid CE, Kinnee EJ, Kubzansky LD, Robinson LF, Clougherty JE. Putting Co-Exposures on Equal Footing: An Ecological Analysis of Same-Scale Measures of Air Pollution and Social Factors on Cardiovascular Disease in New York City. International Journal of Environmental Research and Public Health. 2019; 16(23):4621. https://doi.org/10.3390/ijerph16234621
Chicago/Turabian StyleHumphrey, Jamie L., Colleen E. Reid, Ellen J. Kinnee, Laura D. Kubzansky, Lucy F. Robinson, and Jane E. Clougherty. 2019. "Putting Co-Exposures on Equal Footing: An Ecological Analysis of Same-Scale Measures of Air Pollution and Social Factors on Cardiovascular Disease in New York City" International Journal of Environmental Research and Public Health 16, no. 23: 4621. https://doi.org/10.3390/ijerph16234621