Article

Differences in Distribution of Potassium-Solubilizing Bacteria in Forest and Plantation Soils in Myanmar

1
School of Chemistry and Biological Engineering, University of Science and Technology Beijing, Beijing 100083, China
2
Hawaii Natural Energy Institute, University of Hawaii, Honolulu, HI 96822, USA
*
Authors to whom correspondence should be addressed.
Int. J. Environ. Res. Public Health 2019, 16(5), 700; https://doi.org/10.3390/ijerph16050700
Submission received: 6 December 2018 / Revised: 22 February 2019 / Accepted: 22 February 2019 / Published: 27 February 2019
(This article belongs to the Special Issue Microorganisms in the Environment)

Abstract

:
Potassium (K) has been recognized as an essential element in intensive agricultural production systems, and deficiency of K usually results in a decrease in crop yields. The utilization of potassium-solubilizing bacteria (KSB) to increase the soluble K content in soil has been regarded as a desirable pathway to increase plant yields. Following the inoculation of KSB in the soil, potassium can be released (in the form of K+) and consumed by plants. This study aims to investigate and compare the distribution characteristics of potassium-solubilizing bacteria between forest and plantation soils in Myanmar. In this study, 14 KSB strains were isolated from rhizosphere samples collected from forest soil, as well as fertilized rubber tree rhizosphere soil and fertilized bare soil from a plantation. Broadleaf forests with high levels of canopy cover mainly comprised the forest environment, and rubber trees were planted in the plantation environment. The Chao and abundance-based coverage estimator (ACE) indices showed that the microbial abundance of the plantation soil was higher than that of the forest soil. According to the Illumina MiSeq sequencing analysis results, the Shannon index of the forest soil was lower while the Simpson index was higher, which demonstrated that the microbial diversity of the forest soil was higher than that of the plantation soil. Potassium-solubilizing test results showed that the strains E, I, M, and N were the most effective KSB under liquid cultivation conditions. Additionally, KSB only accounted for less than 5.47% of the total bacteria detected in either of the sample types, and the distribution of dominant KSB varied with the soil samples. As another result, the abundance of Pseudomonas spp. in S1 was higher than in S2 and S3, indicating a negative impact on the growth of Pseudomonas in the fertilized rubber tree rhizosphere soil. The significance of our research is that it proves that the increasing use of KSB for restoring soil is a good way to reduce the use of chemical fertilizers, which could further provide a relatively stable environment for plant growth.

Graphical Abstract

1. Introduction

Hevea brasiliensis (rubber tree) is the major source of natural rubber and is traditionally cultivated in equatorial countries, humid areas with tropical and monsoon climates [1]. Although rubber trees usually have a 7-year-long immature, unproductive period, the economic lives of rubber trees can reach 15–30 years, or even longer [2]. Chemical fertilizers are typically used for sustaining the yield, following long-term intensive rubber tapping in plantations. Potassium (K) is one of the most essential elements for plant growing, and K-deficient soils are often acidic, sandy, saline, and waterlogged [3]. K has been recognized as an essential element in intensive agricultural production systems, especially in organic soils [4]. A K deficiency usually results in both a decrease in crop yields and resistance to pathogens and insect pests [5,6].
In general, soils host a large variety of microbial communities [7,8]. Most edaphic microbes, however, cannot be cultured under laboratorial conditions, which restrains investigation related to the influence of human activity on specific changes in the soil bacterial community structure [9]. Previous studies showed that high-throughput sequencing can assist in obtaining overall assessments of bacterial diversity, community structure, and the relative abundances of specific bacterial taxa in soil [10,11,12]. Potassium reserves in the crust are usually very high, accounting for 2.1% to 2.3% of the crust, but only 1–2% of potassium is water soluble and/or exchangeable in soil [13]. Although most K existing in soil is in the form of a mineral, this K can be solubilized and absorbed by microbes and plant roots when different kinds of KSB are inoculated into a soil or fluid medium under laboratory conditions [14,15,16].
The proportion of potassium-dissolving bacteria in the flora environment has not been well obtained from traditional methods, and high-throughput 16S rDNA sequencing provides a way for us to analyze the microbial community structure. Comparing the screened KSB with the sample flora, we can understand the content of KSB in the flora. Potassium-solubilizing bacteria (KSB) isolated from the rhizosphere of the plant can improve the K transition. Three types of KSB (i.e., Bacillus spp., Enterobacter spp., and Pseudomonas spp.) have been discovered and characterized [14,17,18,19,20]. These KSB can rapidly release K from K-bearing minerals, though their organic acid secretions [21]. These organic acids can either directly dissolve rock K (K-containing minerals) or chelate mineral silicon ions to release K into solution, such as indole-3-acetic acid released by Enterobacter sp. DMKU-RP206 [22,23]. It has been reported that KSB inoculation in soil has positive effects, under controlled conditions, in cucumber, eggplant, peanut, and pepper plantations [14,24]. Thus, the use of KSB as a biological fertilizer has gained considerable attention recently.
The utilization of KSB to increase the soluble K content in soil has been regarded as a desirable pathway to increase plant yield [19]. A paucity of studies, however, have been conducted on rubber tree rhizosphere soil and its relative abundances. In the present work, the soil bacterial diversity and community structure in plantations were investigated and compared with that of forests in the same region. The KSB were isolated from the rubber tree rhizosphere soil and tested for their capacity for K release. In addition, the community structure of KSB, replicated from plantation soil, was also studied and compared with that from forest soil.

2. Materials and Methods

2.1. Samples and Elemental Analysis

Soil samples were aseptically collected from a forest and a rubber tree plantation in Myanmar. All samples were collected from the layer 5–25 cm in depth, from soil at three different coordinates. The soil samples were collected from three regions: 23°45’ N, 96°12’ E (S1); 24°13’ N, 96°40’ E (S2); and 24°30’ N, 96°32’ E (S3). The soil collected in S1, S2, and S3 was forest soil (from mainly broadleaf forests with high levels of canopy cover), fertilized rubber tree rhizosphere soil from a rubber tree plantation, and fertilized bare soil from a plantation, respectively. Soil samples were collected in triplicate at each test site. The soil samples were sealed in sterile Ziploc bags to minimize any possible exogenous microbial contamination. Part of the mixed samples was stored at −20 °C, for future analysis. Soil pH was assessed using the saturated paste method with a pH meter. A 10 g soil sample was placed in the bottle and then 25 mL of CO2-free water was added. After shaking for 30 min and standing for 30 min, it was measured with a pH meter (INESA Scientific Instrument Co. Ltd., Shanghai, China). The soil samples were delivered to the testing center at the University of Science and Technology Beijing (Beijing, China), to test the concentration of K+ (potassium ions), Mg2+ (magnesium ions), Si (silicon), P (phosphorus), and total N (nitrogen). The following procedure was followed: First, take 5 g of soil sample in the bottle; second, add 50 mL of deionized water; third, shake for 30 min; finally, filter with double-layer filter paper and 0.45 μm filter (AIJIREN, Zhejiang, China). A Dionex DX-120 ion chromatograph (Thermo Fisher Scientific, Waltham, MA, USA) with CS12A cation separation column and conductivity detector was employed to determine the K+ and Mg2+ content of the soil. The Kjeldahl method, Molybdate colorimetric analysis, and Molybdenum blue colorimetric analysis were used to analyze the N and P content. The carbon content of the soil was analyzed using the traditional method of potassium dichromate oxidation–external heating [25].

2.2. DNA Isolation and Illumina MiSeq Sequencing

A total of 0.1 g of soil from each sample was used for the isolation of soil DNA. We normalized isolated samples to a concentration of 10 ng/μL. Genomic DNA was extracted by using a FastDNA SPIN KIT for Soil (MP Biomedicals, LLC, California, USA, Catalog: 116560200), and a pair of primers (515F/907R) were used for the PCR of the 16 S rRNA gene V4 region. These samples were barcoded separately, to enable multiplex sequencing. The PCR reactions were conducted in a 20 μL master mix with 4 μL 5x FastPfu Buffer, 2 μL dNTPs (2.5 mM), 0.4 μL forward primer (5 μM), 0.4 μL reverse primer (5 μM), 0.4 μL FastPfu polymerase (TransGen AP221-02), and 10 ng template DNA. The amplification process was conducted according to the following procedure: (1) Five min initial denaturation at 94 °C; (2) 11 cycles of denaturing at 95 °C; (3) annealing at 60 °C for 30 s; (4) extension at 72 °C for 1 min; (5) 25 cycles of denaturing at 95 °C; (6) annealing at 50 °C for 30 s; (7) extension at 72 °C for 1 min; and (8) extension at 72 °C for 10 min. DNA marked with different barcodes were sequenced by the Illumina MiSeq platform (Shanghai Majorbio Bio-pharm Technology Co., Ltd., Shanghai, China).

2.3. Isolation of KSB from Soil Samples in the Laboratory

A 1 g soil sample was added into 100 mL sterile saline solution (0.8% NaCl) and mixed thoroughly by shaking the flask on a rotatory shaker for 5 min at room temperature. Next, 1 mL soil solution was extracted in 9 mL sterile saline solution and centrifuged for 30 s. After being diluted 7 times, 0.1 mL of each degree suspension was spread over resterilized selective agar plates in triplicate. The selective medium was prepared with 10 g sucrose, 0.5 g yeast extract, 1 g (NH4)2SO4, 2 g Na2HPO4, 0.5 g MgSO4·7H2O, 1 g CaCO3, 1 g potash feldspar (9.60% K2O), 15 g agar, and 1 L sterile water [26]. The inoculated plates were incubated at 29 ± 1 °C for 48 h. Fast-growing and slime colonies were selected and purified on the selective medium. Colonies with a transparent zone after 5 days incubation were KSB. Gram staining was performed, as previously described [27]. The microbial biomass of each strain was grown in a beef extract peptone culture medium. Single colonies were placed in liquid lysogeny broth (LB) medium to be cultured, and the bacterial suspension was stored at −20 °C in glycerin, for later use.

2.4. Amplified Ribosomal DNA Restriction Analysis (ARDRA)

Chromosomal DNA was extracted by using a rapid bacterial genomic DNA isolation kit, according to the following procedure: (1) Centrifuge 1 mL bacterium culture solution using a 1.5 mL microfuge tube at 8000 rpm for 1 min at room temperature; (2) remove the clear supernatant; (3) resuspend the bacteria by adding 180 µL lysozyme solution (20 mg/mL) and storing at 37 °C for 1 h; (4) mix the solution with 200 µL buffer PB and store at −20 °C; (5) centrifuge the solution at 10,000 rpm for 5 min at room temperature and place the clear supernatant into a 1.5 mL microfuge tube; (6) add isovolumetric isopropanol to the microfuge tube, store at room temperature for 3 min, centrifuge at 10,000 rpm for 5 min, and abandon the clear supernatant; (7) add 1 mL 75% ethyl alcohol into the tube, mix for 2 min, centrifuge at 10,000 rpm for 2 min, and abandon the clear supernatant; (8) repeat step 7, open the lid, and sit for 10 min at room temperature; (9) dissolve the DNA by using 50 μL TE buffer solution in the tube and rinse for 2 min, then centrifuge at 10,000 rpm for 2 min, abandon the clear supernatant, repeat step 5 and step 7, open the lid and invert for 10 min at room temperature. Repeat step 8, and then conduct PCR amplification of 16S rDNA as previously reported [28]. A pair of universal primers (27F/1492R) was used to amplify the 16S rDNA conserved sequence [29]. After the amplification process, the PCR product (10 μL) was digested with the restriction endonucleases AluI and RsaI (Appligene, France) for 16 h at 37 °C, and BstUI (Ozyme, Saint-Quentin-en-Yvelines, Versailles, France) for 4 h at 60 °C. The obtained products were then separated on 3.5% (w/v) MetaPhor agarose gels in 1 × TAE buffer. The DNA fragments obtained were compared with the DNA molecular mass marker Trans2K (Transgen, Beijing, China), and Gel Doc XR+ System (Bio-Rad) restriction profiles were classified, based on the presence of the DNA fragments for each enzyme. The unweighted pair group method with arithmetic mean (UPGMA) was used to build the similarity dendrogram from the distance matrix, using the NTSYS software (Exeter Software, Setauket, NY, USA) [30].

2.5. Sequencing and Analysis of Data

The 16S rDNA was amplified with Pfu DNA polymerase, cloned into pGEM-T Easy Vectors, and transformed into Escherichia coli DH-5α competent cells, according to the manufacturer’s instructions. The lysates were used as DNA templates in the subsequent PCR amplification, and the transformants were checked by agarose gel electrophoresis. Ambiguities were resolved or confirmed by repeated sequencing. Three isolates were picked and purified for sequencing from each of the types. The sequences determined in this study were aligned with the 16S rRNA sequences retrieved from the GeneBank database. These 16S rDNA sequences represented all of the isolate sequences obtained from each soil sample. The 10 sequences were compared to the GeneBank entries by using the Basic Local Alignments Search Tool (BLAST) of The National Center for Biotechnology Information (NCBI) to obtain a preliminary phylogenetic affiliation of the isolates, and closely related strains with our isolates were integrated to construct a phylogenetic tree. The 16S rRNA gene sequences were aligned using the Clustal X 2.0 program (EMBL-EBI, Hinxton, UK), and the phylogenetic tree was constructed using the neighbor-joining (NJ) algorithm with MEGA 6.06 (http://www.megasoftware.net) [31].

2.6. Determination of Potassium-Solubilizing Capability

The measurements of capacity of K release were done in triplicate, to investigate the 14 isolated KSB from the soil samples. First, 100 mg potash feldspar was mixed with 50 mL nutrient medium, and the pH value of the solution was adjusted to 7.0 before steam sterilization. After continuous enrichment and culturing twice, 100 μL of bacteria suspension was inoculated into 10 mL sterilized culture media, and the culture media (without inoculation) was set as a control. After culturing at 200 rpm for 5 days at 35 °C, the bacteria suspension was treated with 6% H2O2 at 95 °C, and then filtered to collect the mineral powder residues from the cells and media. The filtrate solutions were digested with 30% H2O2 in a water bath at 95 °C, and then diluted to 50 mL with distilled water. The potassium concentrations in the solution were measured by an atomic absorption spectrophotometer (AAS; Shimadzu, AA6800, Kyoto, Japan).

3. Results

3.1. Characteristics of Soil Samples

The chemical characteristics of the three samples are listed in Table 1. The concentration of N was at least two orders of magnitude higher than that of the other elements (concentrations of N were 5.366, 3.805, and 5.476 mg/g for S1, S2, and S3, respectively). The N content in S1 and S3 was similar, but was significantly higher than that of S2. As the contents of K, Mg2+, Si, and P varied with the soil samples, the characteristics of the soil samples were also varied. For instance, the concentrations of soluble K and P in S2 and S3 were significantly lower than in S1 (Table 1). The pH values of the S1, S2, and S3 samples were 6.24, 6.47, and 6.62, respectively. The organic carbon soil contents (SOC) in the S1, S2, and S3 samples were 2.6964%, 3.0071%, and 2.5452%, respectively.

3.2. Enumeration of Total Bacteria

A total of 149 isolates capable of potassium-release were identified, out of the total of 1678 isolated bacteria. The percentages of potassium-solubilizing bacteria (KSB) of the total amount of aerobic bacteria isolated were 12.25% (80 isolates out of 653) for S1, 5.46% (29 isolates out of 531) for S2, and 8.10% (40 isolates out of 494) for S3 (see Table 2). A total of 80, 29, and 40 clone sequences were included in phylogenetic analysis, which generated 8, 7, and 9 operational taxonomic units (OTUs), respectively.

3.3. Bacterial Abundance and Diversity

A total of 58,388 quality sequences, obtained from soil samples, were assigned a taxonomic classification with an average length of 397 bp. Table 3 lists the OTUs of the three soil samples. The number of OTUs (97% similarity) ranged from 702 to 803, and the coverage estimates ranged from 96.8–98.0%, indicating that almost all of the bacterial species were included in the analysis. The Chao and abundance-based coverage estimator (ACE) indices showed that the microbial abundance of the plantation soil was higher than that of the forest soil. According to the Illumina MiSeq sequencing analysis results, the Shannon index of the forest soil was lower while the Simpson index was higher, which demonstrated that the microbial diversity of the forest soil was higher than that of the plantation soil. The relative abundance level of the top 20 taxonomic class categories is summarized in Figure 1A. Proteobacteria, Actinobacteria, Acidobacteria, and Chloroflexi were the most dominant four phyla in S1, as well as in S2 and S3. The abundance of Proteobacteria in the forest and fertilized rubber tree rhizosphere soils (S1 and S2; 25.25% and 30.30%, respectively) was significantly higher than in the fertilized bare soil from a plantation (S3; 20.12%). As the abundance of Acidobacteria in the S1, S2, and S3 samples was 15.04%, 21.43%, and 34.09%, respectively, the ratio between Proteobacteria and Acidobacteria was 1.68, 1.41, and 0.59, respectively. Thus, the S1 samples contained more organic matter, which is consistent with the element analysis results. The abundance of Verrucomicrobia was low in S1 (0.47%), in comparison with S2 and S3 (6.92% and 4.91%, respectively), whereas the abundance of Bacteroidetes and Nitrospirae in S1 (2.64% and 2.44%, respectively) was much higher compared to S2 and S3 (both < 0.7%).

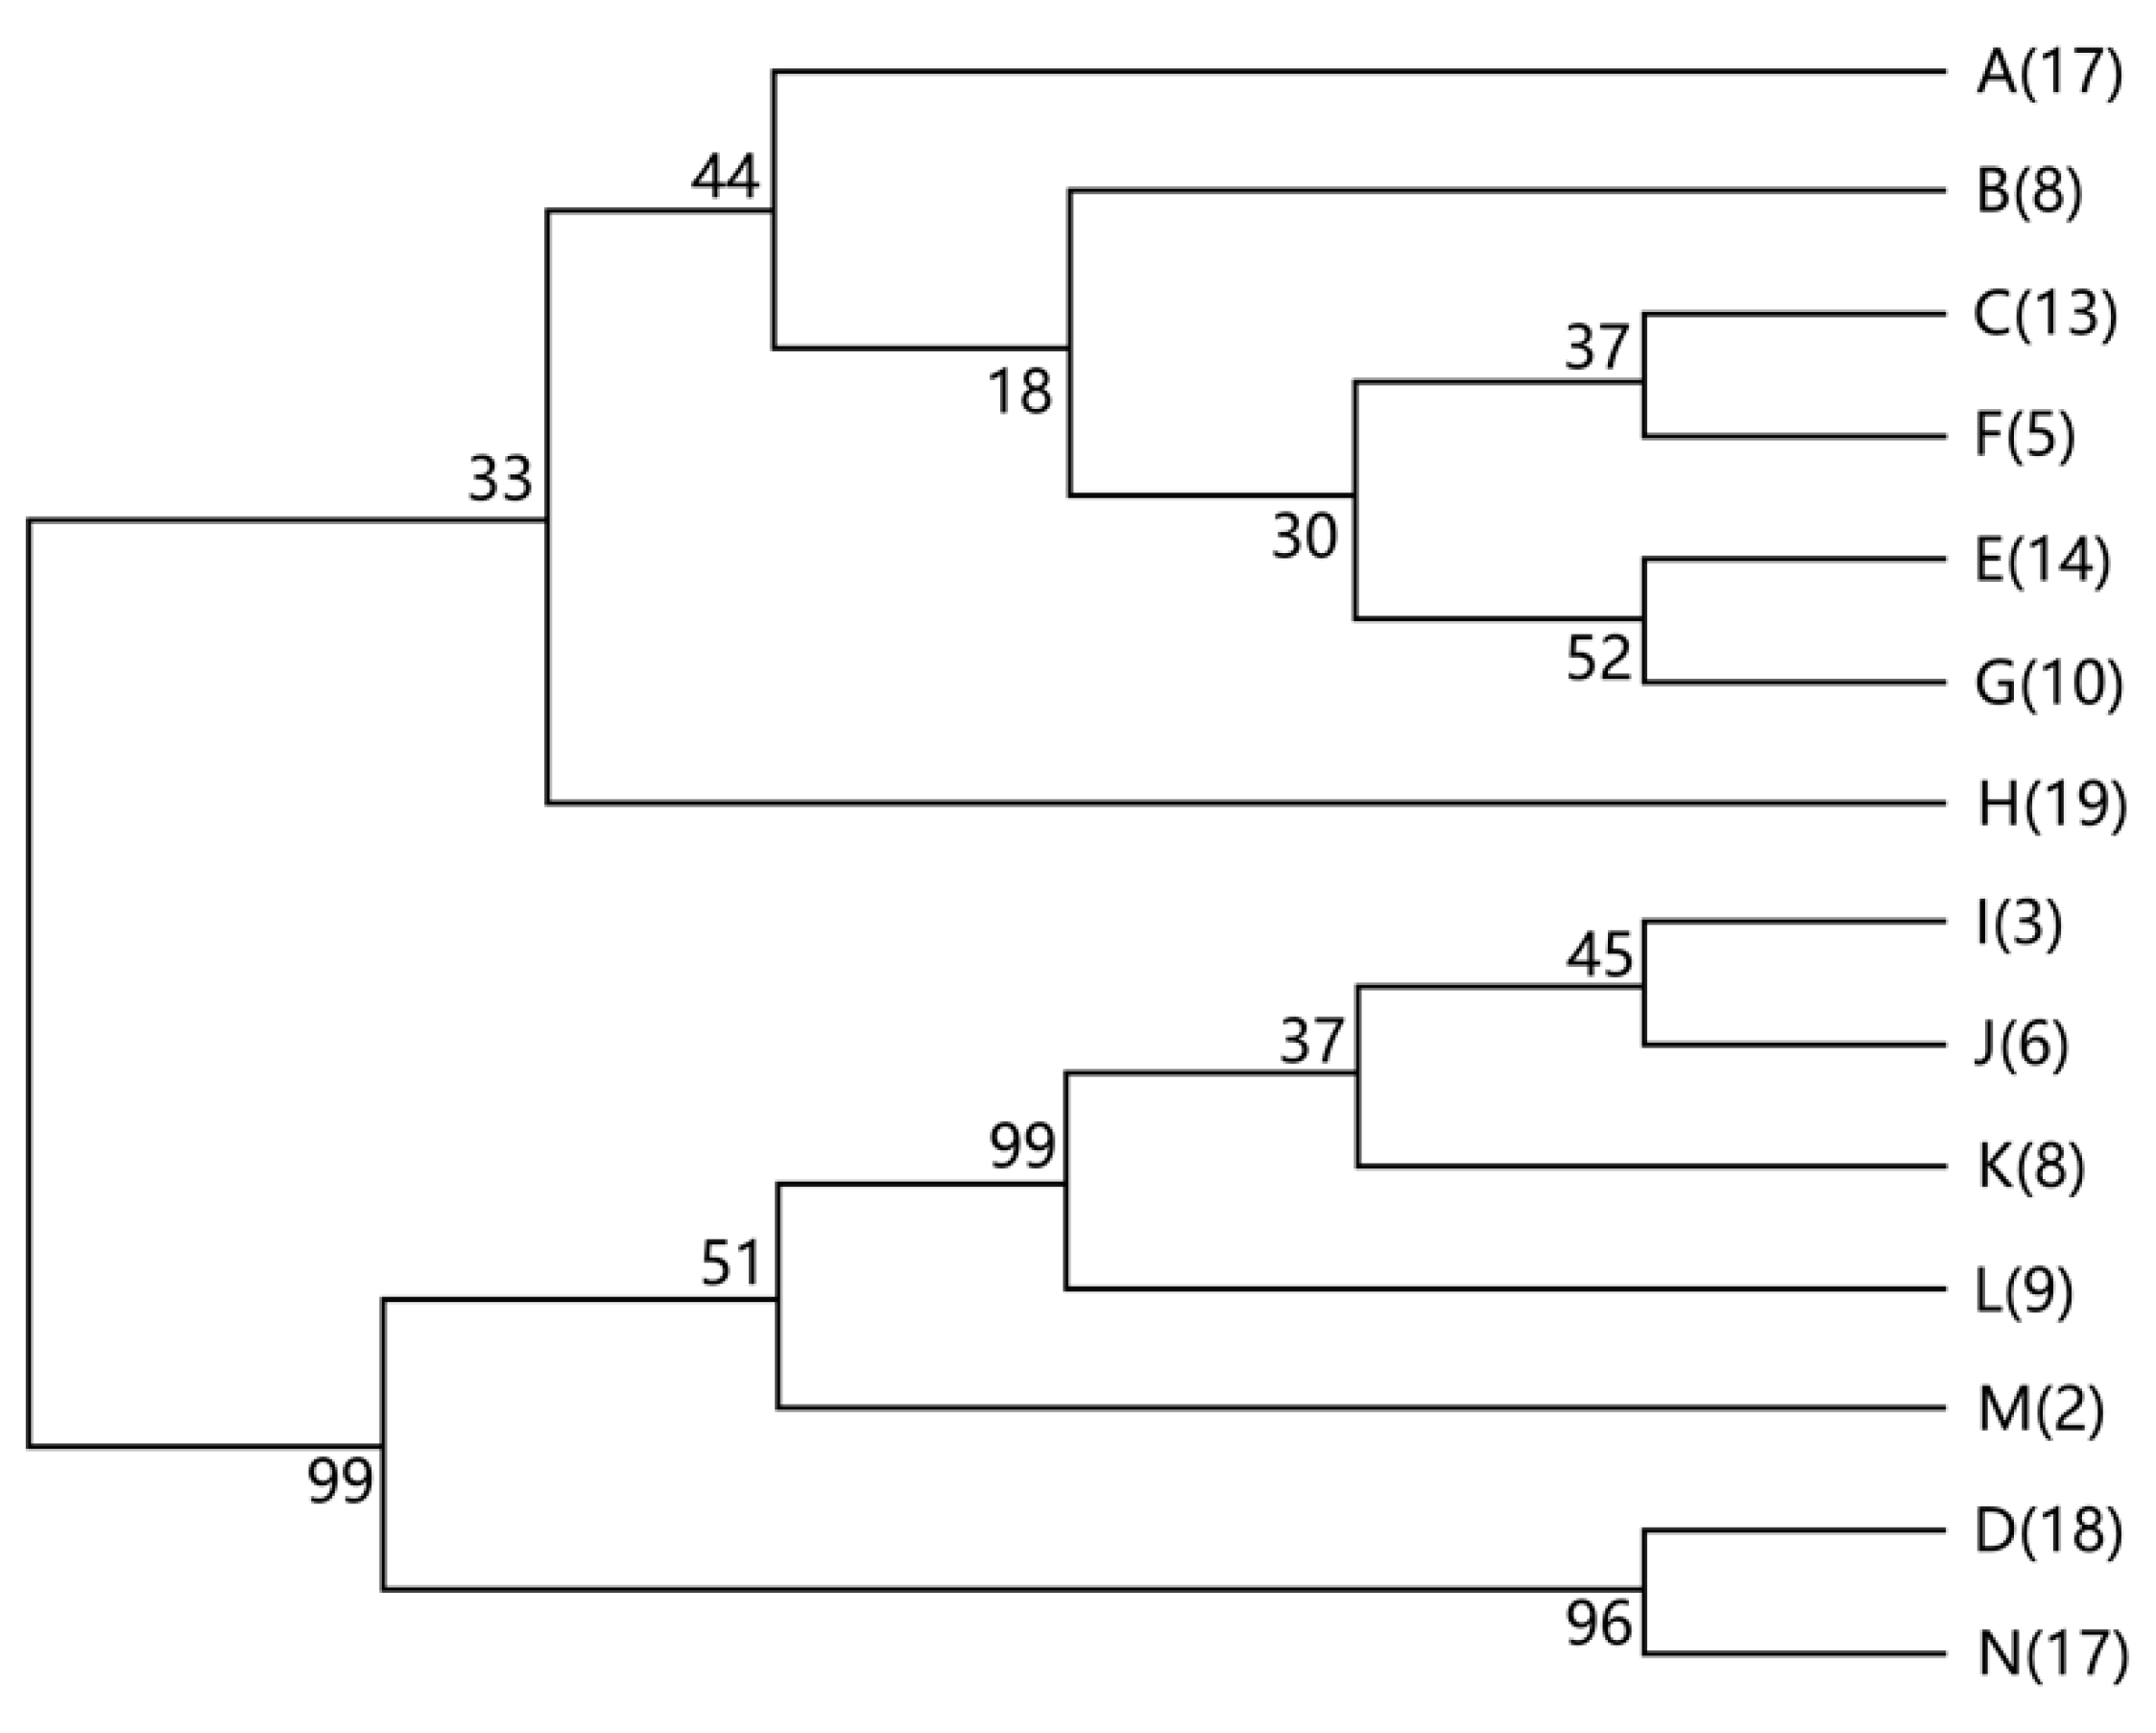
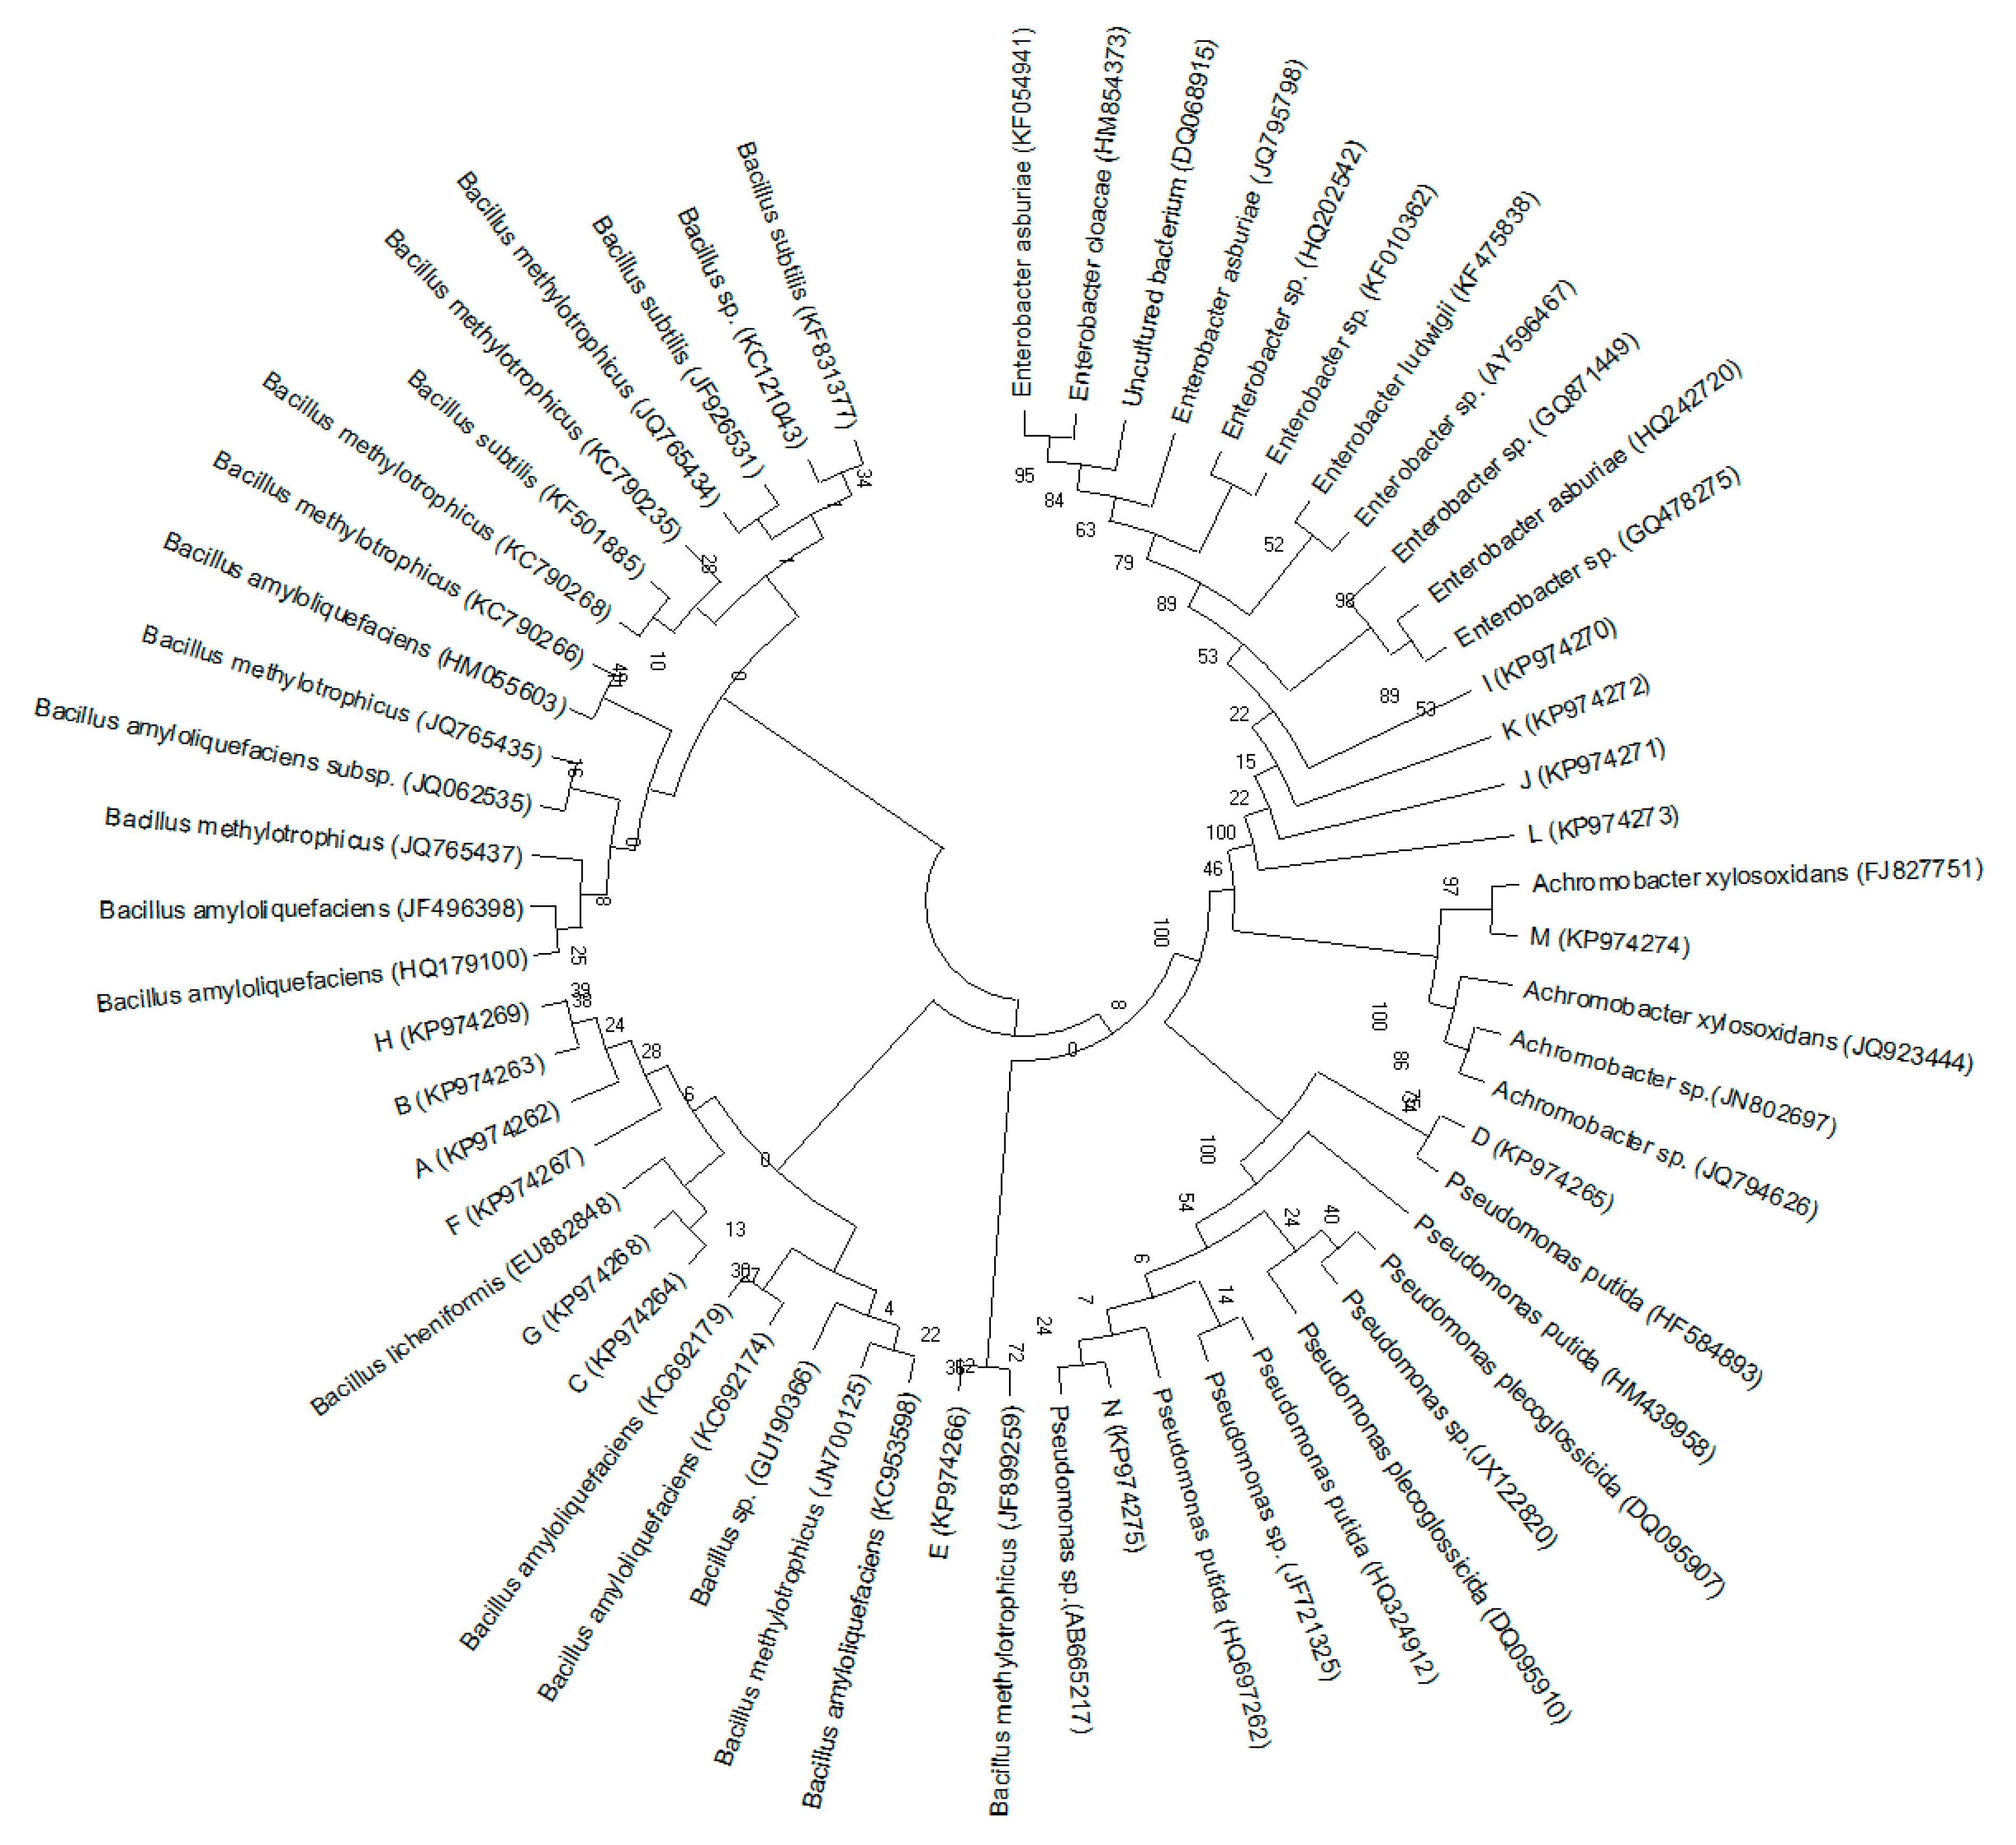
3.4. Amplified Ribosomal DNA Restriction Analysis (ARDRA) and 16S rDNA Sequencing Analysis

KSB were isolated from three soil samples and all isolates were in a band range of 1053–1075 bp, after PCR amplification with the universal primers. KSB isolates were divided into 14 ARDRA types, according to the similarities of their restriction patterns (see Figure 2). The KSB were identified by the 16S rDNA sequencing GenBank with accession numbers as follows. A: KP974262, B: KP974263, C: KP974264, D: KP974265, E: KP974266, F: KP974267, G: KP974268, H: KP974269, I: KP974270, J: KP974271, K: KP974272, L: KP974273, M: KP974274, and N: KP974275. The number of individual isolates found in each ARDRA type was distinguishable (Table 4). The dominant ARDRA type in soil samples varied, as the type of KSB differed in the soil samples. A, B, C, D, E, G, and L strains were isolated from S1, whereas D, F, G, H, I, J, and K were obtained from S2 and C, D, F, H, J, K, L, M, and N strains were isolated from S3 (Table 4). The relative abundance of these ARDRA types also varied with the soil type and the number of isolates in S1, S2, and S3 was 70, 29, and 40, respectively.
Monoclonal bacteria from each strain were selected for the 16S rDNA sequencing analysis. Figure 3 shows the phylogenetic trees generated from the sequences of these strains and their high consensus sequences. These strains can be clustered into four major genera—(I) Bacillus: A, B, C, E, F, G, and H [32]; (II) Enterobacter: I, J, K, and L; (III) Pseudomonas: D and N; and (IV) Achromobacter: M. Table 4 lists the number of monoclonal bacteria in KSB that were classified as Bacillus in S1, S2, and S3 samples (63, 19, and 4, respectively). A similar trend was also observed in the abundance of Bacillus. The abundance of Bacillus in S1, S2, and S3 was 3.79%, 0.91%, and 0.76%, respectively, indicating that compound-nutrient forest soil was preferable for the growth of Bacillus. Monoclonal bacteria classified as Pseudomonas in KSB mainly existed in S1 and S3 (16 and 18, respectively), which was significantly higher than in S2. The abundance of Pseudomonas in S1 was also the highest, 1.42% versus 0.23% and 0.92% in S2 and S3, respectively, illustrating that the fertilized rubber tree rhizosphere soil in plantations has a negative impact on the growth of Pseudomonas. Furthermore, 26 isolates from KSB were found to be phylogenetically related to Enterobacter, which made Enterobacter the third most dominant genus (Table 4).

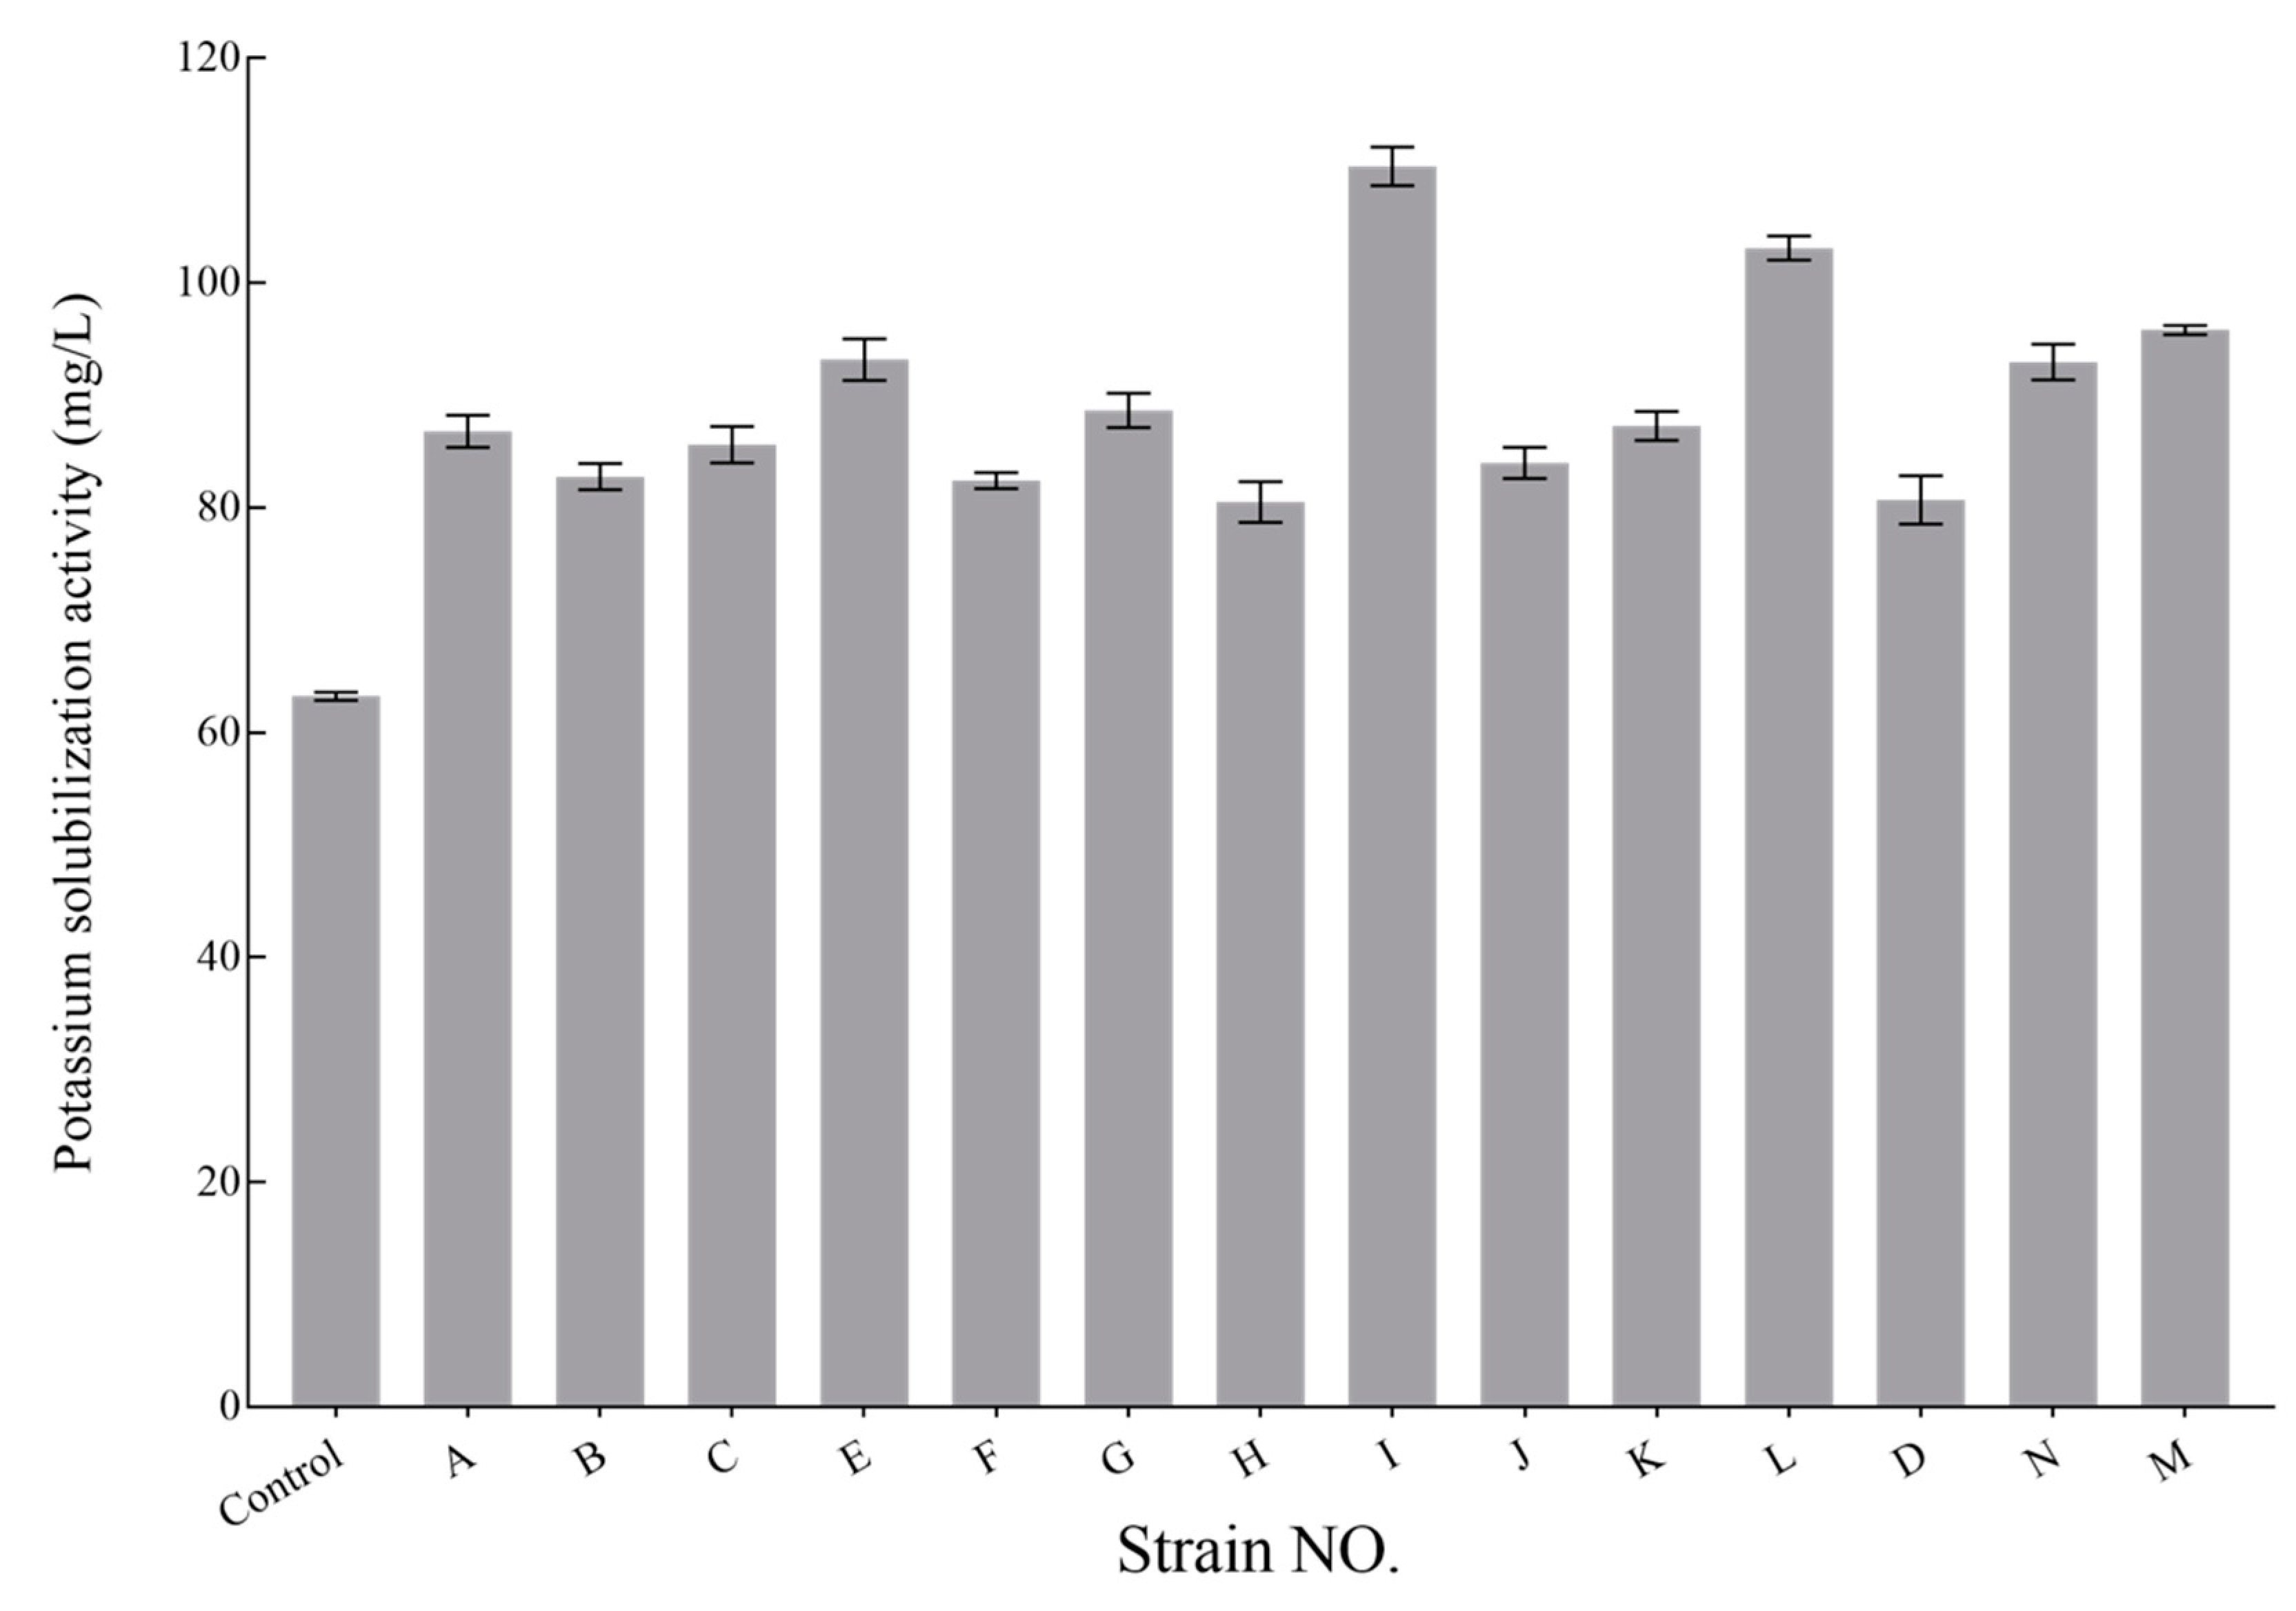
3.5. K-Solubilizing Capacity Analysis of KSB Isolates

Monoclonal bacteria from each strain were selected to investigate their capacity to release K from potassium feldspar in an aqueous medium, and the efficiency of 14 isolates to solubilize potassium was investigated (Figure 4). The capability of the KSB to solubilize K was in the range of 78.43–109.03 mg/L. Only one isolate displayed low solubilization ability (<80 mg/L). The solubilization capability of 5 isolates was high (>90 mg/L), whereas over 50% of isolates had solubilization capability in the range of 80–90 mg/L. The capacity of all the strains from Bacillus was very similar, but significantly lower than the strains I and L from Enterobacter. Strain I exhibited the highest capability (109.03 mg/L) (Figure 4). As listed in Table 4, KSB from Enterobacter mainly exist in plantation soil, and these KSB showed higher solubilization capability in comparison with those from Bacillus.

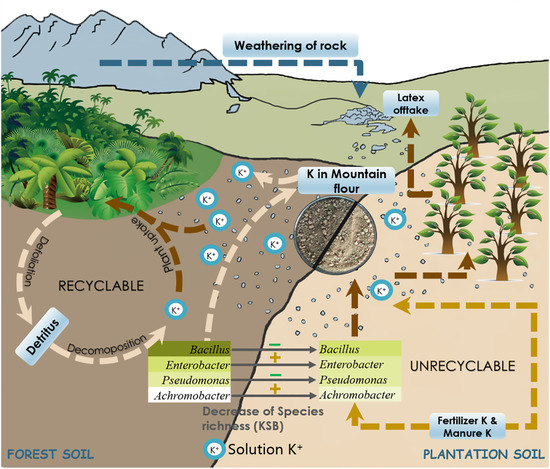
3.6. Impacts of the KSB–Soil Interactions

As shown in Table 3 and Figure 4, the abundance and diversity of KSB decreased after agricultural activities. They all showed different capacities for dissolving K-feldspar in aqueous mediums (Figure 4). The KSB in forest soil are, quantitatively, two to three times more capable than those in plantations, and have a more diverse soil KSB distribution proportion. Although some KSB species of Enterobacter did have a better capability (Figure 4), the number of KSB in forest samples was much higher than in the plantation (Table 4), which led to different K+ concentrations in the two kinds of samples, to some extent. The soil micro-organism community in the two systems varied considerably (Figure 1), and the richness of KSB in forest soils was much higher, when compared to the plantation soils.

4. Discussion

The chemical characteristics of the three soil samples showed that different elements varied with the soil sample origin. Generally, fertilizer selection and amount utilized merely depend on providing an optimal N supply, without considering the K and P content of the soil. Soluble K and P, however, are crucial for plant growth. KSB have been reported to be capable of increasing the soil K content [20]. The content of soluble K in the soil is low when not enough KSB are present. Thus, the lower content of soluble K in plantation soils (S2 and S3) may result from a lack of KSB.
The bacterial abundances, expressed by the Chao index and ACE (richness) index, were significantly different among the three treatments (i.e., S3 > S2 > S1), indicating that the utilization of fertilizer can improve bacterial growth, which is consistent with the results reported by Liu et al. [33]. The soil bacterial diversity of forest soil (S1), however, was greater than that of the plantation soils (S2 and S3), which was reflected in the Shannon and Simpson indices (Table 3), indicating that the long-term utilization of fertilizer can affect the bacterial community composition and structure [33,34,35,36,37]. It has been reported that the bacterial community composition is very sensitive to changes in the soil property; even tree defoliation can change the characteristics of the bacterial community [32,38,39,40]. It is worth noting that the contents of soluble K and P in forest soil (S1) were higher than in plantation soil (S2 and S3), owing to the tree defoliation. Interestingly, the forest soil treatment has greater bacterial diversity in comparison with plantation soil after long-term utilization of fertilizer (S2 and S3). This may result from a balanced nutrient supply, provided by fallen tree leaves. The abundance of Proteobacteria in forest and fertilized rubber tree rhizosphere soil was significantly higher than in fertilized bare soil, indicating that the abundance of Proteobacteria can be improved by adding leaf litter [41]. It has been reported that the abundance ratio between Proteobacteria and Acidobacteria is correlated with the trophic status of the soil, and lower ratios were found in oligotrophic environments [42,43]. In general, soils with a higher content of organic matter are more suitable for growth of copiotrophic bacteria, while unfertilized soil is preferred for oligotrophic growth [44,45]. As Acidobacteria and Verrucomicrobia are both classified as oligotrophic phyla, and their abundances in S1 are relatively low, S1 can be regarded as a copiotrophic soil, which may result from the tree defoliation. The similarity of bacterial community profiles from soils S2 and S3 is high—approximately 70%—in comparison with that of S1 (Figure 1B), indicating that the bacterial community structure in forest soil significantly differs from that in plantation soil, and this may result from the difference in soluble K and P content in the soil samples.
The higher content of KSB in the forest soil may have resulted from extensive rhizospheric colonization, which may have increased the diversity of the bacteria community. The concentration of K+ in forest soil is significantly higher than in plantation soil (Table 1), as organic acids secreted by KSB can react with insoluble K and convert it to plant-consumable K+ [36], and more organic acids can be secreted when the KSB level is high. More colonies (Bacillus) were identified from group I, in comparison with the other groups, demonstrating that Bacillus is the dominant group of KSB in all soils investigated. It has been reported that Bacillus and Pseudomonas are the most abundant strains of KSB isolated from the crop rhizosphere [20]. Inoculation with Enterobacter bacterial strains, which had strong activities for solubilizing potassium, was found to facilitate the mobilization of potassium efficiently in plants, when feldspar was added to the soil [46]. Interestingly, 25 Enterobacter isolates were found in S2 and S3, in comparison with one isolate in S1, meaning that the growth of Enterobacter is affected by the utilization of fertilizer. For Achromobacter, limited data was available in comparison with Bacillus, Enterobacter, and Pseudomonas [47]. In fact, only two monoclonal bacteria isolated in this study can be classified as Achromobacter, which further demonstrates that Achromobacter is not the major class of KSB.
The K-solubilizing capacity results indicated that all the strains are capable of solubilizing feldspar, but with different efficiencies. It is worth noting that there were many more types of KSB found in forest soil than in plantation soil (80, 29, and 40 types for S1, S2, and S3, respectively). Although the solubilization capability is a critical factor which affects the content of soluble K in soil, the diversity of monoclonal bacteria plays a more important role on solubilizing feldspar. In the forest, most materials will be reused in a long-term cycle. Meanwhile, KSB can continually transform structural K into soluble K, to increase available K for the whole system. However, in the plantation, this cycle has been broken by human agricultural activity. The majority of K supplementation for the plantation came from artificial fertilization. It is not difficult to speculate that the different contents of solution K in forest and plantation soils were largely due to the fertilization treatments, applied to raise economic efficiency. Chemical fertilization and green manure can directly add soluble K and change the soil microbial community [48]. In partial support of our hypothesis, the differences between the forest system and plantation system may be determined by different plant species, along with agricultural and microbial factors [49]. Forests have abundant plant resources and a complete ecological cycle. Richness of plant species and plant functional diversity have a positive influence on the overall catabolic activity and catabolic diversity of the bacterial community [49]. A previous study indicated that plant species differ in their capacity to release mineral K from the soil [50,51,52]. Agricultural activities promote singularizing plant species, and tapped rubber trees in plantation uptake massive quantities of major elements from the soil. Consequently, additional fertilization supplementation cannot maintain dissolved K at a normal level. The effect of agricultural activity is one of the causes of the K deficiency in the plantation. In a plantation system, the K cycle was unbridgeable for its economic role. Therefore, the increasing use of KSB for restoring the soil is a good way to offset the use of chemical fertilizer.

5. Conclusions

Potassium-solubilizing bacteria (KSB) from forest and plantation soils were isolated to investigate their capabilities to convert K from feldspar. Fourteen types of KSB strains were successfully identified in the soil samples collected. The results, expressed by the Chao and ACE indices, showed that the microbial abundance of samples in the plantation soils was higher than in the forest soil. The Illumina MiSeq sequencing analysis results indicated that the microbial diversity of samples from the forest soil was higher than that in the plantation soils. These results illustrate that the diversity of micro-organisms and their capability to solubilize potassium from potassium feldspar can be highly affected by human activities. Through the ARDRA analysis, strains E, I, M, and N were found to be the most effective KSB under liquid cultivation conditions. The diversity of monoclonal bacteria plays an important role in solubilizing feldspar, in comparison with the solubilization capability of KSB. As the utilization of fertilizer in plantations can significantly change the mineral content of the soil, the microbial diversity is consequently affected.

Author Contributions

Data curation, X.D., W.W. and Y.L.; formal analysis, C.Y. and Q.X.; methodology, H.Y., J.F. and X.L.; project administration, X.L.; writing—original draft, X.D. and L.L.; writing—review and editing, L.L., X.D. and L.L. contributed equally to this work. All authors were involved in literature search. All authors read and approved the final manuscript.

Funding

This research was funded by the Beijing Higher Education Youth Elite Teacher Project (No. YETP0394) and Fundamental Research Funds for the Central Universities (FRF-BR-15-006A).

Acknowledgments

The authors are grateful to the editor and anonymous reviewers for their valuable suggestions.

Conflicts of Interest

The authors declare no conflict of interest.

References

  1. Raj, S.; Das, G.; Pothen, J.; Dey, S.K. Relationship between latex yield of Hevea brasiliensis and antecedent environmental parameters. Int. J. Biometeorol. 2005, 49, 189–196. [Google Scholar] [CrossRef] [PubMed]
  2. Michels, T.; Eschbach, J.-M.; Lacote, R.; Benneveau, A.; Papy, F. Tapping panel diagnosis, an innovative on-farm decision support system for rubber tree tapping. Agron. Sustain. Dev. 2012, 32, 791–801. [Google Scholar] [CrossRef]
  3. Zörb, C.; Senbayram, M.; Peiter, E. Potassium in agriculture—Status and perspectives. J. Plant. Physiol. 2014, 171, 656–669. [Google Scholar] [CrossRef] [PubMed]
  4. Goulding, K.; Loveland, P. The classification and mapping of potassium reserves in soils of England and Wales. J. Soil Sci. 1986, 37, 555–565. [Google Scholar] [CrossRef]
  5. Amtmann, A.; Troufflard, S.; Armengaud, P. The effect of potassium nutrition on pest and disease resistance in plants. Physiol. Plant. 2008, 133, 682–691. [Google Scholar] [CrossRef] [PubMed]
  6. Pettigrew, W.T. Potassium influences on yield and quality production for maize, wheat, soybean and cotton. Physiol. Plant. 2008, 133, 670–681. [Google Scholar] [CrossRef] [PubMed]
  7. Lauber, C.L.; Hamady, M.; Knight, R.; Fierer, N. Pyrosequencing-based assessment of soil pH as a predictor of soil bacterial community structure at the continental scale. Appl. Environ. Microbiol. 2009, 75, 5111–5120. [Google Scholar] [CrossRef] [PubMed]
  8. Torsvik, V.; Ovreas, L. Microbial diversity and function in soil: from genes to ecosystems. Curr. Opin. Microbiol. 2002, 5, 240–245. [Google Scholar] [CrossRef]
  9. Garza, D.R.; Dutilh, B.E. From cultured to uncultured genome sequences: metagenomics and modeling microbial ecosystems. Cell. Mol. Life Sci. 2015, 72, 4287–4308. [Google Scholar] [CrossRef] [PubMed] [Green Version]
  10. Bartram, A.K.; Lynch, M.D.; Stearns, J.C.; Moreno-Hagelsieb, G.; Neufeld, J.D. Generation of multimillion-sequence 16S rRNA gene libraries from complex microbial communities by assembling paired-end Illumina reads. Appl. Environ. Microbiol. 2011, 77, 3846–3852. [Google Scholar] [CrossRef] [PubMed]
  11. Nacke, H.; Thürmer, A.; Wollherr, A.; Will, C.; Hodac, L.; Herold, N.; Schöning, I.; Schrumpf, M.; Daniel, R. Pyrosequencing-based assessment of bacterial community structure along different management types in German forest and grassland soils. PLoS ONE 2011, 6, e17000. [Google Scholar] [CrossRef] [PubMed]
  12. Fierer, N.; Leff, J.W.; Adams, B.J.; Nielsen, U.N.; Bates, S.T.; Lauber, C.L.; Owens, S.; Gilbert, J.A.; Wall, D.H.; Caporaso, J.G. Cross-biome metagenomic analyses of soil microbial communities and their functional attributes. Proc. Natl. Acad. Sci. USA 2012, 109, 21390–21395. [Google Scholar] [CrossRef] [PubMed] [Green Version]
  13. Sparks, D.L. Potassium Dynamics in Soils. In Advances in Soil Science; Springer: Berlin, Germany, 1987; pp. 1–63. [Google Scholar]
  14. Sugumaran, P.; Janarthanam, B. Solubilization of potassium containing minerals by bacteria and their effect on plant growth. World J. Agric. Sci. 2007, 3, 350–355. [Google Scholar]
  15. Parmar, P.; Sindhu, S. Potassium solubilization by rhizosphere bacteria: influence of nutritional and environmental conditions. J. Microbiol. Res. 2013, 3, 25–31. [Google Scholar]
  16. Masood, S.; Bano, A. Mechanism of Potassium Solubilization in the Agricultural Soils by the Help of Soil Microorganisms. In Potassium Solubilizing Microorganisms for Sustainable Agriculture; Springer: New Delhi, India, 2016; pp. 137–147. [Google Scholar]
  17. Sheng, X.F. Growth promotion and increased potassium uptake of cotton and rape by a potassium releasing strain of Bacillus edaphicus. Soil Biol. Biochem. 2005, 37, 1918–1922. [Google Scholar] [CrossRef]
  18. Basak, B.B.; Biswas, D.R. Co-inoculation of potassium solubilizing and nitrogen fixing bacteria on solubilization of waste mica and their effect on growth promotion and nutrient acquisition by a forage crop. Biol. Fert. Soils 2010, 46, 641–648. [Google Scholar] [CrossRef]
  19. Zarjani, J.K.; Aliasgharzad, N.; Oustan, S.; Emadi, M.; Ahmadi, A. Isolation and characterization of potassium solubilizing bacteria in some Iranian soils. Arch. Agron. Soil Sci. 2013, 59, 1713–1723. [Google Scholar] [CrossRef]
  20. Zhang, C.S.; Kong, F.Y. Isolation and identification of potassium-solubilizing bacteria from tobacco rhizospheric soil and their effect on tobacco plants. Appl. Soil Ecol. 2014, 82, 18. [Google Scholar] [CrossRef]
  21. Sheng, X.; He, L.; Huang, W. The conditions of releasing potassium by a silicate dissolving bacterial strain NBT. Agric. Sci. China 2002, 1, 662–666. [Google Scholar]
  22. Nutaratat, P.; Monprasit, A.; Srisuk, N. High-yield production of indole-3-acetic acid by Enterobacter sp. DMKU-RP206, a rice phyllosphere bacterium that possesses plant growth-promoting traits. 3 Biotech 2017, 7, 305. [Google Scholar] [CrossRef] [PubMed]
  23. Basak, B.; Biswas, D. Influence of potassium solubilizing microorganism (Bacillus mucilaginosus) and waste mica on potassium uptake dynamics by sudan grass (Sorghum vulgare Pers.) grown under two Alfisols. Plant. Soil 2009, 317, 235–255. [Google Scholar] [CrossRef]
  24. Han, H.; Lee, K. Phosphate and potassium solubilizing bacteria effect on mineral uptake, soil availability and growth of eggplant. Res. J. Agric. Biol. Sci. 2005, 1, 176–180. [Google Scholar]
  25. Cheng, X.; Yu, M.; Wu, T. Effect of Forest Structural Change on Carbon Storage in a Coastal Metasequoia glyptostroboides Stand. Sci. World J. 2013. [Google Scholar] [CrossRef] [PubMed]
  26. Liu, X.; Liu, Z.; Yang, L.; Guo, T.; Lv, L.; Yin, C.H.; Xu, Q.; Zhou, F.; Yan, H. Classification of potassium-releasing bacteria isolated from four agricultural soil samples. J. Pure Appl. Microbiol. 2013, 7, 3001–3008. [Google Scholar]
  27. Coico, R. Gram staining. Curr. Protoc. Microbiol. 2005. [Google Scholar] [CrossRef]
  28. Liu, X.; Yang, L.; Liu, Y.; Shanqi, M.; Lv, L.; Zhang, C.; Xu, Q.; Yan, H. Isolation and characterization of cellulose-degrading bacteria from primeval forest soil. Fresen. Environ. Bull. 2014, 23, 1802–1811. [Google Scholar]
  29. Ulrich, A.; Wirth, S. Phylogenetic diversity and population densities of culturable cellulolytic soil bacteria across an agricultural encatchment. Microb. Ecol. 1999, 37, 238–247. [Google Scholar] [CrossRef] [PubMed]
  30. Dominique, C.; Philippot, L.; Hartmann, A.; Catherine, H.; Jean-laude, G. 16s rdna analysis for characterization of denitrifying bacteria isolated from three agricultural soils. FEMS Microbiol. Ecol. 2001, 34, 121–128. [Google Scholar]
  31. Saitou, N.; Nei, M. The neighbor-joining method: a new method for reconstruction of phylogenetic trees. J. Mol. Biol. Evol. 1987, 4, 406–425. [Google Scholar]
  32. Hernesmaa, A.; Björklöf, K.; Kiikkilä, O.; Fritze, H.; Haahtela, K.; Romantschuk, M. Structure and function of microbial communities in the rhizosphere of Scots pine after tree-felling. Soil Biol. Biochem. 2005, 37, 777–785. [Google Scholar] [CrossRef]
  33. Liu, W.; Wang, Q.; Wang, B.; Wang, X.; Franks, A.E.; Teng, Y.; Li, Z.; Luo, Y. Changes in the abundance and structure of bacterial communities under long-term fertilization treatments in a peanut monocropping system. Plant. Soil 2015, 395, 415–427. [Google Scholar] [CrossRef] [Green Version]
  34. Sarathchandra, S.; Ghani, A.; Yeates, G.; Burch, G.; Cox, N. Effect of nitrogen and phosphate fertilisers on microbial and nematode diversity in pasture soils. Soil Biol. Biochem. 2001, 33, 953–964. [Google Scholar] [CrossRef]
  35. Esperschütz, J.; Gattinger, A.; Mäder, P.; Schloter, M.; Fließbach, A. Response of soil microbial biomass and community structures to conventional and organic farming systems under identical crop rotations. FEMS Microbiol. Ecol. 2007, 61, 26–37. [Google Scholar] [CrossRef] [PubMed] [Green Version]
  36. Melero, S.; Madejón, E.; Herencia, J.F.; Ruiz, J.C. Effect of implementing organic farming on chemical and biochemical properties of an irrigated loam soil. Agron. J. 2008, 100, 136. [Google Scholar] [CrossRef]
  37. Chen, D.M.; Xing, W.; Lan, Z.C.; Saleem, M.; Wu, Y.; Hu, S.J.; Bai, Y.F. Direct and indirect effects of nitrogen enrichment on soil organisms and carbon and nitrogen mineralization in a semi-arid grassland. Funct. Ecol. 2018, 33, 175–187. [Google Scholar] [CrossRef]
  38. Girvan, M.S.; Bullimore, J.; Pretty, J.N.; Osborn, A.M.; Ball, A.S. Soil type is the primary determinant of the composition of the total and active bacterial communities in arable soils. Appl. Environ. Microbiol. 2003, 69, 1800–1809. [Google Scholar] [CrossRef] [PubMed]
  39. Saha, S.; Prakash, V.; Kundu, S.; Kumar, N.; Mina, B.L. Soil enzymatic activity as affected by long term application of farm yard manure and mineral fertilizer under a rainfed soybean–wheat system in NW Himalaya. Eur. J. Soil Biol. 2008, 44, 309–315. [Google Scholar] [CrossRef]
  40. Bottomley, P.; Yarwood, R.; Kageyama, S.; Waterstripe, K.; Williams, M.; Cromack, K.; Myrold, D. Responses of soil bacterial and fungal communities to reciprocal transfers of soil between adjacent coniferous forest and meadow vegetation in the Cascade Mountains of Oregon. Plant. Soil 2006, 289, 35–45. [Google Scholar] [CrossRef]
  41. Sun, H.; Wang, Q.-X.; Liu, N.; Li, L.; Zhang, C.-G.; Liu, Z.-B.; Zhang, Y.-Y. Effects of different leaf litters on the physicochemical properties and bacterial communities in Panax ginseng-growing soil. Appl. Soil Ecol. 2017, 111, 17–24. [Google Scholar] [CrossRef]
  42. Smit, E.; Leeflang, P.; Gommans, S.; van den Broek, J.; van Mil, S.; Wernars, K. Diversity and seasonal fluctuations of the dominant members of the bacterial soil community in a wheat field as determined by cultivation and molecular methods. Appl. Environ. Microbiol. 2001, 67, 2284–2291. [Google Scholar] [CrossRef] [PubMed]
  43. Hartman, W.H.; Richardson, C.J.; Vilgalys, R.; Bruland, G.L. Environmental and anthropogenic controls over bacterial communities in wetland soils. Proc. Natl. Acad. Sci. USA 2008, 105, 17842–17847. [Google Scholar] [CrossRef] [PubMed] [Green Version]
  44. Thomson, B.C.; Ostle, N.; McNamara, N.; Bailey, M.J.; Whiteley, A.S.; Griffiths, R.I. Vegetation affects the relative abundances of dominant soil bacterial taxa and soil respiration rates in an upland grassland soil. Microb. Ecol. 2010, 59, 335–343. [Google Scholar] [CrossRef] [PubMed]
  45. Cederlund, H.; Wessén, E.; Enwall, K.; Jones, C.M.; Juhanson, J.; Pell, M.; Philippot, L.; Hallin, S. Soil carbon quality and nitrogen fertilization structure bacterial communities with predictable responses of major bacterial phyla. Appl. Soil Ecol. 2014, 84, 62–68. [Google Scholar] [CrossRef]
  46. Yuan, Z.S.; Liu, F.; Zhang, G.F. Characteristics and biodiversity of endophytic phosphorus- and potassium-solubilizing bacteria in Moso Bamboo (Phyllostachys edulis). Acta Biol. Hung. 2015, 66, 449–459. [Google Scholar] [CrossRef] [PubMed] [Green Version]
  47. Sayer, E.J. Using experimental manipulation to assess the roles of leaf litter in the functioning of forest ecosystems. Biol. Rev. 2006, 81, 1–31. [Google Scholar] [CrossRef] [PubMed]
  48. Geisseler, D.; Scow, K.M. Long-term effects of mineral fertilizers on soil microorganisms—A review. Soil Biol. Biochem. 2014, 75, 54–63. [Google Scholar] [CrossRef]
  49. Stephan, A.; Meyer, A.H.; Schmid, B. Plant diversity affects culturable soil bacteria in experimental grassland communities. J. Ecol. 2000, 88, 988–998. [Google Scholar] [CrossRef] [Green Version]
  50. Wang, J.; Zhang, F.; Cao, Y.; Zhang, X. Effect of plant types on release of mineral potassium from gneiss. Nutr. Cycl. Agroecosyst. 2000, 56, 37–43. [Google Scholar] [CrossRef]
  51. Moritsuka, N.; Yanai, J.; Kosaki, T. Possible processes releasing nonexchangeable potassium from the rhizosphere of maize. Plant. Soil 2004, 258, 261–268. [Google Scholar] [CrossRef]
  52. Wang, H.-Y.; Shen, Q.-H.; Zhou, J.-M.; Wang, J.; Du, C.-W.; Chen, X.-Q. Plants use alternative strategies to utilize nonexchangeable potassium in minerals. Plant. Soil 2011, 343, 209–220. [Google Scholar] [CrossRef]
Figure 1. (A) Taxonomic distribution of soil samples, phylum distribution of all samples; (B) genus distribution of all samples. S1: forest soil; S2: fertilized rubber tree rhizosphere soil from a rubber tree plantation; S3: fertilized bare soil from a plantation.
Ijerph 16 00700 g001
Figure 2. Dendrogram of different denitrifying isolate types. The dendrogram was based on 16S Amplified Ribosomal DNA Restriction Analysis (ARDRA) patterns obtained from soils S1, S2, and S3. The letter indicates the ARDRA type and the numbers in parentheses are the numbers of isolates for each type.
Ijerph 16 00700 g002
Figure 3. Phylogenetic trees based on the 16S rDNA sequencing, drawn by MEGA 6.06.
Ijerph 16 00700 g003
Figure 4. Potassium-solubilizing activity of KSB isolates in aqueous medium. Each bar represents a mean (± standard deviation) value of soluble K content in mg L−1. Uninoculated solution was used as a control (first bar). The black lines on the column chart are the marks of the standard error (SE) for three samples from three replications. (p < 0.05).
Ijerph 16 00700 g004
Table 1. Basic properties of the soil used in this study.
Soil SampleK+ (mg/g)Mg2+ (mg/g)P (mg/g)N (mg/g)Si (mg/g)
S10.029 ± 0.0070.006 ± 0.0010.022 ± 0.0025.366 ± 0.2230.099 ± 0.007
S20.009 ± 0.0020.044 ± 0.0050.016 ± 0.0043.805 ± 0.3460.04 ± 0.012
S30.004 ± 0.0020.056 ± 0.0120.012 ± 0.0065.476 ± 0.4780.042 ± 0.005
S1: forest soil, S2: fertilized rubber tree rhizosphere soil from a rubber tree plantation, S3: fertilized bare soil from a plantation.
Table 2. Enumeration (bacterial number·g−1 soil) of total bacteria (TB) and potassium-solubilizing bacteria (KSB) from soils S1, S2, and S3, and the relative abundance of the cellulose-degrading bacteria of each soil.
Soil SampleS1S2S3
TB653531494
KSB802940
KSB/TB (%)12.25%5.46%8.10%
Table 3. MiSeq sequencing results and diversity estimates for each sample.
SampleSequencing ResultsDiversity Estimates
ReadsOTUsACEChaoShannonSimpson
S116,0137387647645.820.0054
S216,2247027817825.430.0097
S326,1518038488585.320.0151
The operational taxonomic units (OTUs) were defined with 97% similarity. The coverage percentages, richness estimators (abundance-based coverage estimator (ACE) and Chao), and diversity indices (Shannon and Simpson) were calculated.
Table 4. Number of isolates from samples S1, S2, and S3, classified by Gram typing, sequence analysis, and Amplified Ribosomal DNA Restriction Analysis (ARDRA) typing.
GramGenusARDRA S1S2S3Total
+BacillusGroup (I)
A170017
B8008
C120113
E140014
F0415
G28010
H107219
EnterobacterGroup (II)
I0303
J0516
K0178
L1089
PseudomonasGroup (III)
D161118
N001717
AchromobacterGroup (IV)
M0022
Total802940149
S1: forest soil; S2: fertilized rubber tree rhizosphere soil from a rubber tree plantation; S3: fertilized bare soil from a plantation; +: Gram positive; −: Gram negative

