Fine Particulate Matter and Respiratory Healthcare Encounters among Survivors of Childhood Cancers


 and
and
Abstract
1. Introduction
2. Materials and Methods
2.1. Procedures
2.2. Event Day Selection
2.3. Control Day Selection
2.4. Event and Control Days in a Cancer-Free Sample
2.5. PM2.5 Exposure Assessment
2.6. Variables Used in Stratified Analyses
2.7. Statistical Analyses
3. Results
3.1. Respiratory Hospitalizations
3.2. Respiratory Emergency Department Visits
3.3. Respiratory Infections
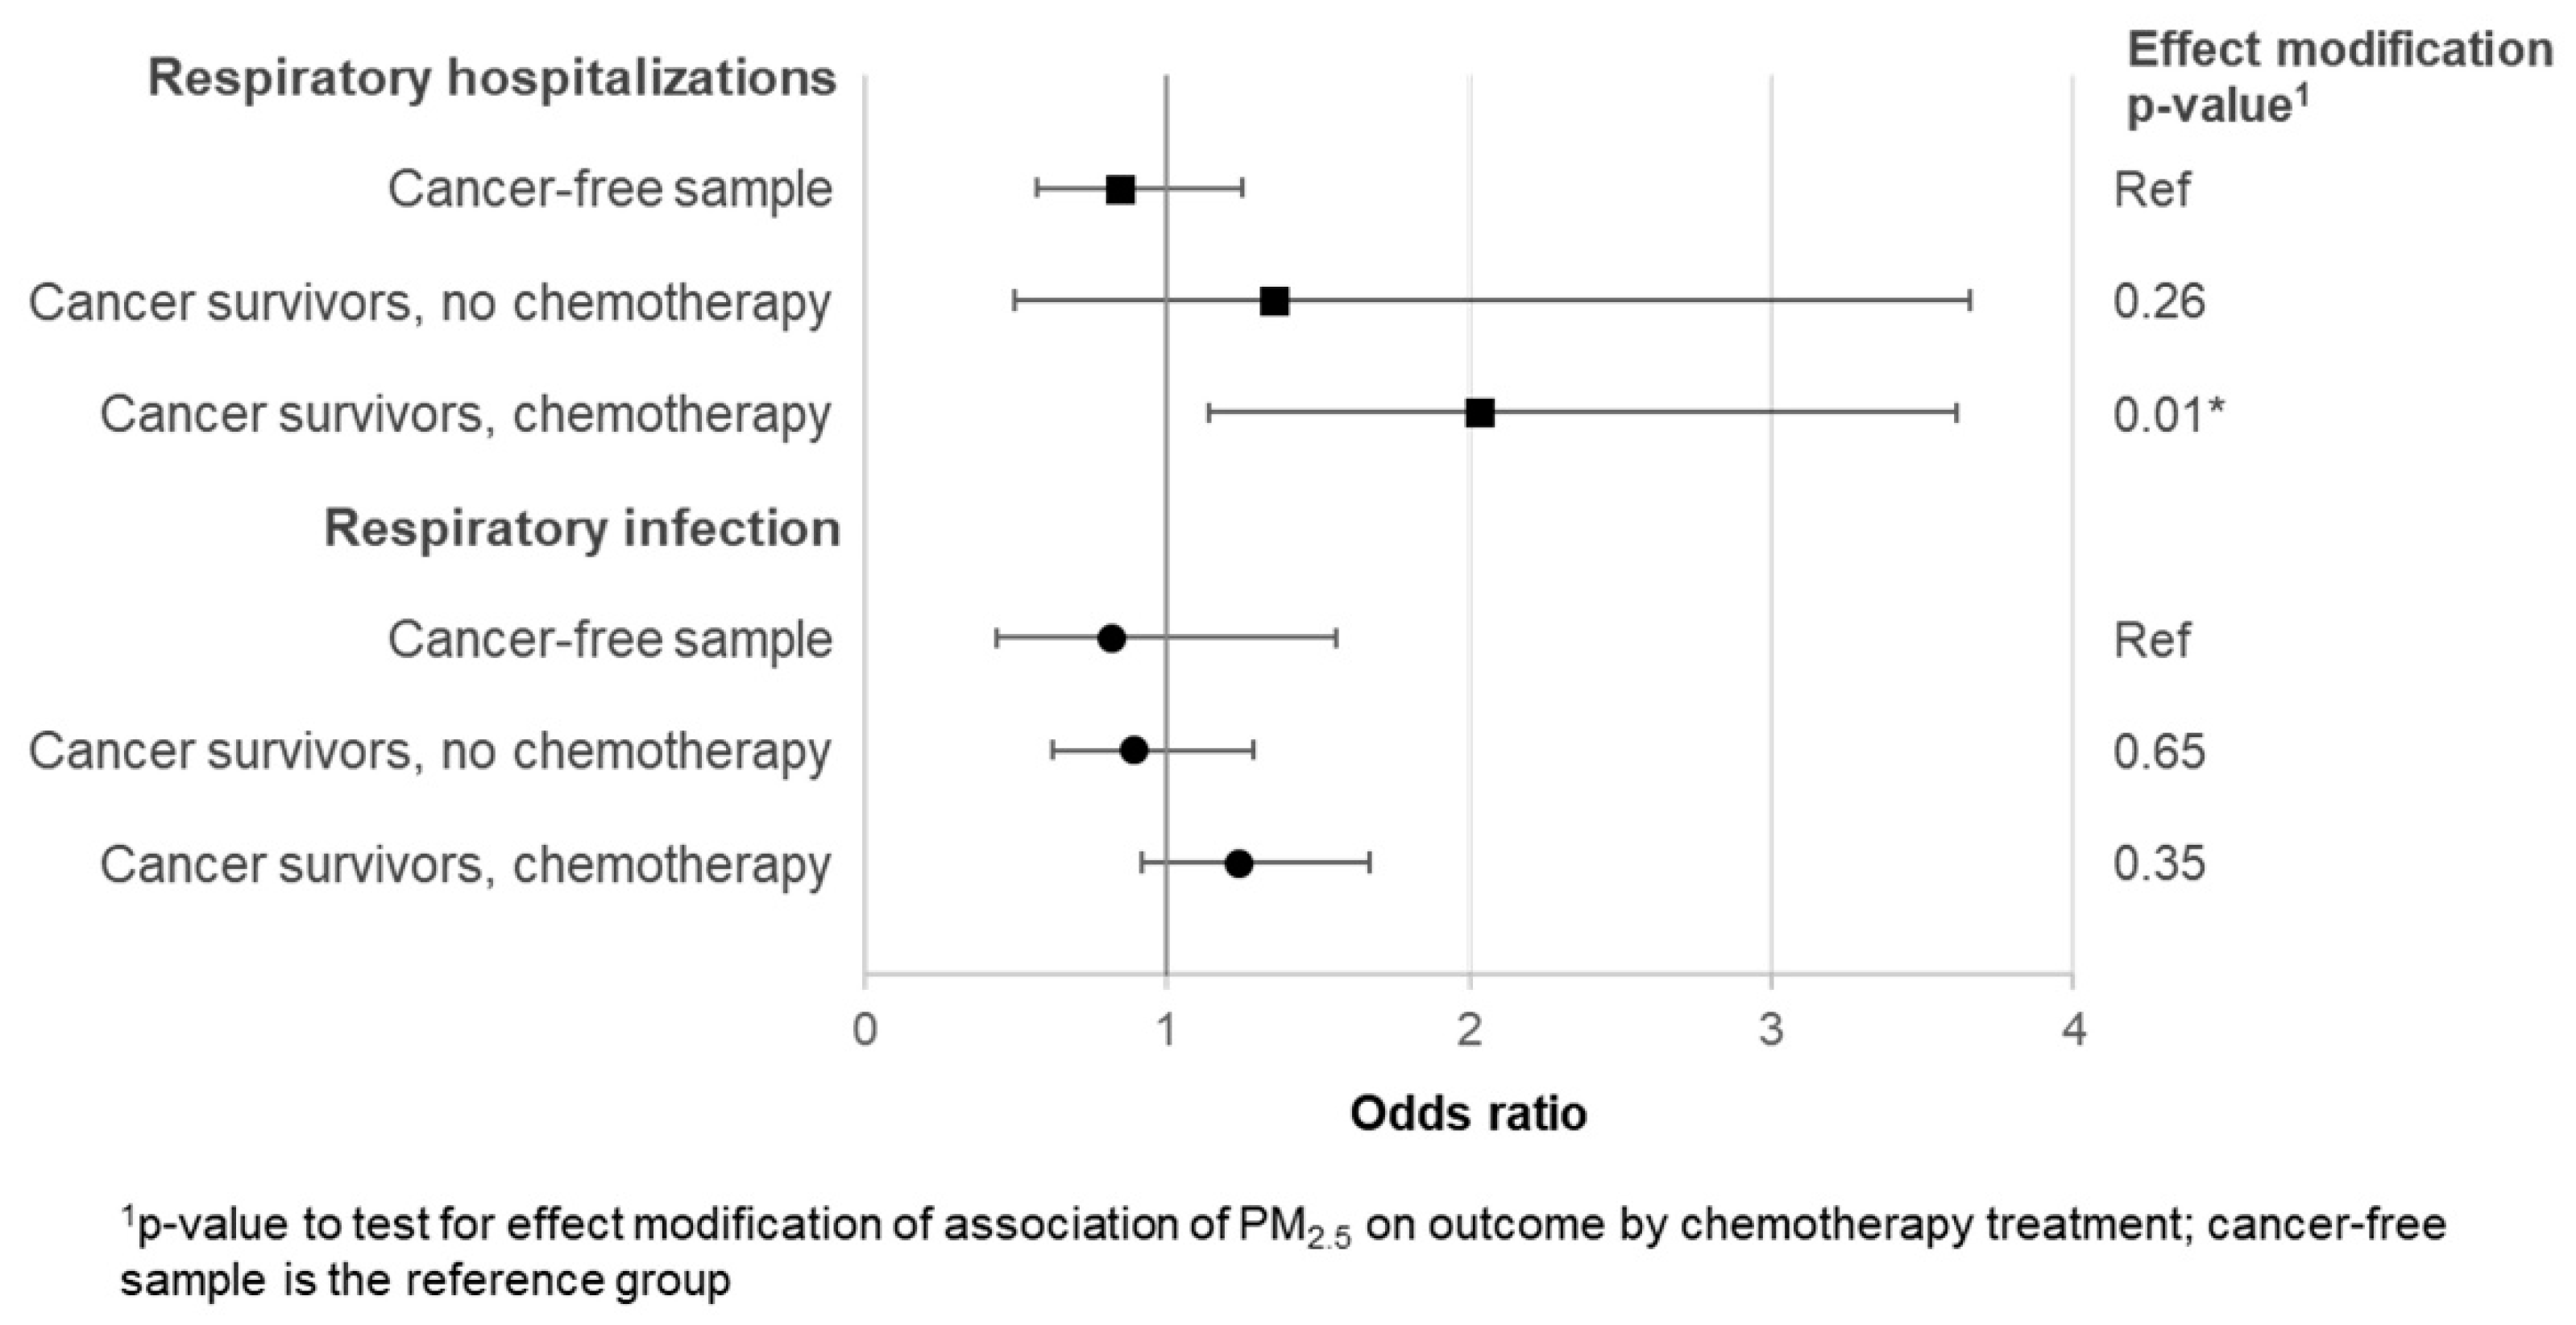
3.4. Comparison of Odds among Chemotherapy-Treated Survivors, Surgery or Radiation Only Survivors, and a Cancer Free-Sample
4. Discussion
Limitations
5. Conclusions
Author Contributions
Funding
Acknowledgments
Conflicts of Interest
Appendix A

| Main and Stratified Models | OR | 95% CI |
|---|---|---|
| All healthcare encounters | 1.10 | 0.92–1.31 |
| Stratified Models | ||
| Cause of admission | ||
| Respiratory infection | 1.08 | 0.86–1.36 |
| Respiratory disease | 1.08 | 0.76–1.54 |
| Asthma | 1.19 | 0.75–1.87 |
| Race/ethnicity | ||
| Hispanic/Other | 1.43 | 0.99–2.05 |
| White, Non-Hispanic | 1.01 | 0.83–1.24 |
| Cancer diagnosis | ||
| Leukemia | 1.38 | 0.98–1.96 |
| Lymphomas | 0.84 | 0.58–1.21 |
| CNS neoplasms | 0.83 | 0.54–1.30 |
| Sarcoma/bone tumors | 1.29 | 0.89–1.88 |
| Other solid tumors | 2.23 | 0.80–6.21 |
| Previous chemotherapy | ||
| No | 0.87 | 0.63–1.20 |
| Yes | 1.23 | 0.99–1.53 |
| Age at diagnosis (years) | ||
| 0 to 3 | 1.65 * | 1.17–2.34 |
| 4 to 10 | 1.13 | 0.80–1.59 |
| 11 to 18 | 0.73 | 0.47–1.14 |
| 19 to 26 | 0.89 | 0.59–1.34 |
| Years since diagnosis | ||
| 5 to 9 | 1.09 | 0.85–1.39 |
| ≥10 | 1.12 | 0.87–1.44 |
References
- Schwartz, J. Air pollution and children’s health. Pediatrics 2004, 113, 1037–1043. [Google Scholar]
- Strickland, M.J.; Darrow, L.A.; Klein, M.; Flanders, W.D.; Sarnat, J.A.; Waller, L.A.; Sarnat, S.E.; Mulholland, J.A.; Tolbert, P.E. Short-term associations between ambient air pollutants and pediatric asthma emergency department visits. Am. J. Respir. Crit. Care Med. 2010, 182, 307–316. [Google Scholar] [CrossRef]
- Ostro, B.; Roth, L.; Malig, B.; Marty, M. The effects of fine particle components on respiratory hospital admissions in children. Environ. Health Perspect. 2009, 117, 475–480. [Google Scholar] [CrossRef]
- Lin, M.; Stieb, D.M.; Chen, Y. Coarse particulate matter and hospitalization for respiratory infections in children younger than 15 years in Toronto: A case-crossover analysis. Pediatrics 2005, 116, e235–e240. [Google Scholar] [CrossRef]
- American Academy of Pediatrics. Ambient Air Pollution: Health Hazards to Children. Pediatrics 2004, 114, 1699–1707. [Google Scholar] [CrossRef] [PubMed]
- Goeminne, P.C.; Kicinski, M.; Vermeulen, F.; Fierens, F.; De Boeck, K.; Nemery, B.; Nawrot, T.S.; Dupont, L.J. Impact of air pollution on cystic fibrosis pulmonary exacerbations: A case-crossover analysis. Chest 2013, 143, 946–954. [Google Scholar] [CrossRef] [PubMed]
- Goss, C.H.; Newsom, S.A.; Schildcrout, J.S.; Sheppard, L.; Kaufman, J.D. Effect of ambient air pollution on pulmonary exacerbations and lung function in cystic fibrosis. Am. J. Respir. Crit. Care Med. 2004, 169, 816–821. [Google Scholar] [CrossRef] [PubMed]
- Steele, R.W. Managing Infection in Cancer Patients and Other Immunocompromised Children. Ochsner J. 2012, 12, 202–210. [Google Scholar]
- Chow, E.J.; Anderson, L.; Baker, K.S.; Bhatia, S.; Guilcher, G.M.; Huang, J.T.; Pelletier, W.; Perkins, J.L.; Rivard, L.S.; Schechter, T.; et al. Late Effects Surveillance Recommendations among Survivors of Childhood Hematopoietic Cell Transplantation: A Children’s Oncology Group Report. Biol. Blood Marrow Transplant. 2016, 22, 782–795. [Google Scholar] [CrossRef] [PubMed]
- Kirchhoff, A.C.; Fluchel, M.N.; Wright, J.; Ying, J.; Sweeney, C.; Bodson, J.; Stroup, A.M.; Smith, K.R.; Fraser, A.; Kinney, A.Y. Risk of hospitalization for survivors of childhood and adolescent cancer. Cancer Epidemiol. Biomark. Prev. 2014, 23, 1280–1289. [Google Scholar] [CrossRef]
- Kurt, B.A.; Nolan, V.G.; Ness, K.K.; Neglia, J.P.; Tersak, J.M.; Hudson, M.M.; Armstrong, G.T.; Hutchinson, R.J.; Leisenring, W.M.; Oeffinger, K.C.; et al. Hospitalization rates among survivors of childhood cancer in the Childhood Cancer Survivor Study cohort. Pediatr. Blood Cancer 2012, 59, 126–132. [Google Scholar] [CrossRef]
- Zhang, Y.; Lorenzi, M.F.; Goddard, K.; Spinelli, J.J.; Gotay, C.; McBride, M.L. Late morbidity leading to hospitalization among 5-year survivors of young adult cancer: A report of the childhood, adolescent and young adult cancer survivors research program. Int. J. Cancer 2014, 134, 1174–1182. [Google Scholar] [CrossRef]
- Huang, T.T.; Hudson, M.M.; Stokes, D.C.; Krasin, M.J.; Spunt, S.L.; Ness, K.K. Pulmonary outcomes in survivors of childhood cancer: A systematic review. Chest 2011, 140, 881–901. [Google Scholar] [CrossRef] [PubMed]
- Mertens, A.C.; Yasui, Y.; Liu, Y.; Stovall, M.; Hutchinson, R.; Ginsberg, J.; Sklar, C.; Robison, L.L. Pulmonary complications in survivors of childhood and adolescent cancer: A report from the Childhood Cancer Survivor Study. Cancer 2002, 95, 2431–2441. [Google Scholar] [CrossRef]
- Armenian, S.H.; Landier, W.; Francisco, L.; Herrera, C.; Mills, G.; Siyahian, A.; Supab, N.; Wilson, K.; Wolfson, J.A.; Horak, D.; et al. Long-term pulmonary function in survivors of childhood cancer. J. Clin. Oncol. 2015, 33, 1592–1600. [Google Scholar] [CrossRef] [PubMed]
- Green, D.M.; Zhu, L.; Wang, M.; Ness, K.K.; Krasin, M.J.; Bhakta, N.H.; McCarville, M.B.; Srinivasan, S.; Stokes, D.C.; Srivastava, D.; et al. Pulmonary Function after Treatment for Childhood Cancer. A Report from the St. Jude Lifetime Cohort Study (SJLIFE). Ann. Am. Thorac. Soc. 2016, 13, 1575–1585. [Google Scholar] [CrossRef] [PubMed]
- Armstrong, G.T.; Liu, Q.; Yasui, Y.; Neglia, J.P.; Leisenring, W.; Robison, L.L.; Mertens, A.C. Late mortality among 5-year survivors of childhood cancer: A summary from the Childhood Cancer Survivor Study. J. Clin. Oncol. 2009, 27, 2328–2338. [Google Scholar] [CrossRef] [PubMed]
- Perkins, J.L.; Chen, Y.; Harris, A.; Diller, L.; Stovall, M.; Armstrong, G.T.; Yasui, Y.; Robison, L.L.; Sklar, C.A. Infections among long-term survivors of childhood and adolescent cancer: A report from the Childhood Cancer Survivor Study. Cancer 2014, 120, 2514–2521. [Google Scholar] [CrossRef]
- Pirozzi, C.S.; Jones, B.E.; VanDerslice, J.A.; Zhang, Y.; Paine, R., 3rd; Dean, N.C. Short-Term Air Pollution and Incident Pneumonia: A Case-Crossover Study. Ann. Am. Thorac. Soc. 2018, 15, 449–459. [Google Scholar] [CrossRef]
- Horne, B.D.; Joy, E.A.; Hofmann, M.G.; Gesteland, P.H.; Cannon, J.B.; Lefler, J.S.; Blagev, D.P.; Korgenski, E.K.; Torosyan, N.; Hansen, G.I.; et al. Short-term Elevation of Fine Particulate Matter Air Pollution and Acute Lower Respiratory Infection. Am. J. Respir. Crit. Care Med. 2018, 198, 759–766. [Google Scholar] [CrossRef] [PubMed]
- Pope, C.A., 3rd. Mortality effects of longer term exposures to fine particulate air pollution: Review of recent epidemiological evidence. Inhal. Toxicol. 2007, 19 (Suppl. 1), 33–38. [Google Scholar] [CrossRef] [PubMed]
- Pope, C.A., 3rd; Hill, R.W.; Villegas, G.M. Particulate air pollution and daily mortality on Utah’s Wasatch Front. Environ. Health Perspect. 1999, 107, 567–573. [Google Scholar] [CrossRef] [PubMed]
- Utah Department of Environmental Quality; Division of Air Quality. Understanding Utah’s Air Quality. Available online: https://deq.utah.gov/communication/news/featured/understanding-utahs-air-quality (accessed on 28 January 2019).
- Silcox, G.D.; Kelly, K.E.; Crosman, E.T.; Whiteman, C.D.; Allen, B.L. Wintertime PM2.5 concentrations during persistent, multi-day cold-air pools in a mountain valley. Atmos. Environ. 2012, 46, 17–24. [Google Scholar] [CrossRef]
- Environmental Protection Agency. Criteria Air Pollutants. Available online: https://www.epa.gov/criteria-air-pollutants (accessed on 13 June 2016).
- American Lung Association. Most Polluted Cities. Available online: http://www.lung.org/our-initiatives/healthy-air/sota/city-rankings/most-polluted-cities.html (accessed on 20 July 2018).
- Di, Q.; Dai, L.; Wang, Y.; Zanobetti, A.; Choirat, C.; Schwartz, J.D.; Dominici, F. Association of short-term exposure to air pollution with mortality in older adults. JAMA 2017, 318, 2446–2456. [Google Scholar] [CrossRef] [PubMed]
- Janes, H.; Sheppard, L.; Lumley, T. Case-crossover analyses of air pollution exposure data: Referent selection strategies and their implications for bias. Epidemiology 2005, 16, 717–726. [Google Scholar] [CrossRef]
- Bateson, T.F.; Schwartz, J. Selection Bias and Confounding in Case-Crossover Analyses of Environmental Time-Series Data. Epidemiology 2001, 12, 654–661. [Google Scholar] [CrossRef]
- Carracedo-Martínez, E.; Taracido, M.; Tobias, A.; Saez, M.; Figueiras, A. Case-crossover analysis of air pollution health effects: A systematic review of methodology and application. Environ. Health Perspect. 2010, 118, 1173–1182. [Google Scholar] [CrossRef]
- Kaul, S.; Barbeau, B.; Wright, J.; Fluchel, M.; Kirchhoff, A.C.; Nelson, R.E. Statewide Longitudinal Hospital Use and Charges for Pediatric and Adolescent Patients With Cancer. J. Oncol. Pract. 2015, 11, e468–e475. [Google Scholar] [CrossRef]
- Ou, J.Y.; Smits-Seemann, R.R.; Kaul, S.; Fluchel, M.N.; Sweeney, C.; Kirchhoff, A.C. Risk of hospitalization among survivors of childhood and adolescent acute lymphoblastic leukemia compared to siblings and a general population sample. Cancer Epidemiol. 2017, 49, 216–224. [Google Scholar] [CrossRef] [PubMed]
- Albritton, K.H.; Wiggins, C.H.; Nelson, H.E.; Weeks, J.C. Site of oncologic specialty care for older adolescents in Utah. J. Clin. Oncol. 2007, 25, 4616–4621. [Google Scholar] [CrossRef]
- Spraker-Perlman, H.; Smits-Seeman, R.R.; Li, H.; Kirchhoff, A.C. Statewide Treatment Center Referral Patterns for Adolescent and Young Adult Patients with Cancer in Utah. J. Adolesc. Young Adult Oncol. 2018. [Google Scholar] [CrossRef]
- DuVall, S.L.; Fraser, A.M.; Rowe, K.; Thomas, A.; Mineau, G.P. Evaluation of record linkage between a large healthcare provider and the Utah Population Database. J. Am. Med. Inform. Assoc. 2012, 19, e54–e59. [Google Scholar] [CrossRef]
- US EPA Air Quality System. Air Quality Stytem Data Mart. Available online: https://aqs.epa.gov/aqsweb/documents/data_mart_welcome.html (accessed on 11 April 2016).
- Davidson, L. Urbanites: Nine of 10 Utahns Live on 1 Percent of State’s Land. Salt Lake Tribune, 27 March 2012. [Google Scholar]
- Pope, C.A.; Muhlestein, J.B.; May, H.T.; Renlund, D.G.; Anderson, J.L.; Horne, B.D. Ischemic heart disease events triggered by short-term exposure to fine particulate air pollution. Circulation 2006, 114, 2443–2448. [Google Scholar] [CrossRef] [PubMed]
- Yorifuji, T.; Suzuki, E.; Kashima, S. Hourly differences in air pollution and risk of respiratory disease in the elderly: A time-stratified case-crossover study. Environ. Health 2014, 13, 67. [Google Scholar] [CrossRef] [PubMed]
- Department of Atmospheric Sciences at the University of Utah. MesoWest. Available online: http://mesowest.utah.edu/ (accessed on 3 March 2019).
- University of Utah. Pedigree and Population Resource: Utah Population Database. Available online: http://healthcare.utah.edu/huntsmancancerinstitute/research/updb/ (accessed on 18 March 2019).
- Wang, S.V.; Coull, B.A.; Schwartz, J.; Mittleman, M.A.; Wellenius, G.A. Potential for Bias in Case-Crossover Studies With Shared Exposures Analyzed Using SAS. Am. J. Epidemiol. 2011, 174, 118–124. [Google Scholar] [CrossRef] [PubMed]
- O’Lenick, C.R.; Winquist, A.; Mulholland, J.A.; Friberg, M.D.; Chang, H.H.; Kramer, M.R.; Darrow, L.A.; Sarnat, S.E. Assessment of neighbourhood-level socioeconomic status as a modifier of air pollution-asthma associations among children in Atlanta. J. Epidemiol. Community Health 2017, 71, 129–136. [Google Scholar] [CrossRef] [PubMed]
- Ren, C.; Melly, S.; Schwartz, J. Modifiers of short-term effects of ozone on mortality in eastern Massachusetts—A casecrossover analysis at individual level. Environ. Health 2010, 9, 3. [Google Scholar] [CrossRef] [PubMed]
- Utah Department of Environmental Quality. Salt Lake County-Current Conditions. Available online: http://air.utah.gov/ (accessed on 1 March 2019).
- Phillips, S.M.; Padgett, L.S.; Leisenring, W.M.; Stratton, K.K.; Bishop, K.; Krull, K.R.; Alfano, C.M.; Gibson, T.M.; de Moor, J.S.; Hartigan, D.B.; et al. Survivors of childhood cancer in the United States: Prevalence and burden of morbidity. Cancer Epidemiol. Biomark. Prev. 2015, 24, 653–663. [Google Scholar] [CrossRef]
- American Lung Association. The State of the Air 2017. Available online: http://www.lung.org/our-initiatives/healthy-air/sota/key-findings/ (accessed on 20 May 2018).
- Gomez, S.L.; Shariff-Marco, S.; De Rouen, M.; Keegan, T.H.M.; Yen, I.H.; Mujahid, M.; Satariano, W.A.; Glaser, S.L. The Impact of Neighborhood Social and Built Environment Factors across the Cancer Continuum: Current Research, Methodologic Considerations, and Future Directions. Cancer 2015, 121, 2314–2330. [Google Scholar] [CrossRef]
- Mazur, B.; Szczepanski, T.; Karpe, J.; Sonta-Jakimczyk, D.; Bubala, H.; Torbus, M. Decreased numbers of CD4+ T lymphocytes in peripheral blood after treatment of childhood acute lymphoblastic leukemia. Leuk. Res. 2006, 30, 33–36. [Google Scholar] [CrossRef] [PubMed]
- Alanko, S.; Pelliniemi, T.T.; Salmi, T.T. Recovery of blood lymphocytes and serum immunoglobulins after treatment of solid tumors in children. Pediatr. Hematol. Oncol. 1994, 11, 33–45. [Google Scholar] [CrossRef]
- Chauhan, A.J.; Johnston, S.L. Air pollution and infection in respiratory illness. Br. Med. Bull. 2003, 68, 95–112. [Google Scholar] [CrossRef] [PubMed]
- American Cancer Society. Treatment of Children with Acute Lymphocytic Leukemia (ALL). Available online: https://www.cancer.org/cancer/leukemia-in-children/treating/children-with-all.html (accessed on 10 December 2018).
- Miller, K.D.; Siegel, R.L.; Lin, C.C.; Mariotto, A.B.; Kramer, J.L.; Rowland, J.H.; Stein, K.D.; Alteri, R.; Jemal, A. Cancer treatment and survivorship statistics, 2016. CA Cancer J. Clin. 2016, 66, 271–289. [Google Scholar] [CrossRef]
- Smits-Seemann, R.R.; Pettit, J.; Li, H.; Kirchhoff, A.C.; Fluchel, M.N. Infection-related mortality in Hispanic and non-Hispanic children with cancer. Pediatr. Blood Cancer 2017, 64, e26502. [Google Scholar] [CrossRef]
- Pratt, G.C.; Vadali, M.L.; Kvale, D.L.; Ellickson, K.M. Traffic, air pollution, minority and socio-economic status: Addressing inequities in exposure and risk. Int. J. Environ. Res. Public Health 2015, 12, 5355–5372. [Google Scholar] [CrossRef] [PubMed]
- Hipp, J.R.; Lakon, C.M. Social disparities in health: Disproportionate toxicity proximity in minority communities over a decade. Health Place 2010, 16, 674–683. [Google Scholar] [CrossRef]
- Ramsay, J.M.; Ou, J.Y.; Fluchel, M.N.; Kirchhoff, A.C. Respiratory emergency department use from diagnosis through survivorship in children, adolescents, and young adults with cancer. Cancer 2018, 124, 3924–3933. [Google Scholar] [CrossRef]
- Kaul, S.; Russell, H.; Livingston, J.A.; Kirchhoff, A.C.; Jupiter, D. Emergency Department Visits by Adolescent and Young Adult Cancer Patients Compared with Pediatric Cancer Patients in the United States. J. Adolesc. Young Adult Oncol. 2018, 7, 553–564. [Google Scholar] [CrossRef]
- Uscher-Pines, L.; Pines, J.; Kellermann, A.; Gillen, E.; Mehrotra, A. Emergency department visits for nonurgent conditions: Systematic literature review. Am. J. Manag. Care 2013, 19, 47–59. [Google Scholar] [PubMed]
- Weiss, A.J.; Wier, L.M.; Stocks, C.; Blanchard, J. Overview of Emergency Department Visits in the United States, 2011: Statistical Brief #174; Agency for Healthcare Research and Quality (US): Rockville, MD, USA, 2014.
- United States Environmental Protection Agency. National Ambient Air Quality Standards (NAAQS). Available online: https://www.epa.gov/criteria-air-pollutants/naaqs-table (accessed on 21 January 2019).
- Landier, W.; Bhatia, S.; Eshelman, D.A.; Forte, K.J.; Sweeney, T.; Hester, A.L.; Darling, J.; Armstrong, F.D.; Blatt, J.; Constine, L.S.; et al. Development of risk-based guidelines for pediatric cancer survivors: The Children’s Oncology Group Long-Term Follow-Up Guidelines from the Children’s Oncology Group Late Effects Committee and Nursing Discipline. J. Clin. Oncol. 2004, 22, 4979–4990. [Google Scholar] [CrossRef] [PubMed]
- Centers for Disease Control and Prevention; U.S. Environmental Protection Agency. Air Quality and Outdoor Activity Guidance for Schools. Available online: https://www.cdc.gov/nceh/airpollution/airquality/pdfs/Air_Quality_and_Outdoor_Activity_Guidance.pdf (accessed on 27 November 2018).
- Hennessy, S.; Bilker, W.B.; Berlin, J.A.; Strom, B.L. Factors influencing the optimal control-to-case ratio in matched case-control studies. Am. J. Epidemiol. 1999, 149, 195–197. [Google Scholar] [CrossRef] [PubMed]
- Surveillance Epidemiology and End Results Program (SEER). Cancer Incidence and Survival among Children and Adolescents: United States SEER Program: 1975–1995. Available online: http://www.acco.org/wp-content/uploads/2014/11/Seer-Report.pdf (accessed on 21 January 2019).
- Armenian, S.H.; Robison, L.L. Childhood Cancer Survivorship: An Update on Evolving Paradigms for Understanding Pathogenesis and Screening for Therapy-Related Late Effects. Curr. Opin. Pediatr. 2013, 25, 16–22. [Google Scholar] [CrossRef] [PubMed]

| Causes of Ddmission | Event Days | Control Days | Total Days |
|---|---|---|---|
| n | n | n | |
| Total number of days | 335 | 1156 | 1491 |
| Total hospitalizations | 68 | 233 | 301 |
| Total ED visits | 267 | 923 | 1190 |
| Respiratory infections | |||
| Hospitalizations | 41 | 141 | 182 |
| ED visits | 175 | 606 | 781 |
| Respiratory disease | |||
| Hospitalizations | 25 | 85 | 110 |
| ED visits | 64 | 222 | 286 |
| Asthma | |||
| Hospitalizations | ^ | 7 | 9 |
| ED visits | 28 | 95 | 123 |
| Mean | Range | ||
| Average 3-day PM2.5 (µg/m3) | 10.0 | 1.15–68.7 | |
| Average 3-day temperature (°C) | 8.4 | −22.0 to 36.1 |
| Sample Characteristics | Survivors | All Event Days | Hospitalizations | ED Visits | ||||
|---|---|---|---|---|---|---|---|---|
| n | % | n | % | n | % | n | % | |
| Total | 185 | 335 | 68 | 267 | ||||
| Sex | ||||||||
| Female | 75 | 40.5 | 136 | 40.6 | 27 | 39.7 | 109 | 40.8 |
| Male | 110 | 59.5 | 199 | 59.4 | 41 | 60.3 | 158 | 59.2 |
| Race/ethnicity 1 | ||||||||
| Hispanic/other | 30 | 16.2 | 59 | 17.6 | 12 | 17.7 | 47 | 17.6 |
| White, Non-Hispanic | 154 | 83.2 | 275 | 82.1 | 56 | 82.4 | 219 | 82.0 |
| Cancer diagnosis | ||||||||
| Leukemia | 48 | 26.0 | 88 | 26.3 | 12 | 17.7 | 76 | 28.5 |
| Lymphomas | 43 | 23.2 | 91 | 27.2 | 19 | 27.9 | 72 | 27.0 |
| CNS neoplasms | 38 | 20.5 | 76 | 22.7 | 16 | 23.5 | 60 | 22.5 |
| Sarcomas/bone tumors | 42 | 22.7 | 61 | 18.2 | 15 | 22.1 | 46 | 17.2 |
| Other solid tumors | 14 | 7.6 | 19 | 5.7 | 6 | 8.8 | 13 | 4.9 |
| Age at diagnosis (years) | ||||||||
| 0 to 3 | 52 | 28.1 | 97 | 29.0 | 18 | 26.5 | 79 | 29.6 |
| 4 to 10 | 42 | 22.7 | 75 | 22.4 | 15 | 22.1 | 60 | 22.5 |
| 11 to 18 | 47 | 25.4 | 75 | 22.4 | 11 | 16.2 | 64 | 24.0 |
| 19 to 25 | 44 | 23.8 | 88 | 26.3 | 24 | 35.3 | 64 | 24.0 |
| Years since diagnosis | ||||||||
| 5 to 9 | 115 | 62.2 | 188 | 56.1 | 44 | 64.7 | 144 | 53.9 |
| 10 to 29 | 70 | 37.8 | 147 | 43.9 | 24 | 35.3 | 123 | 46.1 |
| Chemotherapy | ||||||||
| No | 65 | 35.1 | 135 | 40.3 | 23 | 33.8 | 112 | 42.0 |
| Yes | 120 | 64.9 | 200 | 59.7 | 45 | 66.2 | 155 | 58.1 |
| Main and Stratified Hospitalization Models | Odds Ratio | 95% CI |
|---|---|---|
| Main effect | 1.84 * | 1.13–3.00 |
| Stratified Models | ||
| Cause of admission | ||
| Respiratory infection | 2.09 * | 1.06–4.14 |
| Respiratory disease | 1.68 | 0.81–3.40 |
| Race/ethnicity | ||
| Hispanic | 2.22 | 0.93–5.27 |
| White, Non-Hispanic | 1.64 | 0.88–3.05 |
| Previous chemotherapy | ||
| No | 1.35 | 0.50–3.66 |
| Yes | 2.03 * | 1.14–3.61 |
| Age at diagnosis (years) | ||
| 0 to 3 | 2.24 | 0.94–5.36 |
| 4 to 10 | 2.08 | 0.83–5.21 |
| 11 to 18 | 1.09 | 0.25–4.71 |
| 19 to 26 | 1.75 | 0.56–5.43 |
| Years since diagnosis | ||
| 5 to 9 | 1.76 * | 1.03–3.01 |
| 10 to 29 | 2.29 | 0.70–7.54 |
| NAAQS standard1 | ||
| <35.4 µg/m3 | 1.79 | 0.99–3.26 |
| Below NAAQS standard 1 | ||
| <25.0 µg/m3 | 2.48 * | 1.16–5.05 |
| Main and Stratified ED Visit Models | Odds Ratio | 95% CI |
|---|---|---|
| Main effect | 1.04 | 0.86–1.26 |
| Stratified Models | ||
| Cause of admission | ||
| Respiratory infection | 1.02 | 0.80–1.29 |
| Respiratory disease | 1.01 | 0.69–1.49 |
| Asthma | 1.17 | 0.74–1.84 |
| Race/ethnicity | ||
| Hispanic/Other | 1.28 | 0.86–1.89 |
| White, Non-Hispanic | 0.98 | 0.79–1.22 |
| Previous chemotherapy | ||
| No | 0.86 | 0.62–1.20 |
| Yes | 1.16 | 0.92–1.45 |
| Age at diagnosis (years) | ||
| 0 to 3 | 1.58 * | 1.09–2.30 |
| 4 to 10 | 1.04 | 0.72–1.50 |
| 11 to 18 | 0.71 | 0.44–1.14 |
| 19 to 26 | 0.86 | 0.55–1.34 |
| Years since diagnosis | ||
| 5 to 9 | 0.97 | 0.74–1.29 |
| 10 to 29 | 1.11 | 0.86–1.44 |
| NAAQS standard | ||
| ≥35.4 µg/m3 | 1.11 | 0.34–3.62 |
| <35.4 ug/m3 | 1.15 | 0.88–1.51 |
| Below NAAQS standard | ||
| ≥25.0 µg/m3 | 1.07 | 0.52–2.18 |
| <25.0 µg/m3 | 1.21 | 0.84–1.73 |
| Main and Stratified Respiratory Infection Models | Odds Ratio | 95% CI |
|---|---|---|
| Main effect | 1.08 | 0.86–1.36 |
| Stratified models | ||
| Race/ethnicity | ||
| Hispanic/Other | 1.61 * | 1.04–2.49 |
| White, Non-Hispanic | 0.93 | 0.71–1.23 |
| Previous chemotherapy | ||
| No | 0.89 | 0.62–1.29 |
| Yes | 1.24 | 0.92–1.67 |
| Age at diagnosis (years) | ||
| 0 to 3 | 1.63 * | 1.03–2.58 |
| 4 to 10 | 1.08 | 0.66–1.77 |
| 11 to 18 | 0.79 | 0.47–1.33 |
| 19 to 26 | 0.96 | 0.60–1.56 |
© 2019 by the authors. Licensee MDPI, Basel, Switzerland. This article is an open access article distributed under the terms and conditions of the Creative Commons Attribution (CC BY) license (http://creativecommons.org/licenses/by/4.0/).
Share and Cite
Ou, J.Y.; Hanson, H.A.; Ramsay, J.M.; Leiser, C.L.; Zhang, Y.; VanDerslice, J.A.; Pope, C.A., III; Kirchhoff, A.C. Fine Particulate Matter and Respiratory Healthcare Encounters among Survivors of Childhood Cancers. Int. J. Environ. Res. Public Health 2019, 16, 1081. https://doi.org/10.3390/ijerph16061081
Ou JY, Hanson HA, Ramsay JM, Leiser CL, Zhang Y, VanDerslice JA, Pope CA III, Kirchhoff AC. Fine Particulate Matter and Respiratory Healthcare Encounters among Survivors of Childhood Cancers. International Journal of Environmental Research and Public Health. 2019; 16(6):1081. https://doi.org/10.3390/ijerph16061081
Chicago/Turabian StyleOu, Judy Y., Heidi A. Hanson, Joemy M. Ramsay, Claire L. Leiser, Yue Zhang, James A. VanDerslice, C. Arden Pope, III, and Anne C. Kirchhoff. 2019. "Fine Particulate Matter and Respiratory Healthcare Encounters among Survivors of Childhood Cancers" International Journal of Environmental Research and Public Health 16, no. 6: 1081. https://doi.org/10.3390/ijerph16061081
APA StyleOu, J. Y., Hanson, H. A., Ramsay, J. M., Leiser, C. L., Zhang, Y., VanDerslice, J. A., Pope, C. A., III, & Kirchhoff, A. C. (2019). Fine Particulate Matter and Respiratory Healthcare Encounters among Survivors of Childhood Cancers. International Journal of Environmental Research and Public Health, 16(6), 1081. https://doi.org/10.3390/ijerph16061081