Abstract
The 2008 international financial crisis triggered a heated discussion of the relationship between public health and the economic environment. We test the relationship between the credit cycle and happiness using the fixed effects model and explore the transmission channels between them by adding the moderating effect. The results show the following empirical regularities. First, the credit cycle has a negative correlation with happiness. This means that credit growth will reduce the overall happiness score in a country/region. Second, the transmission channels between the credit cycle and happiness are different during credit expansion and recession. Life expectancy and generosity can moderate the relationship between the credit cycle and happiness only during credit expansion. GDP per capita can moderate this relationship only during credit recession. Social support, freedom, and positive affect can moderate this relationship throughout the credit cycle. Third, the total impact of the credit cycle on happiness will become positive by the changes in the moderating effects. In general, we can improve subjective well-being if one of the following five conditions holds: (1) with the adequate support from the family and society, (2) with enough freedom, (3) with social generosity, (4) with a positive and optimistic outlook, and (5) with a high level of GDP per capita.
1. Introduction
Psychologist and economists are now trying hard to understand the effect of the subprime mortgage crisis on happiness. The happiness index of most countries fell quite substantially during the 2007–2008 financial crash. Particularly, regions in Western Europe, North America, and South Asia suffered from substantial declines in the happiness index between pre- and post-crisis. They have fallen to a “happiness trough” in 2009 (for more detailed analysis of the available global data on national happiness see World Happiness Reports 2019: https://s3.amazonaws.com/happiness-report). On average, credit-to-GDP reached a peak in the third quarter of 2009. Noteworthily, the credit cycle can be explained by the credit-to-GDP based on most of the literature [1,2,3]. The credit data from 42 economies provided by Bank for International Settlements (BIS) indicate that the national average of credit-to-GDP reached a historical peak in the third quarter of 2009 (Source: BIS credit-to-GDP gap statistics). Both results appear to provide evidence on the credit-happiness link. On the other side, the study of happiness in what has become known as the “economics of happiness” has led to much debate over the link between national economic conditions (or income inequality) and subjective well-being [4,5,6,7,8,9]. Given that credit spreads reflect the state of the business cycle ahead [10,11], the fluctuation in the credit cycle would likely cause the increase and decrease in the happiness index as well. For this reason, examining the relationship between the credit cycle and happiness, our chief concern in this paper, is important.
Many studies have confirmed that the credit cycle booms and busts hold risks for the economy. Housing demand increases and house prices rise are well explained by credit expansion [12,13,14,15]. Other than this, excess credit growth aggravated the harmful effects of financial stress and risks on the real economy. Specifically, a 1% increase in pre-crisis lending translates into a 0.2% increase in the cumulative loss in real output [16]. One distinguishing reason for this effect is that while the increase in the supply of bank loans increases the level of non-performing loans, it does not lead to higher profitability [17,18,19,20]. In addition, flows of bank loans to the non-financial private sector drive the build-up of current account imbalances in the deficit countries [21,22,23,24]. Thus, excess credit growth may crowd out real economic growth [25,26,27]. The credit contraction depressed investment, employment, and sales growth of firms and it explains most of the negative real effects [28,29]. The investment of bank-dependent industries falls substantially [30]. During the Great Depression, the credit crunch explained a substantial fraction of the aggregate decline in employment [31].
In recent decades the research on happiness has been linked to economics [6]. The attention on the relationship between happiness and income is a part of a broad, ongoing controversy. Many of the basic theory of happiness-income in existing literature follow Easterlin [32,33] and assign income a central role in affecting happiness in the short term. They state that at a point in time happiness varies directly with income both among and within nations, but over time happiness does not trend upward as income continues to grow (the strength of the association diminishes with higher income). The above research has also been questioned. Stevenson and Wolfers [34] find that economic growth associated with rising happiness by examining the relationship between changes in happiness and income over time within countries. Some researchers believe that the degree of wealth of the country should be considered when examining the relationship between personal income and happiness [4,35,36,37,38]. Beyond income, however, many social scientists have documented that happiness is associated with the person’s state of health and ageing [39,40], income inequality [41,42], natural environments [43,44], level of education [45], financial crisis [46], and quality of governance [47,48].
Extant studies on the effect of credit on happiness have primarily focused on the empirical investigation of the micro-level personal and household debt. While personal (or household) debt and happiness are robustly and negatively associated in cross-sectional studies [49], a random-effects meta-analysis of seven studies showed a weak link between debt and happiness () [50], resulting in considerable debate on whether personal debt substantially matters for mental health [51,52,53]. Many social scientists, however, have documented that the impact of different types of debt on subjective well-being is heterogeneous. One intriguing result is that happiness was negatively affected by subjective debt (worry about debt), but was statistically insignificant by objective debt (debt-to-income ratio) [54]. The other is that the different sources of housing debt have different effects on happiness, and only nonbank housing debt significantly reduces happiness [55]. This attention on the relationship between personal (or household) debt and happiness at the micro-level is also part of an ongoing controversy on whether expansion and recession of credit lead to a lower level of happiness. Moreover, given the prevalence of debt in a modern economy, these discussions of whether debt decrease can lead to happiness omit a critical macro-level variable—the credit cycle.
Our study makes three contributions to the existing literature on the credit cycle and happiness. First, we test and demonstrate the negative correlation between the credit cycle and happiness. This differs from the previous literature in that we analyze the impact of the credit on happiness from a macro perspective. For policy makers who are committed to improving national happiness scores, it is an interesting question to specify how to improve subjective well-being based on the negative correlation between the credit cycle and happiness. Second, we explore the transmission channels of the credit cycle on happiness. Several moderating variables have been found to moderate the relationship between the credit cycle and happiness in our study. However, the moderating effects between the credit cycle and happiness are different during credit expansion and recession. Three, we also found an interesting result, that is, the negative impact of the credit cycle on happiness will become positive as the value of the moderating variable changes. During credit growth or recession, this finding tells us that we can improve the happiness score by moderating variables. This can effectively reduce the negative impact of the credit fluctuations on subjective well-being.
The remainder of this paper is organized as follows. Section 2 develops our research hypotheses. Section 3 contains methodology and data source. Section 4 empirically examines the impact of the credit cycle on happiness. Section 5 further studies the moderating effect between the credit cycle and happiness. Finally, Section 6 concludes our paper and provides some policy recommendations.
2. Hypothesis
2.1. Credit Cycle and Happiness
The most prominent study to date focused on the measurement of happiness and argued that happiness relates to life evaluation, positive affect, and negative affect [56]. Many studies have examined the association between happiness and life satisfaction and established that life satisfaction is one component of happiness. However, happiness and life satisfaction are empirically and conceptually distinct. Life satisfaction might be characterized by more profound enjoyment and achievement in life than happiness [57]. Furthermore, positive and negative affect can directly elicit feelings, such as happiness and sadness.
Credit growth can indirectly affect the quality of life of residents by rising house prices and inflation, etc. The ultimate impact of credit growth is a decline in happiness. For example, throughout the 1990s and early 2000s, the Icelandic banking industry grew rapidly. Bank loan size in Iceland shows a long-term growth trend, leading to the result of rising house prices and increased consumption. As credit continues to expand, the happiness of Icelandic adults continues to decline [58]. During a credit contraction, bank loans will reduce happiness by increasing residents’ financial stress and worries. A study of college students’ credit card use found that satisfaction of one’s own financial situation can improve sense of material well-being [59,60]. In addition, objective debt (credit card debt) was positively associated with negative affect (depression, exhaustion, sadness) [61]. In this sense, we proposed that the credit cycle could impact on happiness. Therefore, it is reasonable to hypothesize that:
Hypothesize 1 (H1).
A negative correlation exists between the credit cycle and happiness.
2.2. Moderating Hypothesis
A healthy life and life expectancy are strongly linked to happiness, and this correlation could increase with age. The prevalence of chronic diseases increases with age. As life expectancy increases and treatments for life-threatening diseases become more effective, the issue of maintaining health at an advanced age becomes more and more important [39]. The Gallup World Poll conducted ongoing surveys in more than 160 countries and found that in high-income, English-speaking countries, evaluable well-being has a U-shaped relationship with age. What is shocking is that the minimum level of happiness in these countries is in 45–54 years old. But this pattern is not universal. A study challenges the notion that wellbeing is U-shaped throughout the life course and underscores the critical role of mobility across wellbeing domains in later life [62]. The above shows that there is a significant correlation between happiness and life expectancy. Happiness is affected by many factors other than health.
Research in the field of psychology suggests that generous behavior show strong increases in self-reported happiness [63,64]. There is a model of a positive feedback loop between prosocial spending and happiness. Prosocial spending leads to an increase in happiness. Happiness, in turn, increases the likelihood of engaging in future acts of prosocial spending [65]. Park et al. [66] presented a mechanistic understanding of the neural processes linking generosity and happiness. Generous decisions engage the temporo-parietal junction (TPJ) in those who spend money on others more than in those who spend on themselves and differentially modulate the connectivity between TPJ and ventral striatum. What counts is that the activity of ventral striatum is directly related to changes in happiness. From the perspective of psychology or sociology, generosity behavior can increase happiness.
Credit expansion may affect both life expectancy and generosity, as it may impinge on the alcohol-related disorders and national mood, such as anxiety, worry, and testiness. For example, a study showed that credit expansion was an important factor that had a negative impact on workers’ mental health. Furthermore, problems related to the subprime crisis may have also affected the general health of workers by increasing the risk of such health problems as cardiovascular and respiratory diseases [67]. In addition, credit expansion can also influence generous behavior and prosocial spending. Credit growth plays an important role in stimulating economic growth and is strongly associated with faster economic growth [68,69]. An interesting experiment by Kellner et al. [70] showed that when people knew their income would increase, their donations would be higher. This means that credit growth indirectly increases the generosity of society by stimulating economic growth. In this sense, we propose that the credit cycle could trigger happiness during the period of credit expansion via life expectancy and generosity. Therefore, we formulate the following hypothesis:
Hypothesize H2a (H2a).
During the period of credit expansion, life expectancy and generosity moderate the relationship between the credit cycle and happiness.
There is an important viewpoint in mainstream welfare economics that suggests that higher levels of economic development are associated with higher levels of well-being. Further research finds that the richer the society, the less do gains in economic growth confer gains in individuals’ happiness [71,72]. For example, Wu and Li [73] provide empirical evidence that local economic growth has a positive effect on individuals’ life satisfaction. However, there is more and more evidence that across countries, the relationship between GDP per capita and subjective wellbeing is roughly log-linear [34,74,75].
Credit contraction can be an important predictor of economic recession. López-Salido et al. [11] show that elevated credit-market sentiment in year is associated with a decline in economic activity in years and using U.S. data from 1929 to 2015. It is believed that credit contraction may influence economic development. Our measure of economic development is the natural logarithm of real GDP per capita, measured at purchasing power parity. As Jebb et al. [7] have noted, all analyses were done using the natural logarithm of GDP per capita, which is standard practice because the relationship between happiness and GDP per capita is known to be log-linear. In this sense, we propose that the credit cycle could trigger happiness during the period of credit contraction via GDP per capita. Therefore, we formulate the following hypothesis:
Hypothesize H2b (H2b).
During the period of credit contraction, GDP per capita moderates the relationship between the credit cycle and happiness.
Social support, freedom and positive affect are three of the important predictors of happiness. People with satisfactory social relationships are more likely to be happy, less sorrowful, and more satisfied with life than those who do not have a satisfactory social relationship [76]. Alternatively, countries with a higher level of economic freedom experienced a consistently higher level of happiness [77]. Furthermore, positive emotions have been shown to benefit from optimistic perceptions, even if these perceptions are illusory [78].
A large behavioral literature shows that changes in social support, freedom, and positive affect are associated with the fluctuation in the credit cycle. First, the credit collapse during the global financial crisis of 2008 led to an increase in unemployment. Unemployment leads to increased social isolation that either directly affects mental health [79]. For example, Gudmundsdóttir et al. [58] demonstrate that one of the important reasons why the unemployed are prone to mental disorders during the crisis is the decline in support from society and the family. Second, economic freedom fall is affected by credit contraction and worsen the economic environment. The undesirable result is a decline in happiness. Karfakis [80] shows that the credit collapse during the global financial crisis of 2008 seems to be one of the forces which are responsible for the collapse of the real economy. The global economic downturn of 2008–2009 led to a decrease in income, and there is a positive association between income and economic freedom. Furthermore, some of the most consistent findings in existing literature are that democracy and political freedom are positively associated with economic freedom; and inequality is negatively related to economic freedom [81]. The study of Bjørnskov [82] suggests that economic freedom is robustly associated with smaller peak-to-trough ratios and shorter recovery time. This means that the fluctuation in the credit cycle can lead to a decrease in happiness by reducing economic freedom. Third, fluctuation of the credit cycle was positively associated with financial anxiety and it has reduced positive affect [83]. This indicates that fluctuation of the credit cycle can lead to a decline in happiness through the channel of positive affect. In this sense, we propose that the credit cycle could trigger happiness whether the credit cycle is during expansion or recession phases via social support, freedom and positive affect. Therefore, we formulate the following hypothesis:
Hypothesize H2c (H2c).
Social support, freedom, and positive affect moderate the relationship between the credit cycle and happiness whether the credit cycle is during expansion or recession phases.
It is common knowledge that the extent of happiness might change as many important indicators change. A study using more than 76,000 bank-transaction records found that if individuals spend more on products that match their personality, people report higher levels of happiness [84]. Gonza and Burger [85] suggest that inter-regional and inter-cultural differences are additional determinants of happiness during the 2008 financial crisis. This would guide us to track the change of influential factors throughout the credit cycle and hence test their relationship between influential factors and happiness. In the context of fluctuations in the credit cycle, we can reasonably assume that the important factors affecting happiness—life expectancy, generosity, GDP per capita, social support, freedom, and positive affect—can be artificially regulated, and the negative impact of the credit cycle on happiness will turn into a positive impact. Therefore, the most heuristic prediction of this study is as follows:
Hypothesize H3 (H3).
The credit cycle has a chance to increase happiness once the value of moderating variable changes.
3. Methods and Data
3.1. Method
Panel data models are widely used in the study of the influencing factors of happiness. It offers in reflecting the variation of happiness both over time and across economies. Among the three kinds of panel data regression models—the fixed effects model, the random effects model, and the mixed effects model. We proceed with firstly an F-test to identify if either mixed or fixed effects are preferred for the regression specification. The null hypothesis of the F-test is rejected at the 1% level. Then, the Hausman test is commonly used to test the applicability of the fixed and random effects model. In our study, the null hypothesis of the Hausman test is rejected at the 1% level. Thus, we applied a fixed effects model to explore the effects of the credit cycle on happiness. In order to study the impact of the credit cycle on the reported happiness and particularly the varying effect of credit expansion and contraction on happiness, we estimate the following regression specification:
where is the dependent variable, and denotes the credit cycle. is a vector of control variable. We also include a set of economy-fixed effects, , and year-fixed effects, is idiosyncratic an error term.
To test for any asymmetric effects of the credit cycle, we then fit other panel regression specification (2) and (3) that introduces expansion or recession phase of the credit cycle, such that:
where denotes expansion phase of the credit cycle and denotes recession phase of the credit cycle. Following the setting of Gonza and Burger [85] for expansion and recession, the variables and are replaced by a continuous variable measuring the growth rate of credit-to-GDP to distinguish between the credit cycle of a different amplitude. When the growth rate of credit-to-GDP is greater than or equal to 0, this period represents an expansion period, otherwise, it is a recession period. We can analyze the effects of credit cycles on happiness and heterogeneity effect through the coefficients of regression specification (1)–(3).
As pointed out in the moderating hypothesis of our study, moderating variables will moderate the relationship between the credit cycle and happiness in different phases. Thus, we would expect to test a moderating effect between the credit cycle and happiness considering different moderating variable. In further research, we therefore investigate whether the relationship between the credit cycle and happiness changes over time because of the moderating hypothesis of our study. For this purpose, we estimate the following regression specification:
where is a moderating variable and is an interaction term. We can analyze the moderating effects between the credit cycles and happiness through the regression specification (4). However, we make a simple conversion of the regression specification (4) to more directly express the total effect of the credit cycle on happiness after we add a moderating variable:
where is the total impact that denotes the direct and the moderating effects in the relationship between the credit cycles and happiness.
3.2. Variables and Data Source
We seek to investigate the basic question raised earlier regarding the influences of the credit cycle on happiness. For this purpose, the selected variables and the following database has been collected from these sources as shown in Table 1. Happiness is an explained variable. In this study, happiness is measured by the national-level average scores in a country/region for subjective well-being taken from the World Happiness Report. There is skepticism about interpreting happiness scores as cardinal numbers, but Kahneman et al. [86], Frey and Stutzer [48] showed that this may be less problematic at a practical level than at the theoretical level. Di Tella et al. [87], Ferrer-i-Carbonell and Frijters [40] also indicated that assuming cordiality or cardinality of happiness scores had little impact on empirical results. The credit cycle is an explanatory variable. Noteworthily, the credit cycle can be explained by the credit-to-GDP based on most of the literature [1,2,3]. We follow the mainstream literature on the setting of the credit cycle, which uses credit-to-GDP as the proxy variable of the credit cycle. They found that the credit-to-GDP best fits the credit cycle of a country/region. Given the control variables and the moderating variables, we refer to the six key variables mentioned in the ‘World Happiness Report 2019′ to explaining the full sample of national annual average happiness scores over the whole period 2006–2018. These six variables are GDP per capita, social support, healthy life expectancy, freedom, generosity, and the absence of corruption [88]. Moreover, we also added the positive and negative affect which are the main forces that influence happiness.

Table 1.
Variables and database.
This study uses three questions for measuring variable “positive affect”: individual indicate “did you experience ‘happiness’ during a lot of the day yesterday?”, “did you smile or laugh a lot yesterday?” and “did you experience ‘enjoyment’ during a lot of the day yesterday?”, respectively [88]. If an interviewee answers “Yes”, then it = 1 point, otherwise, 0 points. The final data is the arithmetic mean of the scores for these three questions. Similarly, the measurement of the variable “negative emotion” can be explained following three questions: “did you experience ‘worry’ during a lot of the day yesterday?”, “did you experience ‘sadness’ during a lot of the day yesterday?” and “did you experience ‘anger’ during a lot of the day yesterday?”, respectively.
4. The Impact of the Credit Cycle on Happiness
4.1. Descriptive Statistics and Stationarity Test
Below, a system of summary statistics and stationarity tests for all variables will be built. This study examines the effects of the credit cycle on happiness of nationally representative samples in 42 mainly economies between 2006 and 2018. The remaining economies are excluded due to the insufficient number of observations. In particular, the economies included in the study are: Argentina, Australia, Austria, Belgium, Brazil, Canada, Chile, China, Colombia, Czech Republic, Denmark, Finland, France, Germany, Greece, Hong Kong S.A.R. of China, Hungary, India, Indonesia, Ireland, Israel, Italy, Japan, Luxembourg, Malaysia, Mexico, Netherlands, New Zealand, Norway, Poland, Portugal, Russia, Saudi Arabia, Singapore, South Africa, Spain, Sweden, Switzerland, Thailand, Turkey, United Kingdom, and the United States. Table 2 is descriptive statistics that provide a summary on a variety of variables, including happiness, the credit cycle, GDP per capita, healthy life expectancy, social support, freedom, generosity, corruption perception, positive affect, and negative affect.
Table 2.
Descriptive statistics.
Before studying the relationship between happiness and the credit cycle, the unit root test is performed to check whether the variables used in this article are stationary or integrated of the same order. The data in our study is unbalanced panel data because some observations are missing in some countries. Therefore, we choose the augmented Dickey-Fuller (ADF) unit-root tests test [89] and the Phillips–Perron unit-root tests [90]. The results in levels are reported in Table 3. Each of these tests is carried out to include an intercept and a time trend. Based on our empirical results, we find a uniform conclusion that the null hypothesis of non-stationarity can be strongly rejected at a 1% significance level. Therefore, we can conclude that all variables are stationary.
Table 3.
The results of unit root test for all variables.
4.2. Results for Empirical Effects of the Credit Cycle on Happiness
In this part, our study explores the impact of the credit cycle on the reported happiness and particularly the varying effect of credit expansion and contraction on happiness. Thus, we estimate the regression specification (1)–(3) with economy fixed effect and year fixed effects for an unbalanced panel. The credit cycle is the main explanatory variable, while GDP per capita, healthy life expectancy, social support, freedom, generosity, corruption perception, positive affect, and negative affect are used as control variables. The results of the regression specification (1)–(3) are presented in Table 4 by utilizing the ordinary least squares linear regression (OLS).
Table 4.
The effect of the credit cycle on happiness.
In general, the credit cycle has a negative correlation with the happiness score, which confirms the Hypothesis 1 of our study. As shown in the second column of Table 2, the coefficient of the impact of the credit cycle on happiness is −0.0019, which is significant at the 1% level. This result suggests that a country’s credit growth will reduce the overall happiness score in a country. The reason can be drawn from the conclusion of Gudmundsdóttir et al. [58] that credit growth is accompanied by the rise of housing prices, the increase in luxury consumption and the prosperity of the gambling industry. This credit growth has severely hit the basis of the national economy and increased the probability of economic collapse in the entire country. In the different phases of the credit cycle, the impact of the credit cycle on happiness does not change the direction, however, the regression coefficient is less during credit recession than during credit expansion. As shown in column 3, the coefficient of the impact of the credit cycle on happiness during the expansion phase is −0.0012. And column 4 shows that the coefficient in credit recession is −0.0032. During the recession phase of the credit cycle, credit has a greater impact on the national happiness score than the expansion phase. Bank loans have a huge negative impact on individuals and reduce happiness by increasing residents’ financial stress and worries [61]. This result provides a shred of evidence that the national perception of happiness is more likely to feel the effect of credit contraction. For policymakers who are committed to improving national happiness, the negative impact of credit recession on national happiness is even more difficult to offset. Not only that, but the credit cycle has a stronger explanation of happiness during the recession phase (adjustment is 0.7270). The findings of this part bear further implications on the social sciences. The credit cycle has a negative correlation with national happiness. In particular, the credit contraction has a greater influence on national happiness and stronger explanatory power. This means that social science researchers should pay more attention to the period of credit recession or economic downturn when studying the impact of credit on happiness.
5. Moderating Factors between the Credit Cycle and Happiness
As the credit cycle has a negative impact on happiness, the next step in our study is to explore the transmission channels of the credit cycle on happiness. The empirical results in this part need to answer the question “Why the credit cycle has a negative impact on happiness”. In the study of Bhuiya et al. [91], the debt can indirectly influence the life satisfaction of micro-borrowers through a number of channels, such as the increased levels of worry. Since the credit cycle has a different effect on happiness during the period of expansion and recession, we should also pay attention to the influence of credit on happiness in different stages of the credit cycle in the following empirical evidence. To investigate whether the relationship between the credit cycle and happiness changes over time, we verify the moderating hypotheses 2a, 2b, and 2c of our study by estimating the regression specification (4). The main influencing factors of happiness, such as GDP per capita, are added to the regression specification (4) as moderating variables, thus obtaining 8 estimation results of panel regression models. In addition, the data needs to be processed before the panel regression model is estimated. The observed values of the explanatory variable (the credit cycle) and the moderating variable minus their arithmetic average. Friedrich [92] proved that this approach can get a standardized coefficient for the interaction term. Table 5 and Table 6 show the results of the panel regression after adding a variety of moderating variables during credit expansion and recession.
Table 5.
The results of the moderating effect between the credit cycle on happiness during credit expansion.
Table 6.
The results of the moderating effect between the credit cycle on happiness during credit recession.
The moderating effects between the credit cycle and happiness are different during credit expansion and recession. As shown in Table 5, healthy life expectancy and generosity can moderate the relationship between the credit cycle and happiness only during the expansion of the credit cycle. The interaction terms of the credit cycle and healthy life expectancy, generosity are −0.0008, 0.0071. They are statistically significant at the 1% level. Given the interaction effect of healthy life expectancy and the credit cycle, the regression coefficient of the credit cycle become By solving this equation, it can be concluded that when life expectancy is less than 67.1250, the overall effect of the credit cycle on happiness is positive. When life expectancy is greater than 67.1250, the overall effect of the credit cycle on happiness is negative. In other words, credit growth tends to lower the average happiness score when life expectancy is greater than 67.1250. However, in countries with higher generosity scores, credit growth will help to obtain higher average happiness scores. The result can be reasonably explained that government debt affects the social welfare system. When the government faced high debt and budget constraints, the price of municipal bonds fell, yields rose, and financing costs rose, forcing the government to reduce spending. These cuts are mainly concentrated on public welfare expenditures [93]. In countries with a high average life expectancy, the higher the debt they carry, the more likely they are to reduce government satisfaction. On the other side, credit growth indirectly increases the generosity of society by stimulating economic growth. In an environment of economic prosperity, people would tend to increase prosocial spending—spend money on others to get their own satisfaction [65].
GDP per capita can moderate the relationship between the credit cycle and happiness only during the recession of the credit cycle. As shown in Table 6, the interaction terms of the credit cycle and GDP per capita is 0.0019. It is statistically significant at the 5% level. This means that when a country’s GDP per capita is higher, greater credit helps to achieve a higher happiness score. Credit growth in a country/region may increase the profit rate, possibly resulting in higher investment, and then less unemployment [94]. In addition, credit growth means an increase in the level of financialization in this country/region. Bumann and Lensink [95] suggest that financial liberalization would improve the income distribution and resource allocation of this country. It led to lower the level of inequality in this country. Importantly, the study of Mikucka et al. [96] found that reduced income inequality would significantly improve subjective well-being in richer countries.
Whether the credit cycle is during expansion or recession phases, social support, freedom and positive affect can moderate the relationship between the credit cycle and happiness. During credit expansion, the interaction terms of the credit cycle and social support, freedom, and positive affect are 0.0519, 0.0185, and 0.0222, respectively. Moreover, during credit recession, the interaction terms of the credit cycle and social support, freedom, and positive affect are 0.0358, 0.0173, and 0.0223, respectively. They are all statistically significant at the 1% level. The results indicate that enhanced interaction effects between the credit cycle and social support, freedom, and positive affect can significantly improve happiness scores. The incidence of mental disorders can be reduced during the periods of credit growth, which is mainly due to the support from society and the family [58]. People with satisfactory social relationships are more likely to be happy, less sad, and more likely to improve their happiness [76]. In addition, the credit can improve quality of life when people have adequate social support [77]. For freedom, economic freedom is associated with smaller credit fluctuations and shorter credit recovery times [82]. Economic freedom improves the credit dilemma in a country/region and reduces pressure and worries from the debt. Finally, when positive affect spreads in financial markets, high social expectations would push the loans from banks to other investments, pursuing higher returns and increasing subjective well-being.
Next, we turn to the regression specification (5) which a simple conversion of the regression specification (4) to more directly express the total effect of the credit cycle on happiness. The regression specification (5) that divides the impact of the credit cycle on happiness into a part that can be explained by the direct effect and a part attributed to the changes in the indirect effects of these moderating variables on the relationship between the credit cycle and happiness. To investigate whether the credit cycle has a chance to increase happiness, we verify the moderating hypotheses 3 of our study by estimating the regression specification (5). We mainly discuss the regression coefficient of the credit cycle term which is denoted by The regression coefficient of the credit cycle term represents the total effect of the credit cycle on happiness. Figure 1; Figure 2 show the results of the total effect of the credit cycle on happiness during expansion and recession phases.
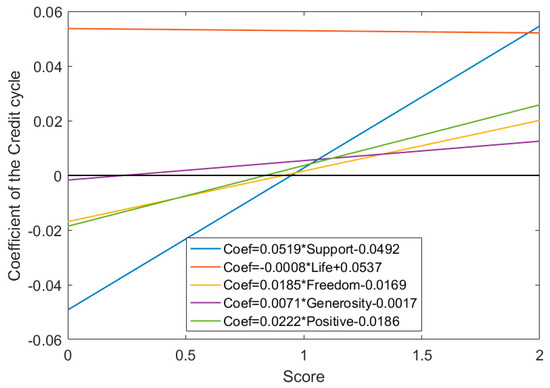
Figure 1.
The total effect of the credit cycle on happiness during the expansion phase. denote the regression coefficient of the credit cycle term which represents the total effect of the credit cycle on happiness. ‘Life’ represents healthy life expectancy; ‘Support’ represents social support; ‘Positive’ represents positive affect. The sample period is from 2006 to 2018.
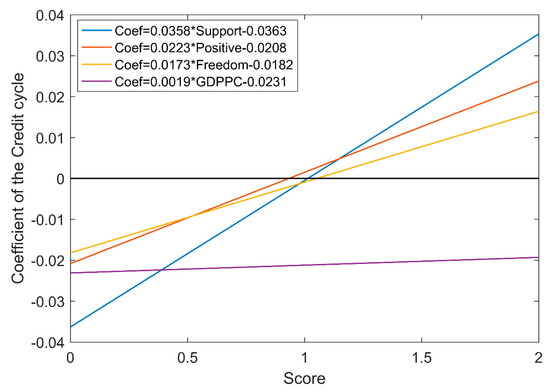
Figure 2.
The total effect of the credit cycle on happiness during the recession phase. denote the regression coefficient of the credit cycle term which represents the total effect of the credit cycle on happiness. ‘GDPPC’ represents GDP per capita; ‘Support’ represents social support; ‘Positive’ represents positive affect. The sample period is from 2006 to 2018.
The total impact of the credit cycle on the happiness index will become positive by the changes in the moderating effects of the moderating variable. During the expansion of the credit cycle, social support, freedom, generosity, and positive affect have a significant positive moderating effect on the relationship between the credit cycle and happiness. As shown in Figure 1, the impact of the credit cycle on happiness shifted from negative to positive if the score of social support reached 0.9496 (obtained by solving the equation ); or the score of freedom reached 0.9151 (obtained by solving the equation ); or the score of generosity reached 0.2412 (obtained by solving the equation ); or the score of the positive affect reaches 0.8372 (obtained by solving the equation ). Life expectancy has a significant but weak negative moderating effect on the relationship between the credit cycle and happiness. In general, during the expansion of the credit cycle, we can improve subjective well-being if one of the following four conditions holds: (1) the adequate support from the family and society, (2) enough freedom, (3) social generosity, (4) with positive and optimistic outlook.
During the recession of the credit cycle, GDP per capita, social support, freedom, and positive affect have a significant positive moderating effect on the relationship between the credit cycle and happiness. As shown in Figure 2, the impact of the credit cycle on happiness shifted from negative to positive if the score of the natural logarithm of GDP per capita reached 12.7242 (obtained by solving the equation ). However, the maximum natural logarithm of GDP per capita is only 11.4608 according to Table 2 Descriptive statistics. In addition, the impact of the credit cycle on happiness shifted from negative to positive if the score of social support reached 1.0154 (obtained by solving the equation ); or the score of freedom reached 1.0501 (obtained by solving the equation ); or the score of the positive affect reaches 0.9343 (obtained by solving the equation ). But the scores of social support and freedom will not exceed 1. Finally, during the recession of the credit cycle, only with a high level of GDP per capita or positive and optimistic, the negative impact of credit growth on happiness can be offset. This is consistent with the above empirical results that the negative impact of credit recession on national happiness is difficult to offset even with an addition of a moderating effect.
Although there has been previous literature in the relationship between credit (or debt) and happiness, one contribution of our study is that the impact of credit on happiness can be changed from negative to positive under the influence of regulatory variables. This study does not doubt the predecessors’ conclusions: debt has a negative impact on happiness [49,50,51]. We investigate the relationship between credit and happiness from a macro perspective and give further policy implications to improve subjective well-being based on the negative correlation between the credit cycle and happiness. Social support, freedom, and positive affect as additional determinants of happiness throughout the credit cycle. We need to pay special attention to the moderating variables during the period of credit recession which can help to hedge the negative impact of credit growth on happiness.
6. Conclusions
Surveys from the international agencies show that during the 2008 international financial crisis, people’s happiness fell sharply and then fell into a “happiness trough”. At the same time, credit-to-GDP reached a peak in the third quarter of 2009. Previous literature put forward the “economics of happiness” theory, which triggered a heated discussion about happiness and economic. In this study, we test and demonstrate the relationship between the credit cycle and happiness using the fixed effects model. In addition, we explore the transmission channels of the credit cycle on happiness by adding the moderating effect. In particular, based on annual data for 42 economies in 2006–2018, we find the following empirical regularities. First, the credit cycle has a negative correlation with the happiness score. This means a country’s credit growth will reduce the overall happiness score in a country. The reason can be drawn from the conclusion of Gudmundsdóttir et al. [58] that credit growth is accompanied by the rise of housing prices, the increase in luxury consumption and the prosperity of the gambling industry, which has severely hit the basis of the national economy and increased the probability of economic collapse in the entire country. Second, the transmission channels between the credit cycle and happiness are different during credit expansion and recession. Healthy life expectancy and generosity can moderate the relationship between the credit cycle and happiness only during the expansion of the credit cycle. GDP per capita can moderate this relationship only during the recession of the credit cycle. Whether the credit cycle is during expansion or recession phases, social support, freedom, and positive affect can moderate this relationship. Third, the total impact of the credit cycle on happiness will become positive by the changes in the moderating effects of the moderating variable. Based on our empirical results, we confirm the previous finding on the negative impact of credit (or debt) on happiness [49,50,51]. However, one contribution of our study is that the impact of credit on happiness can be changed from negative to positive under the influence of regulatory variables.
Our findings present important implications for public mental health. In the context of fluctuations in the credit cycle, the national perception of happiness is inevitably affected by the negative impact of credit, and a good strategy for avoiding negative shocks can significantly improve subjective well-being. We find that the recession of the credit cycle is a better explanation of the decline in happiness than expansion. Therefore, social science researchers should pay more attention to the period of credit recession or economic downturn when studying the relationship between credit (or debt) and happiness. On the other side, social support, freedom and positive affect as additional determinants of happiness throughout the credit cycle. We need to pay special attention to the moderating variables during the period of credit recession which can help to hedge the negative impact of credit growth on happiness.
Our work is not without limitations, some of which open new avenues for future research. First, this article does not distinguish between long-term or short-term effects on the relationship between the credit cycle and happiness. Second, we used a single measurement for the dependent and independent variables. Third, this study assumes that happiness is measured on a cardinal scale. The happiness score used in this study is the national-level average scores in a country/region. It fails to pose a national-level average happiness score with 7 or 5 categories or with verbal labels, such as “very happy/happy/so-so/somewhat unhappy/very unhappy”. Thus, as a first extension, further research could examine the short- and long-term effects of the credit cycle on happiness. As a second extension, future research could study whether the impact of the credit cycle on happiness is spatially heterogeneous. On this subject, the World Happiness Report 2019 pointed out that the evolution of happiness is very different in the ten global regions.
Author Contributions
Conceptualization, T.L., J.Z., and M.X.; methodology, J.Z.; software, J.Z.; validation, T.L., J.Z., and M.X.; formal analysis, J.Z.; investigation, J.Z.; resources, T.L.; data curation, T.L.; writing—original draft preparation, J.Z.; writing—review and editing, M.X.; visualization, T.L.; supervision, T.L.; project administration, T.L.; funding acquisition, T.L. All authors have read and agreed to the published version of the manuscript.
Funding
This research was funded by The National Social Science Fund of China, grant number 19BTJ049.
Conflicts of Interest
The authors declare no conflict of interest.
References
- Aikman, D.; Haldane, A.G.; Nelson, B.D. Curbing the credit cycle. Econ. J. 2014, 125, 1072–1109. [Google Scholar] [CrossRef]
- Gelain, P.; Lansing, K.J.; Natvik, G.J. Leaning against the credit cycle. J. Eur. Econ. Assoc. 2017, 16, 1350–1393. [Google Scholar] [CrossRef]
- Rünstler, G.; Vlekke, M. Business, housing, and credit cycles. J. Appl. Econom. 2018, 33, 212–226. [Google Scholar] [CrossRef]
- Alesina, A.; Di Tella, R.; MacCulloch, R. Inequality and happiness: Are Europeans and Americans different? J. Public Econ. 2004, 88, 2009–2042. [Google Scholar] [CrossRef]
- Delhey, J.; Dragolov, G. Why inequality makes Europeans less happy: The role of distrust, status anxiety, and perceived conflict. Eur. Sociol. Rev. 2013, 30, 151–165. [Google Scholar] [CrossRef]
- Stevenson, B.; Wolfers, J. Subjective well-being and income: Is there any evidence of satiation? Am. Econ. Rev. 2013, 103, 598–604. [Google Scholar] [CrossRef]
- Jebb, A.T.; Tay, L.; Diener, E.; Oishi, S. Happiness, income satiation and turning points around the world. Nat. Hum. Behav. 2018, 2, 33–38. [Google Scholar] [CrossRef]
- Oishi, S.; Kushlev, K.; Schimmack, U. Progressive taxation, income inequality, and happiness. Am. Psychol. 2018, 73, 157–168. [Google Scholar] [CrossRef]
- Tavor, T.; Gonen, L.; Weber, M.; Spiegel, U. The effects of income levels and income inequalities on happiness. J. Happiness Stud. 2018, 19, 2115–2137. [Google Scholar] [CrossRef]
- Gilchrist, S.; Zakrajšek, E. Credit spreads and business cycle fluctuations. Am. Econ. Rev. 2012, 102, 1692–1720. [Google Scholar] [CrossRef]
- López-Salido, D.; Stein, J.C.; Zakrajšek, E. Credit-market sentiment and the business cycle. Q. J. Econ. 2017, 132, 1373–1426. [Google Scholar] [CrossRef]
- Favara, G.; Imbs, J. Credit supply and the price of housing. Am. Econ. Rev. 2015, 105, 958–992. [Google Scholar] [CrossRef]
- Justiniano, A.; Primiceri, G.E.; Tambalotti, A. Credit supply and the housing boom. J. Political Econ. 2019, 127, 1317–1350. [Google Scholar] [CrossRef]
- Anundsen, A.K.; Gerdrup, K.; Hansen, F.; Kragh-Sørensen, K. Bubbles and crises: The role of house prices and credit. J. Appl. Econom. 2016, 31, 1291–1311. [Google Scholar] [CrossRef]
- Li, Z.; Zhong, J. Impact of economic policy uncertainty shocks on China’s financial conditions. Financ. Res. Lett. 2019, in press. [Google Scholar] [CrossRef]
- Feldkircher, M. The determinants of vulnerability to the global financial crisis 2008 to 2009: Credit growth and other sources of risk. J. Int. Money Financ. 2014, 43, 19–49. [Google Scholar] [CrossRef]
- Vithessonthi, C. Deflation, bank credit growth, and non-performing loans: Evidence from Japan. Int. Rev. Financ. Anal. 2016, 45, 295–305. [Google Scholar] [CrossRef]
- Li, Z.; Liao, G.; Wang, Z.; Huang, Z. Green loan and subsidy for promoting clean production innovation. J. Clean. Prod. 2018, 187, 421–431. [Google Scholar] [CrossRef]
- Tsalas, A.; Monokroussos, P. PIIGS in and out of sync: The changing face of financial business cycle synchronization in Europe. Quant. Financ. Econ. 2018, 2, 261–278. [Google Scholar] [CrossRef]
- Huang, Z.; Liao, G.; Li, Z. Loaning scale and government subsidy for promoting green innovation. Technol. Forecast. Soc. Chang. 2019, 144, 148–156. [Google Scholar] [CrossRef]
- Unger, R. Asymmetric credit growth and current account imbalances in the euro area. J. Int. Money Financ. 2017, 73, 435–451. [Google Scholar] [CrossRef]
- Li, Z.; Dong, H.; Huang, Z.; Failler, P. Asymmetric effects on risks of Virtual Financial Assets (VFAs) in different regimes: A Case of Bitcoin. Quant. Financ. Econ. 2018, 2, 860–883. [Google Scholar] [CrossRef]
- Li, T.; Zhong, J.; Huang, Z. Potential Dependence of Financial Cycles between Emerging and Developed Countries: Based on ARIMA-GARCH Copula Model. Emerg. Mark. Financ. Trade 2019, in press. [Google Scholar] [CrossRef]
- Wen, F.; Xu, L.; Ouyang, G.; Kou, G. Retail investor attention and stock price crash risk: Evidence from China. Int. Rev. Financ. Anal. 2019, 65, 101376. [Google Scholar] [CrossRef]
- Mian, A.; Sufi, A. Finance and business cycles: The credit-driven household demand channel. J. Econ. Perspect. 2018, 32, 31–58. [Google Scholar] [CrossRef]
- Cecchetti, S.G.; Kharroubi, E. Why does credit growth crowd out real economic growth? Manch. Sch. 2019, 87, 1–28. [Google Scholar] [CrossRef]
- Liu, Y.; Liao, G. The measurement and asymmetry tests of business cycle: Evidence from China. Quant. Financ. Econ. 2017, 1, 205–218. [Google Scholar] [CrossRef]
- Acharya, V.V.; Eisert, T.; Eufinger, C.; Hirsch, C. Real effects of the sovereign debt crisis in Europe: Evidence from syndicated loans. Rev. Financ. Stud. 2018, 31, 2855–2896. [Google Scholar] [CrossRef]
- Li, Z.; Liao, G.; Albitar, K. Does corporate environmental responsibility engagement affect firm value? The mediating role of corporate innovation. Bus. Strateg. Environ. 2019, in press. [Google Scholar] [CrossRef]
- Bucă, A.; Vermeulen, P. Corporate investment and bank-dependent borrowers during the recent financial crisis. J. Bank. Financ. 2017, 78, 164–180. [Google Scholar] [CrossRef]
- Benmelech, E.; Frydman, C.; Papanikolaou, D. Financial frictions and employment during the great depression. J. Financ. Econ. 2019, 133, 541–563. [Google Scholar] [CrossRef]
- Easterlin, R.A. Does Economic Growth Improve the Human Lot? Some Empirical Evidence; David, P.A., Reder, M.W., Eds.; Nations, Households and Economic Growth: Essays in Honor of Mosses Abramowitz; Academic Press, Inc.: New York, NY, USA, 1974; pp. 89–125. [Google Scholar]
- Easterlin, R.A. Will raising the incomes of all increase the happiness of all? J. Econ. Behav. Organ. 1995, 27, 35–47. [Google Scholar] [CrossRef]
- Stevenson, B.; Wolfers, J. Economic Growth and Subjective Well-Being: Reassessing the Easterlin Paradox. Brook. Pap. Econ. Act. 2008, 2008, 1–87. [Google Scholar] [CrossRef]
- Beja, E.L. Income growth and happiness: Reassessment of the Easterlin Paradox. Int. Rev. Econ. 2014, 61, 329–346. [Google Scholar] [CrossRef][Green Version]
- Kaiser, C.F.; Vendrik, M.C. Different Versions of the Easterlin Paradox: New Evidence for European Countries. In The Economics of Happiness; Springer: Berlin, Germany, 2019; pp. 27–55. [Google Scholar]
- Delhey, J. From materialist to post-materialist happiness? National affluence and determinants of life satisfaction in cross-national perspective. Soc. Indic. Res. 2010, 97, 65–84. [Google Scholar] [CrossRef]
- Sarracino, F. Determinants of subjective well-being in high and low income countries: Do happiness equations differ across countries. J. Socio-Econ. 2013, 42, 51–66. [Google Scholar] [CrossRef]
- Steptoe, A.; Deaton, A.; Stone, A.A. Subjective wellbeing, health, and ageing. Lancet 2015, 385, 640–648. [Google Scholar] [CrossRef]
- Ferrer-i-Carbonell, A.; Frijters, P. How important is methodology for the estimates of the determinants of happiness? Econ. J. 2004, 114, 641–659. [Google Scholar] [CrossRef]
- Schneider, S.M. Income inequality and subjective wellbeing: Trends, challenges, and research directions. J. Happiness Stud. 2016, 17, 1719–1739. [Google Scholar] [CrossRef]
- Stutzer, A. The role of income aspirations in individual happiness. J. Econ. Behav. Organ. 2004, 54, 89–109. [Google Scholar] [CrossRef]
- White, M.P.; Pahl, S.; Wheeler, B.W.; Depledge, M.H.; Fleming, L.E. Natural environments and subjective wellbeing: Different types of exposure are associated with different aspects of wellbeing. Health Place 2017, 45, 77–84. [Google Scholar] [CrossRef] [PubMed]
- Kwakwa, P.A.; Alhassan, H.; Aboagye, S. Environmental Kuznets curve hypothesis in a financial development and natural resource extraction context: Evidence from Tunisia. Quant. Financ. Econ. 2018, 2, 981–1000. [Google Scholar] [CrossRef]
- Michalos, A.C. Connecting the Quality of Life Theory to Health, Well-Being and Education; Springer: Berlin, Germany, 2017. [Google Scholar]
- Charles, A.; Wu, D.; Wu, Z. Economic shocks on subjective well-being: Re-assessing the determinants of life-satisfaction after the 2008 financial crisis. J. Happiness Stud. 2019, 20, 1041–1055. [Google Scholar] [CrossRef]
- Arampatzi, E.; Burger, M.J.; Stavropoulos, S.; van Oort, F.G. Subjective well-being and the 2008 recession in European regions: The moderating role of quality of governance. Int. J. Community Well-Being 2019, 2, 111–133. [Google Scholar] [CrossRef]
- Frey, B.S.; Stutzer, A. Happiness, economy and institutions. Econ. J. 2000, 110, 918–938. [Google Scholar] [CrossRef]
- Bell, M.; Nelson, J.; Spann, S.; Molloy, C.; Britt, S.; Goff, B. The impact of financial resources on soldiers’ well-being. J. Financ. Couns. Plan. 2014, 25, 41–52. [Google Scholar]
- Tay, L.; Batz, C.; Parrigon, S.; Kuykendall, L. Debt and subjective well-being: The other side of the income-happiness coin. J. Happiness Stud. 2017, 18, 903–937. [Google Scholar] [CrossRef]
- Białowolski, P.; Węziak-Białowolska, D.; VanderWeele, T.J. The impact of savings and credit on health and health behaviours: An outcome-wide longitudinal approach. Int. J. Public Health 2019, 64, 573–584. [Google Scholar] [CrossRef]
- Sirgy, M.J. The psychology of material well-being. Appl. Res. Qual. Life 2018, 13, 273–301. [Google Scholar] [CrossRef]
- Richardson, T.; Elliott, P.; Roberts, R.; Jansen, M. A longitudinal study of financial difficulties and mental health in a national sample of British undergraduate students. Community Ment. Health J. 2017, 53, 344–352. [Google Scholar] [CrossRef]
- Norvilitis, J.M.; Szablicki, P.B.; Wilson, S.D. Factors influencing levels of credit-card debt in College Students. J. Appl. Soc. Psychol. 2003, 33, 935–947. [Google Scholar] [CrossRef]
- Liu, Z.; Zhong, X.; Zhang, T.; Li, W. Household debt and happiness: Evidence from the China Household Finance Survey. Appl. Econ. Lett. 2019. [Google Scholar] [CrossRef]
- Lucas, R.E.; Diener, E.; Suh, E. Discriminant validity of well-being measures. J. Personal. Soc. Psychol. 1996, 71, 616–628. [Google Scholar] [CrossRef]
- Chui, W.H.; Wong, M.Y. Gender differences in happiness and life satisfaction among adolescents in Hong Kong: Relationships and self-concept. Soc. Indic. Res. 2016, 125, 1035–1051. [Google Scholar] [CrossRef]
- Gudmundsdóttir, D.G.; Ásgeirsdóttir, B.B.; Huppert, F.A.; Sigfúsdóttir, I.D.; Valdimarsdóttir, U.A.; Hauksdóttir, A. How does the economic crisis influence adolescents’ happiness? Population-based surveys in Iceland in 2000–2010. J. Happiness Stud. 2016, 17, 1219–1234. [Google Scholar] [CrossRef]
- Xiao, J.J.; Tang, C.; Shim, S. Acting for happiness: Financial behavior and life satisfaction of college students. Soc. Indic. Res. 2009, 92, 53–68. [Google Scholar] [CrossRef]
- Sornette, D.; Cauwels, P.; Smilyanov, G. Can We Use Volatility to Diagnose Financial Bubbles? Lessons from 40 Historical Bubbles. Quant. Financ. Econ. 2018, 2, 486–594. [Google Scholar] [CrossRef]
- Adams, T.; Moore, M. High-risk health and credit behavior among 18-to 25-year-old college students. J. Am. Coll. Health 2007, 56, 101–108. [Google Scholar] [CrossRef]
- Freedman, V.A.; Carr, D.; Cornman, J.C.; Lucas, R.E. Aging, mobility impairments and subjective wellbeing. Disabil. Health J. 2017, 10, 525–531. [Google Scholar] [CrossRef]
- Aknin, L.B.; Barrington-Leigh, C.P.; Dunn, E.W.; Helliwell, J.F.; Burns, J.; Biswas-Diener, R.; Kemeza, I.; Nyende, P.; Ashton-James, C.E.; Norton, M.I. Prosocial spending and well-being: Cross-cultural evidence for a psychological universal. J. Personal. Soc. Psychol. 2013, 104, 635–652. [Google Scholar] [CrossRef]
- Dunn, E.W.; Aknin, L.B.; Norton, M.I. Spending money on others promotes happiness. Science 2008, 319, 1687–1688. [Google Scholar] [CrossRef] [PubMed]
- Aknin, L.B.; Dunn, E.W.; Norton, M.I. Happiness runs in a circular motion: Evidence for a positive feedback loop between prosocial spending and happiness. J. Happiness Stud. 2012, 13, 347–355. [Google Scholar] [CrossRef]
- Park, S.Q.; Kahnt, T.; Dogan, A.; Strang, S.; Fehr, E.; Tobler, P.N. A neural link between generosity and happiness. Nat. Commun. 2017, 8, 15964. [Google Scholar] [CrossRef] [PubMed]
- Mucci, N.; Giorgi, G.; Roncaioli, M.; Perez, J.F.; Arcangeli, G. The correlation between stress and economic crisis: A systematic review. Neuropsychiatr. Dis. Treat. 2016, 12, 983–993. [Google Scholar] [CrossRef]
- Liu, G.-C.; Lee, C.-C.; He, L. The synergistic effects between insurance and credit markets on economic growth: Evidence from China. Glob. Econ. Rev. 2016, 45, 1–18. [Google Scholar] [CrossRef]
- Angeles, L. Credit expansion and the economy. Appl. Econ. Lett. 2015, 22, 1064–1072. [Google Scholar] [CrossRef]
- Kellner, C.; Reinstein, D.; Riener, G. Stochastic Income and Conditional Generosity. Available online: https://ssrn.com/abstract=2691027 (accessed on 15 November 2015).
- Zagorski, K.; Kelley, J.; Evans, M.D. Economic Development and Happiness: Evidence from 32 Nations. Pol. Sociol. Rev. 2010, 1, 3–20. [Google Scholar]
- Zhong, J.; Wang, M.; Drakeford, B.; Li, T. Spillover effects between oil and natural gas prices: Evidence from emerging and developed markets. Green Financ. 2019, 1, 30–45. [Google Scholar] [CrossRef]
- Wu, X.; Li, J. Income inequality, economic growth, and subjective well-being: Evidence from China. Res. Soc. Stratif. Mobil. 2017, 52, 49–58. [Google Scholar] [CrossRef]
- Deaton, A. Income, health, and well-being around the world: Evidence from the Gallup World Poll. J. Econ. Perspect. 2008, 22, 53–72. [Google Scholar] [CrossRef]
- Krueger, A.B.; Stone, A.A. Progress in measuring subjective well-being. Science 2014, 346, 42–43. [Google Scholar] [CrossRef] [PubMed]
- Siedlecki, K.L.; Salthouse, T.A.; Oishi, S.; Jeswani, S. The relationship between social support and subjective well-being across age. Soc. Indic. Res. 2014, 117, 561–576. [Google Scholar] [CrossRef]
- Kešeljević, A. Institutional origins of subjective well-being: Estimating the effects of economic freedom on national happiness. J. Happiness Stud. 2016, 17, 659–712. [Google Scholar]
- Seligman, M.E.; Csikszentmihalyi, M. Positive psychology: An introduction. Am. Psychol. 2000, 55, 5–14. [Google Scholar] [CrossRef] [PubMed]
- Puig-Barrachina, V.; Malmusi, D.; Martínez, J.M.; Benach, J. Monitoring social determinants of health inequalities: The impact of unemployment among vulnerable groups. Int. J. Health Serv. 2011, 41, 459–482. [Google Scholar] [CrossRef]
- Karfakis, C. Credit and business cycles in Greece: Is there any relationship? Econ. Model. 2013, 32, 23–29. [Google Scholar] [CrossRef][Green Version]
- Lawson, R.; Murphy, R.; Powell, B. The Determinants of Economic Freedom: A Survey. Available online: https://ssrn.com/abstract=3266641 (accessed on 15 October 2018).
- Bjørnskov, C. Economic freedom and economic crises. Eur. J. Political Econ. 2016, 45, 11–23. [Google Scholar] [CrossRef]
- Archuleta, K.L.; Dale, A.; Spann, S.M. College Students and Financial Distress: Exploring Debt, Financial Satisfaction, and Financial Anxiety. J. Financ. Couns. Plan. 2013, 24, 50–62. [Google Scholar]
- Frey, B.S.; Stutzer, A. What can economists learn from happiness research? J. Econ. Lit. 2002, 40, 402–435. [Google Scholar] [CrossRef]
- Gonza, G.; Burger, A. Subjective well-being during the 2008 economic crisis: Identification of mediating and moderating factors. J. Happiness Stud. 2017, 18, 1763–1797. [Google Scholar] [CrossRef]
- Kahneman, D.; Diener, E.; Schwarz, N. (Eds.) Well-Being: Foundations of Hedonic Psychology; Russell Sage Foundation: New York, NY, USA, 1999. [Google Scholar]
- Di Tella, R.; MacCulloch, R.J.; Oswald, A.J. Preferences over inflation and unemployment: Evidence from surveys of happiness. Am. Econ. Rev. 2001, 91, 335–341. [Google Scholar] [CrossRef]
- Helliwell, J.F.; Layard, R.; Sachs, J.D. World Happiness Report; World Happiness Report: New York, NY, USA, 2019. [Google Scholar]
- Dickey, D.A.; Fuller, W.A. Distribution of the estimators for autoregressive time series with a unit root. J. Am. Stat. Assoc. 1979, 74, 427–431. [Google Scholar]
- Phillips, P.C.; Moon, H.R. Linear regression limit theory for nonstationary panel data. Econometrica 1999, 67, 1057–1111. [Google Scholar] [CrossRef]
- Bhuiyan, M.F.; Ivlevs, A. Micro-entrepreneurship and subjective well-being: Evidence from rural Bangladesh. J. Bus. Ventur. 2019, 34, 625–645. [Google Scholar] [CrossRef]
- Friedrich, R.J. In defense of multiplicative terms in multiple regression equations. Am. J. Political Sci. 1982, 26, 797–833. [Google Scholar] [CrossRef]
- Fisher, E. The crucible of debt and welfare spending: Evidence from state-level welfare expenditures in the United States. Rev. Political Econ. 2015, 27, 201–217. [Google Scholar] [CrossRef]
- Russo, A.; Riccetti, L.; Gallegati, M. Increasing inequality, consumer credit and financial fragility in an agent based macroeconomic model. J. Evol. Econ. 2016, 26, 25–47. [Google Scholar] [CrossRef]
- Bumann, S.; Lensink, R. Capital account liberalization and income inequality. J. Int. Money Financ. 2016, 61, 143–162. [Google Scholar] [CrossRef]
- Mikucka, M.; Sarracino, F.; Dubrow, J.K. When does economic growth improve life satisfaction? Multilevel analysis of the roles of social trust and income inequality in 46 countries, 1981–2012. World Dev. 2017, 93, 447–459. [Google Scholar] [CrossRef]
© 2019 by the authors. Licensee MDPI, Basel, Switzerland. This article is an open access article distributed under the terms and conditions of the Creative Commons Attribution (CC BY) license (http://creativecommons.org/licenses/by/4.0/).