The Effect of Strength Training on Vastus Lateralis’ Stiffness: An Ultrasound Quasi-Static Elastography Study


Abstract
:1. Introduction
2. Methods
2.1. Participants
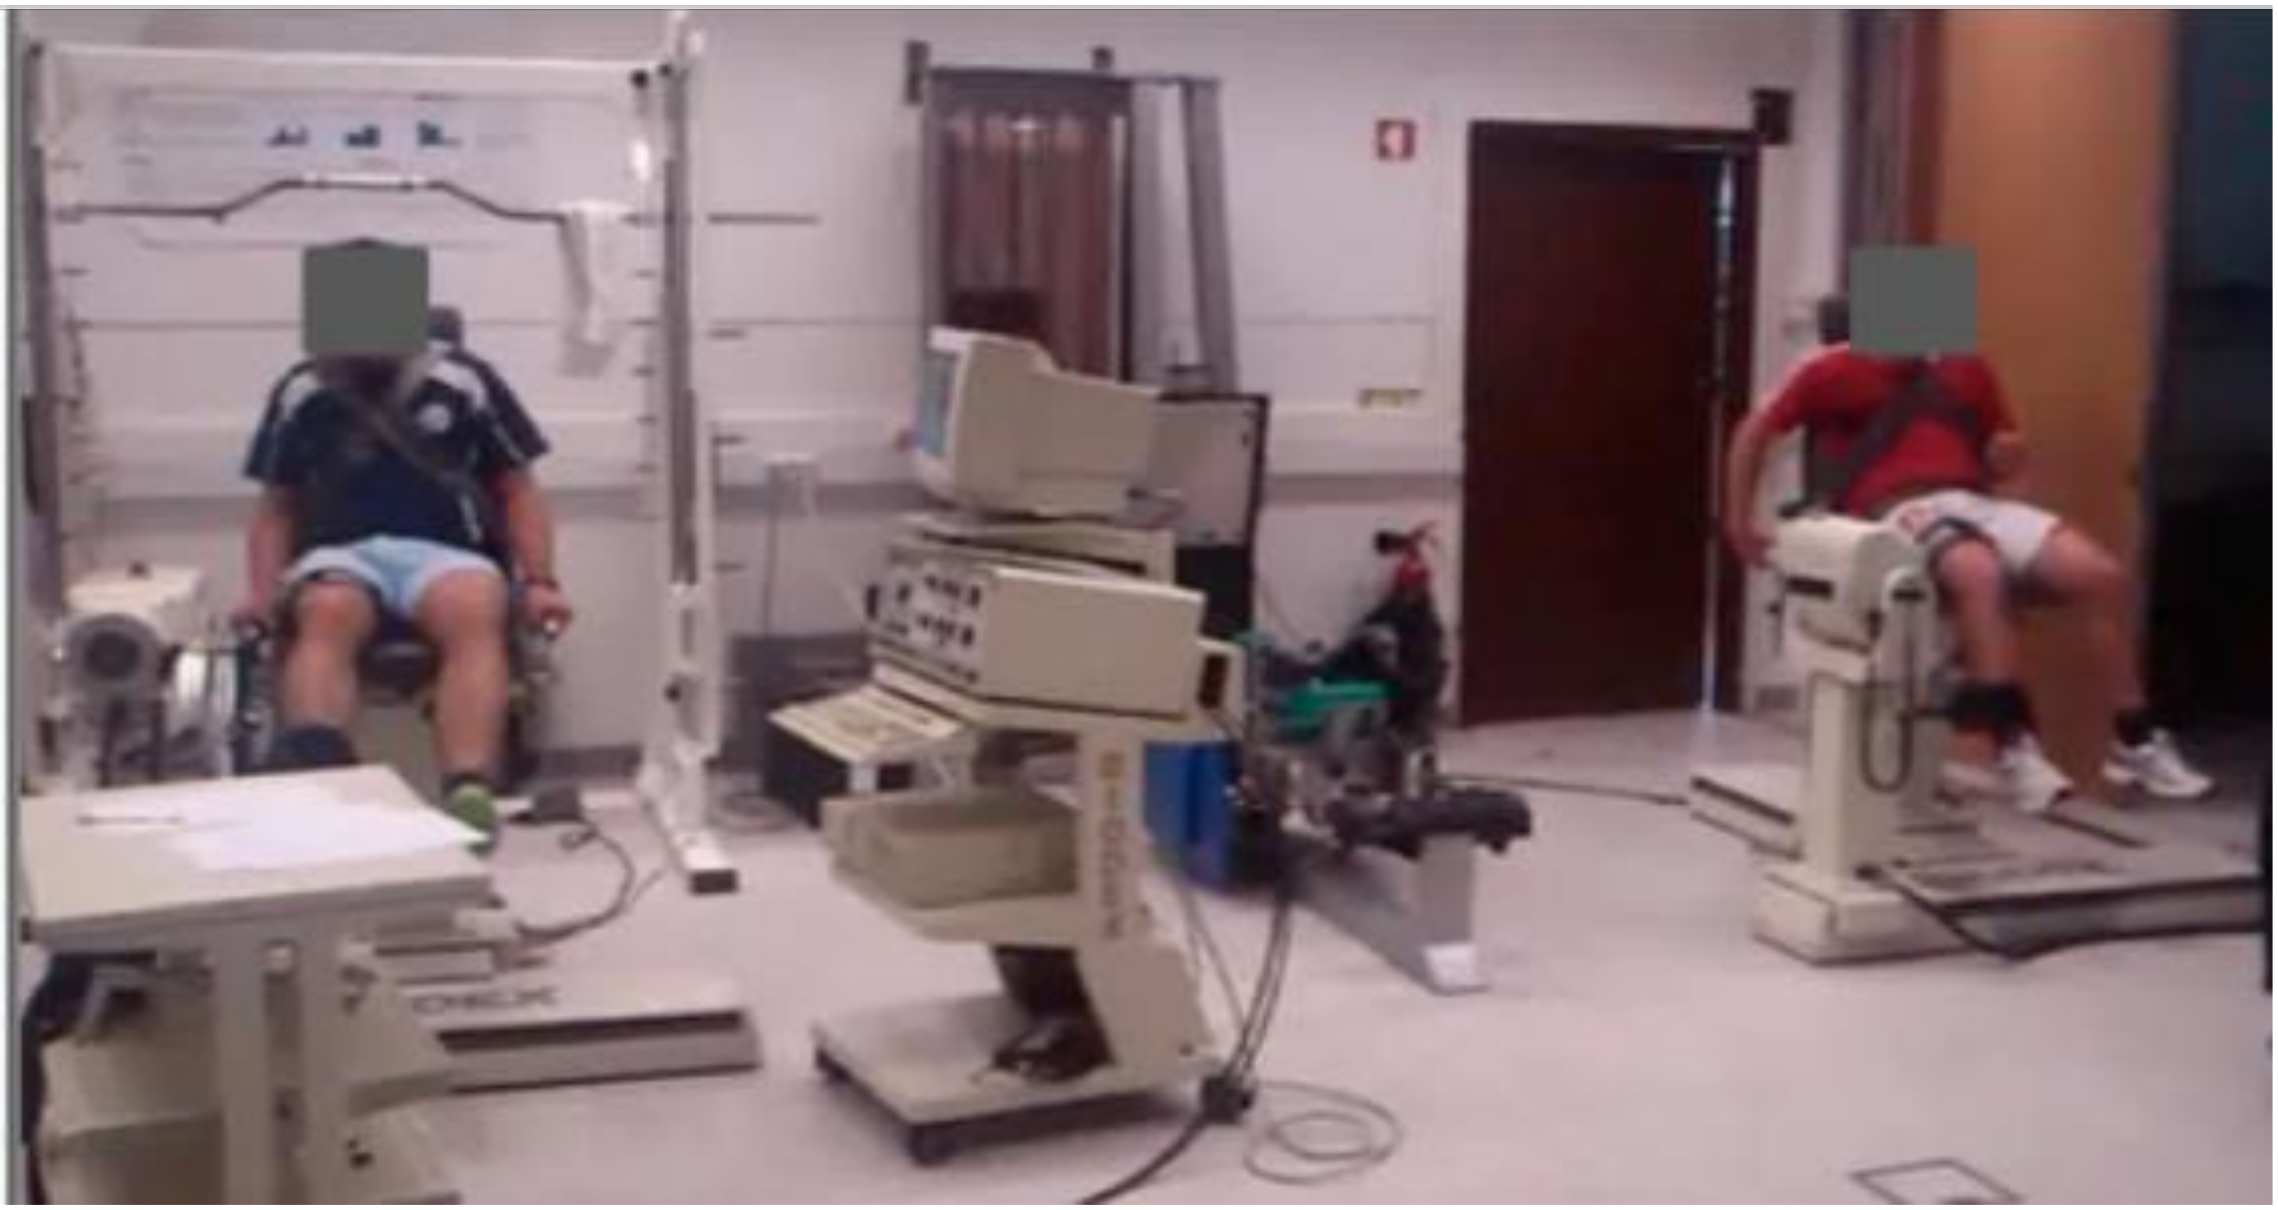
2.2. Strength Training Program
2.3. Maximal Isometric Extension Torque
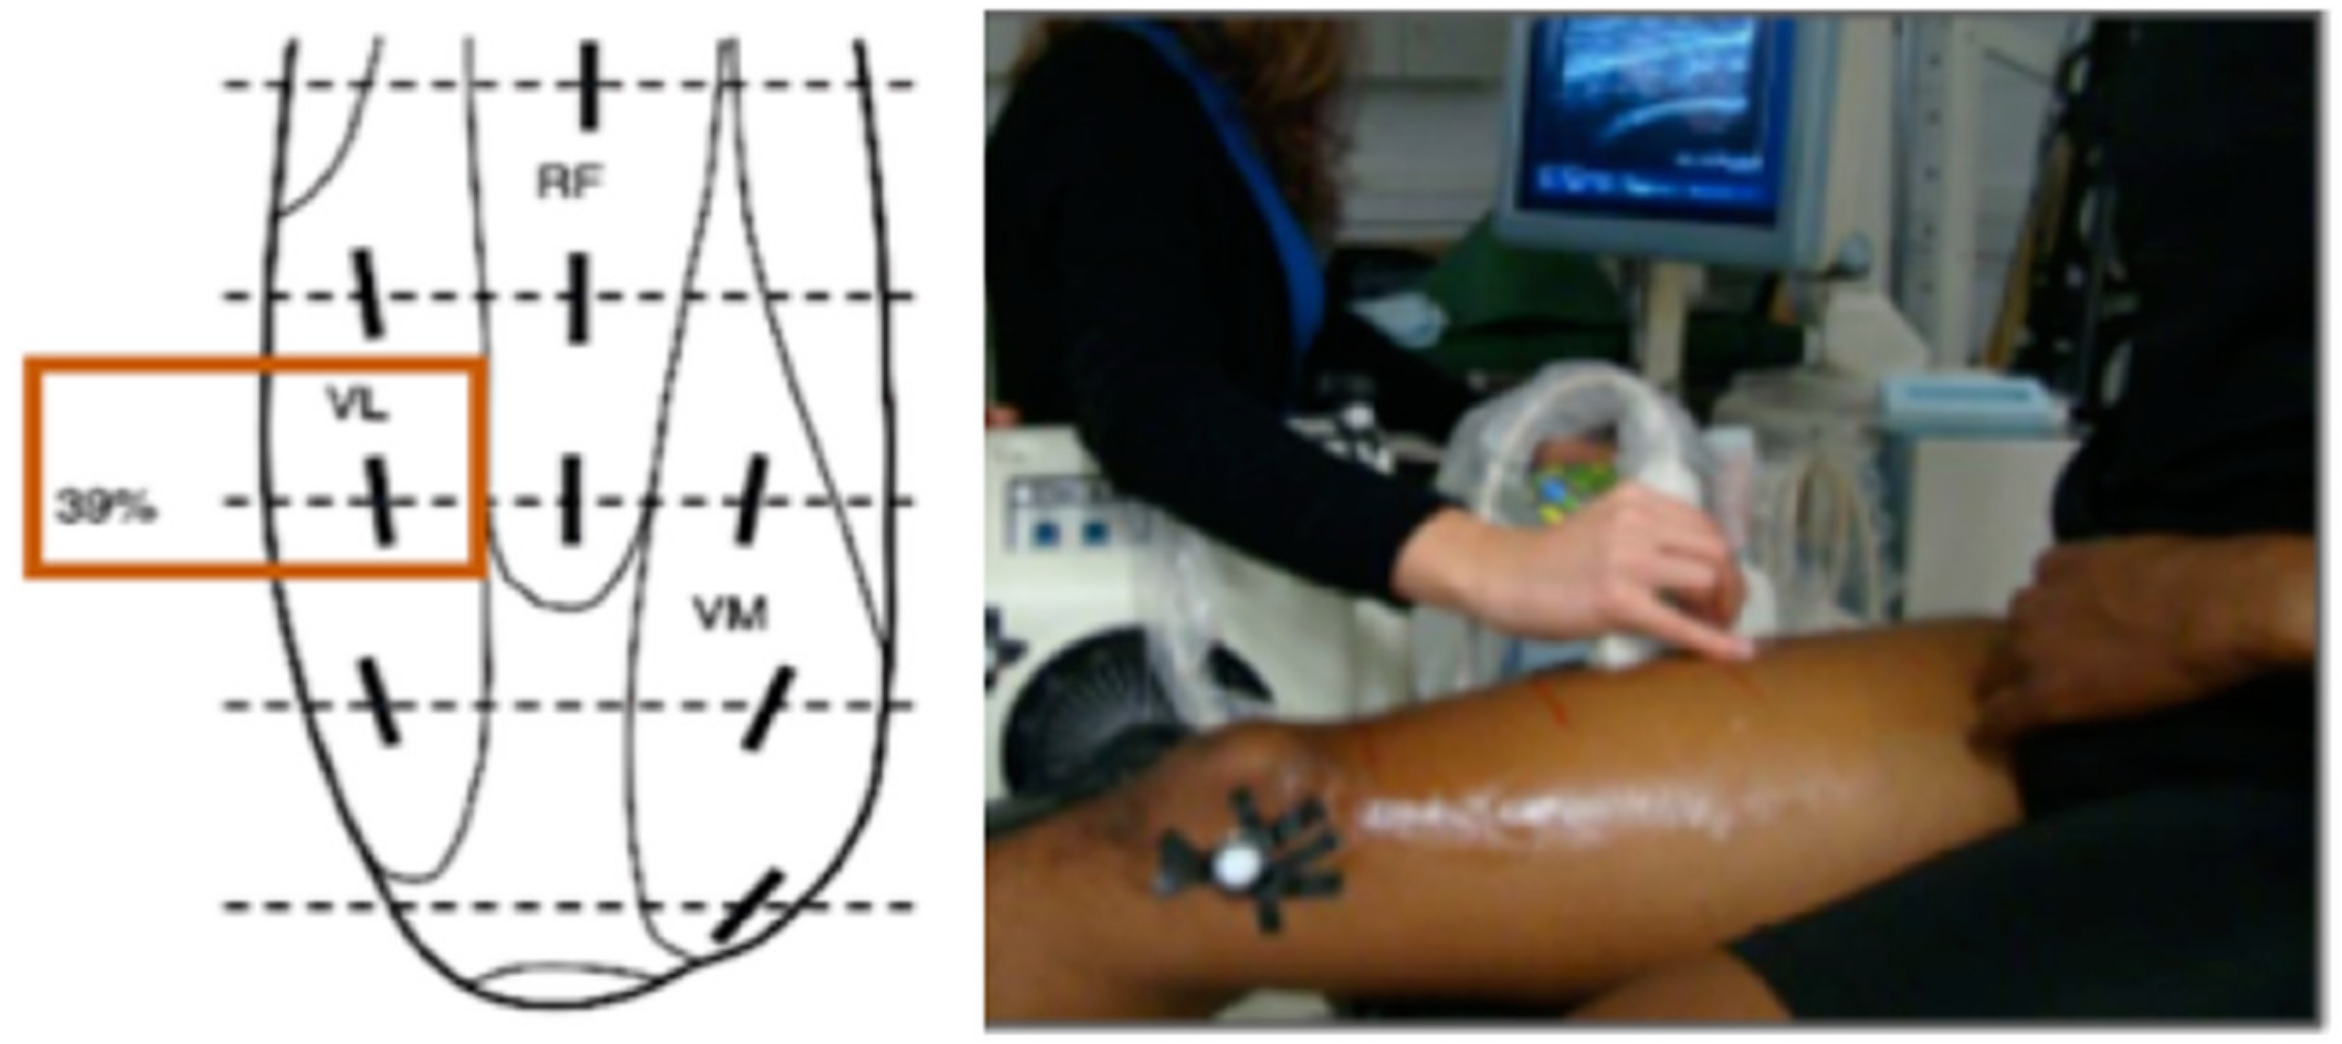
2.4. Ultrasound Scanning
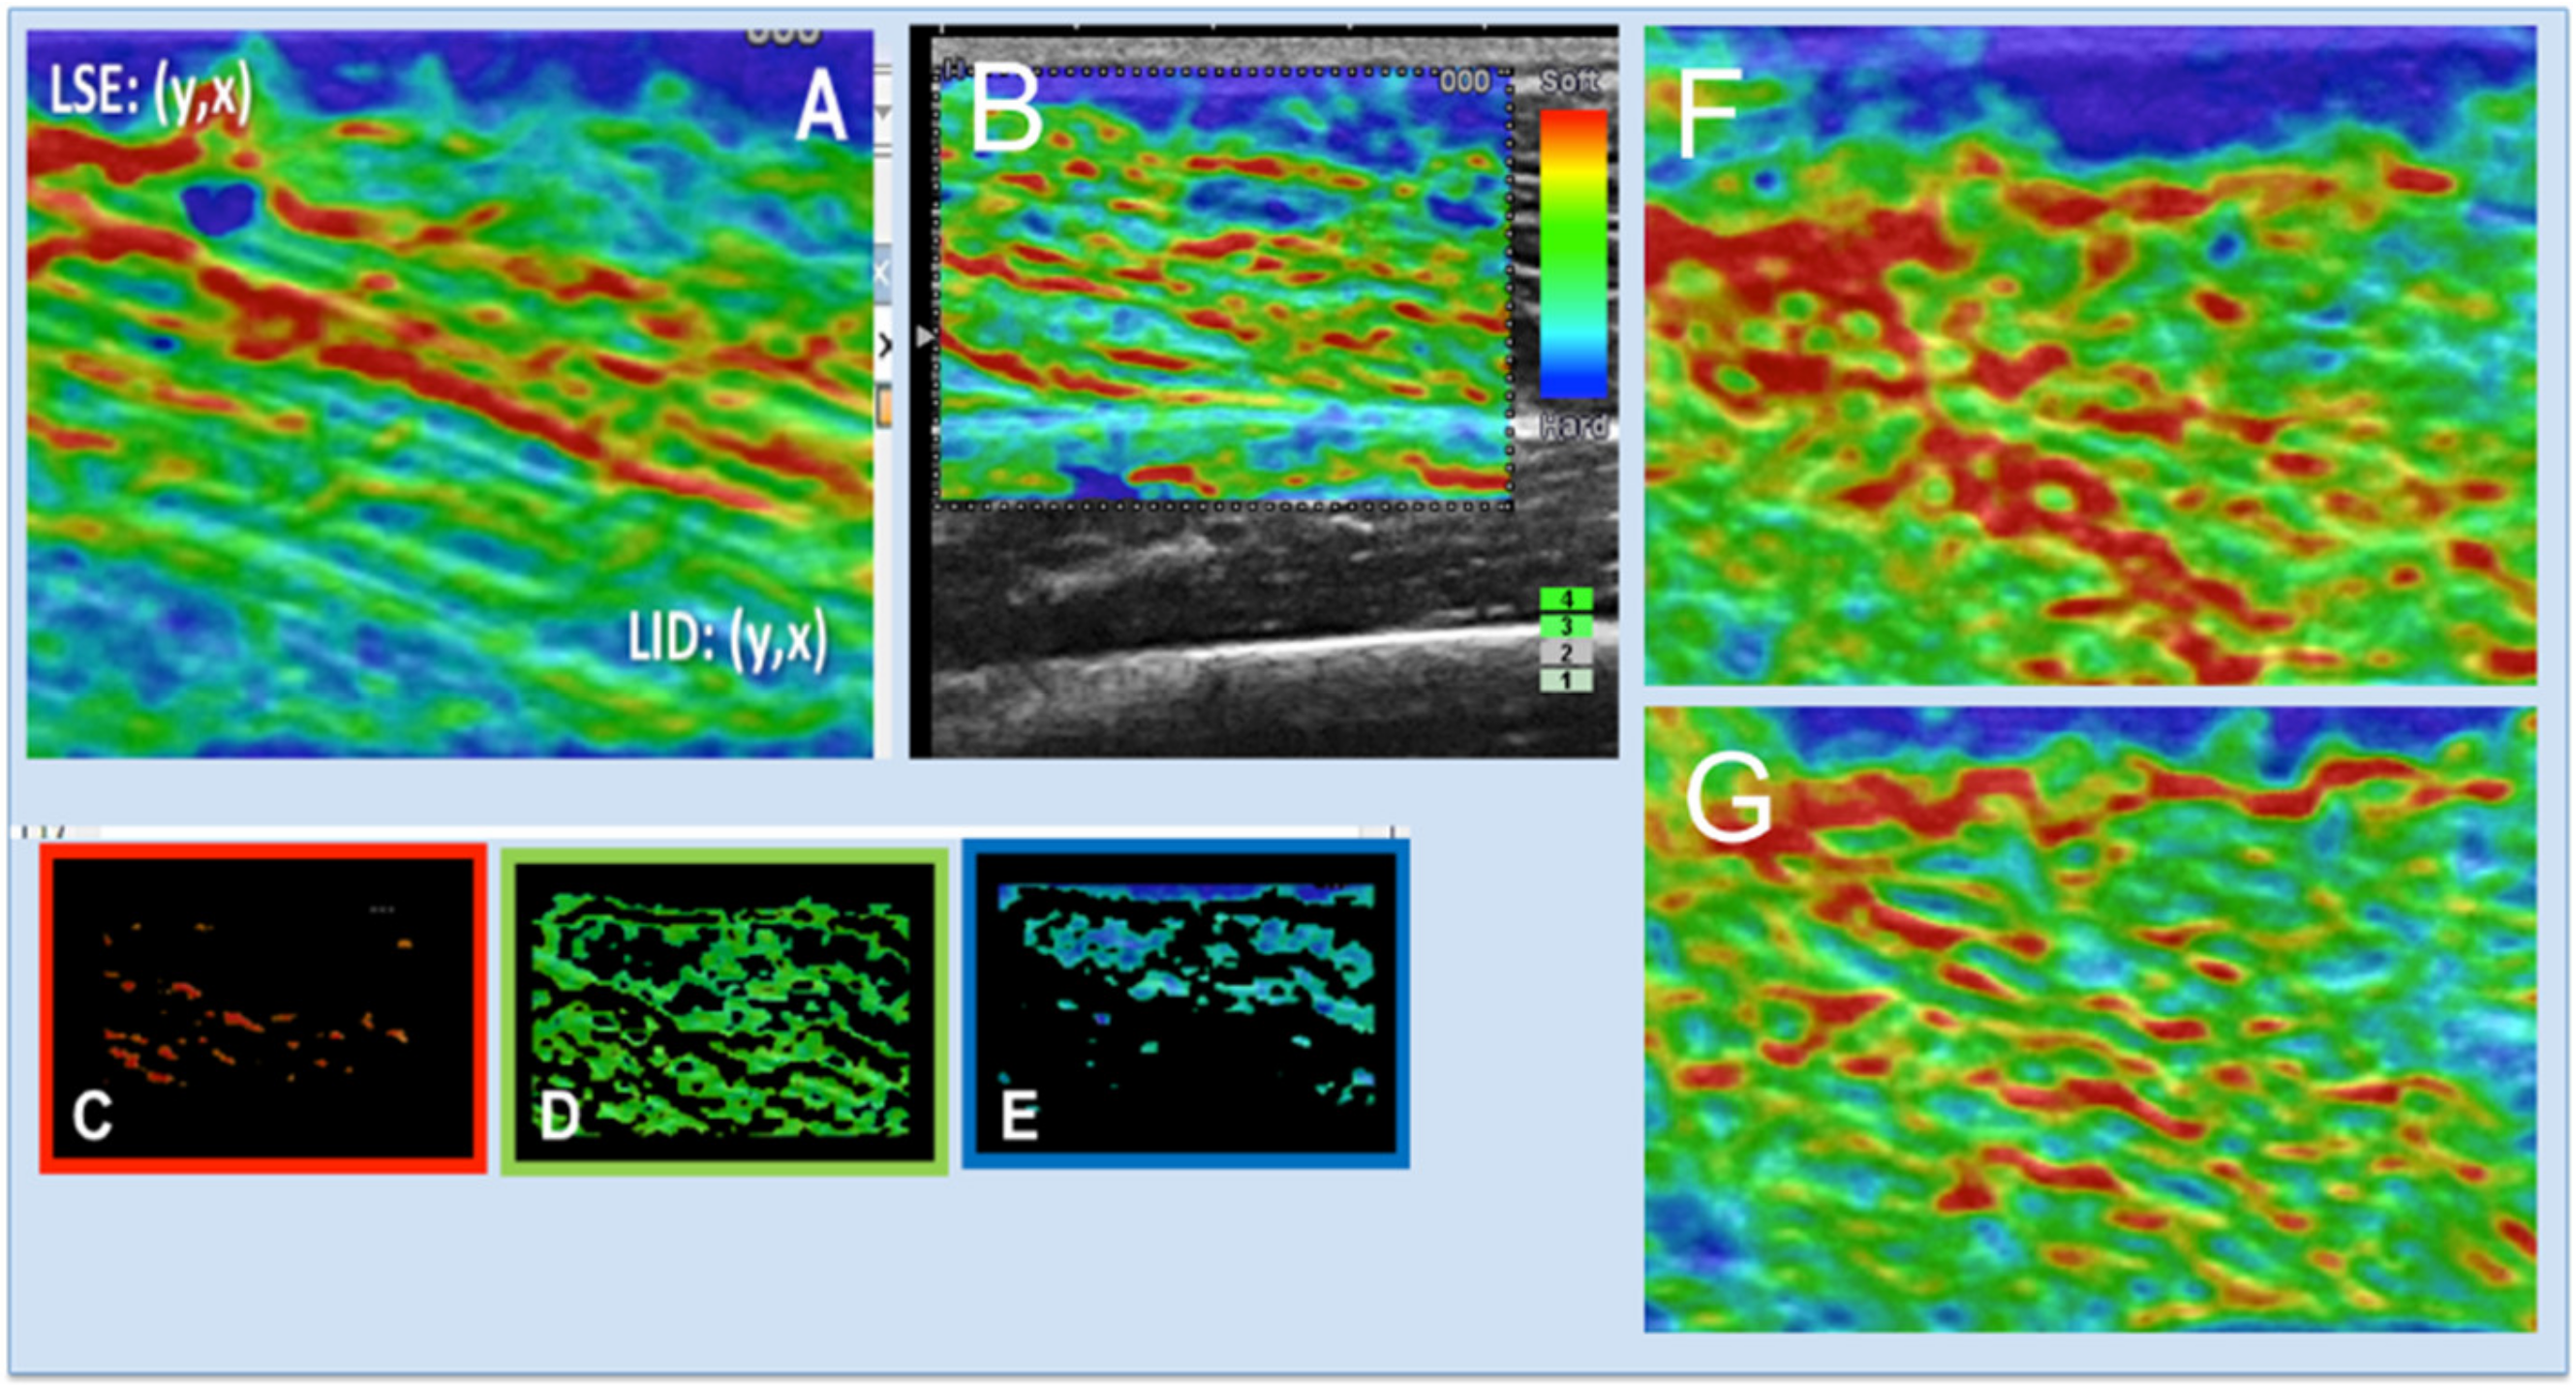
2.5. Semi-Quantitative Elastography
2.6. Statistical Analysis
3. Results
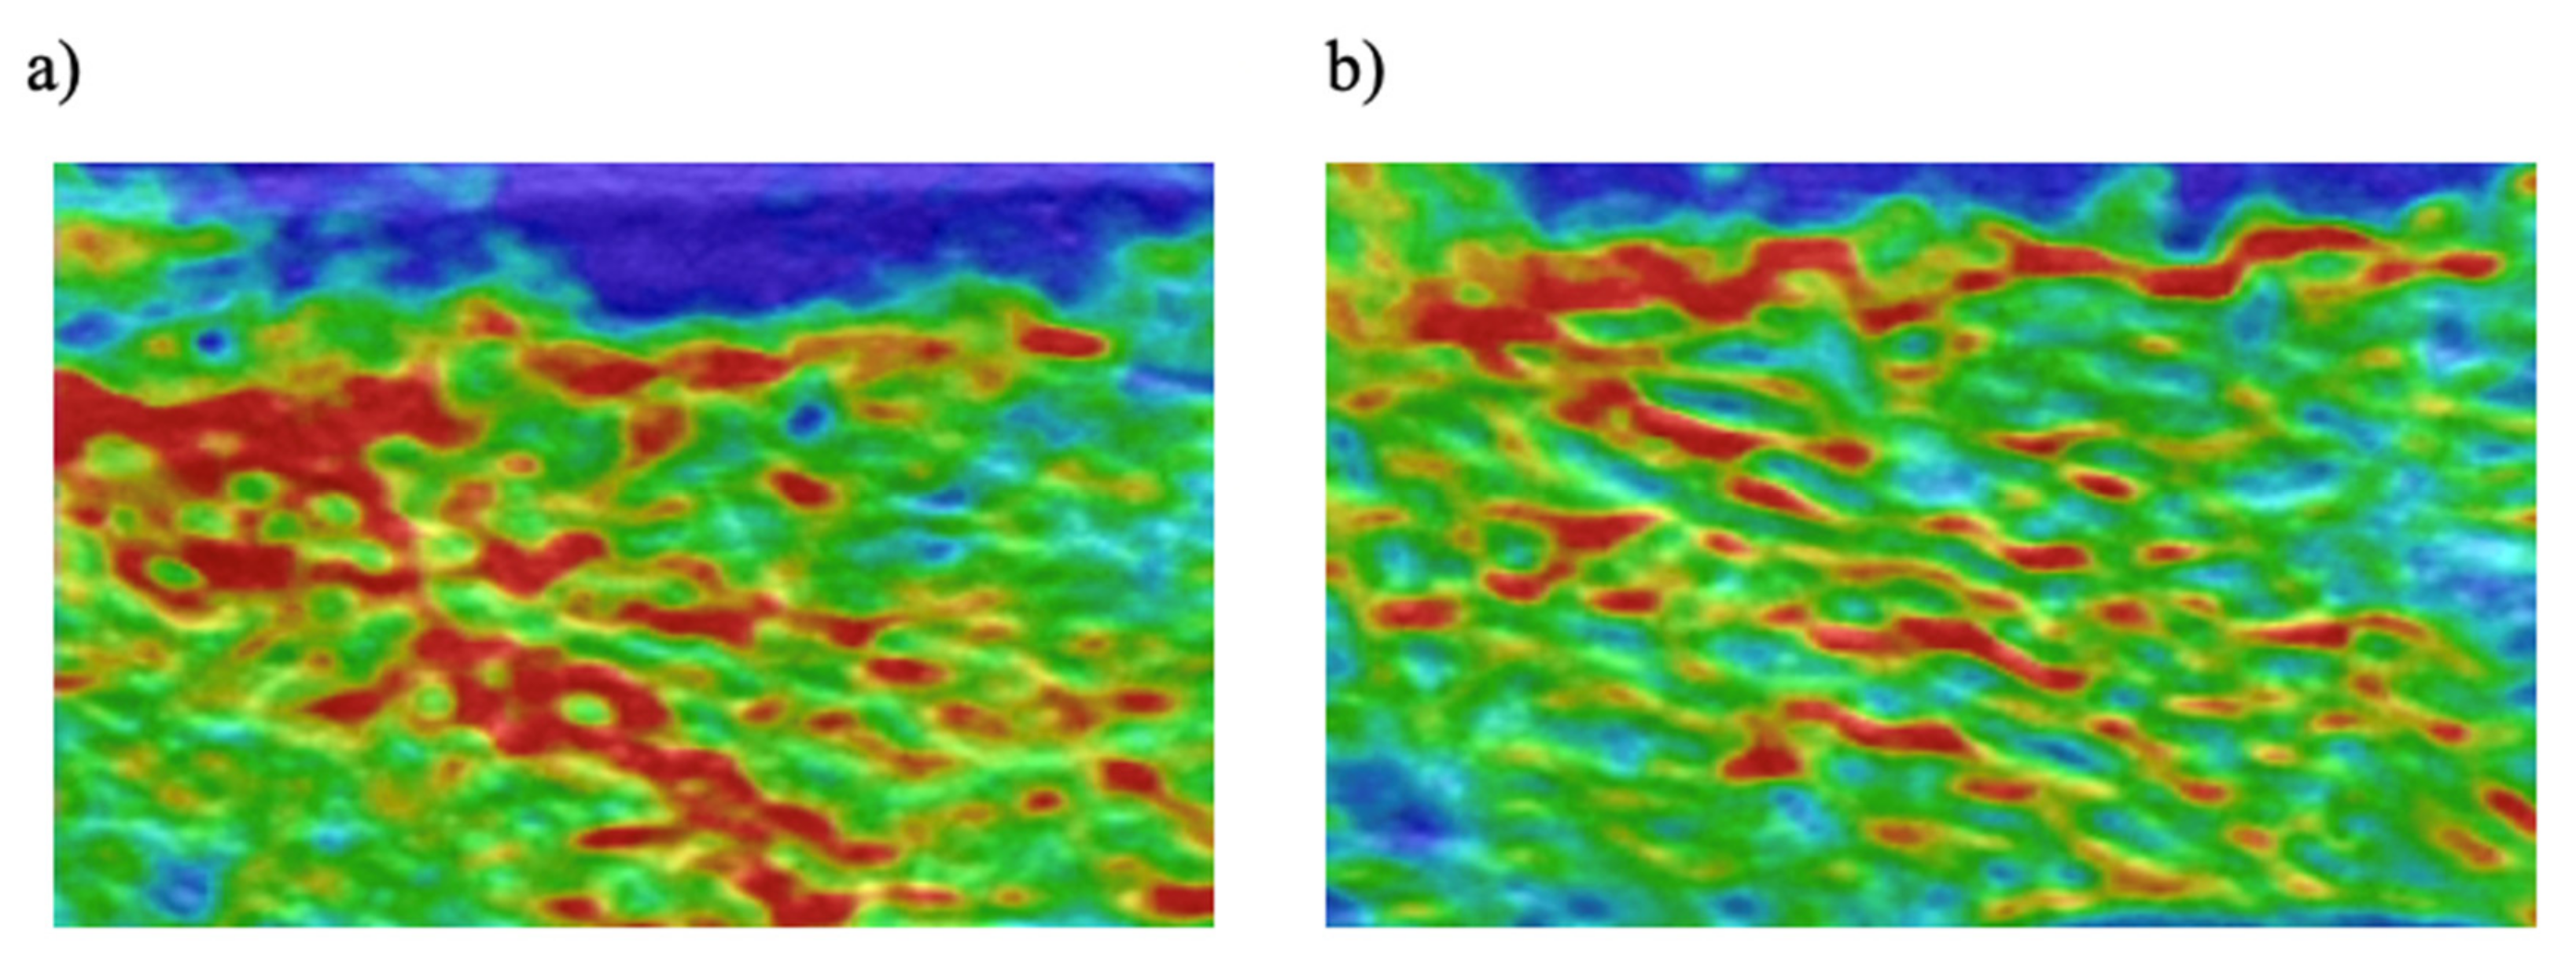
Semi-Quantitative Elastography
4. Discussion
4.1. Limitations
4.2. Practical Applications
5. Conclusions
Author Contributions
Funding
Conflicts of Interest
References
- Chan, R.; Newton, M.; Nosaka, K. Effects of set-repetition configuration in eccentric exercise on muscle damage and the repeated bout effect. Eur. J. Appl. Physiol. 2012, 112, 2653–2661. [Google Scholar] [CrossRef] [PubMed]
- Foure, A.; Nordez, A.; Cornu, C. Effects of plyometric training on passive stiffness of gastrocnemii muscles and achilles tendon. Eur. J. Appl. Physiol. 2012, 112, 2849–2857. [Google Scholar] [CrossRef] [PubMed]
- Murayama, M.; Watanabe, K.; Kato, R.; Uchiyama, T.; Yoneda, T. Association of muscle hardness with muscle tension dynamics: A physiological property. Eur. J. Appl. Physiol. 2012, 112, 105–112. [Google Scholar] [CrossRef] [PubMed]
- Akagi, R.; Kusama, S. Comparison Between Neck and Shoulder Stiffness Determined by Shear Wave Ultrasound Elastography and a Muscle Hardness Meter. Ultrasound Med. Biol. 2015, 41, 2266–2271. [Google Scholar] [CrossRef] [PubMed]
- Gennisson, J.-L.; Deffieux, T.; Fink, M.; Tanter, M. Ultrasound elastography: Principles and techniques. Diagn. Interv. Imaging 2013, 94, 487–495. [Google Scholar] [CrossRef]
- Gennisson, J.L.; Cornu, C.; Catheline, S.; Fink, M.; Portero, P. Human muscle hardness assessment during incremental isometric contraction using transient elastography. J. Biomech. 2005, 38, 1543–1550. [Google Scholar] [CrossRef]
- Nordez, A.; Guével, A.; Casari, P.; Catheline, S.; Cornu, C. Assessment of muscle hardness changes induced by a submaximal fatiguing isometric contraction. J. Electromyogr. Kinesiol. 2009, 19, 484–491. [Google Scholar] [CrossRef] [Green Version]
- Nordez, A.; Cornu, C.; McNair, P. Acute effects of static stretching on passive stiffness of the hamstring muscles calculated using different mathematical models. Clin. Biomech. 2006, 21, 755–760. [Google Scholar] [CrossRef]
- Ishikawa, H.; Muraki, T.; Morise, S.; Sekiguchi, Y.; Yamamoto, N.; Itoi, E.; Izumi, S. Changes in stiffness of the dorsal scapular muscles before and after computer work: A comparison between individuals with and without neck and shoulder complaints. Eur. J. Appl. Physiol. 2017, 117, 179–187. [Google Scholar] [CrossRef]
- Nordez, A.; Hug, F. Muscle shear elastic modulus measured using supersonic shear imaging is highly related to muscle activity level. J. Appl. Physiol. 2010, 108, 1389–1394. [Google Scholar] [CrossRef]
- Botar-Jid, C.; Damian, L.; Dudea, S.M.; Vasilescu, D.; Rednic, S.; Badea, R. The contribution of ultrasonography and sonoelastography in assessment of myositis. Med. Ultrason. 2010, 12, 120–126. [Google Scholar]
- Botar-Jid, C.; Vasilescu, D.; Damian, L.; Dumitriu, D.; Ciurea, A.; Dudea, S.M. Musculoskeletal sonoelastography. Pictorial essay. Med. Ultrason. 2012, 14, 239–245. [Google Scholar] [PubMed]
- Park, G.Y.; Kwon, D.R. Sonoelastographic evaluation of medial gastrocnemius muscles intrinsic stiffness after rehabilitation therapy with botulinum toxin an injection in spastic cerebral palsy. Arch. Phys. Med. Rehabil. 2012, 93, 2085–2089. [Google Scholar] [CrossRef] [PubMed]
- Sikdar, S.; Shah, J.P.; Gebreab, T.; Yen, R.H.; Gilliams, E.; Danoff, J.; Gerber, L.H. Novel Applications of Ultrasound Technology to Visualize and Characterize Myofascial Trigger Points and Surrounding Soft Tissue. Arch. Phys. Med. Rehabil. 2009, 90, 1829–1838. [Google Scholar] [CrossRef] [Green Version]
- Murayama, M.; Nosaka, K.; Yoneda, T.; Minamitani, K. Changes in hardness of the human elbow flexor muscles after eccentric exercise. Eur. J. Appl. Physiol. 2000, 82, 361–367. [Google Scholar] [CrossRef] [PubMed]
- Ocarino, J.M.; Fonseca, S.T.; Silva, P.L.P.; Mancini, M.C.; Gonçalves, G.G.P. Alterations of stiffness and resting position of the elbow joint following flexors resistance training. Man. Ther. 2008, 13, 411–418. [Google Scholar] [CrossRef] [PubMed]
- Tieleman, A.A.; Vinke, A.; van Alfen, N.; van Dijk, J.P.; Pillen, S.; van Engelen, B.G.M. Skeletal muscle involvement in myotonic dystrophy type 2. A comparative muscle ultrasound study. Neuromuscul. Disord. 2012, 22, 492–499. [Google Scholar] [CrossRef]
- Yanagisawa, O.; Niitsu, M.; Kurihara, T.; Fukubayashi, T. Evaluation of human muscle hardness after dynamic exercise with ultrasound real-time tissue elastography: A feasibility study. Clin. Radiol. 2011, 66, 815–819. [Google Scholar] [CrossRef]
- Brandenburg, J.E.; Eby, S.F.; Song, P.; Zhao, H.; Brault, J.S.; Chen, S.; An, K.N. Ultrasound elastography: The new frontier in direct measurement of muscle stiffness. Arch. Phys. Med. Rehabil. 2014, 95, 2207–2219. [Google Scholar] [CrossRef] [Green Version]
- Cortes, D.H.; Suydam, S.M.; Silbernagel, K.G.; Buchanan, T.S.; Elliott, D.M. Continuous Shear Wave Elastography: A New Method to Measure Viscoelastic Properties of Tendons in Vivo. Ultrasound Med. Biol. 2015, 41, 518–529. [Google Scholar] [CrossRef] [Green Version]
- Drakonaki, E.; Allen, G.; Wilson, D. Ultrasound elastography for musculoskeletal applications. Br. J. Radiol. 2012, 85, 1435–1445. [Google Scholar] [CrossRef] [PubMed] [Green Version]
- Eby, S.F.; Cloud, B.A.; Brandenburg, J.E.; Giambini, H.; Song, P.; Chen, S. Shear wave elastography of passive skeletal muscle stiffness: Influences of sex and age throughout adulthood. Clin. Biomech. 2015, 30, 22–27. [Google Scholar] [CrossRef] [PubMed] [Green Version]
- Ophir, J.; Alam, S.; Garra, B.; Kallel, F.; Konofagou, E.; Krouskop, T. Elastography: Imaging the elastic properties of soft tissues with ultrasound. J. Med. Ultrason. 2002, 29, 155–171. [Google Scholar] [CrossRef] [PubMed]
- Drakonaki, E.E.; Allen, G.M. Magnetic resonance imaging, ultrasound and real-time ultrasound elastography of the thigh muscles in congenital muscle dystrophy. Skeletal Radiol. 2010, 39, 391–396. [Google Scholar] [CrossRef] [PubMed]
- Vasilescu, D.; Vasilescu, D.; Dudea, S.; Botar-Jid, C.; Sfrângeu, S.; Cosma, D. Sonoelastography contribution in cerebral palsy spasticity treatment assessment, preliminary report: A systematic review of the literature apropos of seven patients. Med. Ultrason. 2010, 12, 306–310. [Google Scholar]
- Chan, S.T.; Fung, P.K.; Ng, N.Y.; Ngan, T.L.; Chong, M.Y.; Tang, C.N. Dynamic changes of elasticity, cross-sectional area, and fat infiltration of multifidus at different postures in men with chronic low back pain. Spine J. 2012, 12, 381–388. [Google Scholar] [CrossRef]
- Ishikawa, H.; Muraki, T.; Sekiguchi, Y.; Ishijima, T.; Morise, S.; Yamamoto, N.; Itoi, E.; Izumi, S. Noninvasive assessment of the activity of the shoulder girdle muscles using ultrasound real-time tissue elastography. J. Electromyogr. Kinesiol. 2015, 25, 723–730. [Google Scholar] [CrossRef]
- Yanagisawa, O.; Sakuma, J.; Kawakami, Y.; Suzuki, K.; Fukubayashi, T. Effect of exercise-induced muscle damage on muscle hardness evaluated by ultrasound real-time tissue elastography. Springerplus 2015, 4, 308. [Google Scholar] [CrossRef] [Green Version]
- Muraki, T.; Ishikawa, H.; Morise, S.; Yamamoto, N.; Sano, H.; Itoi, E.; Izumi, S. Ultrasound elastography-based assessment of the elasticity of the supraspinatus muscle and tendon during muscle contraction. J. Shoulder Elb. Surg. 2015, 24, 120–126. [Google Scholar] [CrossRef]
- Muraki, S.; Fukumoto, K.; Fukuda, O. Prediction of the muscle strength by the muscle thickness and hardness using ultrasound muscle hardness meter. Springerplus 2013, 2, 1–7. [Google Scholar] [CrossRef]
- Lalitha, P.; Reddy, M.C.B.; Reddy, K.J. Musculoskeletal Applications of Elastography: A Pictorial Essay of Our Initial Experience. Korean J. Radiol. 2011, 12, 365–375. [Google Scholar] [CrossRef] [PubMed]
- Akagi, R.; Shikiba, T.; Tanaka, J.; Takahashi, H. A Six-Week Resistance Training Program Does Not Change Shear Modulus of the Triceps Brachii. J. Appl. Biomech. 2016, 32, 373–378. [Google Scholar] [CrossRef] [PubMed]
- Valamatos, M.J.; Tavares, F.; Santos, R.M.; Veloso, A.P.; Mil-Homens, P. Influence of full range of motion vs. equalized partial range of motion training on muscle architecture and mechanical properties. Eur. J. Appl. Physiol. 2018, 118, 1969–1983. [Google Scholar] [CrossRef]
- Santos, R.; Valamatos, M.J.; Mil-homens, P.; Armada-da-silva, P.A.S. Radiography Muscle thickness and echo-intensity changes of the quadriceps femoris muscle during a strength training program. Radiography 2018, 1–10. [Google Scholar] [CrossRef]
- Ge, L.; Shi, B.; Song, Y.E.; Li, Y.; Wang, S.; Wang, X. Clinical value of real-time elastography quantitative parameters in evaluating the stage of liver fibrosis and cirrhosis. Exp. Ther. Med. 2015, 10, 983–990. [Google Scholar] [CrossRef] [PubMed] [Green Version]
- Roig, M.; O’Brien, K.; Kirk, G.; Murray, R.; McKinnon, P.; Shadgan, B.; Reid, W.D. The effects of eccentric versus concentric resistance training on muscle strength and mass in healthy adults: A systematic review with meta-analysis. Br. J. Sports Med. 2009, 43, 556–568. [Google Scholar] [CrossRef] [PubMed]
- Hirono, J.; Mukai, N.; Takayanagi, S.; Miyakawa, S. Changes in the hardness of the gastrocnemius muscle during a Kendo training camp as determined using ultrasound real-time tissue elastography. J. Phys. Fit. Sports Med. 2016, 5, 239–245. [Google Scholar] [CrossRef] [Green Version]
- Niitsu, M.; Michizaki, A.; Endo, A.; Takei, H.; Yanagisawa, O. Muscle hardness measurement by using ultrasound elastography: A feasibility study. Acta Radiol. 2011, 52, 99–105. [Google Scholar] [CrossRef]
- Debernard, L.; Robert, L.; Charleux, F.; Bensamoun, S.F. Characterization of muscle architecture in children and adults using magnetic resonance elastography and ultrasound techniques. J. Biomech. 2011, 44, 397–401. [Google Scholar] [CrossRef]
- Paluch, Ł.; Nawrocka-Laskus, E.; Wieczorek, J.; Mruk, B.; Frel, M.; Walecki, J. Use of Ultrasound Elastography in the Assessment of the Musculoskeletal System. Polish J. Radiol. 2016, 81, 240–246. [Google Scholar] [CrossRef] [Green Version]
- Kim, S.; Park, H.; Lee, S. Usefulness of strain elastography of the musculoskeletal system. Ultrasonography 2015, 35, 104–109. [Google Scholar] [CrossRef]
- Chino, K.; Akagi, R.; Dohi, M.; Fukashiro, S.; Takahashi, H. Reliability and Validity of Quantifying Absolute Muscle Hardness Using Ultrasound Elastography. PLoS ONE 2012, 7, e45764. [Google Scholar] [CrossRef] [PubMed]
- Yanagisawa, O.; Kudo, H.; Takahashi, N.; Yoshioka, H. Magnetic resonance imaging evaluation of cooling on blood flow and oedema in skeletal muscles after exercise. Eur. J. Appl. Physiol. 2004, 91, 737–740. [Google Scholar] [CrossRef] [PubMed]
- Sjogaard, G.; Saltin, B. Extra- and intracellular water spaces in muscles of man at rest and with dynamic exercise. Am. J. Physiol. Regul. Integr. Comp. Physiol. 1982, 243, 271–280. [Google Scholar] [CrossRef]
- Nosaka, K.; Newton, M. Concentric or eccentric training effect on eccentric exercise-induced muscle damage. Med. Sci. Sports Exerc. 2002, 34, 63–69. [Google Scholar] [CrossRef] [PubMed] [Green Version]
- Toledo, M.P. Reliability of Ultrasound Imaging Measures of Soft Tissue Stiffness Using Elastography in the Posterior Aspect of the Leg. Master’s Thesis, Unitec Institute of Technology, Mount Albert, New Zealand, 2016. [Google Scholar]
- Chleboun, G.S.; Howell, J.N.; Conatser, R.R.; Giesey, J.J. The relationship between elbow flexor volume and angular stiffness at the elbow. Clin. Biomech. 1997, 12, 383–392. [Google Scholar] [CrossRef]
- Bensamoun, S.; Stevens, L.; Fleury, M.J.; Bellon, G.; Goubel, F.; Tho, M.H.B. Macroscopic-microscopic characterization of the passive mechanical properties in rat soleus muscle. J. Biomech. 2006, 39, 568–578. [Google Scholar] [CrossRef]
- Taş, S.; Yılmaz, S.; Onur, M.R.; Soylu, A.R.; Altuntaş, O.; Korkusuz, F. Patellar tendon mechanical properties change with gender, body mass index and quadriceps femoris muscle strength. Acta Orthop. Traumatol. Turc. 2017, 51, 54–59. [Google Scholar] [CrossRef]
- Leonard, C.T.; Brown, J.S.; Price, T.R.; Queen, S.A.; Mikhailenok, E.L. Comparison of surface electromyography and myotonometric measurements during voluntary isometric contractions. J. Electromyogr. Kinesiol. 2004, 14, 709–714. [Google Scholar] [CrossRef] [Green Version]
- Konofagou, E.; Ophir, J.; Krouskop, T. Elastography: From Theory to Clinical Applications. In Proceedings of the Summer Bioengineering Conference, Key Biscayne, FL, USA, 25–29 June 2003; pp. 367–368. [Google Scholar]
- Taljanovic, M.S.; Melville, D.M.; Klauser, A.S.; Latt, L.D.; Arif-Tiwari, H.; Gao, L.; Russell, W. Advances in Lower Extremity Ultrasound. Curr. Radiol. Rep. 2015, 3, 19. [Google Scholar] [CrossRef]
- Lacourpaille, L.; Hug, F.; Bouillard, K.; Hogrel, J.-Y.; Nordez, A. Supersonic shear imaging provides a reliable measurement of resting muscle shear elastic modulus. Physiol. Meas. 2012, 33, N19–N28. [Google Scholar] [CrossRef] [PubMed]

| Maximal Voluntary Isometric Torque (Nm) | ||||
|---|---|---|---|---|
| Pre-Training | Post-Training | |||
| Group | Right Limb | Left Limb | Right Limb | Left Limb |
| Control | 303.5 ± 30.8 | 300.0 ± 35.7 | ||
| GCon | 300.3 ± 55.2 | 284.1 ± 46.7 | 377.3 ± 54.6 *** | 374.3 ± 54.6 *** |
| GEcc | 241.9 ± 35.0 | 229.2 ± 12.5 | 328.9 ± 42.8 *** | 328.9 ± 42.8 *** |
| Fraction of Colour Pixels (a.u.) | |||||
|---|---|---|---|---|---|
| Pre-Training | Post-Training | ||||
| Group | Colour | Right Side | Left Side | Right Side | Left Side |
| Control | Red | 0.156 ± 0.058 | 0.144 ± 0.065 | ||
| Blue | 0.297 ± 0.043 | 0.325 ± 0.079 | |||
| Green | 0.261 ± 0.067 | 0.333 ± 0.079 ** | |||
| GCon | Red | 0.160 ± 0.050 | 0.111 ± 0.052 | 0.082 ± 0.023 *** | 0.088 ± 0.027 *** |
| Blue | 0.295 ± 0.037 | 0.319 ± 0.043 | 0.341 ± 0.039 ** | 0.354 ± 0.041 ** | |
| Green | 0.290 ± 0.090 | 0.354 ± 0.095 | 0.381 ± 0.076 * | 0.359 ± 0.063 * | |
| GEcc | Red | 0.126 ± 0.056 | 0.131 ± 0.063 | 0.092 ± 0.020 *** | 0.089 ± 0.021 *** |
| Blue | 0.311 ± 0.048 | 0.284 ± 0.036 | 0.348 ± 0.063 ** | 0.313 ± 0.073 ** | |
| Green | 0.344 ± 0.096 | 0.368 ± 0.010 | 0.357 ± 0.069 * | 0.387 ± 0.097 * | |
| Colour Maping for Vastus Laterallis | 1st Image Mean Fraction | ICC Consistency | SEM | SDC |
|---|---|---|---|---|
| Right Side | ||||
| Red colour | 0.15 ± 0.07 | 0.59 | 0.05 | 0.13 |
| Blue colour | 0.30 ± 0.11 | 0.77 | 0.06 | 0.16 |
| Green colour | 0.30 ± 0.05 | 0.53 | 0.04 | 0.11 |
| Total | 0.75 | |||
| Left Side | ||||
| Red colour | 0.12 ± 0.07 | 0.67 | 0.04 | 0.12 |
| Blue colour | 0.35 ± 0.10 | 0.68 | 0.06 | 0.16 |
| Green colour | 0.31 ± 0.05 | 0.63 | 0.04 | 0.10 |
| Total | 0.78 |
| Group | Colour Mapping for Vastus Lateralis | 1st Session Mean Fraction | 2st Session Mean Fraction | ICC Consistency |
|---|---|---|---|---|
| Control | Red colour | 0.15 ± 0.05 | 0.11 ± 0.02 | 0.44 |
| Blue colour | 0.25 ± 0.08 | 0.34 ± 0.11 | 0.75 | |
| Green colour | 0.32 ± 0.07 | 0.33 ± 0.07 | 0.60 |
© 2020 by the authors. Licensee MDPI, Basel, Switzerland. This article is an open access article distributed under the terms and conditions of the Creative Commons Attribution (CC BY) license (http://creativecommons.org/licenses/by/4.0/).
Share and Cite
Santos, R.; Valamatos, M.J.; Mil-Homens, P.; Armada-da-Silva, P. The Effect of Strength Training on Vastus Lateralis’ Stiffness: An Ultrasound Quasi-Static Elastography Study. Int. J. Environ. Res. Public Health 2020, 17, 4381. https://doi.org/10.3390/ijerph17124381
Santos R, Valamatos MJ, Mil-Homens P, Armada-da-Silva P. The Effect of Strength Training on Vastus Lateralis’ Stiffness: An Ultrasound Quasi-Static Elastography Study. International Journal of Environmental Research and Public Health. 2020; 17(12):4381. https://doi.org/10.3390/ijerph17124381
Chicago/Turabian StyleSantos, Rute, Maria João Valamatos, Pedro Mil-Homens, and Paulo Armada-da-Silva. 2020. "The Effect of Strength Training on Vastus Lateralis’ Stiffness: An Ultrasound Quasi-Static Elastography Study" International Journal of Environmental Research and Public Health 17, no. 12: 4381. https://doi.org/10.3390/ijerph17124381