Peak Oxygen Uptake and Exercise Capacity of Children Undergoing Leukemia Treatment


Abstract
:1. Introduction
2. Materials and Methods
2.1. Study Group
2.2. Research Methods
2.2.1. Cardiorespiratory Fitness
- −
- After a warm-up period, which prepared the body for greater effort, the test started. During the main part of the test, the load was increased at 1 min intervals by 15 or 20 W (depending on the height of the subject). During the exercise stress test, the pedal frequency was constant (60–80 rotations per minute; RPM). The peak value of exercise was defined as the moment when one of the three criteria was met and the test was then interrupted;
- −
- The decrease in pedal frequency < 60 RPM despite the strong verbal encouragement of the researcher;
- −
- HRpeak > 180 beats per minute (bpm);
- −
- Peak respiratory exchange ratio (RERpeak) > 1.0.
2.2.2. Subjective Assessment of the Physical Activity Level
2.3. Ethics
2.4. Statistical Analysis
3. Results
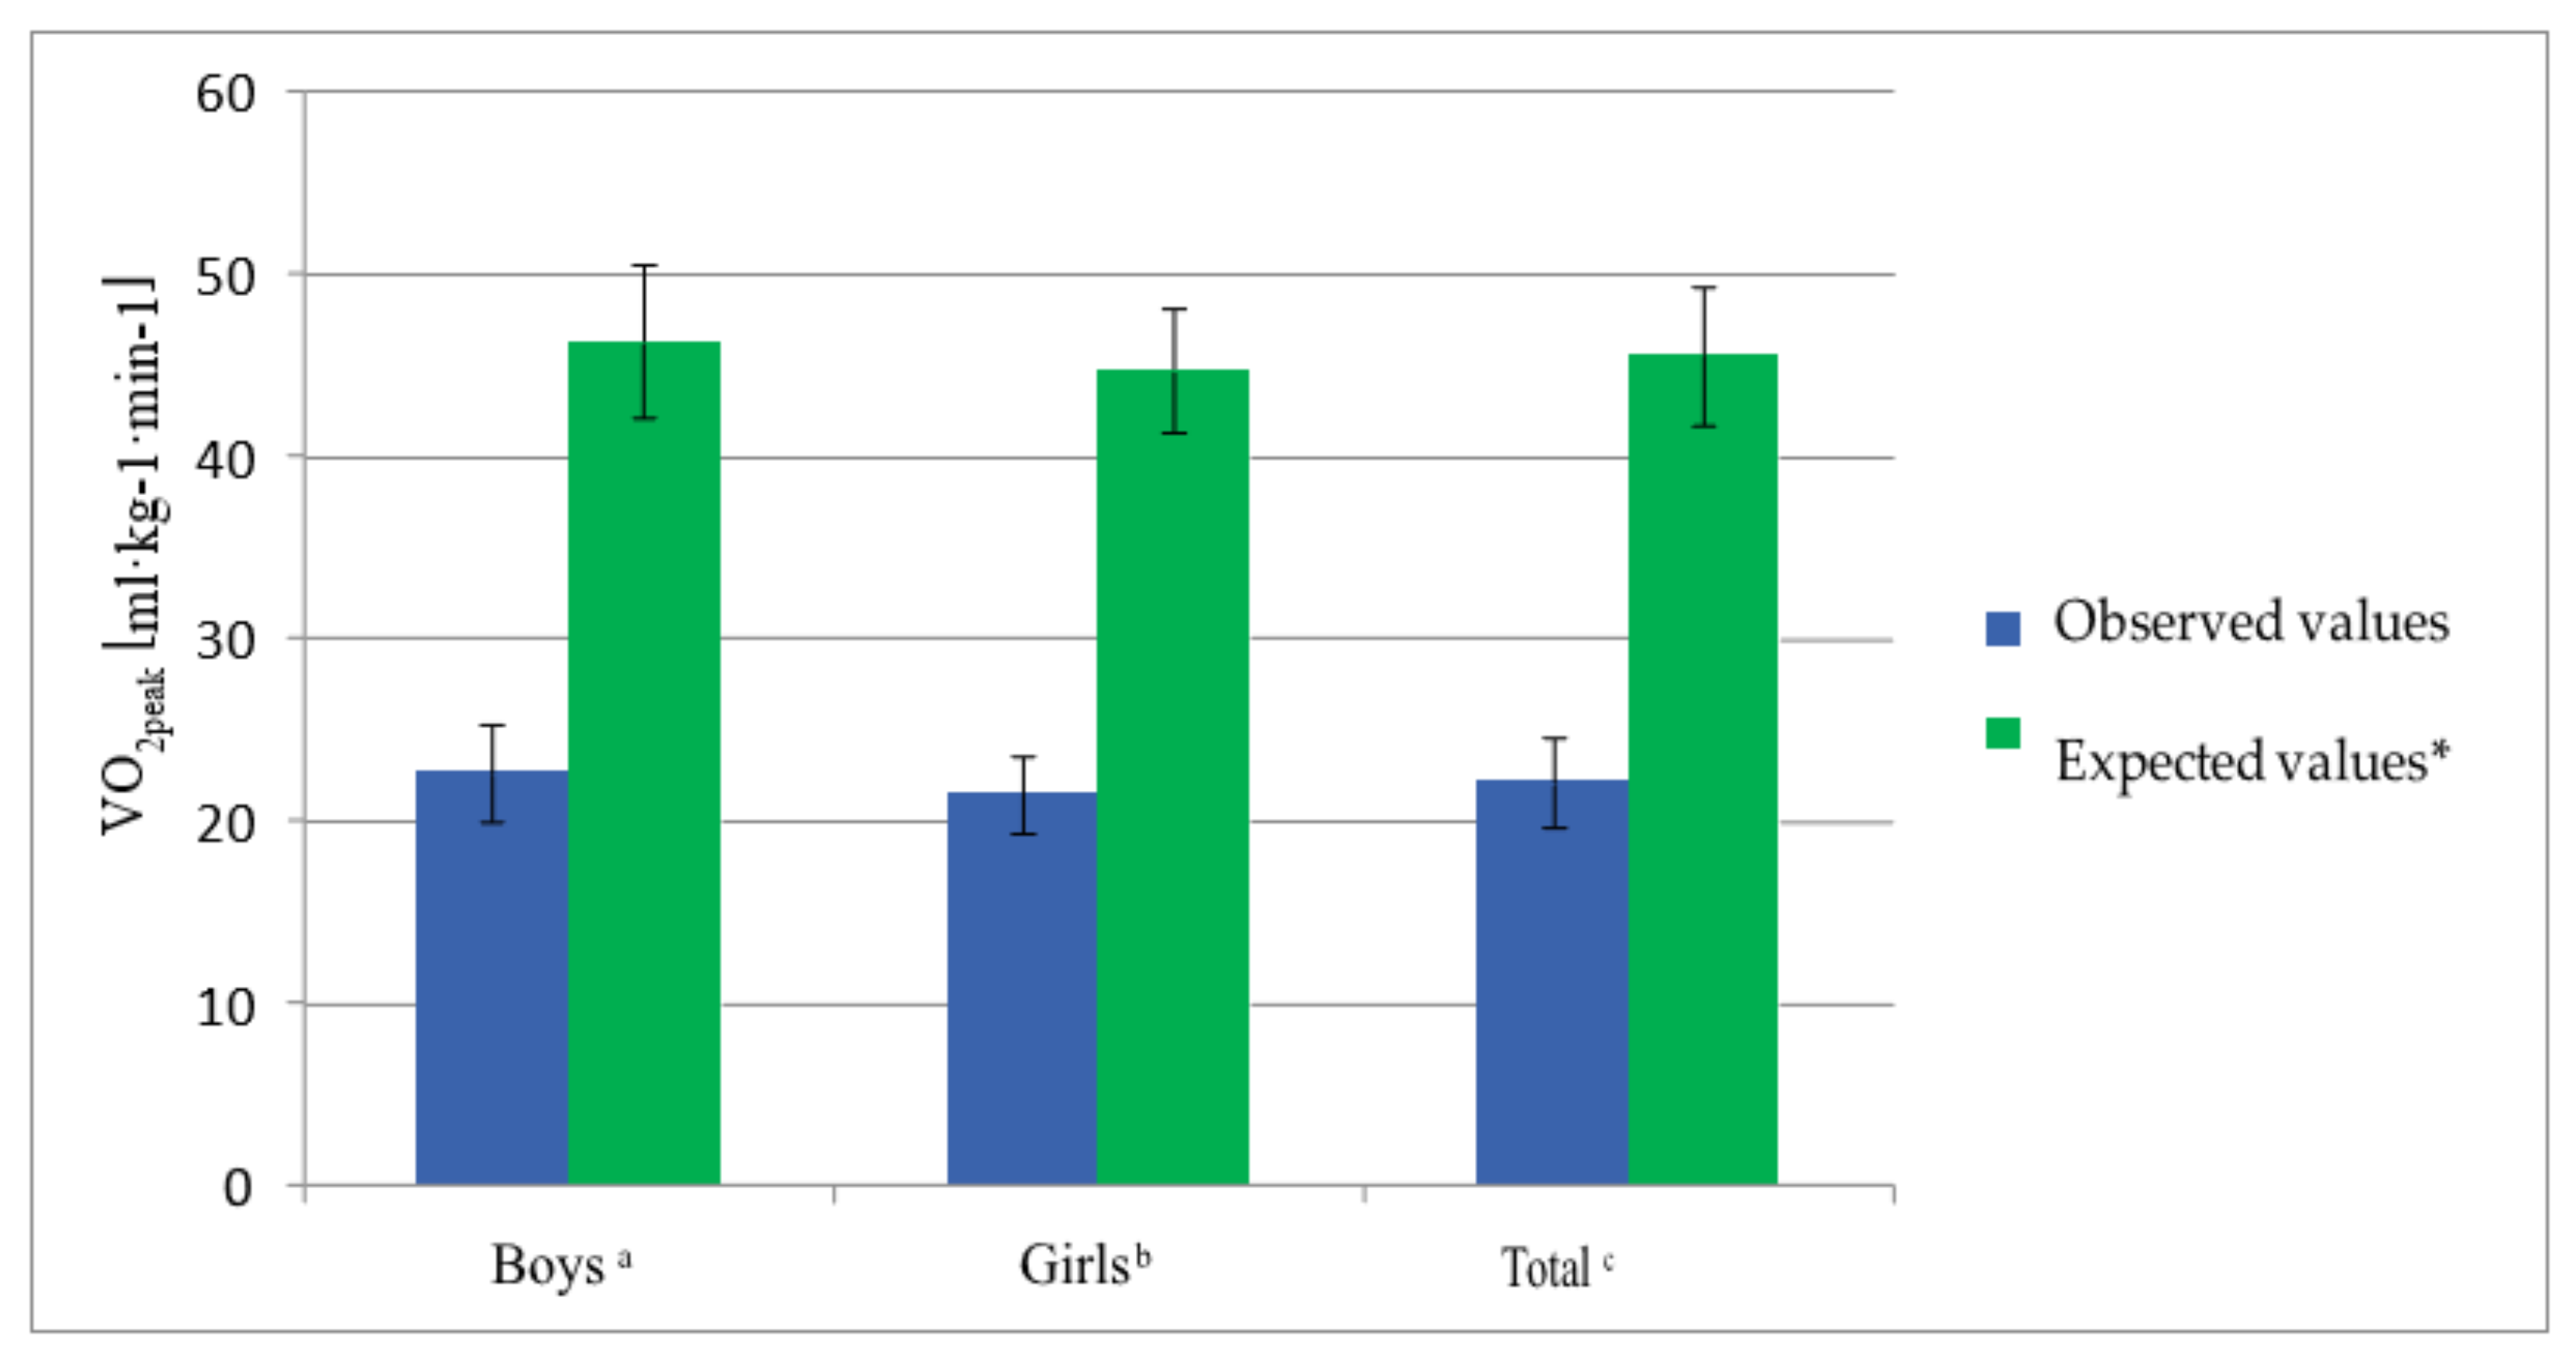
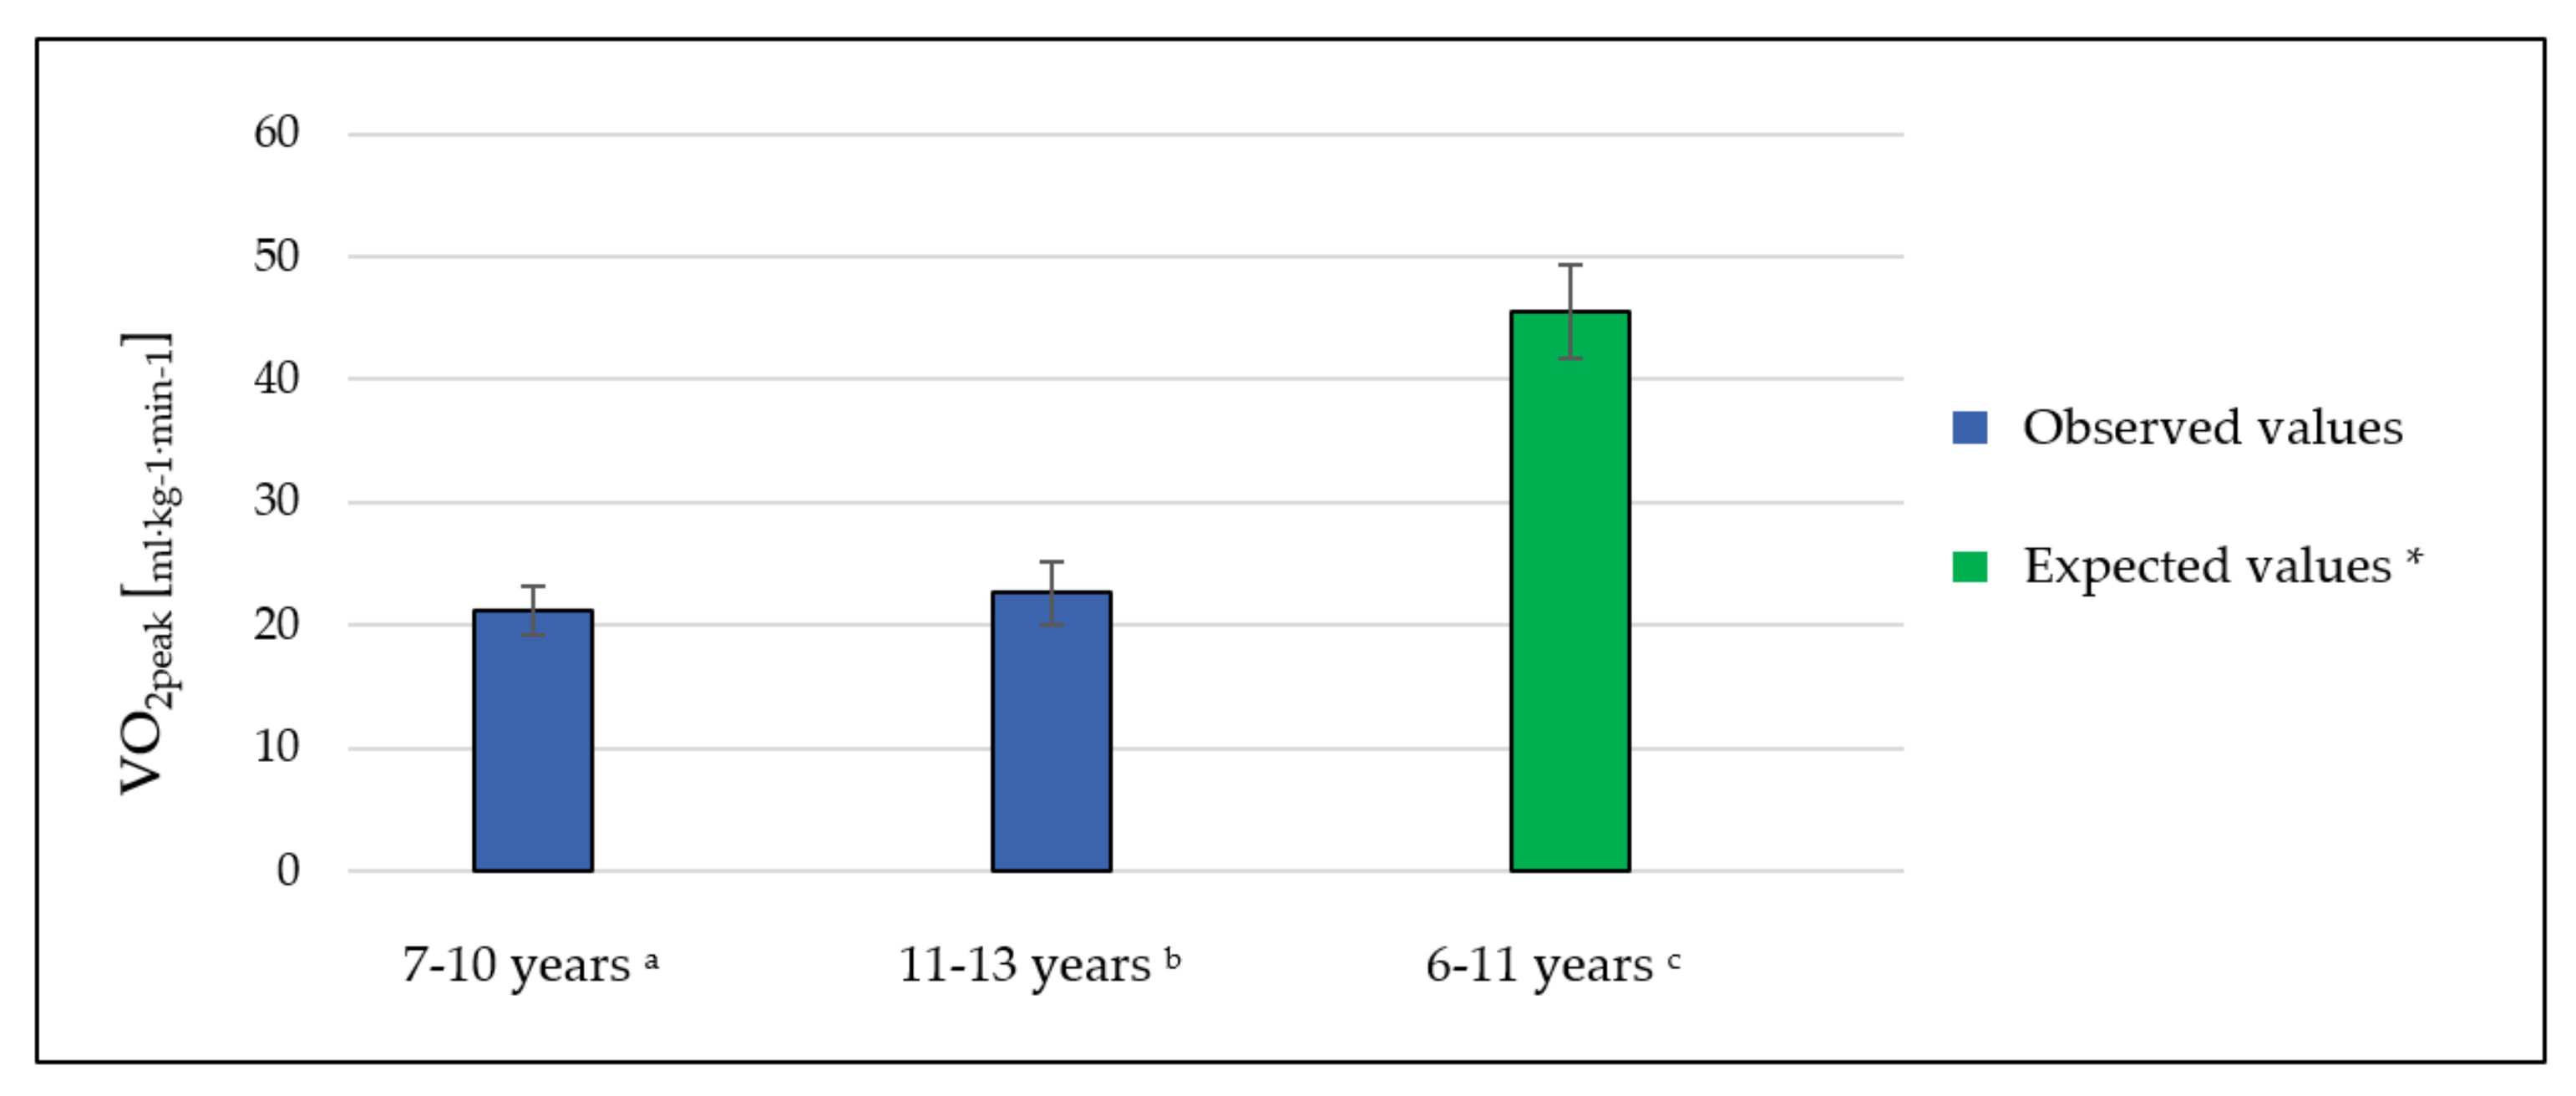
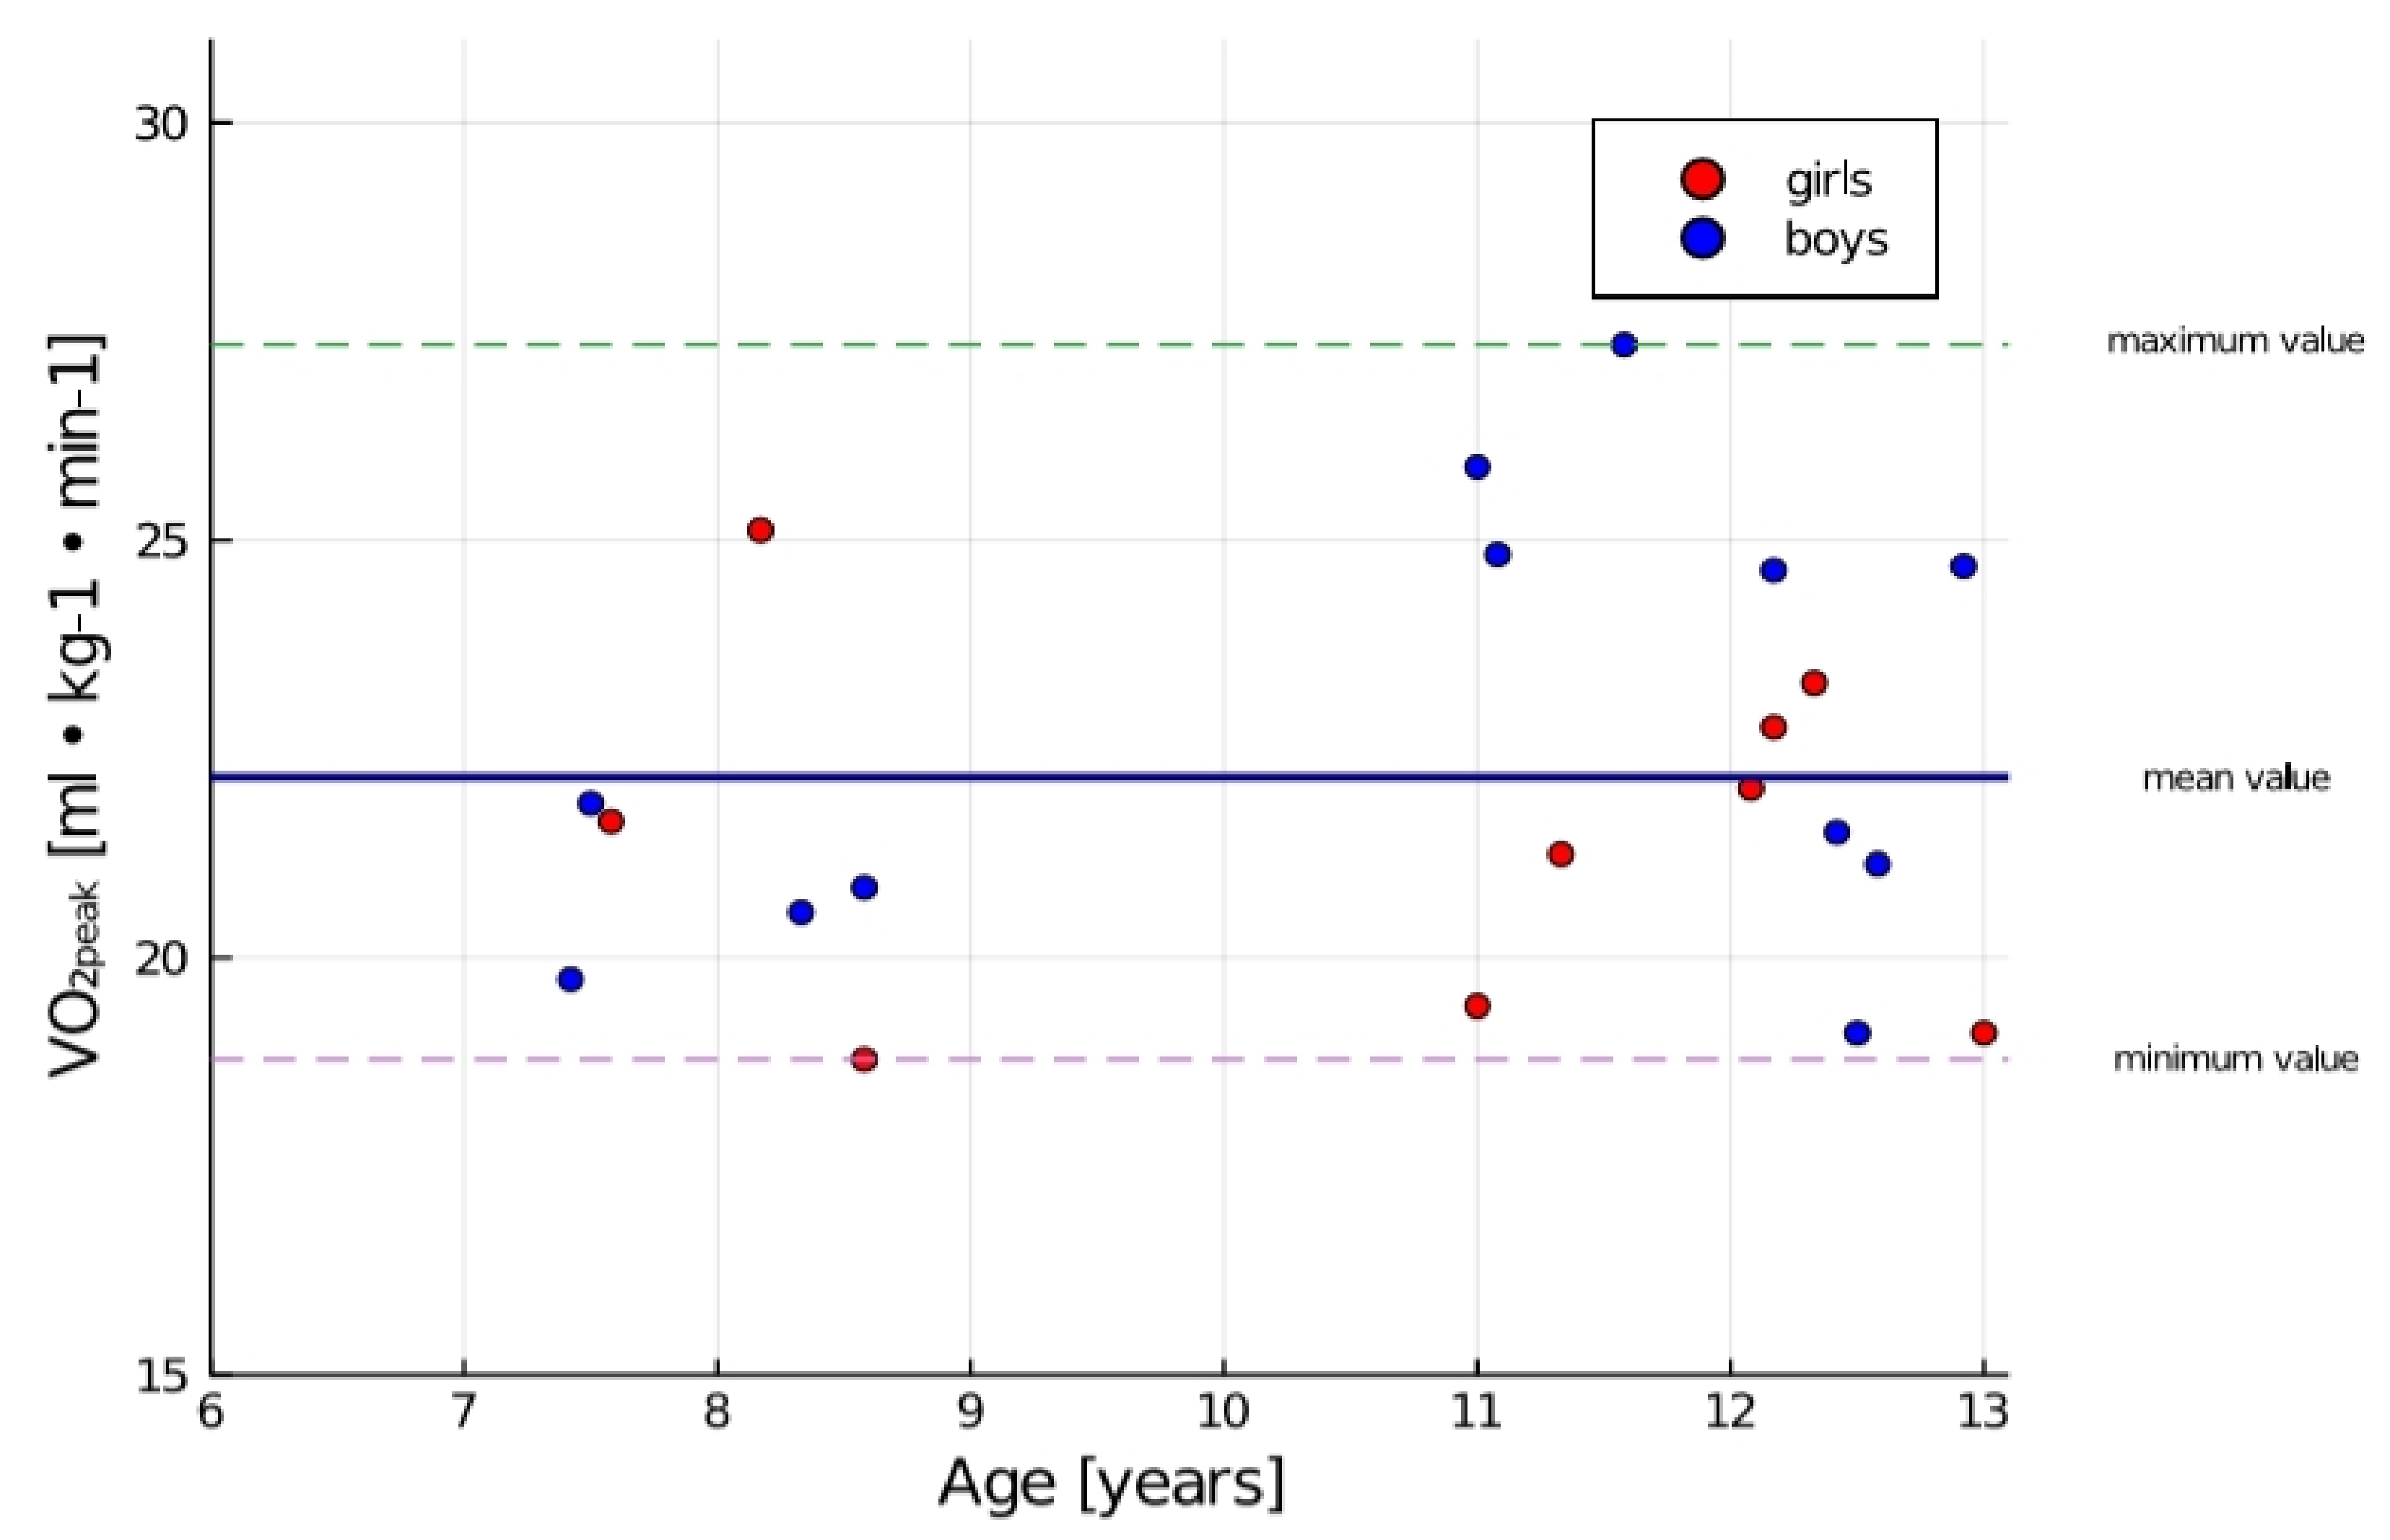
3.1. Cardiorespiratory Fitness
3.2. Physical Activity Level
4. Discussion
5. Strengths and Limitations of This Study
6. Future Research Directions
7. Conclusions
Author Contributions
Funding
Acknowledgments
Conflicts of Interest
References
- Tan, S.Y.; Poh, B.K.; Chong, H.X.; Ismail, M.N.; Rahman, J.; Zarina, A.L.; Juraida, A.R.; Tahir, A.; Ruzita, A.T.; Roslee, R.; et al. Physical activity of pediatric patients with acute leukemia undergoing induction or consolidation chemotherapy. Leuk Res. 2013, 37, 14–20. [Google Scholar] [CrossRef]
- Senkus, E.; Jassem, J. Cardiovascular effects of systemic cancer treatment. Cancer Treat Rev. 2011, 37, 300–311. [Google Scholar] [CrossRef]
- Livinalli, A.; Silva, M.T.; Lopes, L.C. Late adverse effects related to treatment in a cohort of survivors of childhood and adolescent cancer. Medicine 2019, 98, e14921. [Google Scholar] [CrossRef]
- Hockenberry, M.J.; Hinds, P.S.; Barrera, P.; Bryant, R.; Adams-McNeill, J.; Hooke, C.; Rasco-Baggott, C.; Patterson-Kelly, K.; Gattuso, J.S.; Manteuffel, B. Three Instruments to Assess Fatigue in Children with Cancer: Child Parent Staff Perspect. J. Pain Symptom Manag. 2003, 25, 319–328. [Google Scholar] [CrossRef]
- Wagner, P.D. New ideas on limitations to VO2max. Exerc. Sport Sci. Rev. 2000, 28, 10–14. [Google Scholar]
- West, S.L.; Gassas, A.; Schechter, T.; Egeler, R.M.; Nathan, P.C.; Wells, G.D. Exercise Intolerance and the Impact of Physical Activity in Children Treated With Hematopoietic Stem Cell Transplantation. Pediatr. Exerc. Sci. 2014, 26, 358–364. [Google Scholar] [CrossRef]
- Yildiz Kabak, V.; Calders, P.; Duger, T.; Mohammed, J.; van Breda, E. Short and long-term impairments of cardiopulmonary fitness level in previous childhood cancer cases: A systematic review. Supportive Care Cancer 2019, 27, 69–86. [Google Scholar] [CrossRef]
- Caru, M.; Laverdière, C.; Lemay, V.; Drouin, S.; Bertout, L.; Krajinovic, M.; Andelfinger, G.; Sinnett, D.; Curnier, D. Maximal cardiopulmonary exercise testing in childhood acute lymphoblastic leukemia survivors exposed to chemotherapy. Supportive Care Cancer 2020. [Google Scholar] [CrossRef]
- San Juan, A.F.; Chamorro-Viña, C.; Maté-Muñoz, J.L.; Cardona, C.; Hernández, M.; Madero, L.; Pérez, M.; Ramírez, M.; Lucia, A. Functional Capacity of Children with Leukemia. Int. J. Sports Med. 2007, 28, 1–5. [Google Scholar] [CrossRef]
- Myers, J.; Prakash, M.; Froelicher, V.; Do, D.; Partington, S.; Atwood, J.E. Exercise capacity and mortality among men referred for exercise testing. N. Engl. J. Med. 2002, 346, 793–801. [Google Scholar] [CrossRef]
- Huang, T.T.; Ness, K.K. Exercise Interventions in Children with Cancer: A Review. Int. J. Pediatr. 2011, 2011, 461512. [Google Scholar] [CrossRef] [PubMed]
- Liu, R.D.; Chinapaw, M.J.; Huijgens, P.C.; van Mechelen, W. Physical exercise interventions in haematological cancer patients, feasible to conduct but effectiveness to be established: A systematic literature review. Cancer Treat. Rev. 2009, 35, 185–192. [Google Scholar] [CrossRef]
- San Juan, A.F.; Chamorro-Vina, C.; Moral, S.; Fernández del Valle, M.; Madero, L.; Ramírez, M.; Pérez, M.; Lucia, A. Benefits of intrahospital exercise training after pediatric bone marrow transplantation. Int. J. Sports Med. 2008, 29, 439–446. [Google Scholar] [CrossRef] [PubMed]
- Dencker, M.; Thorsson, O.; Karlsson, M.K.; Lindén, C.; Wollmer, P.; Andersen, L.B. Maximal oxygen uptake versus maximal power output in children. J. Sports Sci. 2008, 26, 1397–1402. [Google Scholar] [CrossRef] [PubMed]
- American Thoracic Society; American College of Chest Physicians. ATS/ACCP Statement on cardiopulmonary exercise testing. Am. J. Respir. Crit. Care Med 2003, 167, 211–277. [Google Scholar] [CrossRef] [PubMed]
- Shephard, R.J.; Allen, C.; Benade, A.J.; Davies, C.T.; Di Prampero, P.E.; Hedman, R.; Merriman, J.E.; Myhre, K.; Simmons, R. The maximum oxygen intake. An international reference standard of cardiorespiratory fitness. Bull. World Health Organ. 1968, 38, 757–764. [Google Scholar] [PubMed]
- Braam, K.I.; van Dijk-Lokkart, E.M.; Kaspers, G.J.L.; Takken, T.; Huisman, J.; Bierings, M.B.; Merks, J.H.M.; van de Heuvel-Eibrink, M.M.; van Dulmen-den Broeder, E.; Veening, M.A. Cardiorespiratory fitness and physical activity in children with cancer. Supportive Care Cancer 2016, 24, 2259–2268. [Google Scholar] [CrossRef] [Green Version]
- Thorsteinsson, T.; Larsen, H.B.; Schmiegelow, K.; Thing, L.F.; Krustrup, P.; Pedersen, M.T.; Christensen, K.B.; Mogensen, P.R.; Helms, A.S.; Andersen, L.B. Cardiorespiratory fitness and physical function in children with cancer from diagnosis throughout treatment. BMJ Open Sport Exerc. Med. 2017, 7, e000179. [Google Scholar] [CrossRef] [Green Version]
- Godfrey, S. Methods of measuring the response to exercise in children. In Applications in Health and Disease; Godfrey, S., Ed.; Exercise Testing in Children; W.B. Saunders Company Ltd.: London, UK, 1974; pp. 12–41. [Google Scholar]
- Bongers, B.C.; van Brussel, M.; Hulzebos, H.J.; Takken, T. Paediatric exercise testing in clinics and classrooms: A comparative review of different assessments. OA Epidemiol. 2013, 1, 14. [Google Scholar] [CrossRef] [Green Version]
- Zaqout, M.; Vyncke, K.; Moreno, L.A.; De Miguel-Etayo, P.; Lauria, F.; Molnar, D.; Lissner, L.; Hunsberger, M.; Veidebaum, T.; Tornaritis, M.; et al. Determinant factors of physical fitness in European children. Int. J. Public Health 2016, 61, 573–582. [Google Scholar] [CrossRef] [Green Version]
- Kowaluk, A.; Woźniewski, M.; Malicka, A.I. Physical Activity and Quality of Life of Healthy Children and Patients with Hematological Cancers. Int. J. Environ. Res. Public Health 2019, 16, 2776. [Google Scholar] [CrossRef] [PubMed] [Green Version]
- Armstrong, N.; Welsman, J.; Winsley, R. Is peak VO2 a maximal index of children’s aerobic fitness? Int. J. Sports Med. 1993, 17, 356–359. [Google Scholar] [CrossRef] [PubMed]
- Ingle, L. Theoretical rationale and practical recommendations for cardiopulmonary exercise testing in patients with chronic heart failure. Heart Fail. Rev. 2007, 12, 12–22. [Google Scholar] [CrossRef] [PubMed]
- Malina, R.M.; Bouchard, C.; Bar-Or, O. Growth, Maturation, and Physical Activity; Human Kinetics: Champaign, IL, USA, 2004. [Google Scholar]
- Armstrong, N.; Williams, J.; Balding, J.; Gentle, P.; Kirby, B. The Peak Oxygen Uptake of British Children with Reference to Age, Sex and Sexual Maturity. Eur. J. Appl. Physiol. Occup. Physiol. 1991, 62, 369–375. [Google Scholar] [CrossRef]
- Abdel-Razeq, H.; Hashem, H. Recent update in the pathogenesis and treatment of chemotherapy and cancer induced anemia. Crit. Rev. Oncol. Hematol. 2020, 145, 102837. [Google Scholar] [CrossRef]
- Mc Gowan, J.V.; Chung, R.; Maulik, A.; Piotrowska, I.; Walker, J.M.; Yellon, D.M. Anthracycline Chemotherapy and Cardiotoxicity. Cardiovasc. Drugs 2017, 31, 63–75. [Google Scholar] [CrossRef] [Green Version]
- Reid, J.; Mc Keaveney, C.; Martin, P. Communicating with Adolescents and Young Adults about Cancer-Associated Weight Loss. Curr. Oncol. Rep. 2019, 21, 15. [Google Scholar] [CrossRef] [Green Version]
- Fearon, K.; Strasser, F.; Anker, S.D.; Bosaeus, I.; Bruera, E.; Fainsinger, R.L.; Jatoi, A.; Loprinzi, C.; Mac Donald, N.; Mantovani, G.; et al. Definition and classification of cancer cachexia: An international consensus. Lancet Oncol. 2011, 12, 489–495. [Google Scholar] [CrossRef]
- Ness, K.K.; Armstrong, G.T.; Kundu, M.; Wilson, C.L.; Tchkonia, T.; Kirkland, J.L. Frailty in Childhood Cancer Survivors. Cancer 2015, 121, 1540–1547. [Google Scholar] [CrossRef]
- Thorsteinsson, T.; Schmiegelow, K.; Thing, L.F.; Andersen, L.B.; Helms, A.S.; Ingersgaard, M.V.; Lindgren, L.H.; Baekgaard Larsen, H. Classmates motivate childhood cancer patients to participate in physical activity during treatment: A qualitative study. Eur. J. Cancer Care 2019, 28, e13121. [Google Scholar] [CrossRef]
- Nani, S.; Matsouka, O.; Theodorakis, Y.; Antonio, P. Perceived Βenefits of a Τherapeutic Εxercise Program through Digital Interactive Games among Children with Cancer. Hell. J. Nurs. 2019, 58, 64–70. [Google Scholar]
- Stolley, M.R.; Restrepo, J.; Sharp, L.K. Diet and Physical Activity in Childhood Cancer Survivors: A Review of the Literature. Ann. Behav. Med. 2010, 39, 232–249. [Google Scholar] [CrossRef] [PubMed] [Green Version]
- Blair, S.N.; Kohl, H.W.; Paffenbarger, R.S.; Clark, D.G.; Cooper, K.H.; Gibbons, L.W. Physical fitness and allcause mortality. A prospective study of healthy men and women. JAMA 1989, 262, 2395–2401. [Google Scholar] [CrossRef] [PubMed]

| Variables | All Participants n = 21 | Boys n = 12 | Girls n = 9 | |||
|---|---|---|---|---|---|---|
| Mean | SD | Mean | SD | Mean | SD | |
| Determinant variables | ||||||
| Age (years) | 10.7 | 2.0 | 10.7 | 2.1 | 10.7 | 2.0 |
| Height (cm) | 144.0 | 16.0 | 147.0 | 18.0 | 141.0 | 13.0 |
| Weight (kg) | 41.28 | 13.82 | 42 | 14.99 | 40.32 | 12.91 |
| Treatment duration (months) | 6.0 | 2.0 | 6.0 | 2.0 | 6.0 | 1.0 |
| HGB (g/dL) * | 8.34 | 0.18 | 8.32 | 0.18 | 8.36 | 0.19 |
| PLT (G/L) * | 157.3 | 66.15 | 135.8 | 71.59 | 186 | 47.69 |
| RBC (T/L) * | 3.49 | 0.3 | 3.46 | 0.32 | 3.55 | 0.29 |
| WBC (G/L) * | 2.1 | 0.96 | 2.29 | 1.19 | 1.84 | 0.49 |
| HR (at rest) * | 85.67 | 3.812 | 85.58 | 4.48 | 85.78 | 2.95 |
| Outcome variables | ||||||
| VO2peak (mL·kg−1·min−1) * | 22.16 | 2.46 | 22.67 | 2.67 | 21.49 | 2.11 |
| HRpeak * | 139.5 | 21.32 | 142 | 24.15 | 136.1 | 17.65 |
| VO2 (mL·min−1) * | 1628 | 2277 | 1244 | 293.2 | 2140 | 3511 |
| VCO2 (mL·min−1) * | 1130 | 453.4 | 1284 | 461.2 | 924.9 | 372.3 |
| VE (L·min−1) * | 28.94 | 7.65 | 30.6 | 6.43 | 26.72 | 8.92 |
| VE/VCO2* | 27.73 | 4.99 | 26.02 | 4.51 | 30 | 4.91 |
| RQ = VCO2 exhaled/ VO2 uptake * | 0.93 | 0.24 | 1.0 | 0.17 | 0.82 | 0.29 |
| MET * | 6.28 | 0.7 | 6.4 | 0.76 | 6.1 | 0.6 |
| Test duration (s) | 470.67 | 33.91 | 471.5 | 35.75 | 469.55 | 31.26 |
| Variables | 7–10 Years n = 7 | 11–13 Years n = 14 | ||
|---|---|---|---|---|
| Mean | SD | Mean | SD | |
| Determinant variables | ||||
| Age (years) | 8.0 | 0.5 | 12.0 | 0.7 |
| Height (cm) | 128.0 | 6.0 | 152.0 | 12.0 |
| Weight (kg) | 30.13 | 5.156 | 46.86 | 13.46 |
| Treatment duration (months) | 6.429 | 1.512 | 6.071 | 1.73 |
| HGB (g/dL) * | 8.357 | 0.1902 | 8.329 | 0.1773 |
| PLT (G/L) * | 166 | 52.05 | 153 | 73.63 |
| RBC (T/L) * | 3.68 | 0.2312 | 3.409 | 0.2999 |
| WBC (G/L) * | 1.811 | 0.4956 | 2.245 | 1.118 |
| HR at rest * | 87.71 | 2.215 | 84.64 | 4.088 |
| Outcome variables | ||||
| VO2peak (mL·kg−1·min−1) * | 21.21 | 2.022 | 22.64 | 2.593 |
| HRpeak * | 151 | 6.325 | 152.5 | 12.97 |
| VO2 (mL·min−1) * | 2667 | 3893 | 1108 | 331.6 |
| VCO2 (mL·min−1) * | 1255 | 538.2 | 1068 | 412.3 |
| VE (L·min−1) * | 29.81 | 7.71 | 28.5 | 7.867 |
| VE/VCO2 * | 25.63 | 5.56 | 28.77 | 4.525 |
| RQ = VCO2 exhaled/ VO2 uptake * | 0.891 | 0.3968 | 0.9465 | 0.1341 |
| MET * | 6.0 | 0.5715 | 6.414 | 0.742 |
| Test duration (s) | 458.4 | 35.59 | 476.8 | 33.95 |
| Inclusion Criteria | Exclusion Criteria |
|---|---|
|
|
| Variables | VO2peak Treatment Protocol (AIEOP-BFM ALL 2017), n = 13 | VO2peak Treatment Protocol (AML-BFM-2012), n = 8 |
|---|---|---|
| VO2peak treatment protocol (AIEOP-BFM ALL 2017) | - | - |
| vs. | - | - |
| VO2peak treatment protocol (AML-BFM-2012) | - | - |
| Unpaired t-test | ||
| p-value | 0.5149 | |
| p-value summary | Ns | |
| Significantly different (p < 0.05)? | No | |
| One-or two-tailed p-value? | Two-tailed |
| Variables | Statistical Values |
|---|---|
| VO2peak treatment regimen (B-ALL), n = 7 | |
| vs. | |
| VO2peak treatment regimen (T-ALL), n = 6 | |
| vs. | |
| VO2peak treatment regimen (AML-BFM), n = 8 | |
| One-way ANOVA | |
| F | 0.1775 |
| p-value | 0.8388 |
| p-value summary | Ns |
| Significant difference among means (p < 0.05)? | No |
| R square | 0.01934 |
| Bartlett’s test for homoscedasticity | |
| Bartlett’s statistic (corrected) | 0.1198 |
| p-value | 0.9419 |
| p-value summary | Ns |
| Are SDs significantly different (p < 0.05)? | No |
| Variables | Treatment Regimen | Risk Group SR: n = 6, HR: n = 3, IR: n = 12 | VO2peak |
|---|---|---|---|
| Spearman Rho | Treatment regimen | Risk group | VO2peak |
| Treatment regimen | −0.388 | −0.268 | |
| Risk group | −0.388 | −0.011 | |
| VO2peak | −0.268 | −0.011 | |
| p-values | Treatment regimen | Risk group | VO2peak |
| Treatment regimen | 0.082 | 0.241 | |
| Risk group | 0.082 | 0.962 | |
| VO2peak | 0.241 | 0.962 | |
| VO2peak _risk group–high risk | |||
| vs. | |||
| VO2peak_risk group-standard risk | |||
| Unpaired t-test | |||
| p-value | 0.9881 | ||
| p-value summary | Ns | ||
| Significantly different (p < 0.05)? | No | ||
| One-or two-tailed p-value? | Two-tailed | ||
| t, DF | t = 0.01521 DF = 16 | ||
| Kruskal–Wallis test of VO2peak_risk group (SR, IR, HR) | |||
| p-value | 0.6766 | ||
| Exact or approximate p-value? | Exact | ||
| p-value summary | Ns | ||
| Do the medians vary significantly (p < 0.05)? | No | ||
| Number of groups | 3 | ||
| Kruskal–Wallis statistic | 0.8447 |
| Spearman Rho | Hb (mg/dL) | PLT (G/L) | RBC (T/L) | WBC (G/L) | HR at Rest | Exercise HR |
|---|---|---|---|---|---|---|
| VO2peak (mL·kg−1·min−1) | −0.22 | −0.15 | −0.09 | −0.02 | 0.22 | 0.25 |
| VO2 (mL·min−1) | 0.11 | −0.12 | −0.09 | 0.01 | 0.16 | −0.02 |
| VCO2 (mL·min−1) | −0.01 | −0.18 | −0.10 | −0.03 | 0.09 | −0.09 |
| RER | −0.28 | −0.01 | −0.09 | −0.20 | 0.23 | −0.27 |
| VE (L·min−1) | 0.12 | −0.03 | −0.22 | 0.14 | 0.11 | 0.08 |
| VE/VCO2 | −0.06 | 0.25 | −0.15 | 0.24 | 0.09 | 0.11 |
| RQ = VCO2 exhaled/VO2 uptake | −0.45 * | −0.12 | −0.14 | −0.24 | 0.13 | −0.30 |
| MET | −0.21 | −0.16 | −0.11 | −0.03 | 0.21 | 0.23 |
| Spearman Rho | Hb (mg/dL) | PLT (G/L) | RBC (T/L) | WBC (G/L) | HR at Rest | Exercise HR | ||||||
|---|---|---|---|---|---|---|---|---|---|---|---|---|
| I | II | I | II | I | II | I | II | I | II | I | II | |
| VO2peak (mL·kg−1·min−1) | −0.44 | −0.13 | −0.32 | −0.15 | −0.20 | 0.01 | −0.25 | −0.05 | 0.64 | 0.20 | −0.36 | 0.39 |
| VO2 (mL·min−1) | 0.44 | −0.03 | 0.36 | −0.45 | −0.61 | −0.15 | −0.61 | 0.41 | 0.15 | 0.14 | 0.34 | −0.11 |
| VCO2 (mL·min−1) | 0.00 | 0.01 | 0.14 | −0.40 | −0.68 | −0.06 | −0.93 * | 0.46 | 0.13 | 0.10 | 0.07 | −0.12 |
| RER | −0.44 | −0.36 | 0.24 | −0.25 | −0.93 * | 0.17 | −0.73 | 0.18 | −0.18 | 0.37 | −0.23 | −0.36 |
| VE (L·min−1) | 0.16 | 0.08 | 0.00 | −0.28 | −0.68 | −0.19 | −0.79 * | 0.56 * | 0.11 | 0.11 | −0.02 | 0.04 |
| VE/VCO2 | 0.16 | −0.14 | −0.14 | 0.39 | 0.47 | −0.21 | 0.75 | −0.03 | 0.20 | 0.19 | −0.18 | 0.09 |
| RQ = VCO2 exhaled/VO2 uptake | −0.76 | −0.35 | −0.14 | −0.26 | −0.58 | 0.19 | −0.57 | 0.17 | −0.25 | 0.36 | −0.45 | −0.36 |
| MET | −0.44 | −0.11 | −0.32 | −0.15 | −0.20 | −0.02 | −0.25 | −0.06 | 0.64 | 0.19 | −0.36 | 0.37 |
| Response * | The Number of Days Per Week in Which the Child Performed the Physical Activity of at Least 60 min (MVPA)—HBSC 1 | Frequency of Undertaking Vigorous Physical Activity—HBSC 2 | The Number of Hours in Front of a Screen Per Week—HBSC 4.1 | The Number of Hours in Front of a Screen at the Weekend—HBSC 4.2 | The Number of Hours Spent Playing Games Per Week—HBSC 5.1 | The Number of Hours Spent Playing Games at the Weekend—HBSC 5.2 | The Number of hours Spent Using a Computer, Tablet or Smartphone Per Week—HBSC 6.1 | The Number of Hours Spent Using a Computer, Tablet or Smartphone at the Weekend—HBSC 6.2 |
|---|---|---|---|---|---|---|---|---|
| 0 | 100 | - | - | - | - | - | - | - |
| 1 | - | - | - | - | - | - | - | - |
| 2 | - | - | - | - | - | - | - | - |
| 3 | - | - | - | - | - | - | - | - |
| 4 | - | - | 4.76 | - | 9.52 | 9.52 | - | - |
| 5 | - | - | 38.10 | 23.81 | 38.10 | 14.29 | 38.10 | 14.29 |
| 6 | - | 100 | 33.33 | 42.86 | 52.38 | 52.38 | 61.90 | 38.10 |
| 7 | - | - | 23.81 | 33.33 | - | 23.81 | - | 47.62 |
| Spearman Rho | Hb (mg/dL) | PLT (G/L) | RBC (T/L) | WBC (G/L) | HR at Rest | Exercise HR |
|---|---|---|---|---|---|---|
| HBSC 1 a | - | - | - | - | - | - |
| HBSC 2 a | - | - | - | - | - | - |
| HBSC 4.1 a | 0.01 | −0.25 | 0.31 | 0.15 | 0.20 | −0.01 |
| HBSC 4.2 a | 0.11 | 0.07 | −0.04 | 0.32 | 0.27 | 0.25 |
| HBSC 5.1 a | −0.08 | −0.08 | 0.10 | −0.30 | 0.21 | 0.04 |
| HBSC 5.2 a | −0.06 | −0.29 | 0.13 | −0.10 | 0.01 | −0.04 |
| HBSC 6.1 a | −0.18 | −0.06 | 0.09 | −0.25 | -0.15 | −0.03 |
| HBSC 6.2 a | −0.02 | 0.28 | 0.12 | −0.46 * | 0.31 | −0.08 |
| Spearman Rho | Hb (mg/dL) | PLT (G/L) | RBC (T/L) | WBC (G/L) | HR at Rest | Exercise HR | ||||||
|---|---|---|---|---|---|---|---|---|---|---|---|---|
| I | II | I | II | I | II | I | II | I | II | I | II | |
| HBSC 1 a | - | - | - | - | - | - | - | - | - | - | - | - |
| HBSC 2 a | - | - | - | - | - | - | - | - | - | - | - | - |
| HBSC 4.1 a | −0.27 | −0.42 | 0.30 | 0.02 | 0.21 | 0.02 | 0.00 | −0.27 | 0.33 | 0.10 | −0.36 | −0.42 |
| HBSC 4.2 a | −0.58 | −0.69 * | −0.19 | −0.10 | 0.10 | 0.00 | −0.19 | −0.42 | 0.53 | 0.24 | −0.81 * | −0.25 |
| HBSC 5.1 a | 0.24 | −0.15 | 0.39 | 0.02 | −0.12 | 0.14 | 0.23 | 0.33 | −0.53 | −0.07 | 0.78 | −0.21 |
| HBSC 5.2 a | 0.48 | −0.27 | 0.61 | −0.03 | 0.00 | −0.16 | −0.04 | 0.55 * | −0.24 | 0.27 | 0.87 * | −0.13 |
| HBSC 6.1 a | 0.31 | −0.45 | −0.61 | −0.16 | 0.41 | −0.18 | 0.41 | −0.18 | 0.21 | 0.16 | −0.21 | −0.37 |
| HBSC 6.2 a | 0.00 | −0.45 | −0.29 | −0.21 | −0.22 | 0.13 | −0.58 | −0.21 | 0.29 | 0.15 | −0.51 | −0.53 |
| Spearman Rho | VO2peak (mL·kg−1·min−1) | VO2 (mL·min−1) | VCO2 (mL·min−1) | RER | VE (L·min−1) | VE/VCO2 | RQ = VCO2 exhaled/VO2 uptake | HRpeak | MET |
|---|---|---|---|---|---|---|---|---|---|
| HBSC 1 a | - | - | - | - | - | - | - | - | |
| HBSC 2 a | - | - | - | - | - | - | - | - | - |
| HBSC 4.1 a | 0.21 | −0.04 | −0.05 | −0.24 | −0.09 | 0.03 | −0.26 | −0.26 | 0.19 |
| HBSC 4.2 a | 0.31 | 0.14 | 0.02 | −0.08 | 0.15 | 0.13 | −0.21 | −0.11 | 0.30 |
| HBSC 5.1 a | −0.11 | 0.21 | 0.26 | 0.30 | 0.15 | −0.44 * | 0.39 | 0.00 | −0.10 |
| HBSC 5.2 a | −0.05 | 0.30 | 0.30 | 0.19 | 0.11 | −0.48 * | 0.20 | −0.08 | −0.04 |
| HBSC 6.1 a | 0.36 | −0.15 | −0.20 | −0.10 | −0.17 | 0.18 | −0.17 | −0.01 | 0.34 |
| HBSC 6.2 a | 0.27 | −0.22 | −0.30 | −0.10 | −0.36 | 0.11 | −0.21 | −0.01 | 0.26 |
| Spearman Rho | VO2peak (mL·kg−1·min−1) | VO2 (mL·min−1) | VCO2 (mL·min−1) | RER | VE (L·min−1) | VE/VCO2 | RQ = VCO2 exhaled/VO2 uptake | HRpeak | MET | |||||||||
|---|---|---|---|---|---|---|---|---|---|---|---|---|---|---|---|---|---|---|
| I | II | I | II | I | II | I | II | I | II | I | II | I | II | I | II | I | II | |
| HBSC 1 a | - | - | - | - | - | - | - | - | - | - | - | - | - | - | - | - | - | - |
| HBSC 2 a | - | - | - | - | - | - | - | - | - | - | - | - | - | - | - | - | - | - |
| HBSC 4.1 a | 0.00 | −0.39 | −0.42 | −0.12 | −0.30 | −0.10 | −0.27 | 0.13 | −0.54 | −0.08 | 0.18 | 0.20 | −0.12 | 0.11 | −0.24 | 0.28 | 0.00 | −0.45 |
| HBSC 4.2 a | 0.28 | 0.12 | −0.47 | −0.19 | −0.19 | −0.24 | −0.10 | −0.02 | −0.28 | −0.25 | 0.19 | 0.18 | 0.19 | −0.03 | 0.00 | −0.23 | 0.28 | 0.06 |
| HBSC 5.1 a | −0.08 | 0.04 | 0.31 | 0.20 | 0.08 | 0.26 | 0.20 | 0.22 | −0.04 | 0.10 | −0.19 | −0.25 | −0.08 | 0.22 | 0.18 | 0.37 | −0.08 | 0.05 |
| HBSC 5.2 a | −0.29 | −0.07 | 0.42 | 0.42 | 0.26 | 0.46 | 0.03 | 0.16 | 0.00 | 0.31 | −0.39 | −0.21 | −0.26 | 0.15 | −0.08 | 0.28 | −0.29 | −0.09 |
| HBSC 6.1 a | 0.00 | −0.18 | −0.20 | −0.14 | −0.41 | −0.18 | −0.52 | −0.14 | 0.00 | −0.28 | 0.61 | 0.19 | −0.41 | −0.14 | −0.51 | −0.16 | 0.00 | −0.23 |
| HBSC 6.2 a | −0.14 | −0.16 | 0.14 | 0.07 | 0.43 | 0.09 | 0.15 | 0.51 | 0.58 | −0.10 | −0.29 | −0.10 | 0.29 | 0.51 | 0.07 | 0.27 | −0.14 | −0.20 |
Publisher’s Note: MDPI stays neutral with regard to jurisdictional claims in published maps and institutional affiliations. |
© 2020 by the authors. Licensee MDPI, Basel, Switzerland. This article is an open access article distributed under the terms and conditions of the Creative Commons Attribution (CC BY) license (http://creativecommons.org/licenses/by/4.0/).
Share and Cite
Kowaluk, A.; Woźniewski, M. Peak Oxygen Uptake and Exercise Capacity of Children Undergoing Leukemia Treatment. Int. J. Environ. Res. Public Health 2020, 17, 8732. https://doi.org/10.3390/ijerph17238732
Kowaluk A, Woźniewski M. Peak Oxygen Uptake and Exercise Capacity of Children Undergoing Leukemia Treatment. International Journal of Environmental Research and Public Health. 2020; 17(23):8732. https://doi.org/10.3390/ijerph17238732
Chicago/Turabian StyleKowaluk, Aleksandra, and Marek Woźniewski. 2020. "Peak Oxygen Uptake and Exercise Capacity of Children Undergoing Leukemia Treatment" International Journal of Environmental Research and Public Health 17, no. 23: 8732. https://doi.org/10.3390/ijerph17238732