Using Laser-Doppler Flowmetry to Evaluate the Therapeutic Response in Dentin Hypersensitivity


Abstract
:1. Introduction
2. Materials and Methods
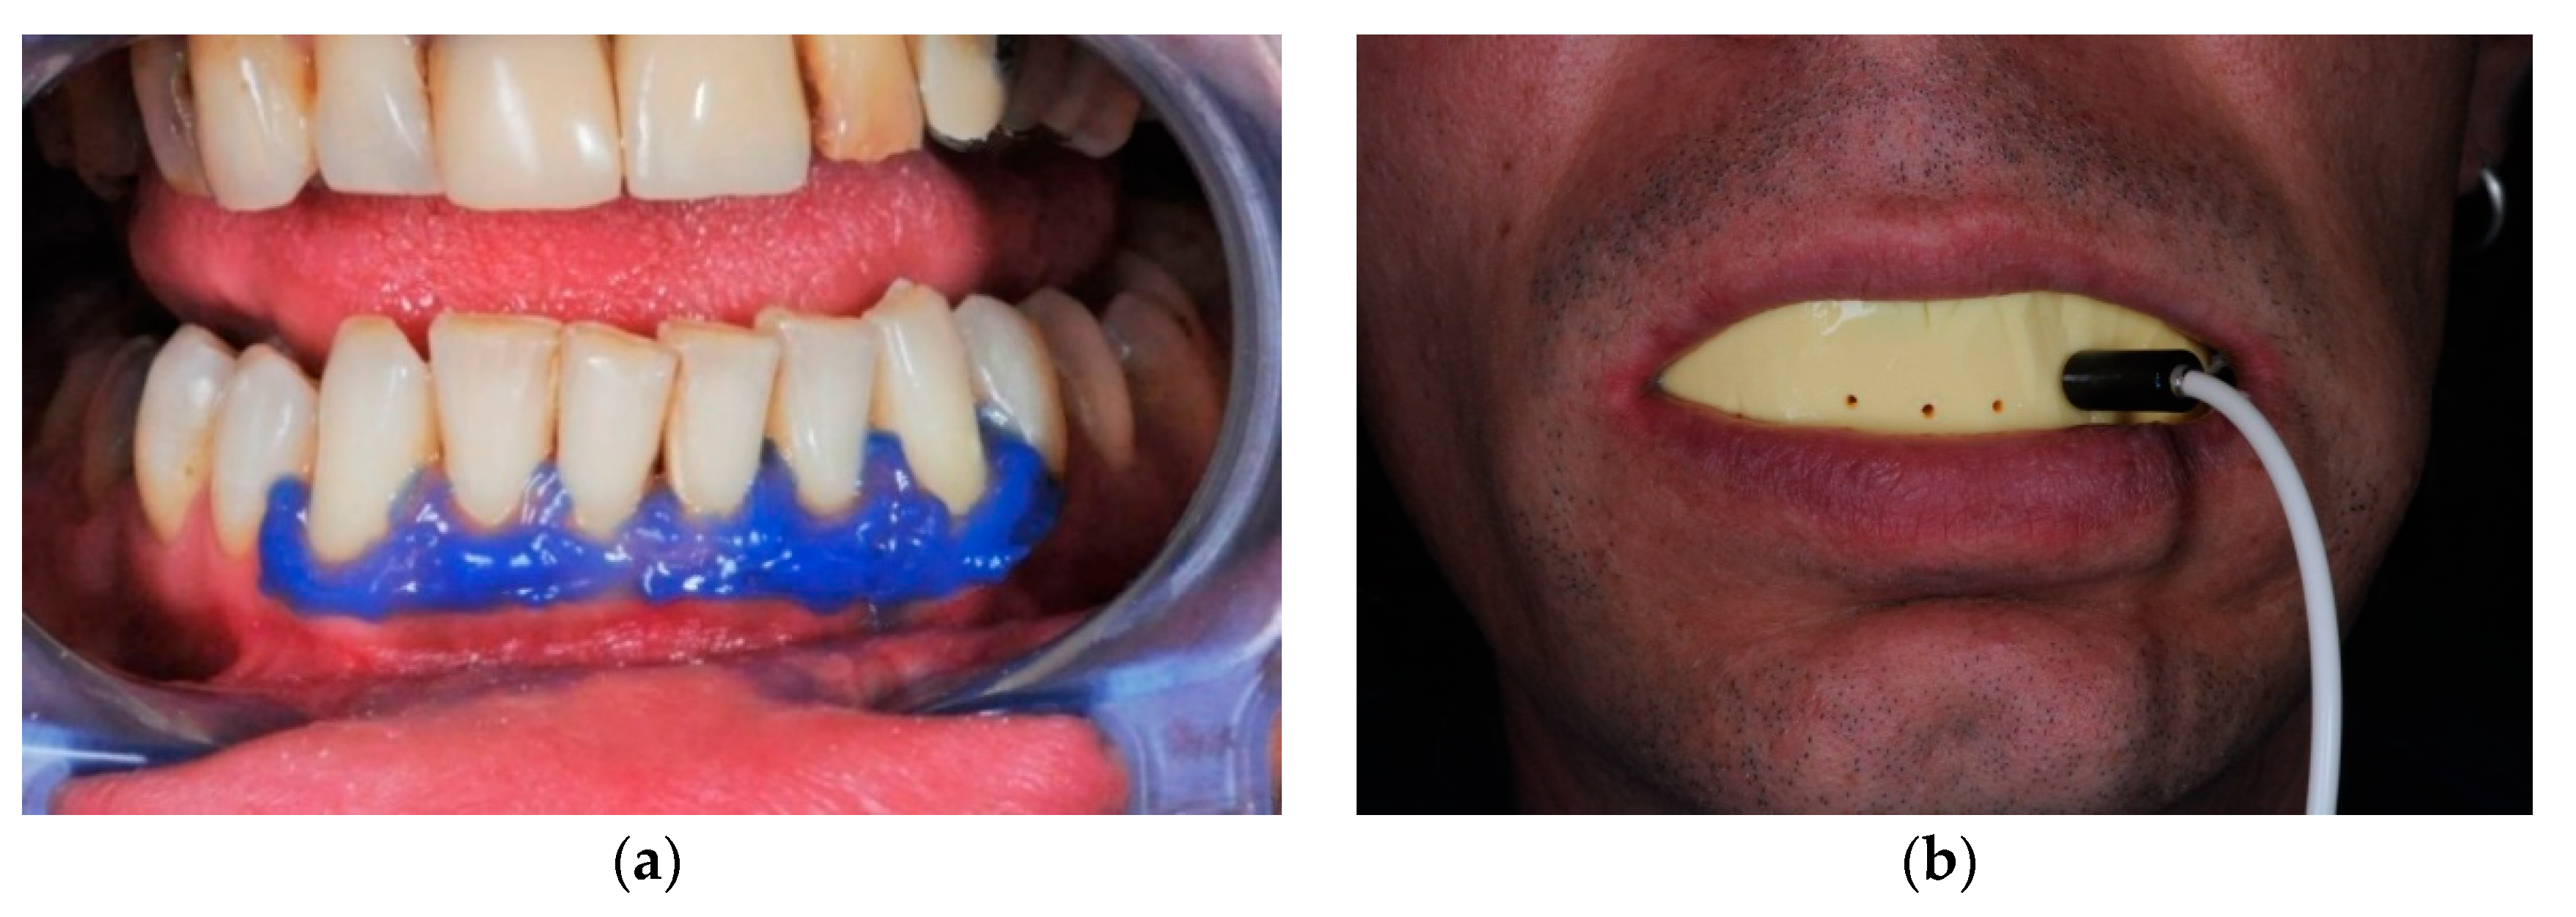
2.1. Therapeutic Methods Employed
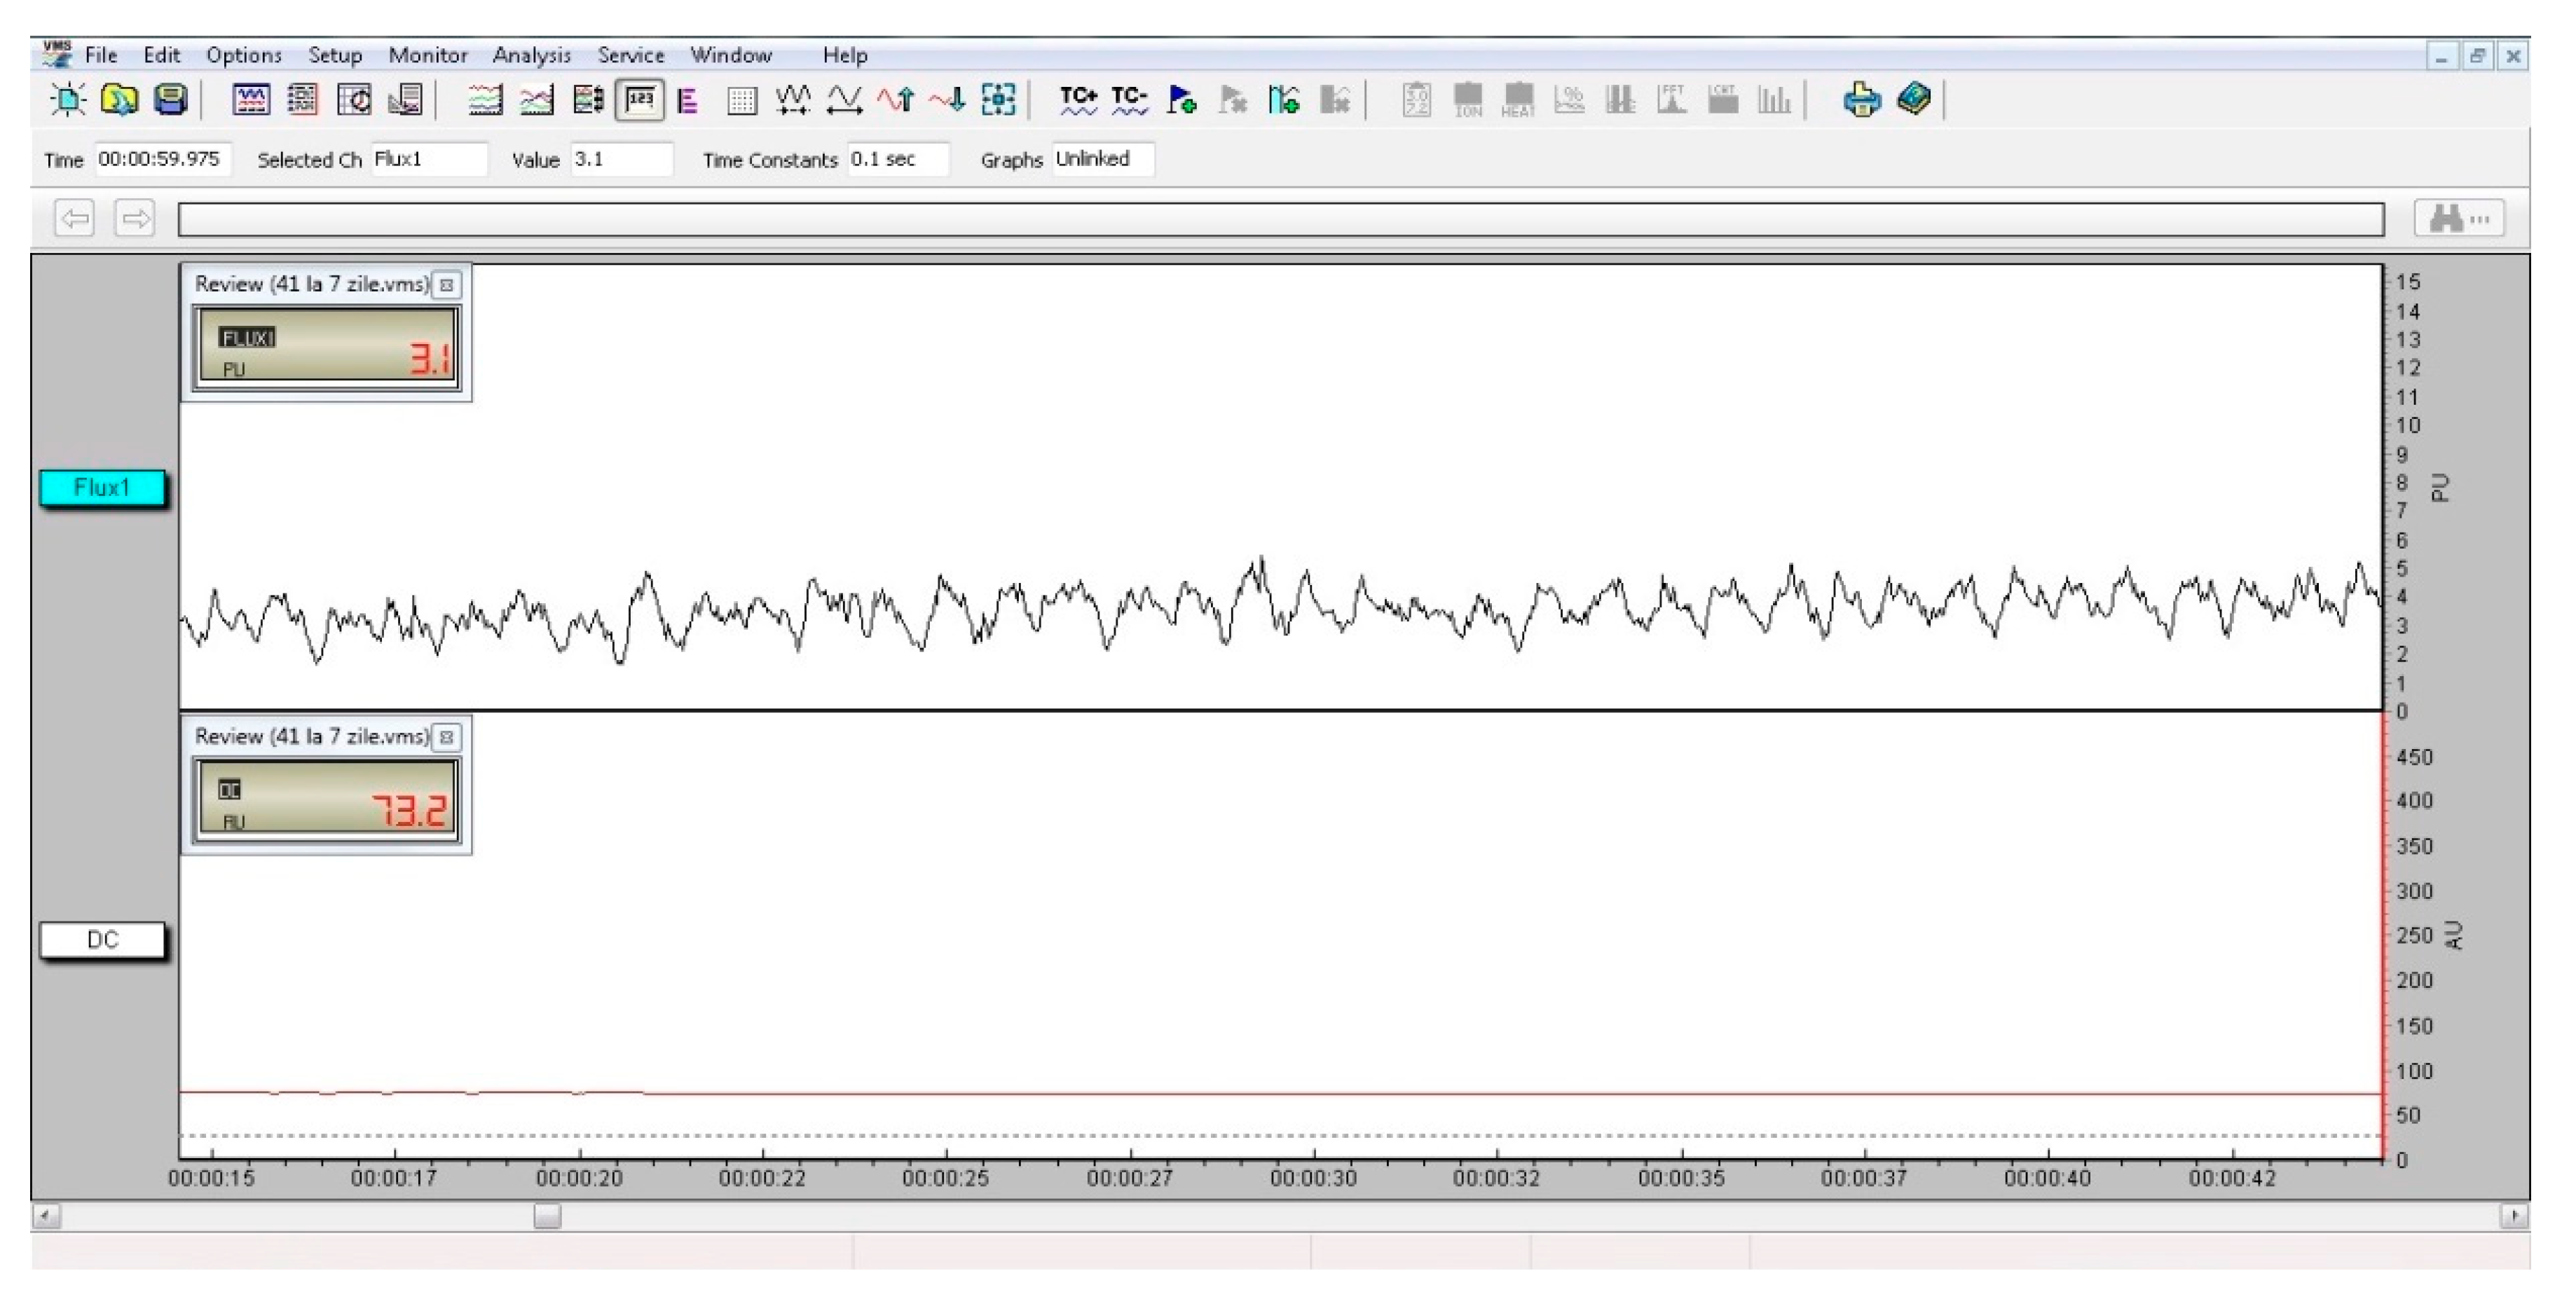
2.2. Evaluating the Therapeutic Response
2.3. Study Design
2.4. Sample Description and Study Protocol
2.5. Data Analysis
2.5.1. Analysis of Verbal Rating Scale Scores
2.5.2. Analysis of Laser Doppler Flowmetry Measurements
2.5.3. Analysis of Concurrent Validity
3. Results
4. Discussion
4.1. Study Limitations
4.2. Future Perspectives
5. Conclusions
Supplementary Materials
Author Contributions
Funding
Acknowledgments
Conflicts of Interest
Abbreviations
| ACP | amorphous calcium phosphate |
| ANOVA | Analysis of Variance |
| DH | dentin hypersensitivity |
| ICC | intraclass correlation coefficient |
| LDF | Laser-Doppler flowmetry |
| M | mean |
| MDC | mean detectable change |
| Nd:YAG | neodymium-doped yttrium aluminum garnet; Nd: Y3Al5O12 |
| PI | pain intensity |
| SD | standard deviation |
| SEM | standard error of the mean |
| VRS | Verbal Rating Scale |
| VSP | Very Short Pulse |
References
- Cummins, D. Dentin hypersensitivity: From diagnosis to a breakthrough therapy for everyday sensitivity relief. J. Clin. Dent. 2009, 20, 1–9. [Google Scholar] [PubMed]
- Addy, M. Dentine hypersensitivity: New perspectives on an old problem. Int. Dent. J. 2002, 52, 367–375. [Google Scholar] [CrossRef]
- Walters, P.A. Dentinal hypersensitivity: A review. J. Contemp. Dent. Pract. 2005, 6, 107–117. [Google Scholar] [CrossRef] [PubMed]
- Bartold, P.M. Dentinal hypersensitivity: A review. Aust. Dent. J. 2006, 51, 212–218. [Google Scholar] [CrossRef] [Green Version]
- Bekes, K.; John, M.T.; Schaller, H.-G.; Hirsch, C. Oral health-related quality of life in patients seeking care for dentin hypersensitivity. J. Oral Rehabil. 2009, 36, 45–51. [Google Scholar] [CrossRef]
- Brannstrom, M.; Linden, L.A.; Astrom, A. The hydrodynamics of the dental tubule and of pulp fluid. A discussion of its significance in relation to dentinal sensitivity. Caries Res. 1967, 1, 310–317. [Google Scholar] [CrossRef]
- Brännström, M. Dentin sensitivity and aspiration of odontoblasts. J. Am. Dent. Assoc. 1963, 66, 366–370. [Google Scholar] [CrossRef]
- Karcioglu, O.; Topacoglu, H.; Dikme, O.; Dikme, O. A systematic review of the pain scales in adults: Which to use? Am. J. Emerg. Med. 2018, 36, 707–714. [Google Scholar] [CrossRef]
- Hjermstad, M.J.; Fayers, P.M.; Haugen, D.F.; Caraceni, A.; Hanks, G.W.; Loge, J.H.; Fainsinger, R.; Aass, N.; Kaasa, S. Studies comparing numerical rating scales, verbal rating scales, and visual analogue scales for assessment of pain intensity in adults: A systematic literature review. J. Pain Symptom Manag. 2011, 41, 1073–1093. [Google Scholar] [CrossRef]
- Bastos, J.V.; Goulart, E.M.A.; de Souza Cortes, M.I. Pulpal response to sensibility tests after traumatic dental injuries in permanent teeth. Dent. Traumatol. 2014, 30, 188–192. [Google Scholar] [CrossRef]
- Alghaithy, R.A.; Qualtrough, A.J.E. Pulp sensibility and vitality tests for diagnosing pulpal health in permanent teeth: A critical review. Int. Endod. J. 2016, 50, 135–142. [Google Scholar] [CrossRef] [PubMed] [Green Version]
- Karayilmaz, H.; Kirzioğlu, Z. Comparison of the reliability of laser Doppler flowmetry, pulse oximetry and electric pulp tester in assessing the pulp vitality of human teeth. J. Oral Rehabil. 2011, 38, 340–347. [Google Scholar] [CrossRef] [PubMed]
- Ghouth, N.; Duggal, M.S.; BaniHani, A.; Nazzal, H. The diagnostic accuracy of laser Doppler flowmetry in assessing pulp blood flow in permanent teeth: A systematic review. Dent. Traumatol. 2018, 34, 311–319. [Google Scholar] [CrossRef] [PubMed] [Green Version]
- Ersahan, S.; Sabuncuoglu, F.A.; Oktay, E.A. The efficacy of laser Doppler flowmetry, electric pulp test and cold test in diagnosing revascularization of extrusively luxated immature maxillary incisors. Pak. J. Med. Sci. 2018, 34, 787–793. [Google Scholar] [CrossRef] [PubMed]
- Lima, T.F.R.; Dos Santos, S.L.; da Silva Fidalgo, T.K.; Silva, E.J.N.L. Vitality Tests for Pulp Diagnosis of Traumatized Teeth: A Systematic Review. J. Endod. 2019, 45, 490–499. [Google Scholar] [CrossRef]
- Freitas, S.D.S.; Sousa, L.L.A.; Neto, J.M.M.; Mendes, R.F.; Prado, R.R. Dentin hypersensitivity treatment of non-carious cervical lesions—A single-blind, split-mouth study. Braz. Oral Res. 2015, 29, 1–6. [Google Scholar] [CrossRef] [Green Version]
- Orchardson, R.; Gillam, D.G. Managing dentin hypersensitivity. J. Am. Dent. Assoc. 2006, 137, 990–998. [Google Scholar] [CrossRef]
- Canadian, H. Advisory Board on Dentin, Consensus-based recommendations for the diagnosis and management of dentin hypersensitivity. J. Can. Dent. Assoc. 2003, 69, 221–226. [Google Scholar]
- Yan, B.X.; Yi, J.R.; Li, Y.; Chen, Y.; Shi, Z.D. Arginine-containing toothpastes for dentin hypersensitivity: Systematic review and meta-analysis. Quintessence Int. 2013, 44, 709–723. [Google Scholar]
- Cunha-Cruz, J.; Wataha, J.C.; Zhou, L.M.; Manning, W.; Trantow, M.; Bettendorf, M.M.; Heaton, L.J.; Berg, J. Treating dentin hypersensitivity. Therapeutic choices made by dentists of the Northwest PRECEDENT network. J. Am. Dent. Assoc. 2010, 141, 1097–1105. [Google Scholar] [CrossRef]
- Hu, M.-L.; Zheng, G.; Han, J.-M.; Yang, M.; Zhang, Y.-D.; Lin, H. Effect of Lasers on Dentine Hypersensitivity: Evidence from a Meta-analysis. J. Evid. Based Dent. Pract. 2019, 19, 115–130. [Google Scholar] [CrossRef] [PubMed]
- Omae, M.; Inoue, M.; Itota, T.; Finger, W.J.; Inoue, M.; Tanaka, K.; Yamamoto, K.; Yoshiyama, M. Effect of a desensitizing agent containing glutaraldehyde and HEMA on bond strength to Er:YAG laser-irradiated dentine. J. Dent. 2007, 35, 398–402. [Google Scholar] [CrossRef] [PubMed]
- Kumar, N.G.; Mehta, D. Short-term assessment of the Nd:YAG laser with and without sodium fluoride varnish in the treatment of dentin hypersensitivity—A clinical and scanning electron microscopy study. J. Periodontol. 2005, 76, 1140–1147. [Google Scholar] [CrossRef] [PubMed]
- Umberto, R.; Claudia, R.; Gaspare, T.; Gianluca, T.; Alessandro, D.V. Treatment of Dentine Hypersensitivity by Diode Laser: A Clinical Study. Int. J. Dent. 2012, 2012, 1–8. [Google Scholar] [CrossRef] [PubMed] [Green Version]
- Lopes, A.O.; de Paula Eduardo, C.; Aranha, A.C.C. Clinical evaluation of low-power laser and a desensitizing agent on dentin hypersensitivity. Lasers Med Sci. 2015, 30, 823–829. [Google Scholar] [CrossRef] [PubMed]
- Dilsiz, A.; Canakci, V.; Özdemir, A.; Kaya, Y. Clinical Evaluation of Nd:YAG and 685-nm Diode Laser Therapy for Desensitization of Teeth with Gingival Recession. Photomed. Laser Surg. 2009, 27, 843–848. [Google Scholar] [CrossRef] [PubMed]
- Kapferer, I.; Pflug, C.; Kisielewsky, I.; Giesinger, J.; Beier, U.S.; Dumfahrt, H. Instant dentin hypersensitivity relief of a single topical application of an in-office desensitizing paste containing 8% arginine and calcium carbonate: A split-mouth, randomized-controlled study. Acta Odontol. Scand. 2013, 71, 994–999. [Google Scholar] [CrossRef]
- Vieira, A.H.M.; Passos, V.F.; De Assis, J.S.; Mendonca, J.S.; Santiago, S.L. Clinical Evaluation of a 3% Potassium Oxalate Gel and a GaAlAs Laser for the Treatment of Dentinal Hypersensitivity. Photomed. Laser Surg. 2009, 27, 807–812. [Google Scholar] [CrossRef]
- Tunar, O.L.; Gürsoy, H.; Cakar, G.; Kuru, B.; Ipçi, Ş.D.; Yılmaz, S.; Yilmaz, S. Evaluation of the Effects of Er:YAG Laser and Desensitizing Paste Containing 8% Arginine and Calcium Carbonate, and Their Combinations on Human Dentine Tubules: A Scanning Electron Microscopic Analysis. Photomed. Laser Surg. 2014, 32, 540–545. [Google Scholar] [CrossRef]
- Kwon, S.R.; Dawson, D.V.; Schenck, D.M.; Fiegel, J.; Wertz, P.W. Spectrophotometric Evaluation of Potassium Nitrate Penetration into the Pulp Cavity. Oper. Dent. 2015, 40, 614–621. [Google Scholar] [CrossRef]
- Neel, E.A.A.; Bozec, L.; Perez, R.A.; Kim, H.-W.; Knowles, J.C. Nanotechnology in dentistry: Prevention, diagnosis, and therapy. Int. J. Nanomed. 2015, 10, 6371–6394. [Google Scholar] [CrossRef] [Green Version]
- West, N.X.; Seong, J.; Davies, M. Management of dentine hypersensitivity: Efficacy of professionally and self-administered agents. J. Clin. Periodontol. 2015, 42, S256–S302. [Google Scholar] [CrossRef]
- Priyadarsini, S.; Mukherjee, S.; Mishra, M. Nanoparticles used in dentistry: A review. J. Oral Biol. Craniofacial Res. 2018, 8, 58–67. [Google Scholar] [CrossRef] [Green Version]
- Todea, C.; Miron, M.; Balabuc, C.; Filip, L. Comparative clinical study of laser treatment versus fluoridization in dentin hypersensitivity. Braz Dent J. 2004, 15, 75. [Google Scholar]
- Lopes, A.O.; Aranha, A.C.C. Comparative Evaluation of the Effects of Nd:YAG Laser and a Desensitizer Agent on the Treatment of Dentin Hypersensitivity: A Clinical Study. Photomed. Laser Surg. 2013, 31, 132–138. [Google Scholar] [CrossRef]
- Soares, M.D.L.; Porciúncula, G.B.; De Lucena, M.I.H.M.; Gueiros, L.A.M.; Leão, J.C.; Carvalho, A.D.A.T. Efficacy of Nd:YAG and GaAlAs lasers in comparison to 2% fluoride gel for the treatment of dentinal hypersensitivity. Gen. Dent. 2016, 64, 66–70. [Google Scholar]
- Alghadir, A.H.; Anwer, S.; Iqbal, A.; Iqbal, Z.A. Test–retest reliability, validity, and minimum detectable change of visual analog, numerical rating, and verbal rating scales for measurement of osteoarthritic knee pain. J. Pain Res. 2018, 11, 851–856. [Google Scholar] [CrossRef] [PubMed] [Green Version]
- Li, L.; Liu, X.; Herr, K. Postoperative Pain Intensity Assessment: A Comparison of Four Scales in Chinese Adults. Pain Med. 2007, 8, 223–234. [Google Scholar] [CrossRef] [PubMed] [Green Version]
- Todea, C.; Cânjău, S.; Miron, M.; Vitez, B.; Noditi, G. Laser Doppler flowmetry evaluation of the microcirculation in dentistry. In Microcirculation Revisited—From Molecules to Clinical Practice; Helena, L., Ed.; InTech: London, UK, 2016; pp. 203–230. ISBN 978-953-51-2731-4. [Google Scholar]
- Miron, M.I.; Dodenciu, D.; Sârbescu, P.F.; Filip, L.; Balabuc, C.A.; Hanigovski, E.; Todea, C. Optimization of the laser Doppler signal acquisition technique in pulp vitality tests. Arch. Balk. Med. Union 2011, 46, 280–284. [Google Scholar]
- Lesaffre, E.; Philstrom, B.; Needleman, I.; Worthington, H. The design and analysis of split-mouth studies: What statisticians and clinicians should know. Stat. Med. 2009, 28, 3470–3482. [Google Scholar] [CrossRef]
- The Comprehensive R Archive Network. Available online: https://cran.r-project.org/ (accessed on 16 November 2020).
- Li, L.; Herr, K.; Chen, P. Postoperative pain assessment with three intensity scales in Chinese elders. J. Nurs. Sch. 2009, 41, 241–249. [Google Scholar] [CrossRef] [PubMed]
- Taylor, L.J.; Harris, J.; Epps, C.D.; Herr, K. Psychometric evaluation of selected pain intensity scales for use with cognitively impaired and cognitively intact older adults. Rehabil. Nurs. 2005, 30, 55–61. [Google Scholar] [CrossRef] [PubMed]


| Nd:YAG Laser Parameters | |
|---|---|
| λ wavelength | 1064 nm |
| Optic probe | 300 µm |
| Operation mode | VSP |
| Power | 1.00 W |
| Frequency | 10 Hz |
| Exposure time/tooth | 15 sec. |
| Number of applications/sessions | 4 |
| Number of sessions | 1 |
| Time | Gel (n = 18) | Laser + Gel (n = 18) | p(a) | ||
|---|---|---|---|---|---|
| M ± SD | SEM (MDC) | M ± SD | SEM (MDC) | ||
| Initial | 2.50 ± 0.514 | 0.121 (2.893) | 2.56 ± 0.511 | 0.121 (2.893) | 0.655 |
| After treatment | 2.56 ± 0.511 | 0.121 (2.893) | 2.89 ± 0.323 | 0.076 (2.848) | 0.034 * |
| 24 h | 2.28 ± 0.575 | 0.135 (2.907) | 2.39 ± 0.502 | 0.118 (2.890) | 0.157 |
| 7 days | 2.06 ± 0.539 | 0.127 (2.899) | 1.56 ± 0.511 | 0.121 (2.893) | 0.003 ** |
| 30 days | 1.94 ± 0.416 | 0.098 (2.870) | 1.33 ± 0.485 | 0.114 (2.886) | 0.001 ** |
| ICCs | Overall (n = 36) | Gel (n = 18) | Laser + Gel (n = 18) |
|---|---|---|---|
| Estimator value | 0.424 ** | 0.605 ** | 0.460 ** |
| 95% Confidence interval | (0.255; 0.603) | (0.382; 0.801) | (0.223; 0.705) |
| Time | Gel (a) (n = 18) | Laser + Gel (a) (n = 18) | p(b) |
|---|---|---|---|
| Initial | 1.35 (0.9–1.5) | 1.2 (1.0–1.9) | 0.766 |
| After treatment | 1.25 (1.1–1.6) | 1.85 (1.3–2.3) | 0.057 |
| 24 h | 1.0 (0.8–1.3) | 1.5 (1.1–1.6) | 0.057 |
| 7 days | 0.9 (0.8–1.1) | 0.8 (0.7–1.1) | 0.491 |
| 30 days | 1.0 (0.8–1.1) | 0.8 (0.6–1.4) | 0.057 |
| Time | Overall (n = 36) | Gel (n = 18) | Laser + Gel (n = 18) |
|---|---|---|---|
| Initial | 0.739 ** | 0.696 ** | 0.787 ** |
| After treatment | 0.651 ** | 0.701 ** | 0.443 |
| 24 h | 0.788 ** | 0.805 ** | 0.793 ** |
| 7 days | 0.676 ** | 0.631 ** | 0.690 ** |
| 30 days | 0.599 ** | 0.275 | 0.580 * |
| Time | Gel (a) | Laser + Gel (a) | Two-Way ANOVA | |
|---|---|---|---|---|
| Flowmetry by Patient, Treatment | ||||
| Initial | Patient 1 (n = 3 + 3) | 6.50 ± 0.87 | 6.27 ± 0.9 | Model: p < 0.001 ** PatientID: p < 0.001 ** Treatment: p = 0.602 Two-way Interaction PatientID * Treat: p = 0.375 |
| Patient 2 (n = 3 + 3) | 5.03 ± 1.88 | 5.63 ± 1.32 | ||
| Patient 3 (n = 2 + 2) | 8.35 ± 1.48 | 5.55 ± 1.06 | ||
| Patient 4 (n = 2 + 2) | 6.35 ± 0.7 | 4.95 ± 0.49 | ||
| Patient 5 (n = 3 + 3) | 10.20 ± 2.38 | 11.00 ± 1.32 | ||
| Patient 6 (n = 3 + 3) | 15.83 ± 0.7 | 16.27 ± 1.01 | ||
| Patient 7 (n = 2 + 2) | 7.30 ± 1.7 | 8.20 ± 1.41 | ||
| After treatment | Patient 1 (n = 3 + 3) | 6.97 ± 0.86 | 9.13± 0.50 | Model: p < 0.001 ** PatientID: p < 0.001 ** Treatment: p < 0.001 ** Two-way Interaction PatientID * Treat: p = 0.891 |
| Patient 2 (n = 3 + 3) | 5.97 ± 2.12 | 7.03 ± 0.68 | ||
| Patient 3 (n = 2 + 2) | 8.3 ± 0.85 | 10.55 ±1.77 | ||
| Patient 4 (n = 2 + 2) | 7.95 ± 0.07 | 8.55 ± 1.77 | ||
| Patient 5 (n = 3 + 3) | 9.60 ± 1.35 | 11.90 ± 1.57 | ||
| Patient 6 (n = 3 + 3) | 15.33 ± 0.51 | 17.50 ± 0.66 | ||
| Patient 7 (n = 2 + 2) | 6.60 ± 1.13 | 8.40 ± 1.41 | ||
| 24 h | Patient 1 (n = 3 + 3) | 5.23 ± 0.45 | 6.13 ± 1.83 | Model: p < 0.001 ** PatientID: p < 0.001 ** Treatment: p = 0.019 * Two-way Interaction PatientID * Treat: p = 0.787 |
| Patient 2 (n = 3 + 3) | 6.20 ± 2.29 | 5.67 ± 0.85 | ||
| Patient 3 (n = 2 + 2) | 5.40 ± 1.27 | 7.45 ± 1.77 | ||
| Patient 4 (n = 2 + 2) | 5.40 ± 0.14 | 7.45 ± 1.77 | ||
| Patient 5 (n = 3 + 3) | 8.37 ± 2.71 | 10.23 ± 1.10 | ||
| Patient 6 (n = 3 + 3) | 14.13 ± 0.40 | 15.70 ±0.70 | ||
| Patient 7 (n = 2 + 2) | 5.75 ± 0.07 | 6.85 ± 1.91 | ||
| 7 days | Patient 1 (n = 3 + 3) | 4.60 ± 0.44 | 2.83 ± 0.51 | Model: p < 0.001 ** PatientID: p < 0.001 ** Treatment: p = 0.007 ** Two-way Interaction PatientID * Treat: p = 0.461 |
| Patient 2 (n = 3 + 3) | 4.67 ± 1.50 | 3.93 ± 0.76 | ||
| Patient 3 (n = 2 + 2) | 4.05 ± 0.35 | 2.45 ± 0.35 | ||
| Patient 4 (n = 2 + 2) | 4.90 ± 0.14 | 3.30 ± 0.14 | ||
| Patient 5 (n = 3 + 3) | 6.43 ± 1.81 | 6.90 ± 1.66 | ||
| Patient 6 (n = 3 + 3) | 10.77 ± 1.44 | 8.57 ± 1.39 | ||
| Patient 7 (n = 2 + 2) | 4.45 ± 0.49 | 4.05 ± 0.49 | ||
| 30 days | Patient 1 (n = 3 + 3) | 4.60 ± 0.35 | 2.43 ± 0.15 | Model: p < 0.001 ** PatientID: p < 0.001 ** Treatment: p = 0.002 ** Two-way Interaction PatientID * Treat: p = 0.725 |
| Patient 2 (n = 3 + 3) | 4.10 ± 1.15 | 3.70 ± 0.17 | ||
| Patient 3 (n = 2 + 2) | 5.30 ± 0.42 | 3.30 ± 0.14 | ||
| Patient 4 (n = 2 + 2) | 4.45 ± 0.21 | 3.30 ± 0.14 | ||
| Patient 5 (n = 3 + 3) | 7.47 ± 2.64 | 7.10 ± 1.27 | ||
| Patient 6 (n = 3 + 3) | 11.00 ± 0.20 | 9.60 ± 1.40 | ||
| Patient 7 (n = 2 + 2) | 5.70 ± 0.71 | 4.45 ± 0.07 | ||
| Time | Gel Effect (a) | Laser + Gel Effect (a) | Two-Way ANOVA | |
|---|---|---|---|---|
| Effect by Patient, Treatment | ||||
| After treatment | Patient 1 (n = 3 + 3) | −0.07 ± 0.06 | −0.47 ± 0.17 | Model: p < 0.001 ** PatientID: p < 0.001 ** Treatment: p < 0.001 ** Two-way Interaction PatientID * Treat: p = 0.004 ** |
| Patient 2 (n = 3 + 3) | −0.19 ± 0.05 | −0.28 ± 0.23 | ||
| Patient 3 (n = 2 + 2) | −0.02 ± 0.28 | −0.91 ± 0.05 | ||
| Patient 4 (n = 2 + 2) | −0.25 ± 0.3 | −0.72 ± 0.19 | ||
| Patient 5 (n = 3 + 3) | 0.05 ± 0.09 | −0.09 ± 0.13 | ||
| Patient 6 (n = 3 + 3) | 0.03 ± 0.02 | −0.08 ± 0.04 | ||
| Patient 7 (n = 2 + 2) | 0.09 ± 0.06 | −0.06 ± 0.35 | ||
| 24 h | Patient 1 (n = 3 + 3) | 0.18 ± 0.16 | 0.01 ± 0.30 | Model: p = 0.003 ** PatientID: p = 0.042 * Treatment: p = 0.001 ** Two-way Interaction PatientID * Treat: p = 0.008 ** |
| Patient 2 (n = 3 + 3) | −0.24 ± 0.18 | −0.02 ± 0.12 | ||
| Patient 3 (n = 2 + 2) | 0.33 ± 0.27 | −0.34 ± 0.06 | ||
| Patient 4 (n = 2 + 2) | 0.15 ± 0 | −0.49 ± 0.21 | ||
| Patient 5 (n = 3 + 3) | 0.19 ± 0.08 | 0.06 ± 0.10 | ||
| Patient 6 (n = 3 + 3) | 0.11 ± 0.06 | 0.03 ± 0.05 | ||
| Patient 7 (n = 2 + 2) | 0.19 ± 0.38 | 0.13 ± 0.38 | ||
| 7 days | Patient 1 (n = 3 + 3) | 0.28 ± 0.15 | 0.54 ± 0.06 | Model: p = 0.038 * PatientID: p = 0.018 * Treatment: p = 0.017 * Two-way Interaction PatientID * Treat: p = 0.778 |
| Patient 2 (n = 3 + 3) | 0.06 ± 0.04 | 0.26 ± 0.31 | ||
| Patient 3 (n = 2 + 2) | 0.50 ± 0.13 | 0.54 ± 0.15 | ||
| Patient 4 (n = 2 + 2) | 0.23 ± 0.03 | 0.33 ± 0.10 | ||
| Patient 5 (n = 3 + 3) | 0.37 ± 0.07 | 0.38 ± 0.10 | ||
| Patient 6 (n = 3 + 3) | 0.32 ± 0.12 | 0.47 ± 0.12 | ||
| Patient 7 (n = 2 + 2) | 0.37 ± 0.22 | 0.49 ± 0.15 | ||
| 30 days | Patient 1 (n = 3 + 3) | 0.29 ± 0.08 | 0.48 ± 0.05 | Model: p = 0.003 ** PatientID: p = 0.04 * Treatment: p < 0.001 ** Two-way Interaction PatientID * Treat: p = 0.158 |
| Patient 2 (n = 3 + 3) | 0.17 ± 0.10 | 0.32 ± 0.16 | ||
| Patient 3 (n = 2 + 2) | 0.36 ± 0.06 | 0.40 ± 0.09 | ||
| Patient 4 (n = 2 + 2) | 0.30 ± 0.03 | 0.33 ± 0.04 | ||
| Patient 5 (n = 3 + 3) | 0.28 ± 0.10 | 0.36 ± 0.06 | ||
| Patient 6 (n = 3 + 3) | 0.30 ± 0.04 | 0.41 ± 0.12 | ||
| Patient 7 (n = 2 + 2) | 0.21 ± 0.09 | 0.45 ± 0.10 | ||
| Effect | Pillai’s Trace Value | F (df1, df2) | p | Partial Eta-Squared |
|---|---|---|---|---|
| Time | 0.972 | 227.895 (3, 20) | <0.001 ** | 0.972 |
| Time * Treatment | 0.839 | 34.803 (3, 20) | <0.001 ** | 0.839 |
| Time * PatientID | 1.504 | 3.685 (18, 66) | <0.001 ** | 0.501 |
| Time * Treatment * PatientID | 1.172 | 2.350 (18, 66) | 0.006 ** | 0.391 |
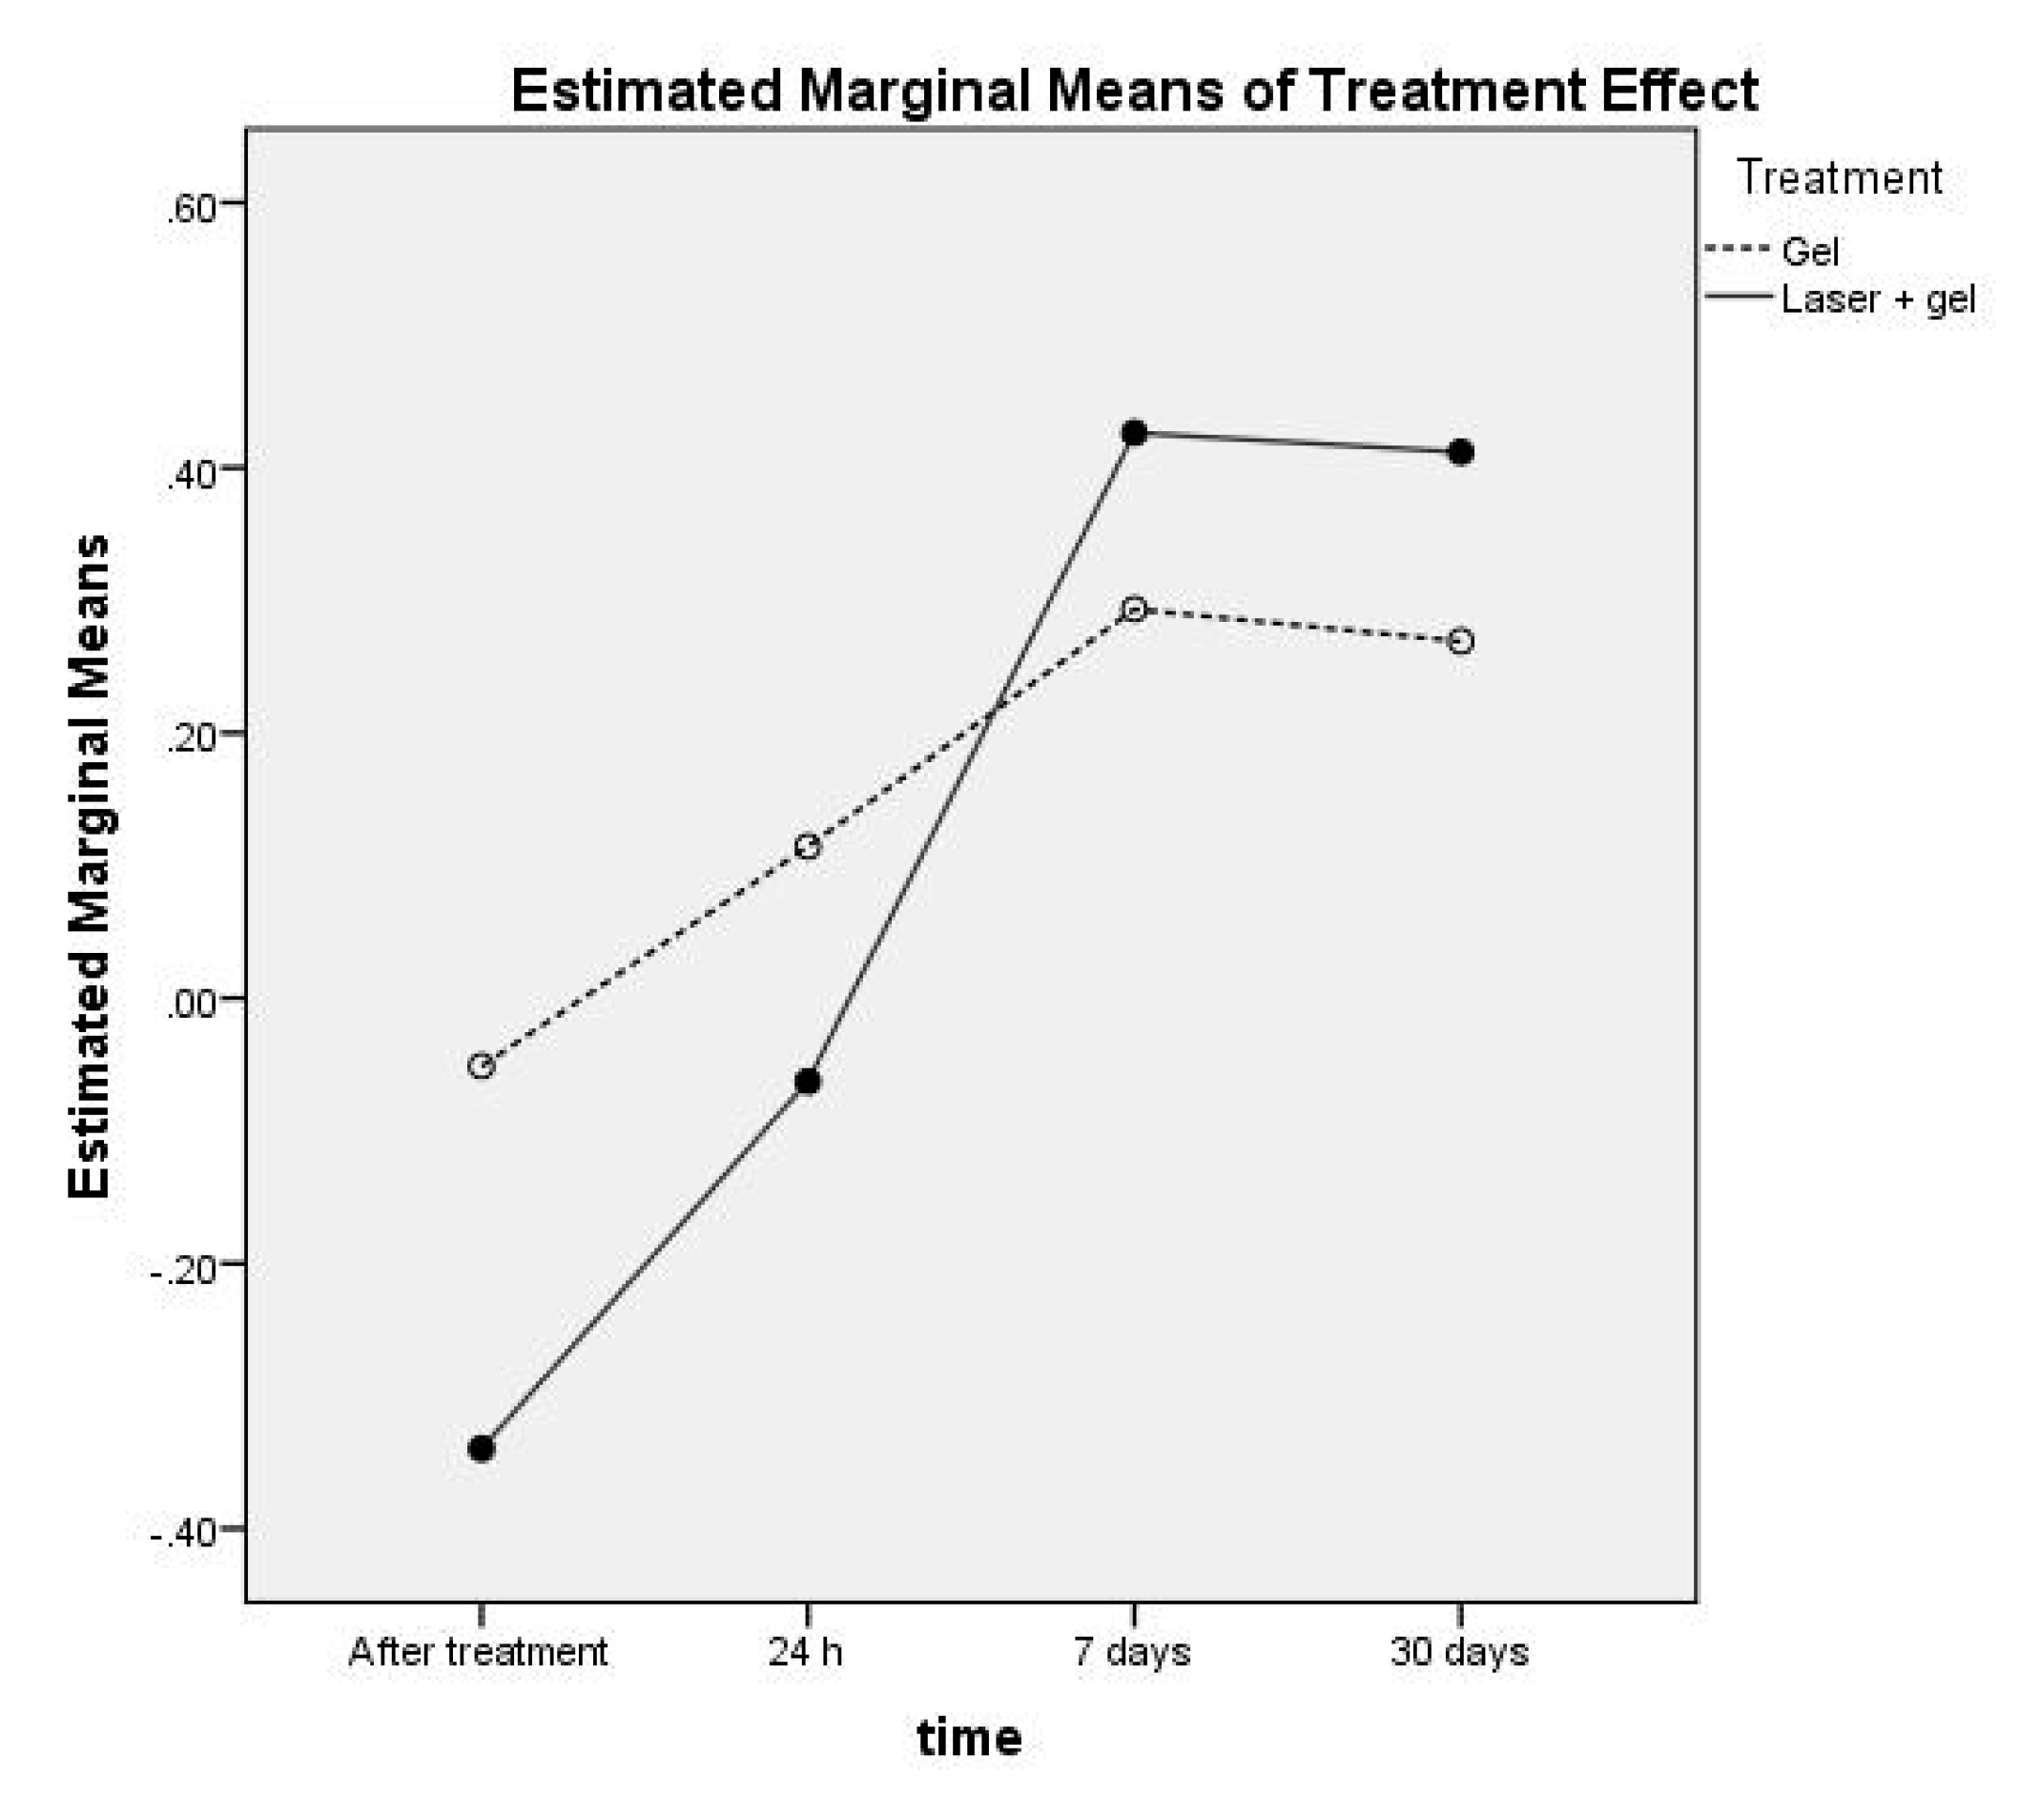
| Treatment | Time | M | SEM | 95% Confidence Interval | |
|---|---|---|---|---|---|
| Lower Bound | Upper Bound | ||||
| Gel | After treatment | −0.053 | 0.035 | −0.126 | 0.021 |
| 24 h | 0.130 | 0.042 | 0.043 | 0.217 | |
| 7 days | 0.304 | 0.035 | 0.231 | 0.376 | |
| 30 days | 0.272 | 0.022 | 0.226 | 0.318 | |
| Laser + gel | After treatment | −0.371 | 0.035 | −0.444 | −0.298 |
| 24 h | −0.087 | 0.042 | −0.174 | −0.001 | |
| 7 days | 0.430 | 0.035 | 0.358 | 0.503 | |
| 30 days | 0.409 | 0.022 | 0.363 | 0.455 | |
Publisher’s Note: MDPI stays neutral with regard to jurisdictional claims in published maps and institutional affiliations. |
© 2020 by the authors. Licensee MDPI, Basel, Switzerland. This article is an open access article distributed under the terms and conditions of the Creative Commons Attribution (CC BY) license (http://creativecommons.org/licenses/by/4.0/).
Share and Cite
Miron, M.; Lungeanu, D.; Ciora, E.; Ogodescu, E.; Todea, C. Using Laser-Doppler Flowmetry to Evaluate the Therapeutic Response in Dentin Hypersensitivity. Int. J. Environ. Res. Public Health 2020, 17, 8787. https://doi.org/10.3390/ijerph17238787
Miron M, Lungeanu D, Ciora E, Ogodescu E, Todea C. Using Laser-Doppler Flowmetry to Evaluate the Therapeutic Response in Dentin Hypersensitivity. International Journal of Environmental Research and Public Health. 2020; 17(23):8787. https://doi.org/10.3390/ijerph17238787
Chicago/Turabian StyleMiron, Mariana, Diana Lungeanu, Edmond Ciora, Emilia Ogodescu, and Carmen Todea. 2020. "Using Laser-Doppler Flowmetry to Evaluate the Therapeutic Response in Dentin Hypersensitivity" International Journal of Environmental Research and Public Health 17, no. 23: 8787. https://doi.org/10.3390/ijerph17238787